
Can causal models be evaluated? Isabelle Guyon ClopiNet / ChaLearn


Isabelle Guyon
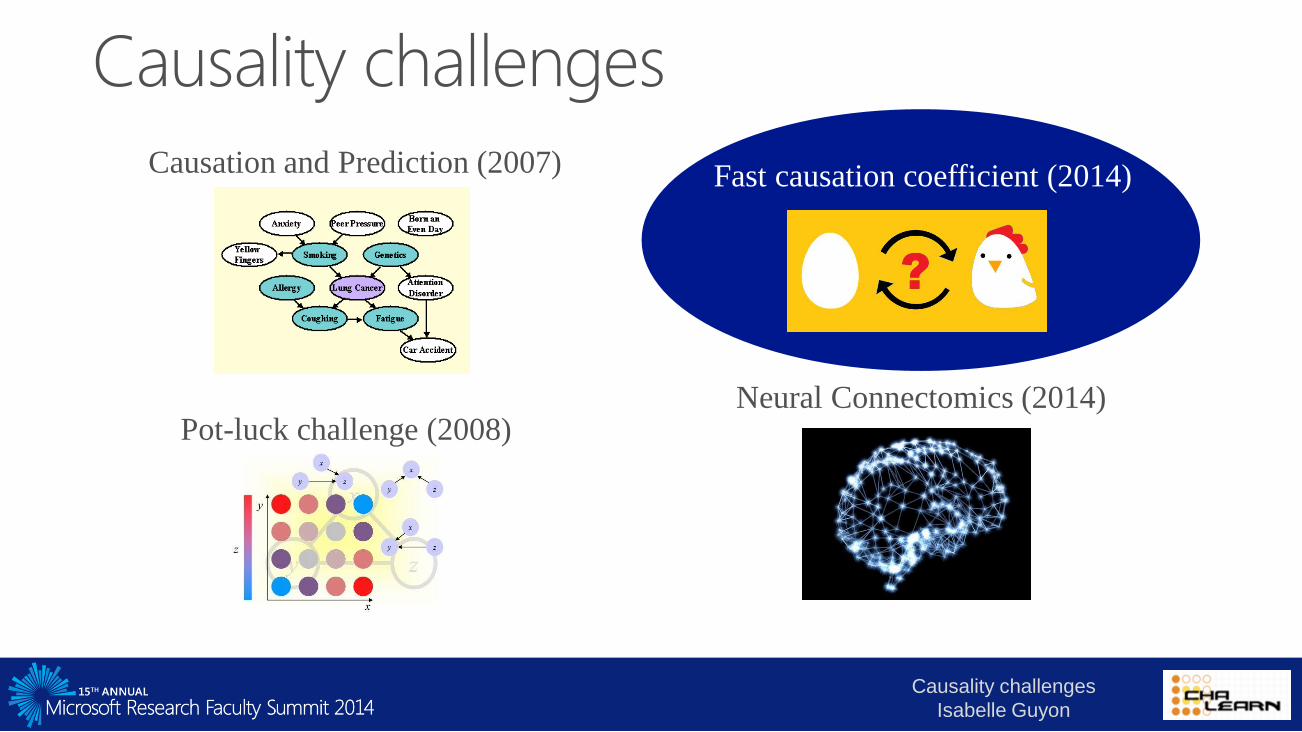
Cause-Effect Pairs (2013)Fast causation coefficient (2014)
Neural Connectomics (2014)
Causation and Prediction (2007)
Pot-luck challenge (2008)
Causality challenges
Isabelle Guyon

Initial impulse: Joris Mooij, Dominik Janzing, and Bernhard Schölkopf, from the Max Planck.
Examples of algorithms and data: Povilas Daniušis, Arthur Gretton, Patrik O. Hoyer, Dominik Janzing, Antti
Kerminen, Joris Mooij, Jonas Peters, Bernhard Schölkopf, Shohei Shimizu, Oliver Stegle, and Kun Zhang, Jakob
Zscheischler.
Datasets and result analysis: Isabelle Guyon + Mehreen Saeed + {Mikael Henaff, Sisi Ma, and Alexander
Statnikov}, from NYU.
Website and sample code: Isabelle Guyon +
Phase 1: Ben Hamner (Kaggle) https://www.kaggle.com/c/cause-effect-pairs
Phase 2: Ivan Judson, Christophe Poulain, Evelyne Viegas, Michael Zyskowski
https://www.codalab.org/competitions/1381
Review, testing: Marc Boullé, Hugo Jair Escalante, Frederick Eberhardt, Seth Flaxman, Patrik Hoyer, Dominik
Janzing, Richard Kennaway, Vincent Lemaire, Joris Mooij, Jonas Peters, Florin , Peter Spirtes, Ioannis
Tsamardinos, Jianxin Yin, Kun Zhang.

Phase 1:
1st place: DiogoMoitinho de Almeida
2nd place : José AdriánRodríguez Fonollosa
3rd place : SpyridonSamothrakis
Phase 2:
José AdriánRodríguez Fonollosa
David Lopez-Paz

actions
…your health?
…climate
changes?… the economy?
What affects…

Causality challenges
Isabelle Guyon
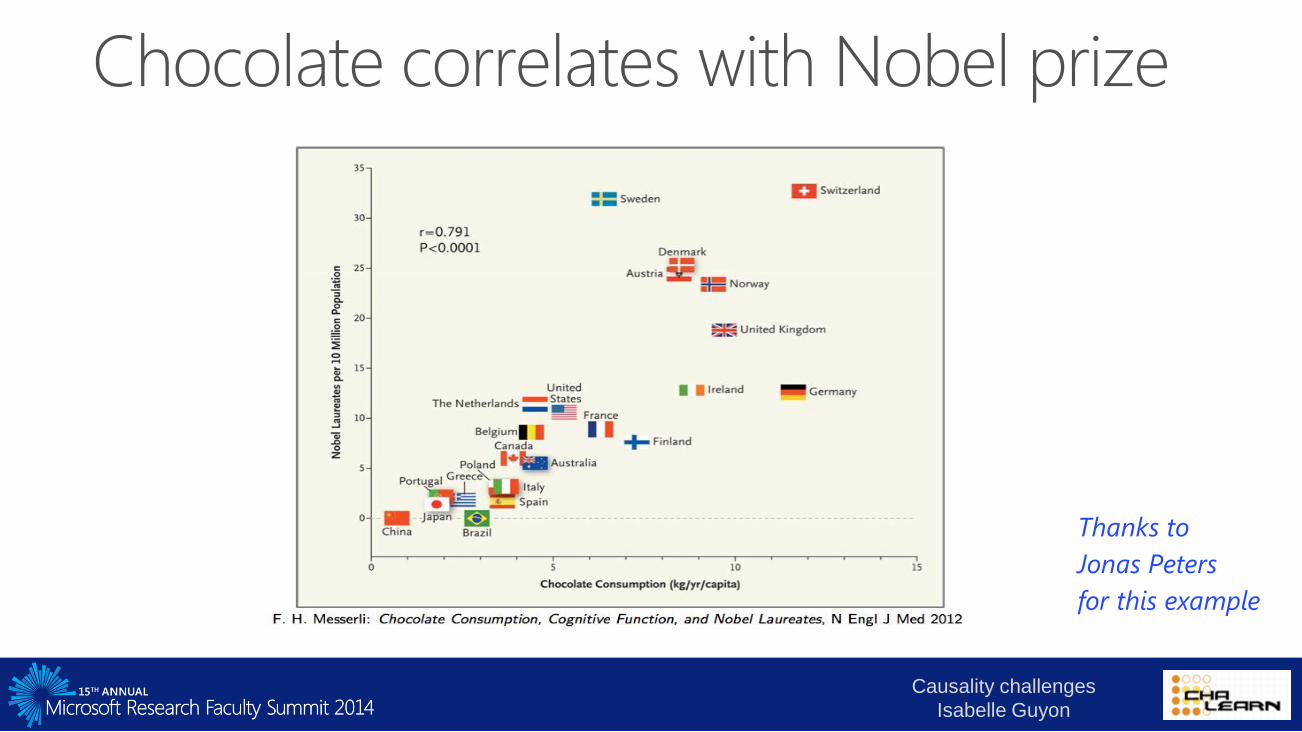
Thanks to
Jonas Peters
for this example

Causality challenges
Isabelle Guyon
Thanks to
Jonas Peters
for this example

Causality challenges
Isabelle Guyon
Thanks to
Jonas Peters
for this example


Random i.i.d. samples of A and BA -> B
B = f(A, Z)
A | B
A <- C -> B
A = f(C, Z1)
B = f(C, Z2)
B -> A
A = f(B, Z)
A -> B
B = f(A, Z)
A | B
A <- C -> B
A = f(C, Z1)
B = f(C, Z2)
B -> A
A = f(B, Z)

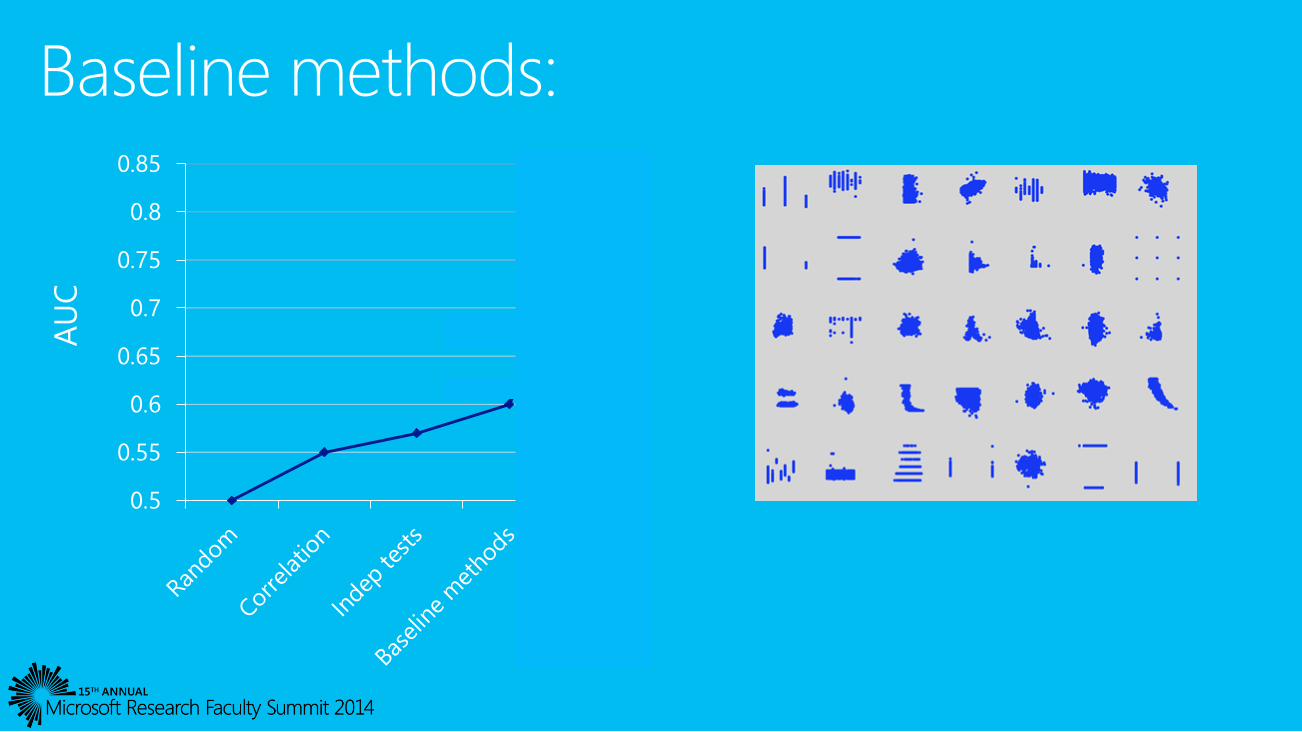
0.5
0.55
0.6
0.65
0.7
0.75
0.8
0.85
267


A
B
Z
A -> B
B
A
Z
A <- B
A B
Z
ZBZA
A <- Z -> B
A B A | B
Demographics:
Sex -> Height
Age -> Wages
Native country -> Education
Latitude -> Infant mortality
Ecology:
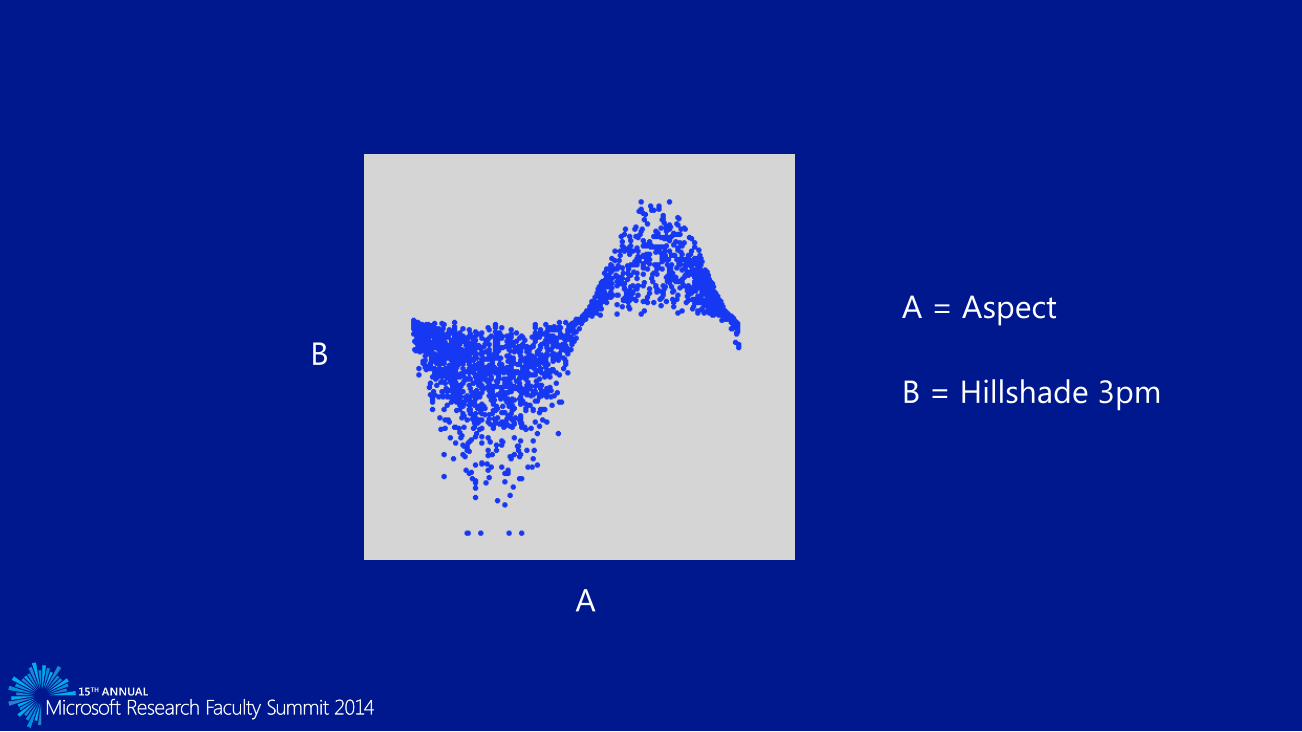
City elevation -> Temperature
Water level -> Algal frequency
Elevation -> Vegetation type
Distance to hydrology -> Fire
Econometrics:
Mileage -> Car resell price
Number of rooms -> House price
Trade price last day -> Trade price
Medicine:
Cancer volume -> Recurrence
Metastasis -> Prognosis
Age -> Blood pressure
Genomics (mRNA level):
transcription factor -> protein induced
Engineering:
Car model year -> Horsepower
Number of cylinders -> MPG
Cache memory -> Compute power
Roof area -> Heating load
Cement used -> Compressive strength
20% 80%

A B A | B

A B
Z
ZBZA
A <- Z -> B

B
A
Z
A <- B
A
B
Z
A -> B
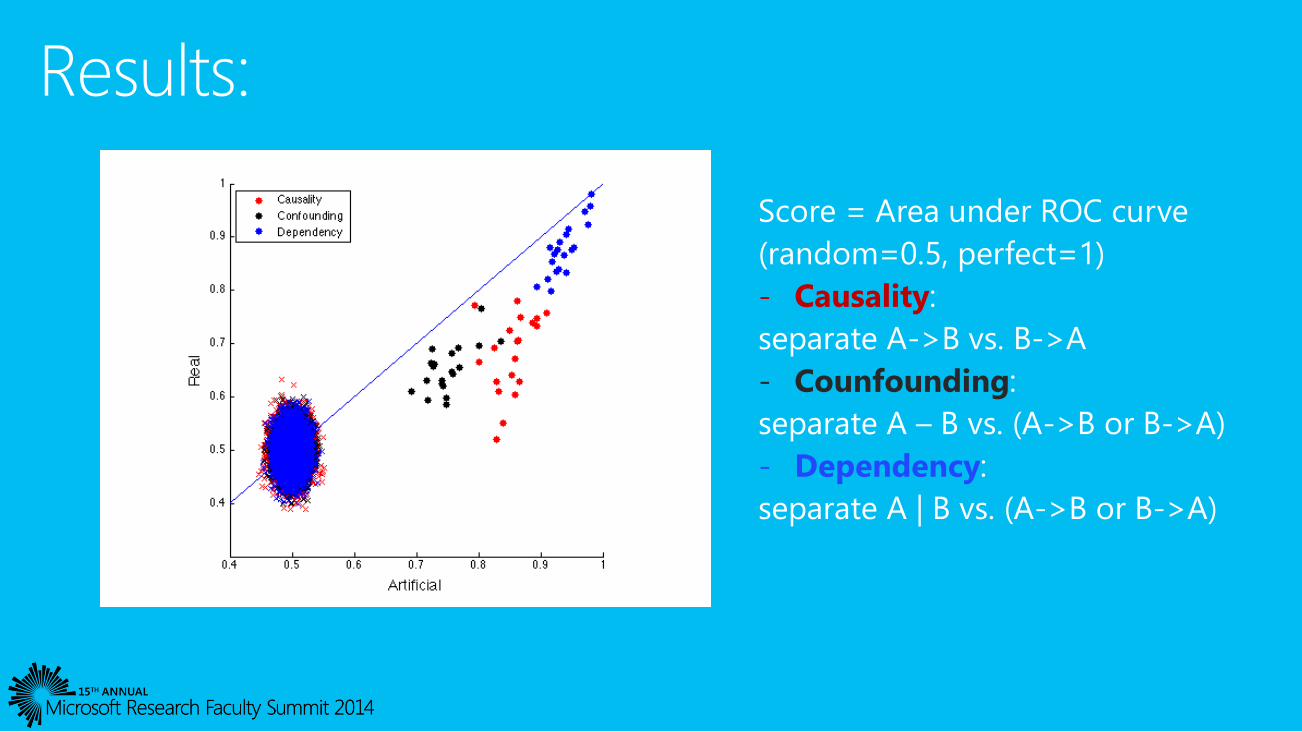
- Causality
- Counfounding
- Dependency

Denis Boigelot, Université libre de Bruxelles, Belgium, Wikipedia
Causality challenges
Isabelle Guyon

Causality challenges
Isabelle Guyon

Causality challenges
Isabelle Guyon


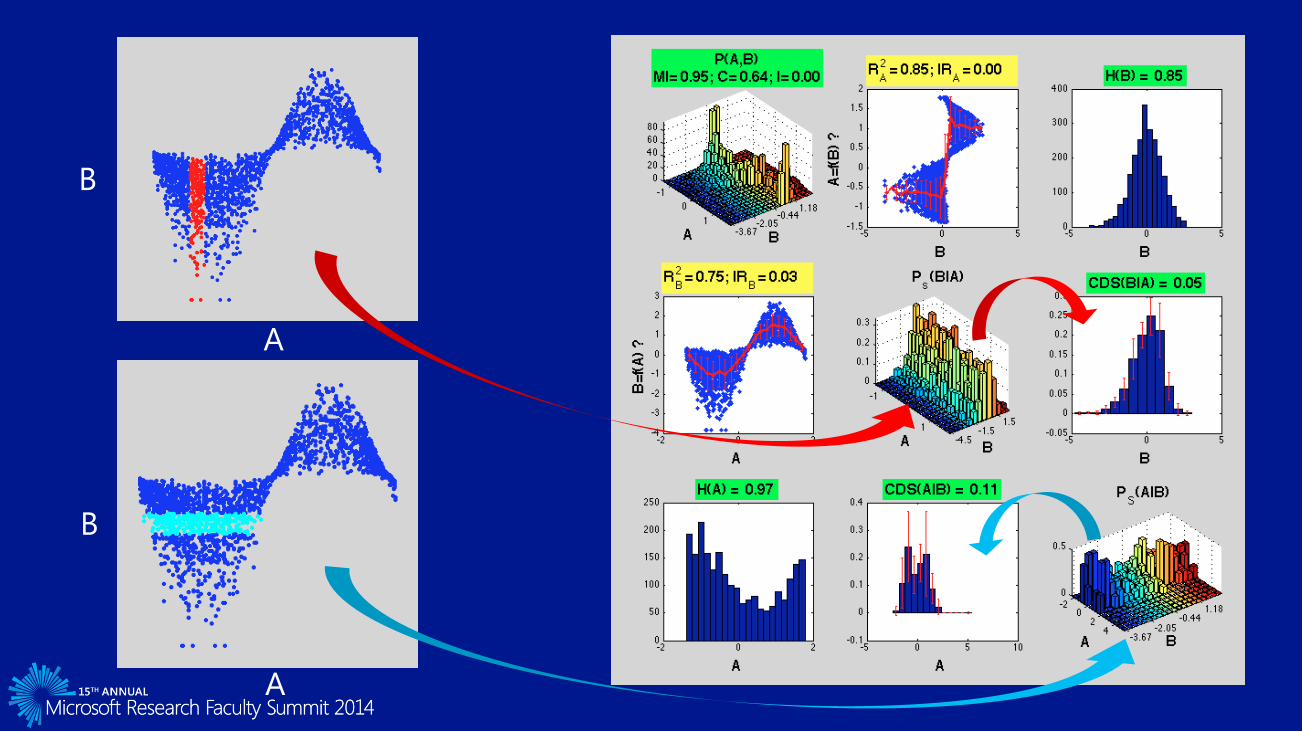
Correlation:
Mutual information:
HSIC:
Residual:
res(B)2=(1/n)i (f(Ai) –Bi)2
Coefficient of determination:
RB2 = 1 – res(B)2 / B
2
Independence(Input, Residual):
IRB=I(A,res(B))


A -> B

B -> A

A = 2 C+ noiseA
B = 2 C+ noiseB
A <- C -> B


C(A,B) = cov(A,B)/(AB)
MI(A,B) = H(A) + H(B) - H(A,B)
= KL[p(A,B) || p(A)p(B)]
I(A,B) = pval( ||CAB||HS2 )
res(B)2=(1/n)i (f(Ai) –Bi)2
RB2 = 1 – res(B)2 / B
2
IRB=I(A,res(B))
0.5
0.55
0.6
0.65
0.7
0.75
0.8
0.85
267

0.5
0.55
0.6
0.65
0.7
0.75
0.8
0.85
267
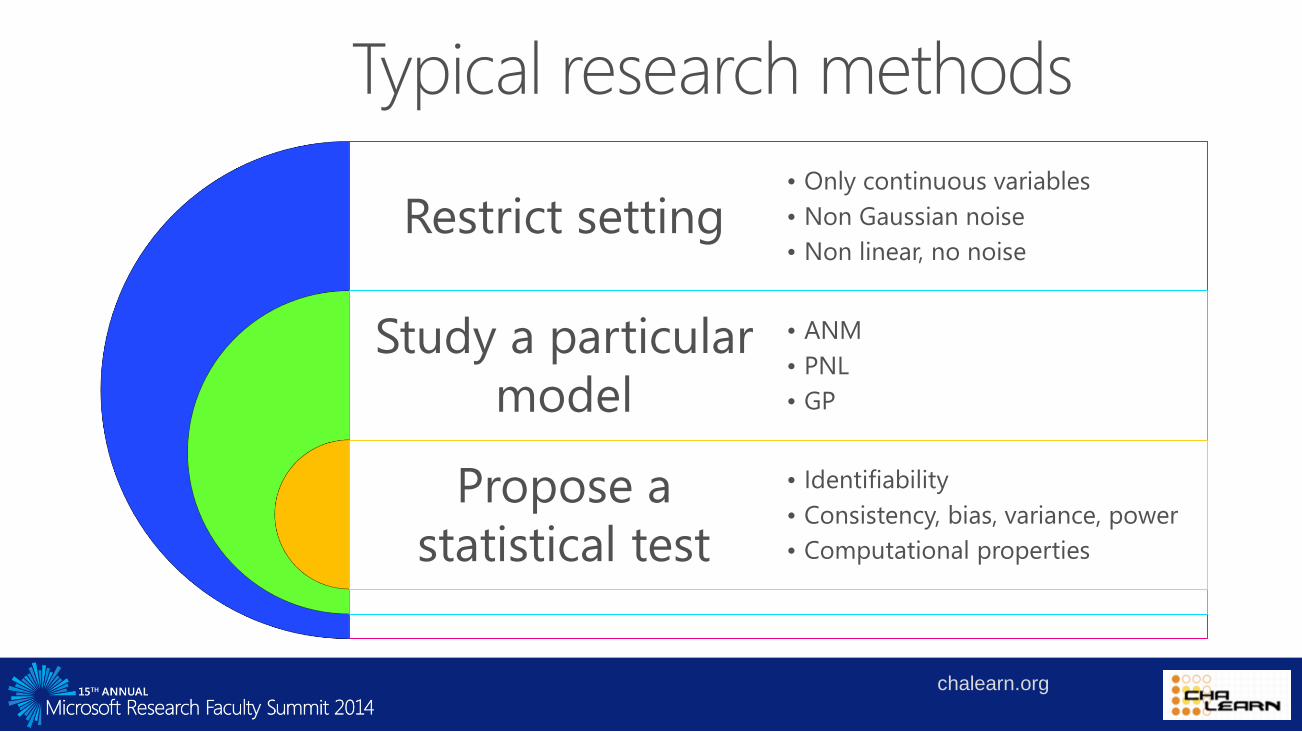
Restrict setting
Study a particular
model
Propose a
statistical test
• Only continuous variables
• Non Gaussian noise
• Non linear, no noise
• ANM
• PNL
• GP
• Identifiability
• Consistency, bias, variance, power
• Computational properties
chalearn.org

Preprocess data
Compute a lot of features
Use non-linear classifier
(ensemble of decision
trees).
• Standardize
• Discretize
• Re-label categorical variables
• ProtoML: 20,000 (324 after
selection)
• Jarfo: 43 features
• FirfID: 30 features
• RF
• GTB
chalearn.org
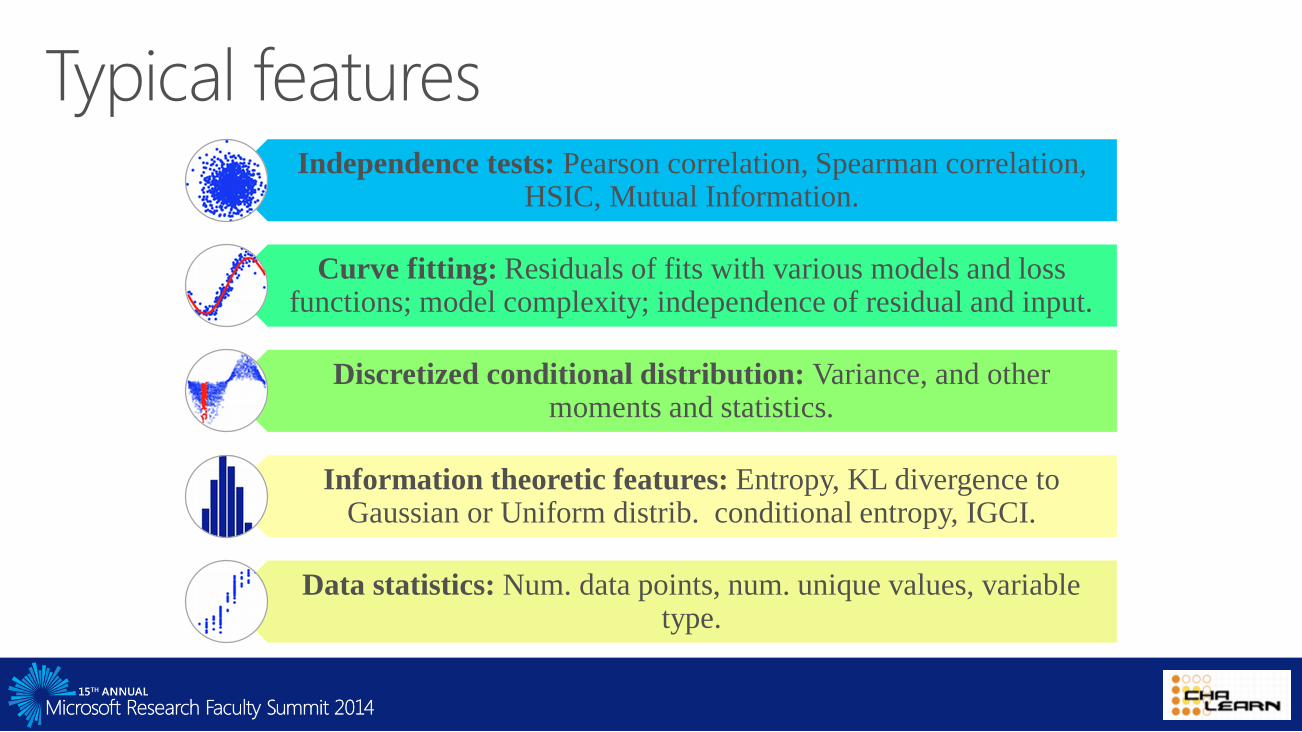
Independence tests: Pearson correlation, Spearman correlation, HSIC, Mutual Information.
Curve fitting: Residuals of fits with various models and loss functions; model complexity; independence of residual and input.
Discretized conditional distribution: Variance, and other moments and statistics.
Information theoretic features: Entropy, KL divergence to Gaussian or Uniform distrib. conditional entropy, IGCI.
Data statistics: Num. data points, num. unique values, variable type.

CDS(A|B) > CDS(B|A)
yesno
H(A) > H(B)
yes
yes
yes
yes
Max(H(A), H(B))>2.5
no
no
Max(H(A), H(B))>2.5
H(A) > H(B)
no
no
A->B
A->B
B->A
B->A
B->A A->B

A
B
chalearn.org

C(A,B) = cov(A,B)/(AB)
MI(A,B) = H(A) + H(B) - H(A,B)
= KL[p(A,B) || p(A)p(B)]
I(A,B) = pval( ||CAB||HS2 )
res(B)2=(1/n)i (f(Ai) –Bi)2
RB2 = 1 – res(B)2 / B
2
IRB=I(A,res(B))

Challenges can be a powerful tool to advance the state of the art, but…
most data scientists prefer “hacking” than producing papers.
We are preparing a paper in which we will include:
- Analysis the features.
- Theoretical results.
- Test on other data.
Our next challenges will address
- causality in time series and
- entire network reconstruction.
0.5
0.55
0.6
0.65
0.7
0.75
0.8
0.85
267

Google group: causalitychallenge

Microsoft Privacy Policy statement applies to all information collected. Read at research.microsoft.com
Save the planet and return your name badge before you
leave (on Tuesday)


