1IWR 2010 Kampfrichtergrundausbildung Allgemeines Lauf Sprung Wurf/Stoß Mehrkampf IWR 2010.

Dan Lindley and Ryan Schildkraut1
“Is War Rational?The Extent of Miscalculation and Misperception
as Causes of War”
“By every rational standard, North Korea should still be deterred. In practice, however, few wars are the result of rational calculations, managed crises, and highly intellectual escalation ladders.” (Cordesman,
2002)
“War seems to many to be an irrational act of passion....Yet for all the emotion of the battlefield, the premeditation of war is a rational process consisting of careful and deliberate calculations.” (Bueno de
Mesquita, 1981, 19)
Who is right?
ABSTRACT
Is war a rational, well-calculated pursuit of states, or is war more often caused by miscalculation and misperception? Assumptions about the extent of rationality underlie policy debates on subjects ranging from deterrence to missile defense. The rationality assumption also divides theorists and theories on the causes of war into two camps. For example, many realists and expected utility theorists fall into the rationalist camp, while political psychologists and students of bureaucratic politics fall into the miscalculation and misperception camp. Despite this schism, few studies empirically test the overall extent of rationality in decisions for war. Using our “Is War Rational?” database, we find that prior to 1900, war initiators won over seventy percent of the time. Since 1945, only about one-third of initiators win. Assuming that states initiate wars planning to win, the utility of war has declined dramatically, and miscalculation and misperception have come to dominate decisions for war. Deterrence is getting harder.
1 1 Contact information: Dan Lindley, Assistant Professor, Department of Political Science, 448 Decio Hall, University of Notre Dame, Notre Dame, IN 46556. Phone: 574-631-3226; Fax: 574-631-8209; Email: [email protected]; Webpage: http://www.nd.edu/~dlindley/; Ryan Schildkraut, student, University of Minnesota Law School, Walter F. Mondale Hall, 229 19th Avenue South, Minneapolis, MN 55455, 612-702-4907, [email protected]. Contact Dan Lindley for correspondence regarding this article. Comments welcome. All data and a technical appendix are available on request or via the dlindley webpage above. Key methodological points are summarized in the text, but for the purpose of journal review, the technical appendix is included. The appendix is not necessary for understanding the article. Rev. 2.0, 2/9/2005, word count: 13,681.
Our thanks to David Campbell, Emma Cohen de Lara, Katherine Jeter, Lauren Kimaid, Garrick Merlo, Adam Shanko, Mariana Sousa, James Thompson, Stephen Van Evera, Paul Vasquez, Jennifer Wiemer as well as to numerous panel discussants and other commenters at conferences. The University of Notre Dame Laboratory for Social Research and the Office of Faculty Research also supported this project.

The utility of rationalist approaches to the causes of war is decreasing. Causes of miscalculation and misperception deserve more study.
Introduction
Is war the rational and well-calculated pursuit of states, or are decisions for war more
often dominated by miscalculation and misperception? This is an important question because
assumptions about the extent of rationality in decisions for war underlie policy debates on a
range of subjects from deterrence and missile defense to peacekeeping. Arguments about
rationality also underlie academic debates about the general causes of war and the methodologies
to study them, as well as historical debates about the causes of specific wars.
If one assumes that states start wars intending to win them, then losses by war initiators
will tend to indicate that the decision for war was dominated by miscalculation and
misperception. This assumption means that the extent of miscalculation and misperception can
be measured by looking at the win and loss rates of initiators.
Using the Correlates of War (COW), Militarized Interstate Dispute (MID), and National
Material Capabilities (NMC) databases, and we find that initiators won 55% of the seventy-nine
large interstate wars between 1815 and 1991. The utility of war has declined markedly over
time. In the forty-seven wars since 1900, the success rate declined to 43%. Since 1945,
initiators won 33% of twenty-three wars. Despite declining win rates, states initiate wars at an
increasing to steady (since 1920) rate over time. States are not learning that war increasingly
does not pay.
Declining win rates and steady initiation rates provide the main basis for our core
argument: miscalculation and misperception are increasing. This argument is bolstered by other
1

findings showing that, for example, relative power is often not a good predictor of outcomes.
These findings have impacts across a range of policy and academic debates. If
miscalculation and misperception is increasing, then deterrence is getting harder. The utility of
rationalist approaches to the causes of war is decreasing. Causes of miscalculation and
misperception deserve more study.
We begin by reviewing some of the policy and scholarly debates that hinge on
assumptions about rationality in decisions for war. Second, we situate ourselves in the large-N
literature on the causes of war, noting that the study of miscalculation and misperception is
neglected in this literature, as is the study of war outcomes more generally. Third, we turn to
methodological issues. We explain and justify the assumption that initiators intend to win their
wars, define our terms, examine the major problems posed by the available data, and explain the
decisions rules we adopted to respond to these problems. In addition, there is a technical
appendix available online at: <<author website>>, where readers will also find the master data
and analysis spreadsheets. Fourth, we present our findings, using descriptive statistics to
demonstrate the declining win rate for war initiators, to see if power or allies help determine war
outcomes, and to look at trends in the rate of war initiation. Finally, we discuss the implications
of our findings for policy makers and scholars.
Debates that Hinge on Assumptions about Rationality
Assumptions about rationality underlie a number of policy and scholarly debates. For
example, those who argue that deterrence works well assume that decisions to initiate war are
rational and deliberate. If states are generally rational, then policy makers can effectively use
2

arms, alliances, and deployments to increase the costs of war and bolster deterrence. On the
other hand, arguments for greater transparency, for arms control, and against militarism and
hypernationalism often assume that war is rooted in miscalculation and misperception. In this
view, deterrence is harder because opacity, arms races and spirals, and malignant sources of
misperception may cause unnecessary or inadvertent wars. Supporters of U.S. missile defenses
often argue that ‘rogue’ states are irrational and not deterrable. Opponents of missile defense
counter that ‘states of concern’ are deterrable. Light peacekeeping assumes that combatants do
not really want to fight, and that peace can be kept once miscalculations and misperceptions are
sorted out. Yet if the combatants have good reasons for fighting, peacekeeping must be heavy or
avoided altogether (Betts 1994). Successful prescriptions for reducing the likelihood of war
depend on accurate diagnoses of the causes of war. These diagnoses in turn often rely on
assumptions about the prevalence of rationality and the quality of deliberation in the lead up to
war.
Differing assumptions about rationality constitute a large but usually implicit debate in
the causes of war literature. Most offensive and neo-realists, rational choice analysts, and
materialists argue that war tends to be rational and deliberate. In contrast, some defensive
realists, students of bureaucratic and organizational politics, and political psychologists argue
that miscalculation and misperception tend to cause war. Using a broad brush, Table 1 shows
how most general theories about the causes of war can be sorted into two camps according the
assumptions they hold about the rationality of war.1
1 Cites for some of these theories or schools are in the bibliography, but there is not room for full cites
for every entry. See Levy 1989 for a comprehensive overview of causes of war.3

The first camp contains rationalists who contend that states choose war for gains in
security, wealth,
and power, as
they maximize
utility in the face
of systemic
constraints and
opportunities.
Here we find
assumptions and
arguments about why states start wars for strategic reasons and with reasonably rational
decision-making processes. The second camp contends that states are led to war because of
internal pressures, misperceptions, spirals, and so forth. Here we find assumptions and
arguments about states starting wars for non-strategic motivations and/or with distorted strategic
calculations.
Despite many strong arguments on both sides of the schism, there is little sustained and
explicit intellectual combat between the camps and very few scholars have investigated the
overall extent of rationality in decisions for war. A rare example of protracted debate is the
rational deterrence debate of the late 1980s and early 1990s (Achen and Snidal 1989; Downs
1989; George and Smoke 1989; Huth and Russett 1990; Jervis 1989b; Lebow and Stein 1989;
Zagare 1990, among others). There is also work that contrasts rational choice and psychological
Table 1: Parsing Causes of War by the Rationality Assumption
Theories and Schools Emphasizing Rational Causes of War
Theories and Schools Emphasizing Miscalculation and Misperception
Offensive Realism Organizational and Bureaucratic Politics
Neo-realism MilitarismLateral Pressure Theory HypernationalismExpected Utility Theory “Cult of the Offensive”
Rational Choice Explanations Psychology and Decision-making Models
Power Transitions, Preventive, and Pre-emptive Wars
Domestic Politics (including Scapegoating and Logrolling)
Resource Wars Defensive RealismImperialism/Mercantilism Spiral ModelRational Deterrence Optimistic Miscalculation
Ancient Hatreds Weak Deterrence
4

models, with some consensus that the two approaches are complimentary (Geva and Mintz 1997;
Levy 1997; McDermott and Kugler 2000; Quattrone and Tversky 1988).
Just as general causes of war can be parsed into the table above, debates about the causes
of specific wars often turn on arguments about rationality versus miscalculation and
misperception. The best example is the literature on World War I. Copeland and Fischer blame
deliberate German policy (2000; 1967). In contrast, Snyder and Van Evera argue that WWI was
caused by a web of misperceptions which they file under the rubric “cult of the offensive”
(1984; 1985, 1999). Levy runs up the middle, arguing for a fairly subtle form of miscalculation:
many of the Great Powers wanted a limited war prior to WWI, but that the huge scale of WWI
was not what they intended or predicted (1991). In the debate over the Japanese decision to
attack Pearl Harbor, Ienaga (1978) contends that Japan had fallen into the grip of militaristic
hypernationalism while Sagan (1988) holds that Japan rationally weighed its choices and chose
war. In assessing Saddam Hussein’s decisions to go to war in 1990/91, Pollack argues that
Saddam, although a risk-taker, was not irrational or suicidal and had successfully been deterred
in the past (2002, 248). On the other hand, Baram states that Saddam and his government had
been irrational, prone to take unreasonable risks, and made many colossal errors in judgment
(1992). Stein believes that Saddam stayed in Kuwait because of an unfounded belief in an
American conspiracy to destroy him (1993).
Even critiques of specific books reflect the "Is War Rational?" debate. Perhaps the core
of Betts’ 1999 review of Van Evera’s Causes of War (1999) is Betts’ view that Van Evera is
wrong to argue that war is most often explained by miscalculation and misperception. Instead,
Betts contends that states choose war because there are political and economic stakes that are
5

worth war for the combatants. It was this disagreement between Betts and Van Evera that
motivated the "Is War Rational?" project, and led to the question: what is the extent of
miscalculation and misperception in decisions for war?
THE LARGE-N LITERATURE, WAR OUTCOMES, AND MISCALCULATION AND MISPERCEPTION
Few scholars in any methodological tradition have attempted to test the overall extent of
miscalculation and misperception in decisions for war. The main reason for this gap is that
scholars who emphasize miscalculation and misperception tend to do case studies, while large-N
scholars tend not to assess miscalculation and misperception. For example, in Geller and
Singer’s review of the findings of 500+ large-N analyses on the causes of war, they claimed that
miscalculation and misperception are important, but they then cast aside the issue by arguing that
the subject can best be examined with case studies (1998, 44; see also Vasquez 2000 and Geller
and Singer 1998, 192). Case studies are critical for understanding the mechanisms and processes
leading up to specific wars, yet large-N analysis is often more persuasive for discerning overall
patterns about war (Collier, Brady, and Seawright 2004, 253).
As noted by Stam in the beginning of his book on war outcomes, the large-N community
has also largely neglected this issue (1996, 1). Most large-N studies focus instead on factors
which correlate with war outbreak. Yet the study of outcomes is crucial for two reasons. First,
success in war is the best way to judge the utility of war. The more initiators win, the higher the
expected utility of war.
6

The second reason to study war outcomes is to learn more about the predictability of
these outcomes. The extent to which war is a calculable bet or a large role of the dice speaks
directly to the utility and rationality of engaging in war. For example, relative power should be
one of the most powerful predictors of war outcomes. As the NMC documentation makes clear,
relative power is not easy to measure, but it is easier than strategy, morale, domestic politics, or
other more elusive determinants of outcomes (2004). If relative power is a good predictor of
outcomes, this should reduce miscalculation and misperception and help deterrence. On the
other hand, as the ability of relative power to predict war outcomes declines, war outcomes must
then increasingly depend on more elusive variables. This in turn increases the odds of
miscalculation and misperception. In sum, aggregate win/loss ratios provide a first cut at
judging the utility of war. Predictability of outcomes then tells us more about the utility of war
as a policy tool.
The major goal of this study is to use large-N analysis to assess the extent of
miscalculation and misperception. We cannot assess individual instances or aggregate amounts
of cognitive bias or bureaucratic politics, or any of the individual groups of causes of war in the
left (rational) or right (miscalculation and misperception) columns in Table 1, above. However,
we do claim that war increasingly results from miscalculation and misperception.
Several scholars have touched on or explored the substance, arguments, and methods of
this article. Stam (1996) and Goemans (2000) look at war outcomes as a function of domestic
politics, while Reiter and Stam (2002) argue that democracies are better at picking winnable
wars, thus linking regime type to outcomes. Fortna (2004) notes that increasing numbers of
wars are ending in ties, and is developing and testing hypotheses to explain why.
7

Others have looked at how initiator success rates change over time. In particular, Wang
and Ray (1994) use a dataset of 105 great power wars going back to 1495 to discuss the
rationality of decisions to go to war. They find that “initiators have been ‘significantly’ more
likely to win than their targets…in the 19th and 20th centuries” with win rates of 56%, 52%, 53%,
74% and 67% in the five centuries from 1495 to 1991 (150, 145). Instead of using these
findings to establish a trend and to argue that the rationality of war has increased (roughly) over
time, they conclude by saying that the variation in win rates offers support to both the rationalist
and miscalculation and misperception camps. In assessing all wars instead of great power wars,
we find the win rate declining over time.
We build on this useful study in several ways. We gain leverage by looking at all major
interstate wars, not just great power wars. By looking at 79 wars over the last 200 years, instead
of 108 wars over 500 years, we reduce the N somewhat, but increase temporal commensurability
between the wars. We examine the influence of relative power and joiners in more depth, and
we keep our focus on the issue of the rationality of war.
8

Methods: The Key Assumption, Definitions, Data, and Coding Rules
THE KEY ASSUMPTION
To evaluate the “Is War Rational?” question, we begin by assuming that states start wars
intending to win. When initiators win, we assume that states have correctly calculated, and
made a rational choice. A loss indicates a miscalculation and/or misperception of some sort.
Together, we call this set of assumptions and arguments our key assumption.
Our justification for this assumption starts with Clausewitz’s definition of war. War is a
strategic interaction rooted in hostile intent, and chosen for political/policy goals which can be
met by compelling the enemy through force (Howard and Paret, 1976). The goals of war are to
increase a state’s power, security, and/or wealth, and these goals are things that can be won or
extracted by successful compellence. States that use war to pursue these goals behave according
to what we term Clausewitzian rationality.
We are making assumptions about state preferences and the process of pursuing those
preferences. For preferences, we assume states are using war to pursue goals of power, security,
and wealth. For process, we assume a rational decision making process exists if a state achieves
its goals. In a rational process, there is at most a modest amount of miscalculation and
misperception, initiators make reasonably robust calculations, and they choose war when it is
likely to pay. Under these conditions, initiators will win their wars most of the time. The higher
the win rate, the more rational the decision making processes. Information is more complete,
and calculations are better.
9

We assume that miscalculation and misperception dominate the process if a state fails to
achieve its goals. By definition and assumption, it follows that if a state chooses war for
Clausewitzian goals and loses, it has miscalculated and misperceived. The lower the initiator
win rate, the higher the overall extent of miscalculation and misperception in decisions for war.
We view the decision making process in much the same way as rational choice
practitioners. States gather information, assess and rank their options by calculating the relative
utility of these options, and then pick the best option to maximize utility. However, we then
assume preferences for initiators. The assumption that initiators want to win does not lack
deductive, scholarly, and common sense support, but it is an assumption. It is a useful
assumption because with it, we believe we can judge the overall quality of the decision making
process over seventy-nine wars.
There are two main arguments against the key assumption. First, our key assumption
may hide anomalies such as ‘lucky’ outcomes in some cases. Wars can be won by
miscalculators and lost by wise calculators. Second, it neglects the possibility that initiating
states could rationally calculate that loss in war would still achieve goals that would justify the
war. It may be that winning is not everything. In these cases, loss is not a result of
miscalculation and misperception. We address these arguments in turn.
By strict definition, luck means outcomes are random. In practice, luck means that there
may be wars whose outcomes hinged on minor factors, or factors outside the control or
reasonable ability to predict of the warring states. Luck may explain some war outcomes, and
we readily acknowledge that our key assumption likely does not apply to all cases. But there is
no reason to believe that luck would generally favor initiators over defenders or vice versa. It
10

would be especially illogical to blame a decline in initiator luck for the decline in initiator in win
rates over time, especially when the change is so dramatic and unambiguous. As social
scientists, we would much rather argue that miscalculation and misperception have increased
over time than that war initiators are increasingly unlucky. If something is systematically
reducing the odds in war that something is not luck.
The second critique is that initiators may still profit from loss, and that initiators may
rationally start wars without intending to win. This point likely accounts for some wars as well.
For example, many argue that Egypt’s Anwar Sadat launched the 1973 Yom Kippur War
knowing that he could not win militarily. Regardless of the war’s anticipated limited or losing
military outcome, Sadat hoped to regain territories (and pride) lost in 1967 by using the war
politically to generate enough international pressure to successfully bargain for the territories
(Jordan 1997; Herzog 1975, 27, 37; Rabinovich 2004, 26; Schiff 1974 6-7).
A broader version of this critique is that the definition of Clausewitzian rationality is too
limiting. Instead of starting wars to increase a state’s security or wealth, leaders may start wars
for a number of reasons that are rational for other purposes. For example, leaders may start
scapegoat wars to focus the attention of domestic constituents on external issues and rally the
nation around the flag. In scapegoat wars, keeping the leader in power may be more important
than victory. Some wars may be explained by the machinations of a military-industrial complex
that needs a fight from time to time to further its organizational goals. Perhaps leaders or
societies periodically need wars to prove their self-worth for reasons lying in personal
insecurities or in pathological group psychology such as social-Darwinism. A state may prefer
to fight and lose than to back down for reasons of pride or credibility.
11

This second critique might be made most directly by rational choice practitioners. “The
rationality assumption tells us nothing about how actors form their preferences, but rather shows
how actors behave, given their preferences,” notes Bueno de Mesquita (1981, 31). Similarly,
Morrow writes: “rationality tell us nothing about an actor’s preferences over outcomes – only
about its choices given those preferences and the situation that confronts it.” 1994, 21; see also
Lake and Powell 1999).
Thus, there are many possible reasons why even a losing war may serve some goal of
the initiator. Yet would not victory usually do more than loss to further domestic political,
organizational, psychological, or credibility goals? Would not a leader’s domestic position be
more bolstered from victory than loss? In the 1973 War example, Sadat would have preferred to
win back the territories from Israel through victory, not gambit, had it been possible. Even if
initiators are not pursuing power, security, and wealth for their state (which Sadat was), victory
is probably better for their goals than loss. Deductively, the safest argument remains that states
and leaders generally start wars hoping to win, and that loss therefore represents miscalculation
and misperception.
In addition to these arguments that hopefully rebut some critiques of our assumptions, we
draw support from a number of rationalist authors and schools which implicitly or explicitly
agree that states start wars planning to win them. Core assumptions of realism are that states are
concerned about relative power because they live in a self-help, zero-sum world. States have
goals ranging from power preservation and survival to power maximization. Given those
assumptions and goals, it is impossible to infer that states will generally prefer losing the wars
they start. Mearsheimer posits that the “trick” for power maximizing great powers is to figure
12

out when to initiate successful wars (Waltz 1973; Posen 1984; Mearsheimer 2001, 39-40).
Allison and Zelikow’s Rational Actor Model assumes that states pursue the strategic goals of
“national security and national interests” in the face of external threats and opportunities (Allison
and Zelikow 1999, 24). Losing wars can not be a frequent goal in this model either. Allison and
Zelikow argue at length that the Rational Actor Model underlies scholarship from classical and
structural realism to international institutionalism and expected utility approaches (1999, 26-48).
Schelling begins his rationalist approach to the strategy of conflict by “working with an
image of participants who try to ‘win’” (1960, 4). Morrow writes that “War is seen as a struggle
to impose military reverses upon the other side” (1985, 476). In Bueno de Mesquita’s The War
Trap, the utility of war hinges greatly on the perceived prospects of success in war. (1981, 46-
48). In addition, Bueno de Mesquita uses initiator win-rates to justify his expected utility
approach to the causes of war. He begins with his finding that initiators won 42 of 58 (72%)
interstate wars between 1815 and 1974.2 Because initiators win frequently, he wrote: “we can
reasonably believe, then, that wars are purposive.” In contrast, “if war is unintentional, we
should not expect a systematic relationship between those who start wars and those who win
wars” (1981, 20-22). If he was truly agnostic about assuming preferences, any win rate might
indicate purposive behavior.
Not only do many rationalists agree with the assumption that initiators want to win, some
also assume a fairly rational decision-making process. Almost by definition, this is explicitly
2 According to our data, the initiator win rate through Bueno de Mesquita’s cutoff of 1974 was 58.5%
(Our N is 69 wars with win rates of 65% in COW and 52% in MID). This may be due to changes in
COW data and coding, and/or to Bueno de Mesquita’s recodings (1981, 99-100), and/or to our use of
MID Revisionist as the main source for initiator coding. 13

true for rational choice practitioners. For them, this rational process is one in which actors
gather information, predict outcomes, calculate and rank utilities, and act strategically to “pursue
their goals as best they can” (Lake and Powell 1999, 7). According to Morrow, “rational
behavior means choosing the best means to gain a predetermined set of ends….actors are trying
to create more desired outcomes rather than less desired outcomes” (1994, 17). To the extent
that rational choices imply decent information and calculation, these statements imply a decent
level of success for rational actors. These practitioners also acknowledge that mistakes may
happen, due to incomplete information and other bounds to full rationality. Even after war
initiators have made their best calculations, they may sometimes lose.
However, if reasonably good calculators repeatedly lose, those who have some faith in
the decision making process must argue that losing wars now has positive utility for many
initiators, and/or that other options were worse than the losing war often forecast by these decent
calculators. We have yet to discover anyone who argues that initiators increasingly and now
generally prefer losing wars to winning them, or that losing wars is increasingly and now
generally seen to be the least-worst policy option for initiators. Either would explain a 67% loss
rate since 1945.
In the end, the extent to which the declining win-rate reflects an increased preference for
losing wars or increased miscalculation and misperception is an empirical matter. Maybe both
help explain the decline in win rates. We look forward to trying to explain our findings in more
depth as this project continues, and we hesitate to make un-conditioned judgments between the
two contending explanations before the facts are in. None of our arguments are aimed at the
techniques of formal modelers. Indeed, if miscalculation and misperception have increased, then
14

the willingness of the rational choice approach to look across levels of analysis and to not
assume preferences offers a model well-heeded by other approaches. That said, if our
assumptions are right, then miscalculation and misperception have become so pervasive in
decisions for war that assumptions about even boundedly rational decision making processes in
this domain must be recalibrated.
Many of the scholarly and policy implications of this study obtain regardless of whether
initiators increasingly find it rational to fight losing wars or are plagued by miscalculation and
misperception. Either way, the causes of war are becoming harder to study because it is more
difficult to make assumptions about preferences and behavior, and to assess the sources of and
influences on preferences and behavior. Either way, the world is becoming more dangerous
because it is harder to prevent war through deterrence.
DEFINITIONS
Because of our key assumption, outcomes largely define the key concepts in this paper:
miscalculation, misperception, and rationality. If a state starts a war and loses, then
miscalculation and misperception dominated the decision-making. If a state starts a war and
wins, the decision was dominated by rational calculation. Yet for the purposes of transparency
and in order to more fully engage debates about rationality and miscalculation and
misperception, we briefly define our terms here.
Misperception: There are two types of misperception. The first is when incorrect data is
received by the decision-maker. Incorrect data describes a situation in a way that does not
correspond with objective reality. The second type of misperception occurs when the decision-
15

maker distorts incoming information. For whatever reason it occurs, imperfect information is
misperception. Misperception can cause miscalculation.
Miscalculation: Miscalculation occurs when a decision-maker obtains different results
than intended: if he/she pushed button A expecting result X, but instead gets result Y. These
definitions mean that even optimal calculation using imperfect information constitutes
miscalculation and misperception if it results in unintended consequences. Unintended
consequences signify miscalculation (for discussion of this issue, see Fearon 1995; Jervis 1988;
Levy 1983).
Rationality: Perfect rationality means making decisions to maximize utility based on
perfect information about all available choices and their consequences. If all states and actors
were perfectly rational, war would be rare because states could predict outcomes in advance and
losers in particular would, presumably, have strong incentives to bargain to prevent war (Fearon
1995; see also Bueno de Mesquita and Lalman 1992). Blainey’s argument that "most wars were
likely to end in the defeat of at least one nation which had expected victory" would rarely apply
(1973, 144-145) because the future loser would capitulate in advance of the war. Of course, the
real world is one of bounded rationality. From opacity in the international system, to limits in
human cognition and physical and organizational limits of intelligence services, those obtaining
and processing information face many hurdles.
As we acknowledged above, actors will not always get their preferred outcomes because
of luck and bounded rationality (Lake and Powell, 1999, 31). Yet it is reasonable to assess the
rationality of war by assuming initiators want to win, and asking: “do initiators get their
preferred outcomes most of the time?”
16

A major task for case study researchers is to come up with intersubjectively agreeable
coding rules that can place decision-making for war along the continuum from almost perfectly
rational, boundedly rational, and very boundedly rational, to decisions dominated by
miscalculation and misperception. These coding rules do not exist, which is one reason why
scholars talk past each other when arguing about general causes of war, and about causes of
specific wars. Contributing to the development of coding rules for miscalculation and
misperception is an aspiration of the “Is War Rational?” project, but it is not the focus of this
article.
DATA AND CODING RULES
We used the Correlates of War (COW), Militarized Interstate Dispute (MID), and
National Material Capabilities (NMC) databases to code key variables for all of COW’s 79
major interstate wars from 1815 to 1997. The variables we used from these datasets include
initiators, targets, joiners of attackers, joiners of targets, war outcomes, duration of war,
fatalities, and relative power of all parties to the war. These merged variables form the “Is War
Rational?” (IWR) database, and are needed for our major tasks: determining win/loss rates for
initiators, and examining whether relative power (including coalitions and joiners) influences
and helps predict outcomes. We have not recoded any aspects of these three databases.
The COW dataset focuses on serious military conflicts (defined as having 1000 or more
battle deaths) between states from 1816-1991. It starts with the Franco-Spanish War of 1823
and ends with the Gulf War of 1990/1991. The MID dataset codes variables in “all instances
when one state threatened, displayed, or used force against another from 1816-2001” (Correlates
17
of War home page at: <<http://cow2.la.psu.edu/>>, accessed 1/06/05). The NMC uses six
indicators -- military expenditure, military personnel, energy consumption, iron and steel
production, urban population, and total population -- as the basis for its Composite Indicator of
National Capability (CINC) score, coded by year from 1816-2001. All datasets and some of
their coding information are available via the COW home page.
The chief difficulty with the data was figuring out who started each war. Three
contenders offered plausible codings for us to determine “Is War Rational?” Initiators: COW
Initiator, MID Initiator, and MID Revisionist. Each uses different coding rules. In COW, the
Initiator is the side that “made the first attack in strength” (Singer and Small 1972, 366). In
MID, the Initiator (or “attacking originator,” in strict MID language) is “the state that takes the
first militarized action.” And the MID Revisionist is “the state or states that sought to overturn
the status quo ante” (Jones, Bremer, and Singer, 1996, 178; see also Bennett and Stam 2003, 49-
51).
Because of these different coding rules, the databases often disagree about who initiated a
given war. There are 22 wars where COW Initiator and MID Initiator do not match. There are
17 wars where there is no overlap between the MID Revisionist and the COW Initiator (ie. no
MID Revisionist is a COW Initiator). There are 18 wars where the MID Revisionist is not the
MID Initiator. And there are 9 wars in which both sides of the conflict are deemed Revisionist
by MID. To illustrate the types of difficulties posed, the MID Initiator for World War II is
Poland. Though one has to credit MID for sticking to its coding rules, Poland did not start
World War II. Germany is the COW Initiator and the MID Revisionist.
18

So which of these three possible codings – COW Initiator, MID Initiator, or MID
Revisionistare best to use for the IWR Initiator? For the purposes of answering the “Is War
Rational?” question, we primarily use the MID Revisionist coding to code the IWR Initiators.
The reason is that revisionists aim to change the status quo, while MID Initiator and COW
Initiator only indicate which state/s first used force. MID Revisionist best indicates the state/s
that is most decisively making the choice for war. However, when both sides are revisionist in
MID, we use COW Initiator to break the tie and decide which side is the IWR Initiator. This is
because the COW Initiator is likely to have taken a more serious action than the MID Initiator,
as the Poland example illustrates.
For the other main variable, outcome, the IWR data includes both COW and MID
outcomes. We take the IWR Initiator/s, and see if COW and MID reported these state/s to be the
winners, losers, or Tie/Other (see next paragraph). We then report these results as coded by each
database, or we average the results. Therefore, we do not need to choose between COW and
MID when their outcome coding varies. For example, COW codes clear winners in 48 of the 79
wars, while MID’s total is 39. Thus, we report that states win between 61% (COW) and 49%
(MID) of the time, and/or we report the average of 55%.
In the three cases where MID codes a war as “Yield by Side A” (Side A is the attacker in
MID), we code this as a loss for initiators because they capitulated to their targets and failed to
achieve their goals. “Yield by Side A” outcomes are treated differently from Stalemate,
Compromise, and Unclear outcomes in MID because only “Yield” involves clear submission by
the initiators. We code the Stalemate, Compromise, and Unclear outcomes in MID as “Other” in
the relevant tables, and consider them comparable to the Tie coding in COW. For more
19

discussion of coding outcomes, see Stam (1996), Maoz (1983), and Bueno de Mesquita (1981),
as well as the technical appendix to this paper.
The NMC database’s Composite Index of National Capabilities (CINC) score provides
yearly estimates of each state’s capabilities relative to other states in the international system for
a given year. Six indicators—military expenditure, military personnel, energy consumption,
iron and steel production, urban population, and total population are combined to serve as the
basis for the CINC. We used COW to indicate the dates during which states were involved in
wars. The NMC documentation (2004) makes clear that power is often hard to code. For
example, in 32 out of 79 wars, military expenditure or military personnel data for either the
initiators or targets do not exist.
After sorting through these issues, a sensitivity analysis (shown below in Table 3) shows
that our main findings are robust and conservative..
FINDINGS
INITIATOR SUCCESS RATES
Table 2: War Outcomes for Initiators n % of all wars
n % of all wars
% of all warsCOW MID Average COW/MID Win 48 61% Win 39 49% Win 55%Lose 24 30% Lose 24 30% Lose 30%Tie 7 9% Stalemate 11 14% Tie/Other 11%
Compromise 1 1%
Unclear 4 5%
n 79 n 79 As explained above, determining whether initiators tend to win or lose wars is crucial for
understanding whether decisions for war are rational. Based on our dataset of 79 major wars
20

dating back to 1815, Table 2 shows that initiators have won between 61% (COW) and 49%
(MID) of all wars they started. This is an average win rate of 55%. In both COW and MID,
initiators lost 30% of all wars they started. Initiators tie in 9% of wars in COW and stalemate or
achieve other outcomes 20% of the time in MID. Chi square tests show that these results are
significant at p<.001 for COW, and at p<.01 for MID. The COW dataset is more aggressive in
coding definitive winners, while MID is more cautious (Fortna 2004, footnote 44).
How do we know if winning 61% or 49% of the time means that decisions for war tend
to be the result of rational calculations or are dominated by miscalculation and misperception?
Thresholds are in the eye of the beholder. To us, a 50% initiator win rate is indeterminate.
Given that war is so costly, decisions for war should be well-calculated (Bueno de Mesquita
1981, 32). This increases the extent to which 50% seems like miscalculation. On the other
hand, maybe defensive advantages make this a good win rate (though wise initiators would take
this into account). As the percentages diverge from 50%, conclusions are easier to draw. A
two-thirds win rate implies that decisions for war tend to be well-calculated. A one-third win
rate suggests to us that decisions for war are dominated by miscalculation and misperception.
SENSITIVITY ANALYSIS
A sensitivity analysis shows that our coding rule of using primarily MID Revisionist to
determine initiators yields outcomes that are conservative with respect to our core arguments that
overall initiator win rates since 1815 are nearing fifty percent and are declining over time. There
are six possible permutations of the Initiator/Outcome data formed by the three initiators codings
of MID Revisionist, MID Initiator, and COW Initiators, and the two outcome codings of MID
21

and COW. As explained above, we primarily use MID revisionist for the initiator, and we report
both COW and MID outcomes, or their average. This covers two of the six combinations. To
conduct this analysis, we therefore look at the four remaining permutations formed by COW and
MID Initiator, and COW and MID Outcome.
We report an overall initiator win rate of 55%. Only the COW/COW column yields
results with higher initiator win rates than those we report. Three other permutations
(COW/MID, MID/MID, and MID/COW) show lower initiator win rates.3 If we had wanted to
cook the books against rationalist causes of war, three other coding permutations would have
made the job easier. Instead, we used the most theoretically justifiable coding rules for our
project.
Table 3: Sensitivity Analysis
IWR Results Other Ways of Determining Initiator Win/Loss Ratios
Initiator Outcome
IWR Initiator and Averaged COW/MID Outcomes
COW Initiator / COW Outcome
MID Initiator / COW Outcome
MID Initiator / MID Outcome
COW Initiator / MID Outcome
W 48 (COW) ; 39 (MID) 49 42 35 39L 24 (COW); 24 (MID) 23 29 27 23Tie/Other 7 (COW); 16 (MID) 7 7 16 16
Initiator Win Rate for All Wars%W 55% 62% 54% 46% 50%%L 30% 29% 37% 34% 29%%Tie/Other 15% 9% 9% 20% 21%
N 79 78 79 78
Initiator Win Rates Through 1900, then After%W Pre- 73% 75% 69% 56% 66%
3 To explain why the Ns are 78 in two columns, the COW and IWR initiators of Czechoslovakia and
Rumania initiate (and win) a war against Hungary in the 1919War of the Hungarian Allies (COW war
#112). But in MID, the initiators are France, Italy, and the United Kingdom, and they are not
participants in COW or IWR. Hence, there is no way to make COW and MID Initiators and Outcomes
speak to each other. 22
1901%L Pre-1901 21% 25% 31% 31% 22%%T/O Pre-1901 7% 0% 0% 13% 13%
%W 1901+ 43% 53% 43% 38% 38%%L 1901+ 37% 32% 41% 36% 34%%T/O 1901+ 21% 15% 15% 26% 26%
Another confirming sign is that all four permutations show that win rates are declining
markedly over time. Finally, all but one permutation yields win rates below the 72% reported
by Bueno de Mesquita and the 74% and 67% reported by Wang and Ray for the 1800s and
1900s, respectively (cited above). The exception is the COW Initiator/COW Outcome
permutation which yields a 75% win rate during the 1800s.
INITIATOR SUCCESS RATES OVER TIME
Overall win rates are a good place to start assessing the rationality of war, but a finer-
grained picture is gained by looking at win-rate trends over time. Table 4 shows that in the 32
wars that occurred prior
to 1900, initiators won an
average of 73% of the
time. For the 47 wars
after 1900, the success
rate dropped to 43%.
After 1945, initiators win
33% of the 23 wars.
Compared to the win rate
Table 4: Initiator Outcomes by Time Period 1815-1900 % 1901-1991 % 1946-1991 %COW W 25 78% 23 49% 8 35%L 7 22% 17 36% 9 39%T 0 0% 7 15% 6 26% MID W 22 69% 17 36% 7 30%L 6 19% 18 38% 9 39%Other 4 13% 12 26% 7 30% Avg COW/MID W 73% 43% 33%L 20% 37% 39%Other 6% 20% 28% n (% of 79) 32 41% 47 59% 23 29%
23

through 1900, the odds of success since 1945 have fallen 65%, from 73% to 33%. It was a
much better bet for states to go to war in the 19th century than in the 20th.
Figure 1 shows the moving average of victory as a percentage of all outcomes. The gap
between COW and MID outcomes gives a picture of the historical range or debate between the
two. COW provides an upward bound on success rates, and MID a lower bound, but success
rates in both decline similarly and significantly.
As initiators win less over time, they lose or tie more frequently. Figures 2 and 3 show
the moving averages of initiator wins, losses, and ties over time. These graphs show that in both
COW and MID, the loss rate stabilizes near 30% in the mid-1900s. Despite this, MID’s win rate
is less than COW’s. The reason for this gap lies in the amount of wars coded as ties in COW
and “other” outcomes in MID. MID shows the rate of tying/other outcomes declining to around
10% in 1920, but then rising back up towards 20% in modern times. In COW, no ties occur in
the first one hundred. The first tie is in 1920, and ties as a percentage of all outcomes rose to
about 10% since. With this 10% increase in ties as a percentage of all outcomes, COW and MID
appear to be moving hand in hand since 1920.
24

In her ongoing study
on the increasing rate of
tying, Fortna argues: “If
draws have become more
prevalent, perhaps war is
becoming less effective as a
decision mechanism” (2004,
5-6). She considers factors
that might have caused the increase in ambiguous outcomes, including the combatants’ ability to
win decisively, their ability to cease fighting, and the possibility that war coding is flawed for
recent outcomes since we
do not yet have a long-
terms lens for these wars.
However, Fortna does not
directly answer the “Is War
Rational?” question. If one
assumes that initiators do
not start wars in order to
draw, the fact that they are
increasingly unable to win outright suggests that pre-war decisions were rooted in misperception
and/or miscalculation.
25
Figure 3: Outcome Rates Over Time (MID)
0%
10%
20%
30%
40%
50%
60%
70%
80%
90%
100%
1820 1840 1860 1880 1900 1920 1940 1960 1980 2000
%W %L %Other
Figure 1: Initiator Success Rates Over Time (COW vs. MID)
45%
50%
55%
60%
65%
70%
75%
80%
85%
90%
95%
100%
1820 1840 1860 1880 1900 1920 1940 1960 1980 2000
COW MID
Figure 2: Outcome Rates Over Time (COW)
0%
10%
20%
30%
40%
50%
60%
70%
80%
90%
100%
1820 1840 1860 1880 1900 1920 1940 1960 1980 2000
%W %L %Tie

THE IMPACT OF CAPABILITIES ON OUTCOME
The
most obvious
determinant of
war outcomes
should be
relative power.
Strong initiators
should win wars
more
frequently.
Figure 4 parses outcomes by capabilities. The IWR variable of relative capability for the
initiator ( RelCap(I) ) is based on each state’s or coalition’s Composite Indicator of National
Capability (CINC) score and it measures the relative capabilities of initiators to targets on the
first day of any war. If RelCap(I) = 0.67, then the initiating state(s) have 67% of the power in
the conflict, or twice as much as the target side. A change of 0.25 in RELCAP such as that
from .375 to .625 means a minimum 2.78 fold increase or decrease in straight capability. The
significance of a .25 change increases as one gets away from .5, or parity. For example, a
RELCAP change of .25 from .9 to .65 is an almost a five fold change in capability (from having
a 9:1 ratio of power to 1.9:1 ratio).
In the 38 wars when initiators are at least three times stronger (RelCap (I) = >.75), they
win an average of 62% of the time (the average of 66% of the time in COW and 58% in MID).
26
Figure 4: Initiator Relative Capability and COW/MID Averaged Outcomes
50% 50%
45%
62%
36%
29%
41%
26%
14%
21%
14%12%
0%
10%
20%
30%
40%
50%
60%
70%
<.25, N=11 >25-.5, N=19 .5-.75, N=11 >.75, N=38
Initiator Relative Capability
W L Tie/Other
When the initiator’s relative capability is less than three times as strong, win rates sink to 50% --
or just below for modestly strong initiators.
We parse the data into these quartiles in part to help analyze the “3:1 rule.” This is a
common rule of thumb used by strategists is that armies are likely to win in battles (not war
outcomes) if they are at least three times more powerful as their targets (Mearsheimer 1989).
Looked at here, our data suggests that a three to one power advantage is a fairly useful predictor
of war outcomes as well. It is the only category where win rates dominate over losses and ties.
Oddly though, initiators who were stronger than their targets but less than three times as strong
(0.75>RelCap(I)>0.5), did less well than weaker initiators.
Combining all strong initiators (RelCap(I)>0.5; N=49), the average win rate is 58%.
These findings do not overwhelmingly favor power as a predictor of outcomes, and some of our
other findings further vitiate power as a predictor, but Maoz’s argument that “capability
variables [are] unrelated to dispute outcomes” does not appear to hold (1983, 220).
In future work, we will use this analysis of outcomes and power to help pick cases for
further study. Cases where strong initiators lose to weak targets suggest high degrees of
miscalculation and misperception. Cases where weak initiators win against strong targets
suggest superior calculation. These cases may provide prototypical examples of miscalculation
and misperception or rational calculation. We can then use these examples to help develop
coding rules for placing cases along the rationality / miscalculation and misperception
continuum (see definitions above).
THE IMPACT OF JOINERS ON OUTCOME
27

We examine joiners in part to see if they are a source of power, and thus might add
predictability to outcomes. In fact, joiners generally seem to be a source of miscalculation and
misperception. Most research on joiners focuses on issues such as how alliances may cause or
diffuse war by pulling states into the conflict (Christenson and Snyder 1990; Siverson and King
1979), or on predicting when allies will enter a war (Yamamoto and Bremer 1980). Stam argues
that alliances influence outcomes, but with diminishing returns (1999, 148-152). Stam does not
investigate whether joiner wars favor initiators or targets, or whether joiners are a source of
miscalculation and misperception.
The IWR database adds a field to code each war as a joiner or non-joiner war, and this
also indicates if a war has offensive joiners (joiners on the side of the initiator), defensive joiners
(joiners on the side of the target), or both. We also code for coalition wars, to distinguish
between wars where there are multiple day
one initiators (and/or defenders) and joiners
who come into the war after day one. From
the point of view of identifying factors that
affect the predictability and calculability of
war outcomes it is useful to distinguish
between joiners and day one coalitions.
Presumably, the latter make outcomes easier to predict.
The results of parsing war outcomes by the presence of joiners are displayed in Table 5.
This table shows that when joiners enter wars, the initiator success rate falls from an average of
Table 5: Joiners vs. Outcome
Do joiners enter the war?COW No % Yes %W 41 69% 7 37%L 15 25% 9 47%T 6 10% 1 5% MID No % Yes %W 32 54% 7 37%L 18 31% 6 32%Other 3 5% 4 21% n 62 17
28

55% (for all wars) to 37%, while initiator the win rate in non-joiner wars rises to 61.5%. Thus,
the addition of joiners has a substantial influence on war outcomes.
To estimate how much of the difference in success rates is explained by balancing against
initiators, we look at the subcategories of offensive and defensive joiners in Table 6. Only 17 of
the 79 (22%) wars involve joiners, so these results are not terribly robust, and additional parsing
further reduces the sample sizes.
When only offensive joiners are present, they do not do much to help initiators. The win
rate in wars with only offensive joiners is 62% in both COW and MID (N=8). This is a
seemingly small increase of 7% over the aggregate average initiator win rates for all wars of
55%. When there are only defensive joiners (N=6), they balance effectively against the initiator
and initiators win only 33% in COW and MID. In the rare cases (N=3) when both sides have
joiners, the initiator win rate is zero. All wars with defensive joiners (N=9;
11% of all wars) have an
initiator win rate of 22%.
The clearest
implication of these
findings is that defensive
joiners are a source of
miscalculation and misperception (Van Evera 1999, 28). Whenever there are defensive joiners,
the success rate of initiators declines dramatically. As offensive joiners do not add much to the
offense, it may be that they are a source of optimistic miscalculation as well. Initiators may be
hoping for more than they get. A second implication is that when balancing occurs, it works.
Table 6: Joiners by Side vs. Outcome
COW Offensive Joiners Defensive Joiners Both Sides JoinersW 5 2 0L 3 4 2T 0 0 1 MID Offensive Joiners Defensive Joiners Both Sides JoinersW 5 2 0L 1 3 2Other 2 1 1 n 8 6 3
29

However, with an N of nine for wars with defensive or both offensive and defensive joiners
(11% of all 79 wars), balancing against wartime threats is not frequent.
Looking at the presence and effects of joiners over time, in the 1800s, initiators won five
of the eight joiner wars (62.5%). Thereafter, initiators won only two out of the nine joiner wars
(22%). The declining success rate for initiators in joiner wars may be partly caused by the
uptick in wars with any defensive joiners and the decline in wars with offensive-only joiners.
Six of the nine wars with any defensive joiners were 1913 or after, but defensive joiner-only
wars are evenly split over time. Six of the eleven wars with any offensive joiners were 1913 or
after, but five of the eight offensive joiner-only wars were pre-1913.
THE JOINT IMPACT OF CAPABILITIES AND JOINERS ON WAR OUTCOME
Our analysis has so far shown how relative capabilities and the presence of joiners affect
the quality of the pre-war bet made by initiators. We now look at how the presence of joiners
affects the outcome for initiators of various strengths. Gartner and Siverson (1996, 12) argue
that “initiators may win not only because they have capabilities that are superior to those of their
targets but also because they are generally successful in calculating whether their targets will
receive help.” So far, we have shown that defensive joiners hurt the success rate of initiators and
are a source of miscalculation and misperception.
Table 7, below, shows that in non-joiner wars very powerful states win an average of
72% of the time; N=30. When there are joiners, the success rate for the most powerful
plummets to 25%; N=8. The Ns are small, but joiners have powerful negative effects against the
strongest initiators. These results suggest that powerful initiators may be overconfident in their
30

calculations, or that they spur more effective balancing. Once again, the N of eight is small, but
of the eight joiner wars with powerful initiators (the far right column above), only three were
limited to offensive-only joiners, of which the initiators won two. This means that five of the
eight wars with powerful initiators had defensive joiners and all were losses (or two stalemates
in the case of MID) for the initiator.
Table 7: Joint Effects of Joiners and Capabilities on Outcome
Were joiners present in the war?No Yes
RelCap(I) < .25 .25 - .5 .5 - .75 >.75 RelCap(I) < .25 .25 - .5 .5 - .75 >.75COW COW W 4 9 5 23 W 2 2 1 2L 3 4 4 4 L 1 1 1 6Tie 1 2 0 3 Tie 0 1 0 0 MID MID W 3 6 3 20 W 2 2 0 2L 4 5 3 6 L 0 1 2 4Other 1 4 3 4 Other 1 1 0 2 n 8 15 9 30 3 4 2 8
To the extent that there are only seventeen joiner wars out of seventy-nine wars, Gartner
and Siverson may be right. Perhaps initiators do a good job of avoiding joiner wars. On the
other hand, when there are joiners, they tend to hurt the success rate of initiators. This is
particularly true when the initiators are strong.
To pursue this analysis, we have to further distinguish between true dyadic, coalition, and
joiner wars. Coalition wars are when there are multiple states on one or both sides of the
conflict on day one. Because they are all involved on day one of the conflict, these are not
considered joiner wars, but coalition wars. There are eleven coalition wars in the “No Joiners”
sections on the left of Table 7 above, and six in the “Joiners” section on the right. To analyze
purely dyadic wars, we moved the 11 coalition wars to the right side.
31

Coalition wars should represent even firmer alliances than joiner wars, as the allies were
all willing to commit on day one. Compared to joiner wars, predictability of outcomes should be
easier in coalition wars, and initiator win rates should rise. Likewise, purely dyadic wars should
have the highest win rates. This is indeed what we find.
Above we saw that win rates for all joiner wars were 37% (COW and MID average).
Adding the coalition wars into the joiner wars yields a total of twenty-eight wars in this category
and boosts the success rate for coalition/joiner wars to 46%. Strong initiators in coalition/joiner
wars also fare better - win rates go from 25% to 36% over thirteen wars. In the now pure dyadic
category, when a single initiator is at least three times more powerful than its single target,
initiator win rates go up modestly from 72% (N=30), to 76% (N=25). This shows that true
dyadic wars started by strong initiators are the best bets, and that initiators in coalition wars with
allies willing to enter the war on day fare better than in joiner wars. In both cases, accurate
calculation seems easier, and miscalculation and misperception is reduced.
Should initiators be able to predict the presence of joiners? Recent studies into alliance
reliability by Brett Ashley Leeds (2000, 2003) complement this analysis. Previous empirical
work (Sabrosky 1980; Siverson and King 1980) concluded that alliance members only came to
the aid of their partners 25% of the time; therefore, alliances were generally unreliable. Leeds’
Alliance Treaty Obligation and Provisions (ATOP) dataset shows that alliances are in fact
reliable 74.5% of the time. If we evaluated the pre-war cost-benefit calculus of a rational
initiator, we would expect to see evidence that decision-makers considered the possibility of
third party intervention. Gartner and Siverson (1996, 14) note in their study on war expansion
and war outcomes that “when alliances are present, initiators select as targets those states whose
32

alliance partners have been judged, ex ante, by the initiators to be unreliable.” Thus, if most
initiators assume alliances to be unreliable, and Leeds is right that they are in fact usually
reliable, then this explains one way joiners are a source of misperception and optimistic
miscalculation and bring down initiator success rates.
POWER AND OUTCOMES OVER TIME
Another way to look at power and outcomes is to analyze the relative power of winning
and losing initiators over time. If, on average, initiators or targets are winning their wars with
less power, this would help confirm the argument that outcomes are increasingly divorced from
obvious indications of power. Conducting this analysis may also shed light on whether changes
in the offense/defense balance help explain the declining win rate for initiators. For example, if
declining initiator win rates were due to changes in the offense/defense balance in favor of the
defense, possible observable implications are that initiators are losing more despite increasing or
constant relative power being brought to bear while winners are doing so with more power being
brought to bear. If this were so, something would be making offense harder and defense easier.
Likewise, if initiators who win do so with increasingly less power, then that would possibly
signal increased offense dominance (Glaser and Kaufmann, 1998, Jervis 1978, Lieber 2000).
Overall, we find that the predictive power of power (as measured by the National
Materials Capabilities database) is declining, and in some ways is not a good predictor of
outcomes. To the modest extent our data speaks to the issue, changes in the offense/defense
balance over time do not appear to explain the decline in initiator win rates.
33

Figures 5 and 6
show the composite
relative power (RELCAP)
scores from the NMC
database’s Composite
Index of National
Capabilities (CINC) for
winning (N=39) and then
losing (N=19) initiators.
The figures only show wars where COW and MID agree on outcomes, and this excludes 21 of
the 79 wars.
For all wars in which the initiators win, the power ratio is 2.71:1. After 1900, the
average drops to 2.06:1
(N=17), but the power
ratios for winners are
fairly steady through the
1900s as the average after
1945 is 1.95:1 (N=7). For
losing initiators, the
average power ratio is
1.139:1 for all 19 wars,
rising to 1.37:1 from 1901 on (N=14) and to 1.481:1 (N=7). There is some decline in winners’
34
Figure 5: Relative Capabilities of Winning Initiators
0.0
0.1
0.2
0.3
0.4
0.5
0.6
0.7
0.8
0.9
1.0
1820 1840 1860 1880 1900 1920 1940 1960 1980 2000
Composite RELCAP by war (stdevp=.30) RELCAP Moving AverageSTDEVP Moving Average
Figure 6: Relative Capabilities of Losing Initiators
0.0
0.1
0.2
0.3
0.4
0.5
0.6
0.7
0.8
0.9
1.0
1820 1840 1860 1880 1900 1920 1940 1960 1980 2000
Composite RELCAP by War (stdevp=.29) RELCAP Moving AverageSTDEVP Moving Average

power, but this decline is not very significant after the moving average stabilizes. The power of
initiators who lose appears to be rising, but has been fairly steady since 1914. Together, these
findings suggest a very modest decline in the predictive power of power.
When one compares the power ratios of winners to losers, initiating winners tend to have
a good deal more power over their adversary than initiating losers. At first, this bolsters the
predictive power of power. However, as winners win with less power, and losers lose with more
power, this actually reinforces the argument that the predictive power of power is on the wane.
These trends also suggest that it is hard to explain the declining win rate on the offense/defense
balance. If the defense was getting harder, initiators would need more power to win, not less. If
anything, the world has become more offense dominant. This is a puzzle: initiators are winning
far less often, but when they do win, they are doing so with somewhat less power over time.
Finally, the standard deviation increases over time for the power of winning initiators,
going from around .22 in the late 1800s (when the moving average of the standard deviations
stabilizes) to almost .3 in 1990. In contrast, the standard deviation moving average is flat for
losing initiators. For winning initiators, this is another sign that the predictive power of power is
declining as they win with increasingly less relative power and lose with increasingly great
relative power. Trends aside, in both figures, we see wars widely dispersed on either side of the
moving averages for relative capabilities.
The harder it is to predict outcomes based on the most obvious predictor of outcomes
(relative power), then the more likely it is that miscalculation and misperception dominate
decisions for war. However, many of the trends in this section level out to some degree in the
35

1900s, while the decline in win rates continues steadily throughout the 1900s. Thus, we do not
want to overstate the results in this section.
To better measure relative military power alone, we also ran this analysis with a Military
Capability (MILCAP) variable, and again with a Military Expenditure per Soldier (E/S) variable
to measure relative quality of forces. The MILCAP is based on NMC’s data on military
personnel and expenditures and is the average of each state’s proportion of global military
expenditures and military manpower for a given year. Expenditures per soldier were calculated
from this same data. Because MILCAP data is spotty and problematic, the N of wars covered by
MILCAP and expenditures per soldier is 47 out of the original 79. Of the remaining 47, COW
and MID agree on initiator victory for only 18. Of these 18, however, the results are similar to
the above figures for RELCAP. The average MILCAP and expenditures per soldier for winning
initiators are .67 and .59, with standard deviations of .33 and .27, respectively.
STARTING WARS AGAINST THE ODDS
Our most important finding so far is the odds of starting a war and winning have now
dipped down to one in three. This is the primary reason why we argue that miscalculation and
misperception dominate decisions for war. However, the picture gets even worse when looking
at trends in the rate of war initiation because states continue to start wars in the face of
worsening odds. This section also shows that even the strongest initiators are caught in the win
rate downdraft. Figure 7 shows that strong initiators with three to one or greater relative overall
power have been winning less frequently since around the end of WWI (in both COW and
MID), even though they still win at a comparatively high rate overall. A decision-maker with a
36

3:1 or greater advantage in capabilities in 1900 would observe that previous strong initiators had
won around 80% (COW and MID averaged) of all wars. To that leader, war might seem a sound
decision. Leaders in 1991
would see a much different
picture. Since 1900, strong
initiators have only won
45% of their wars. Since
1945, they have won only
42%. Although strong
initiators are losing or tying
in wars more frequently, Figure 8 shows that since about 1900, the percentage of wars they start
has remained stable at just under 50%. Moderately weak initiators (0.25<RelCap(I)<0.5) have
started wars more often over time. Since about 1910, states below RelCap(I)=.5 have increased
their percent of wins relative to all initiator wins, and are doing so at the expense of the
moderately strong states whose win rate has declined for about 100 years.
Despite a declining win rate, and a win rate from 1945-on of 42%, strong initiators have
been starting wars at the same rate for almost 100 years. Indeed, the general rate of war
initiation has remained constant in our data since 1920. The data also suggest that measuring
offense and defense dominance is becoming (even) trickier. States with less power are winning
more (as a percent of wars won by initiators), and states with more power are losing more.
37
Figure 7: Success Rates for Strong Initiators [RelCap(I)>0.75] Over Time
55%
65%
75%
85%
95%
1820 1840 1860 1880 1900 1920 1940 1960 1980 2000
Moving Average
%W
in/I
COW MID

Capabilities have become a
less accurate indicator of
victory. This may suggest
that false confidence in the
predictive power of power is
an increasing source of
misperception and
miscalculation.
Looking more closely at the rate of war initiation in Figure 9, it increased until about
1920, then held roughly steady since. The post-Cold War era created the impression that
interstate war almost evaporated as a problem. That may indeed be true because the last war in
is the Gulf War of 1990/91, but the overall moving average suggests no decline in the rate of
interstate war. If anything, the rate is increasing slightly. From 1815 through 1900, the moving
average of the years between war initiation ends at 2.41. By 1991, for all 79 wars, the average
had declined to 2.11. For
the 49 wars since 1900, the
moving average ends at
1.84 years in between
large interstate wars. The
lower the number, the
greater the frequency of
war.
38
Figure 8: Percent of All Wars Started, by Initiator Strength Over Time
0%
10%
20%
30%
40%
50%
60%
70%
1820 1840 1860 1880 1900 1920 1940 1960 1980 2000
Moving Averages
% o
f all
war
s
>.75 0.5-0.75 0.25-0.5 <0.25
Figure 9: Trends in the Rate of War Initiation
0
1
2
3
4
5
6
7
8
9
1820 1840 1860 1880 1900 1920 1940 1960 1980 2000
Year
s Si
nce
Last
War
Years Since Last War Moving Average
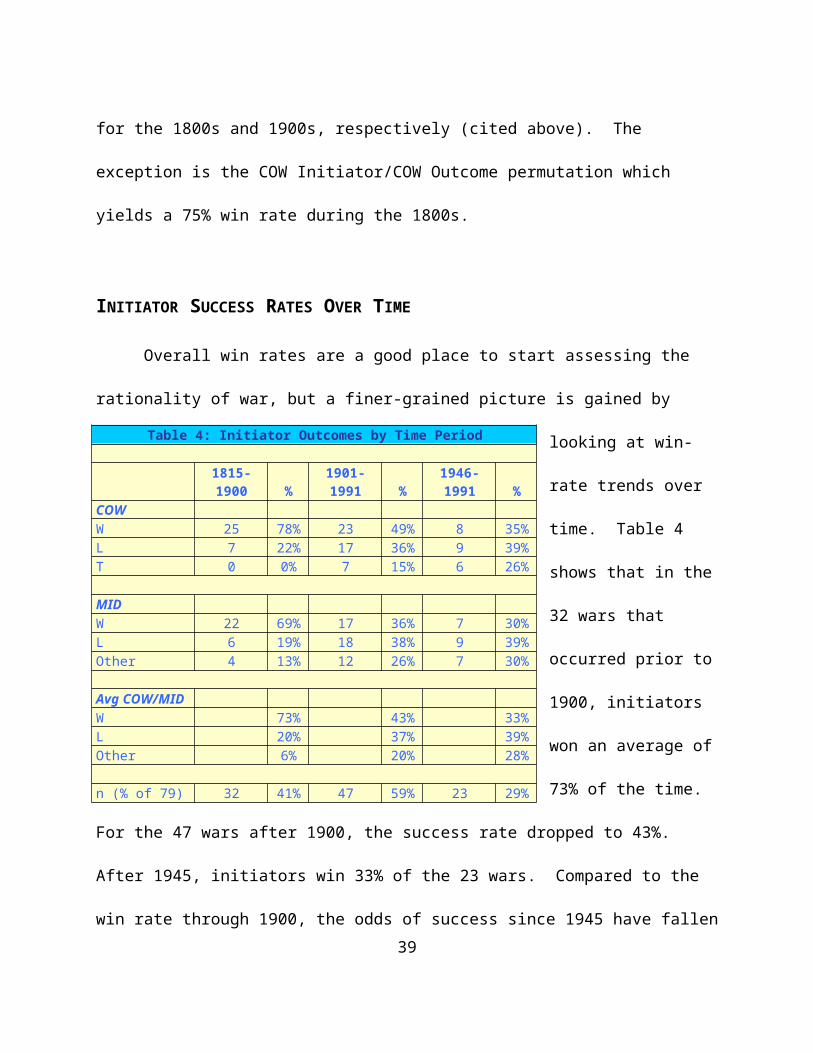
Figure 10
reinforces the argument
that war initiation rates
are increasing slightly
while win rates for
initiators are declining
dramatically. The moving
average for chance of war
initiation in a given year
ends at 47%. The chance of initiators winning is a composite average of COW and MID win rate
moving averages. For all wars, the average ends at 55%. Since 1900, the average ends at 43%.
And since 1945, the average ends at 33%.
INFLUENCES ON THE DURATION AND DEADLINESS OF WARS
When optimistic miscalculation helps cause war, states go into war thinking they will
win, and that the war will be quick and relatively easy (Blainey 1973, Van Evera 1999). We
confirm that when states calculate well and win, wars are indeed shorter and incur fewer
fatalities than when they miscalculate and lose. When initiators lose, the wars are between 27%
(COW) and 61% (MID) longer than when they win. For some reason, ties are the longest wars
in COW, but other outcomes are the shortest wars in MID.
The presence of joiners also affects the duration of war. Non-joiner wars (where
initiators are more successful) average 321 days. On the other hand, joiner wars average 831
39
Figure 10: Moving Averages of Chances of War Outbreak and Initiator Winning
0%
10%
20%
30%
40%
50%
60%
70%
80%
90%
100%
1820 1840 1860 1880 1900 1920 1940 1960 1980 2000
Chance of War Outbreak Chance of Initiator WinningChance of Initiator Winning From 1900 Chance of Initiator Winning From 1945
days in length, and increase of 259%. This supports claims by Blainey (1973), Wang and Ray
(1994, 142), and Bueno de Mesquita (1981) that wars with third party intervention are likely to
be longer than wars involving only the initiator and the target.
Looking at fatalities, when initiators lose, they suffer between 4.1 (COW) and 3.3 (MID)
times more casualties than when they win. Joiners make things even worse for the attacker but
only when they lose. Despite these pronounced average results, the standard deviations are large
and there are wide ranges across the wars. Overall, initiators incur fatalities at about two-thirds
the rate of targets (.64, with Ns of 12,241,468 and 19,160,076 respectively). If one excludes the
World Wars (which comprise 74% of the initiator deaths and 83% of the target deaths out of the
79 wars), the figure achieves parity (.97, with Ns of 3,218,268 and 3,328,562, respectively).
This is something of a surprise, as defense is often thought of as advantageous for the defender.
Although we are looking at wars, not battles, this suggests a twist on the 3:1 rule of thumb
mentioned above. When initiators win, they do not need a 3:1 advantage (because they are
incurring casualties at near parity), but when they lose they will incur casualties at a 3:1 or
greater rate.
40

CONCLUSION
"Well I would say, sir, that there was something dreadfully wrong somewhere"Lieutenant-Colonel Lionel Mandrake to war-initiating General Jack D. Ripper
in “Dr. Strangelove” (1964)
FINDINGS
The success rate for war initiators is 55% for all major interstate wars from 1815 through
1991. The success rate has declined to one-third in modern wars since 1945. States continue to
initiate wars at a fairly constant rate: almost one major interstate every two years since 1920.
These findings mean that states are increasingly miscalculating and misperceiving their ways
into war, and they are not learning that war increasingly does not pay.
Historically, the strongest states tend to win the wars they initiate, especially when the
wars are kept dyadic. In true dyadic wars, war is a good bet and strong initiators with 76% of
the time. Although these findings suggest that power is a good predictor of outcomes, other
findings mitigate against this conclusion. The win rate for even strong initiators has dropped to
42% since 1945. Strong states often lose wars and weak states win a fair amount the time.
Joiners make the overall success rate fall by about one-half to one-third. The effect of joiners is
greatest against the strongest initiators, who only win two of the eight joiner wars in this
category. In sum, power is becoming a less useful predictor over time.
Joiner wars were good for initiators in the 1800s, but they are increasingly bad. Joiner
wars are now, on average, losses for initiators. Joiner wars are not frequent. Out of 79 wars, 17
have joiners, and only 9 have defensive joiners. This is not the robustly balancing world of
defensive realists (Walt, 1997). Because joiner wars have lower overall win rates than non-
41

joiner wars, we argue that they are a source of miscalculation and misperception, at least in the
1900s.
Together, these findings suggest that the determinants of war outcomes are becoming
increasingly elusive. Relative power should be the best predictor of war outcomes. If it is not,
then outcomes must be attributed to harder to measure and less calculable variables such as will
or strategy. It makes sense that we find both that miscalculation and misperception is increasing,
and that power is an increasingly unsatisfying predictor of war outcomes, albeit at a modest rate.
IMPLICATIONS
What do our findings mean for the study of war, strategic policies, and the future of war?
If miscalculation and misperception dominate decisions for war, then more study of
miscalculation and misperception is called for. There are two priorities. First, scholars have to
learn to better identify miscalculation and misperception in case studies and develop coding rules
so that it is easier to agree on the phenomena being observed. Over time, this will also help
large-N studies to produce more fine-grained analyses of miscalculation and misperception.
Second, scholars must figure out what it is about modern warfare and statecraft that is
causing initiators to misperceive and/or miscalculate more often. Answers may lie in increased
balancing, increased defense dominance, increased nationalism, increased pain-tolerance in
defenders, variations in transparency, and changes in the political and economic organizations of
states. As the “Is War Rational?” project progresses, we hope to test some of these propositions.
In general, the large-N community should focus more on outcomes, while all empiricists have to
42

fine-tune the study of less tangible, non-material variables of war outcomes such as willpower,
strategy, and nationalism.
To the extent that rationalist and expected utility approaches to the study of war assume
that war is a boundedly rational policy choice resulting from reasonably rational policy processes
and with a reasonably high expected utility, these approaches are undermined as the initiator win
rate falls below 50%. In the face of a recent initiator win rate of 33%, the world seems to have
become a place where rationality has gone from bounded to rare, where information has gone
from incomplete to poor, where some uncertainty has become mostly ignorance, and where
maximizing utility through war has minimal odds of success. We believe that miscalculation
and misperception now dominate the foreign policy process in decisions for war.
Turning to policy implications, deterrence should be getting easier. As the utility of war
declines, so should its frequency. In fact, deterrence is getting harder. We argue that the general
level of miscalculation and misperception is increasing, and, to a modest extent, that outcomes
increasingly depend on elusive variables. They are related, and both are bad for deterrence.
Moreover, states continue to start wars despite decreasing odds. So we are not just seeing a rise
in general miscalculation and misperception, because that could lead to uncertainty, caution, and
fewer wars. Instead, we are seeing increased optimistic miscalculation. The odds get worse, yet
the bettors keep coming to the casino of war.
We cannot speak to individual cases such as North Korea or Iran, and we do not want to
overstate the specific policy implications of our general findings. However, these findings do
appear to support policies which rely on arms control and defense and denial, rather than pain-
based deterrence. Although defense and denial can aid deterrence, initiators are increasingly
43

either choosing the pain of losing wars, or miscalculating and misperceiving their way into
thinking that the pain of loss will not happen to them. In looking at the proliferation of missiles,
for example, the Missile Control Technology Regime and other arms control efforts should be
pursued with vigor. The benefits of reliable missile defenses also increase as miscalculation and
misperception increase.
The most important policy implication is to make policy makers more aware that the
policy process is, for whatever reason/s, increasingly flawed. Decisions for war deserve greater
scrutiny and caution. The win rate for wars by initiators with 3:1 or greater power has declined
to 42% since 1945, while the win rate for all modern initiators has fallen even lower to 33%.
The greatest miscalculation and misperception of all is that war is a good bet. This is false
optimism. War is now a bad bet.
44

References
Achen, Christopher H. and Duncan Snidal, ARational Deterrence Theory and Comparative Case Studies,@ World Politics Vol. 41, No. 2 (January 1989)
Allison, Graham, and Zelikow, Philip, Essence of Decision: Explaining the Cuban Missile Crisis, 2 ed., (New York, NY: Addison-Wesley, 1999)
Baram, Amatzia, “Israeli deterrence, Iraqi responses,” Orbis, Vol. 36, Issue 3 (Summer 1992).
Bennett, Scott and Allan C. Stam, “EUGene: Expected Utility Generation and Data Management Program, Version 3.0,” (2003)
Betts, Richard K., "The Delusion of Impartial Intervention," Foreign Affairs, Vol. 73, No. 6 (November/December 1994)
Betts, Richard K., “Must War Find a Way? A Review Essay,” International Security, Vol. 24, No. 2 (Fall 1999)
Blainey, Geoffrey, The Causes of War (New York, N.Y.: The Free Press, 1973)
Bueno de Mesquita, Bruce, The War Trap (New Haven, CT: Yale University Press, 1981)
Bueno de Mesquita, Bruce, and David Lalman, War and Reason: Domestic and International Imperatives (New Haven, CT: Yale University Press, 1992)
Bueno de Mesquita, Bruce, James D. Morrow, and Ethan R. Zorick, “Capabilities, Perception, and Escalation,” American Political Science Review Vol. 91, No. 1 (March 1997)
Christensen, Thomas J. and Jack Snyder, “Chain Gangs and Passed Bucks:Predicting Alliance Patterns in Multipolarity,” International Organization, Vol. 44, No. 2 (Spring, 1990)
Collier, David, Henry E. Brady, and Jason Seawright, “Sources of Leverage in Causal Inference: Toward and Alternative View of Methodology,” in Henry E. Brady and David Collier, eds., Rethinking Social Inquiry: Diverse Tools, Shared Standards (Lanham, MD: Rowman and Littlefield).
Copeland, Dale C., The Origins of Major War (Ithaca, NY: Cornell University Press, 2000)
45

Cordesman, Anthony H., “Is There a Crisis in US and North Korean Relations? Yes, There Are Two!” at <<http://csis.org/features/cord_nkorea.pdf >> Center for Strategic and International Studies, December 30, 2002. Downs, George W., AThe Rational Deterrence Debate,@ World Politics, Vol. 41, No. 2, (January 1989)
Fearon, James D., ARationalist Explanations for War,@ International Organization, Vol. 49, No. 3 (Summer 1995)
Fischer, Fritz, Germany’s War Aims in the First World War (New York, NY: Norton, 1967)
Fortna, Page, “Where Have All the Victories Gone? Hypotheses (and some Very Preliminary Tests) on War Outcomes in Historical Perspective,” Paper presented at the annual meeting of the International Studies Association, Montreal, Canada (March 2004)
Gartner, Scott Sigmund and Randolph M. Siverson, “War Expansion and War Outcome”, Journal of Conflict Resolution, Vol. 40, No. 1 (March 1996)
Geller, Daniel S. and J. David Singer, Nations at War: A Scientific Study of International Conflict (Cambridge, UK: Cambridge University Press, 1998)
George, Alexander and Richard Smoke, ADeterrence and Foreign Policy,@ World Politics, Vol. 41, No. 2, (January 1989)
Geva, Nehemia and Alex Mintz, eds., Decisionmaking on War and Peace: The Cognitive-Rational Debate (Boulder, CO: Lynne Rienner Publishers, 1997)
Glaser, Charles L. and Chaim Kaufmann, "What Is the Offense-Defense Balance and Can We Measure It?" International Security, Vol. 22, No. 4 (Spring 1998)
Gochman, Charles S. and Zeev Maoz, AMilitarized Interstate Disputes, 1816-1976: Procedures, Patterns, and Insights,@ Journal of Conflict Resolution, Vol. 28, No. 4 (December 1984)
Goemans, H. E. War and Punishment: The Causes of War Termination and the First World War (Princeton, NJ: Princeton University Press, 2000)
Green, Donald P., and Ian Shapiro, Pathologies of Rational Choice Theory: A Critique of Applications in Political Science (New Haven, CT: Yale University Press, 1994)
Herzog, Chaim, The War of Atonement: October, 1973 (Boston, MA: Little, Brown, 1975)
46

Howard, Michael and Peter Paret, eds. and trans., Carl von Clausewitz, On War (Princeton, NJ: Princeton University Press, 1976)
Huth, Paul and Bruce Russett, ATesting Deterrence Theory: Rigor Makes a Difference,@ World Politics, Vol. 42, No. 3 (July 1990)
Ienaga, Saburo, The Pacific War, 1931-1945: A Critical Perspective on Japan’s Role in World War II (New York: Pantheon Books, 1978)
Jervis, Robert, Perception and Misperception in International Politics (Princeton, NJ: Princeton University Press, 1976)
Jervis, Robert "Cooperation Under the Security Dilemma," World Politics, Vol. 30, No. 2 (January 1978)
Jervis, Robert, AWar and Misperception,@ The Journal of Interdisciplinary History, Vol. 18, No. 4 (Spring 1988)
Jervis, Robert, "Hypotheses on Misperception," in G. John Ikenberry, ed., American Foreign Policy: Theoretical Essays (Glenview, IL: Scott, Foresman, and Co. 1989)
Jervis, Robert, ARational Deterrence: Theory and Evidence.@ World Politics Vol. 41, No. 2 (January 1989) (1989b)
Jones, Daniel M., Stuart Bremer, and J. David Singer, “Militarized Interstate Disputes, 1816-1992: Rationale, Coding Rules, and Empirical Patterns, Conflict Management and Peace Science, Vol. 15, No. 2 (Fall 1996).
Jordan, Major Michael C., United States Marine Corps, “The 1973 Arab-Israeli War: Arab Policies, Strategies, and Campaigns,” Marine Corps University Command and Staff College, 1997, online at: <<http://www.globalsecurity.org/military/library/report/1997/Jordan.htm>>.
Kubrick, Stanley, Peter George, and Terry Southern, screenplay, “Dr. Strangelove or: How I Learned to Stop Worrying and Love the Bomb” 1964. Produced and directed by Stanley Kubrick
Lemke, Douglas and Jacek Kugler, “The Evolution of the Power Transition Perspective,” in Douglas Lemke and Jacek Kugler, eds., Parity and War: Evaluations and Extensions of the War Ledger (Ann Arbor, MI: University of Michigan Press, 1996)
Lake, David A. and Robert Powell, “International Relations: A Strategic Choice Approach,” in David A. Lake, and Robert Powell, eds., Strategic Choice and International Relations (Princeton, NJ: Princeton University Press, 1999)
47

Lebow, Richard Ned and Janice Gross Stein, ARational Deterrence Theory: I Think, Therefore I Deter;@ World Politics, Vol. 41, No. 2, (January 1989)
Leeds, Brett Ashley, Andrew G. Long, and Sara McLaughlin Mitchell, “Reevaluating Alliance Reliability: Specific Threats, Specific Promises,” Journal of Conflict Resolution Vol. 44, No. 5 (October 2000)
Leeds, Brett Ashley, “Do Alliances Deter Aggression? The Influence of Military Alliances on the Initiation of Militarized Disputes,” American Journal of Political Science, Vol. 47, No.3 (July 2003)
Levy, Jack S., AMisperception and the Causes of War, Theoretical Linkages and Analytical Problems@ World Politics, Vol. 36, No. 1 (October 1983)
Levy, S. Jack, "The Causes of War: A Review of Theories," in Philip E. Tetlock, Jo L. Husbands, Robert Jervis, Paul C. Stern, and Charles Tilly, eds., Behavior, Society, and Nuclear War, Vol. 1 (New York, NY: Oxford University Press, 1989)
Levy, Jack S., "Preferences, Constraints, and Choices in July 1914," International Security, Vol. 15, No. 3 (Winter 1990-91)
Levy, Jack S., "Prospect Theory, Rational Choice and International Relations," International Studies Quarterly, Vol. 41, No. 1 (1997)
Lieber, Keir A. “Grasping the Technological Peace: The Offense-Defense Balance and International Security,” International Security, Vol. 25, No. 1 (Summer 2000)
Maoz, Zeev Resolve, “Capabilities, and the Outcome of Interstate Disputes, 1816-1976,” Journal of Conflict Resolution, Vol. 27, No.2 (June 1983)
McDermott, Rose and Jacek Kugler, AComparing Rational Choice and Prospect Theory Analyses: The US Decision to Launch Operation >Desert Storm=, January 1991, Journal of Strategic Studies, Vol. 24, No. 3 (September 2000)
Mearsheimer, John J., “Assessing the Conventional Balance: The 3:1 Rules and Its Critics,” International Security, Vol. 13, No. 4 (Spring 1989)
Mearsheimer, John J., The Tragedy of Great Power Politics (New York, NY: Norton, 2001)
Morrow, James, D. “A Continuous=Outcome Expected Utility Theory of War,” The Journal of Conflict Resolution, Vol. 29, No. 3 (September 1985)
48

Morrow, James, D., Game Theory for Political Scientists (Princeton, NJ: Princeton University Press, 1994)
Morrow, James D, “A Rational Choice Approach to International Conflict,” in Nehemia Geva and Alex Mintz, eds., Decisionmaking on War and Peace: The Cognitive-Rational Debate (Boulder, CO: Lynne Rienner Publishers, 1997)
NMC Documentation, “Correlates of War 2 Project National Material Capabilities Data Documentation,” Updated for Version 3.0, July 2, 2004 via: << http://cow2.la.psu.edu/ >>
Paul, T.V., Asymmetric Conflicts: War Initiation by Weaker Powers (Cambridge, Great Britain: Cambridge University Press, 1994)
Pollack, Kenneth M., The Threatening Storm: The Case for Invading Iraq (New York, NY: Random House, 2002).
Posen, Barry R., The Sources of Military Doctrine: France, Britain, and Germany Between the World Wars (Ithaca, NY: Cornell University Press, 1984)
Quattrone, George A. and Amos Tversky, AContrasting Rational and Psychological Analyses of Political Choice,@ American Political Science Review, Vol. 82, No. 3 (September 1988)
Rabinovich, Abraham, The Yom Kippur War: The Epic Encounter That Transformed the Middle East (New York, NY: Schocken Books, 2004)
Reiter, Dan and Allan C. Stam, Democracies at War (Princeton, NJ, Princeton University Press, 2002)
Sabrosky, Alan Ned, “Interstate Alliances: Their Reliability and the Expansion of War”, in J. David Singer, ed., The Correlates of War II: Testing some Realpolitik Models, (New York, NY: Free Press, 1980)
Sagan, Scott D., "The Origins of the Pacific War," The Journal of Interdisciplinary History, Vol. 18, No. 4 (Spring 1988)
Schiff, Zeev, Louis Williams, trans., October Earthquake: Yom Kippur 1973 (Tel Aviv, IS: University Publishing Projects, 1974).
Singer, J. David and Melvin Small, The Wages of War, 1816 - 1965: A Statistical Handbook, (New York: John Wiley and Sons, 1972)
Singer, J. David and Paul F. Diehl, Measuring the Correlates of War, (New York: DIANE Publishing, 1990)
49

Siverson, Randolph M. and Joel King 1979, “Attributes of National Alliance Membership and War Participation,” American Journal of Political Science, Vol. 24, No. 1 (February 1980)
Small, Melvin and J. David Singer, Resort to Arms: International and Civil Wars 1816-1980 (Beverly Hills: Sage Publishing, 1982)
Snyder, Jack, The Ideology of the Offensive: Military Decision Making and the Disasters of 1914 (Ithaca, NY: Cornell University Press, 1984).
Stam, Allan C. Win, Lose, or Draw: Domestic Politics and the Crucible of War (Ann Arbor: University of Michigan Press, 1996)
Stein, Janice Gross, “Threat Based Strategies of Conflict Management: Why Did They Fail in the Gulf,” in Stanley A. Renshon, ed., The Political Psychology of the Gulf War: Leaders, Publics, and the Process of Conflict (Pittsburgh, PA: University of Pittsburgh Press, 1993)
Stoessinger, John G., Why Nations Go To War, 7th ed. (New York: St. Martin’s Press, 1998)
Symposium in International Security on AFormal Methods, Formal Complaints: Debating the Role of Rational Choice in Security Studies,@ Vol. 24, No. 2 (Fall 1999)
Van Evera, Stephen, "The Cult of the Offensive and the Origins of the First World War," International Security, Vol. 9, No. 1 (Summer 1984) Van Evera, Stephen, Causes of War: Power and the Roots of Conflict (Ithaca, NY: Cornell University Press, 1999)
Vasquez, John A., ed., What Do We Know About War? (Lanham, MD: Rowman & Littlefield, 2000)
Walt, Stephen M., The Origins of Alliances (Ithaca, NY: Cornell University Press, 1987)
Waltz, Kenneth, Theory of International Politics (New York, NY: Random House, 1979)
Wang, Kevin and James Lee Ray, “Beginners and Winners: The Fate of Interstate Wars Involving Great Powers Since 1495,” International Studies Quarterly, Vol. 38, No. 1 (March 1994)
Yamamoto, Yoshinobu and Stuart A. Bremer, “Wider Wars and Restless Nights; Major Power Intervention in Ongoing War,” in J. David Singer, ed., The Correlates of War, Vol. 2 (New York, NY: The Free Press, 1980)
50

Zagare, Frank C., ARationality and Deterrence,@ World Politics Vol. 42, No. 2 (January 1990)
51

COW MID War Name YrBeg MID rev COW init MID init IWR init IWR Target
IWR Off. Joiners
IWR Def. Joiners
COW Outcome
MID Outcome
1 89 Franco-Spanish
1823 FRN FRN FRN FRN SPN Y Y
4 189 Russo-Turkish 1828 USR USR USR USR TUR Y Y7 1552 Mexican-
American1846 USA USA USA USA MEX Y Y
10 19 Austro-Sardinian
1848 ITA ITA AUH ITA AUH MOD, TUS
N Stalemate
13 375 First Schleswig-Holstein
1848 GMY GMY GMY GMY DEN Y Compromise
16 175 Roman Republic
1849 AUH, FRN, SIC
FRN AUH AUH, SIC
PAP FRN Y Y
19 1528 La Plata 1851 ARG BRA BRA ARG BRA N N22 57 Crimean 1853 USR TUR USR USR TUR FRN, ITA,
UKGN N
25 8 Anglo-Persian 1856 UKG UKG UKG UKG IRN Y Y28 115 Italian
Unification1859 ITA AUH AUH ITA AUH FRN Y Y
31 1580 Spanish-Moroccan
1859 SPN SPN SPN SPN MOR Y Y
34 112 Italo-Roman 1860 ITA ITA ITA ITA PAP Y Y37 113 Italo-Sicilian 1860 ITA ITA ITA ITA SIC Y Y40 135 Franco-
Mexican1862 FRN, SPN,
UKGFRN FRN, SPN,
UKGFRN MEX N N
43 1519 Ecuadorian-Columbian
1863 COL COL COL COL ECU Y Y
46 194 Second Schleswig-Holstein
1864 GMY GMY GMY AUH, GMY
DEN Y Unclear
49 1590 Lopez 1864 ARG, BRA PAR PAR BRA PAR ARG Y Y52 1482 Spanish-
Chilean1865 SPN SPN SPN SPN CHL PER N Stalemate
55 261 Seven Weeks 1866 GMY GMY AUH GMY, MEC
AUH, BAD, BAV, HAN, HSE, HSG, SAX, WRT
ITA Y Y
58 88 Franco-Prussian
1870 GMY FRN FRN BAD, BAV, GMY, WRT
FRN Y Y
60 1533 First Central American
1876 GUA GUA GUA GUA SAL Y Y
61 187 Russo-Turkish 1877 USR USR USR USR TUR Y Y64 1518 Pacific 1879 BOL, CHL,
PERCHL CHL CHL BOL PER Y Y
65 3725 Anglo-Egyptian
1882 FRN, UKG UKG FRN, UKG UKG EGY Y Y
67 202 Sino-French 1884 FRN FRN CHN FRN CHN Y Y
52
70 1535 Second Central American
1885 GUA GUA GUA GUA SAL N N
72 196 Franco-Thai 1893 FRN FRN FRN FRN THI Y Y73 1490 Sino-Japanese 1894 JPN JPN JPN JPN CHN Y Y
COW MID War Name YrBeg MID rev COW init MID init IWR init IWR Target
IWR Off. Joiners
IWR Def. Joiners COW Outcome
MID Outcome
76 1569 Greco-Turkish 1897 GRC GRC GRC GRC TUR N N79 1557 Spanish-
American1898 USA USA USA USA SPN Y Y
82 31 Boxer Rebellion 1900 JPN, UKG, USR
FRN, JPN, UKG, USA, USR
AUH, FRN, GMY, ITA, JPN, UKG, USA, USR
FRN, JPN, UKG, USA, USR
CHN Y Y
83 3250 Sino-Russian 1900 USR USR USR USR CHN Y N85 180 Russo-Japanese 1904 USR JPN USR USR JPN N N88 1205 Third Central
American1906 GUA, SAL GUA GUA GUA HON, SAL Y Stalemate
91 1202 Fourth Central American
1907 NIC HON NIC HON, SAL Y Y
94 1086 Spanish-Moroccan
1909 SPN SPN SPN SPN MOR Y Y
97 114 Italo-Turkish 1911 TUR ITA ITA TUR ITA N N100 1250 First Balkan 1912 BUL, GRC,
YUGYUG BUL BUL, GRC,
YUGTUR Y Y
103 1251 Second Balkan 1913 GRC, RUM, TUR, YUG
BUL BUL GRC, YUG BUL RUM, TUR Y Y
106 257 World War I 1914 AUH AUH AUH AUH YUG BUL, GMY, TUR
BEL, FRN, GRC, ITA, JPN, JPN, POR, RUM, UKG, USA, USR
N N
109 1219 Russo-Polish 1919 POL, USR USR USR USR POL N N112 1265 Hungarian-Allies 1919 CZE, FRN,
RUM, UKG, YUG
CZE, RUM FRN, ITA, UKG
CZE, RUM HUN Y Y
115 1270 Greco-Turkish 1919 GRC GRC GRC GRC TUR N N116 3134 Franco-Turkish 1919 FRN FRN FRN FRN TUR Tie N117 1272 Lithuanian-Polish 1920 POL POL POL POL LIT Y Y
118 41 Sino-Soviet 1929 USR CHN USR CHN Y Unclear121 129 Manchurian 1931 JPN JPN JPN JPN CHN Y Y124 1027 Chaco 1932 BOL, PAR PAR PAR PAR BOL Y Y125 1129 Saudi-Yemeni 1934 SAU, YAR SAU SAU SAU YAR Y Unclear127 111 Italo-Ethiopian 1935 ITA ITA ETH ITA ETH Y N130 157 Sino-Japanese 1937 JPN JPN JPN JPN CHN Y Unclear133 184 Changkufeng 1938 JPN, USR USR USR USR JPN N Stalemate136 183 Nomonhan 1939 JPN, MON,
USRJPN MON JPN MON, USR N N
53

139 258 World War II 1939 GMY, ITA, JPN
GMY POL GMY POL BUL, FIN, FRN, HUN, ITA, JPN, RUM
AUL, BEL, BRA, BUL, CAN, CHN, ETH, FRN, GRC, ITA, MON, NEW, NOR, NTH, RUM, SAF, UKG, USA, USR, YUG
N N
142 179 Russo-Finnish 1939 USR USR USR USR FIN Y Y145 613 Franco-Thai 1940 THI THI THI THI FRN Y Y147 1238 First Kashmir 1948 PAK IND IND PAK IND Tie N
COW MID War Name YrBeg MID rev COW init MID init IWR init IWR Target
IWR Off. Joiners
IWR Def. Joiners
COW Outcome
MID Outcome
148 1793 Palestine 1948 EGY, IRQ, JOR, LEB, SYR
EGY, IRQ, JOR, LEB, SYR
EGY, IRQ, JOR, LEB, SYR
EGY, IRQ, JOR, LEB, SYR
ISR N N
151 51 Korean 1950 PRK, ROK
PRK PRK PRK ROK CHN AUL, BEL, CAN, COL, ETH, FRN, GRC, NTH, PHI, THI, TUR, UKG, USA
Tie Stalemate
154 606 Russo-Hungarian
1956 USR USR USR USR HUN Y Y
157 200 Sinai 1956 EGY ISR EGY EGY ISR FRN, UKG N N160 199 Assam 1962 CHN, IND CHN IND CHN IND Y Y163 611 Vietnamese 1965 DRV USA USA DRV AUL,
RVN, USA
CAM, PHI, ROK, THI
Y Y
166 1312 Second Kashmir 1965 PAK IND PAK PAK IND Y Stalemate169 1035 Six Day 1967 EGY,
JOR, SYRISR SYR EGY,
JOR, SYRISR N N
172 1480 Israeli-Egyptian 1969 EGY EGY ISR EGY ISR Tie Stalemate175 1206 Football 1969 HON SAL SAL HON SAL N Stalemate178 1447 Bangladesh 1971 IND IND PAK IND PAK Y Y181 1046 Yom Kippur 1973 EGY,
SYREGY, SYR SYR EGY,
IRQ, SYRISR JOR, SAU N Stalemate
184 1293 Turco-Cypriot 1974 TUR TUR TUR TUR CYP Y Y187 1435 Vietnamese-
Cambodian1975 DRV DRV DRV DRV CAM Y Y
189 2069 Ethiopian-Somalian
1977 SOM SOM SOM SOM CUB, ETH N N
190 2141 Ugandan-Tanzanian
1978 UGA UGA UGA LIB, UGA TAZ N N
193 3007 Sino-Vietnamese
1979 CHN CHN CHN CHN DRV Y Y
199 2115 Iran-Iraq 1980 IRQ IRQ IRQ IRQ IRN Tie N202 3077 Falklands 1982 ARG ARG UKG ARG UKG N N205 3442 Israel-Syria
(Lebanon)1982 SYR ISR SYR SYR ISR Tie Stalemate
208 3638 Sino-Vietnamese
1987 CHN CHN DRV CHN DRV Tie Stalemate
54

211 3957 Gulf War 1990 IRQ IRQ IRQ IRQ KUW CAN, EGY, FRN, ITA, MOR, OMA, QAT, SAU, SYR, UAE, UKG, USA
N N
55


![What is the moral basis of war restrictions [jus in bello prohibitions]? Can we create a rational basis for war restrictions?](https://static.fdocuments.net/doc/165x107/56649c815503460f94939ddc/what-is-the-moral-basis-of-war-restrictions-jus-in-bello-prohibitions-can.jpg)