Is There a STEM Worker Shortage? A look at employment ... 2013 resume analysis of American...
34
C I S May 2014 W hile employers argue that there are not enough workers with technical skills, most prior research has found little evidence that such workers are in short supply. is report uses the latest Census Bureau data available to examine the science, technology, engineering, and math (STEM) fields. Consistent with other research, the findings show that the country has more than twice as many workers with STEM degrees as there are STEM jobs. Also consistent with other research, we find only modest levels of wage growth for such workers for more than a decade. Both employment and wage data indicate there is no shortage of STEM workers in the United States. • Using the most common definition of STEM jobs, total STEM employment in 2012 was 5.3 million work- ers (immigrant and native), but there are 12.1 million STEM degree holders (immigrant and native). • Only one-third of native-born Americans with an undergraduate STEM degree holding a job actually work in a STEM occupation. • ere are more than five million native-born Americans with STEM undergraduate degrees working in non-STEM occupations: 1.5 million with engineering degrees, half a million with technology degrees, 400,000 with math degrees, and 2.6 million with science degrees. • An additional 1.2 million natives with STEM degrees are not working — unemployed or out of the labor force in 2012. • Despite the economic downturn, Census Bureau data show that, between 2007 and 2012, about 700,000 new immigrants who have STEM degrees were allowed to settle in the country, yet at the same time, total STEM employment grew by only about 500,000. • Of these new immigrants with STEM degrees, only a little more than a third took a STEM job and about the same share took a non-STEM job. e rest were not working in 2012. • Overall, less than half of immigrants with STEM degrees work in STEM jobs. In particular, just 23 per- cent of all immigrants with engineering degrees work as engineers. • In total, 1.6 million immigrants with STEM degrees worked outside of a STEM field and 563,000 were not working. • e supply of STEM workers is not just limited to those with STEM degrees. Nearly one-third of the na- tion’s STEM workers do not have an undergraduate STEM degree. Is There a STEM Worker Shortage? A look at employment and wages in science, technology, engineering, and math By Steven A. Camarota and Karen Zeigler Steven A. Camarota is the Director of Research and Karen Zeigler is a demographer at the Center for Immigration Studies. 1629 K Street, NW, Suite 600 • Washington, DC 20006 • (202) 466-8185 • [email protected] • www.cis.org
Transcript of Is There a STEM Worker Shortage? A look at employment ... 2013 resume analysis of American...

1
Center for Immigration Studies
1629 K Street, NW, Suite 600, Washington, DC 20006 • Phone 202.466.8185 • Fax 202.466.8076 • www.cis.org
C I S
CIS Letterhead_Layout 1 7/26/12 4:34 PM Page 1
May 2014
While employers argue that there are not enough workers with technical skills, most prior research has found little evidence that such workers are in short supply. This report uses the latest Census Bureau data available to examine the science, technology, engineering, and math (STEM) fields. Consistent
with other research, the findings show that the country has more than twice as many workers with STEM degrees as there are STEM jobs. Also consistent with other research, we find only modest levels of wage growth for such workers for more than a decade. Both employment and wage data indicate there is no shortage of STEM workers in the United States.
• Using the most common definition of STEM jobs, total STEM employment in 2012 was 5.3 million work-ers (immigrant and native), but there are 12.1 million STEM degree holders (immigrant and native).
• Only one-third of native-born Americans with an undergraduate STEM degree holding a job actually work in a STEM occupation.
• There are more than five million native-born Americans with STEM undergraduate degrees working in non-STEM occupations: 1.5 million with engineering degrees, half a million with technology degrees, 400,000 with math degrees, and 2.6 million with science degrees.
• An additional 1.2 million natives with STEM degrees are not working — unemployed or out of the labor force in 2012.
• Despite the economic downturn, Census Bureau data show that, between 2007 and 2012, about 700,000 new immigrants who have STEM degrees were allowed to settle in the country, yet at the same time, total STEM employment grew by only about 500,000.
• Of these new immigrants with STEM degrees, only a little more than a third took a STEM job and about the same share took a non-STEM job. The rest were not working in 2012.
• Overall, less than half of immigrants with STEM degrees work in STEM jobs. In particular, just 23 per-cent of all immigrants with engineering degrees work as engineers.
• In total, 1.6 million immigrants with STEM degrees worked outside of a STEM field and 563,000 were not working.
• The supply of STEM workers is not just limited to those with STEM degrees. Nearly one-third of the na-tion’s STEM workers do not have an undergraduate STEM degree.
Is There a STEM Worker Shortage?A look at employment and wages in science, technology, engineering, and mathBy Steven A. Camarota and Karen Zeigler
Steven A. Camarota is the Director of Research and Karen Zeigler is a demographer at the Center for Immigration Studies.
1629 K Street, NW, Suite 600 • Washington, DC 20006 • (202) 466-8185 • [email protected] • www.cis.org

2
Center for Immigration Studies
• Wage trends are one of the best measures of labor demand. If STEM workers are in short supply, wages should be increasing rapidly. But wage data from multiple sources show little growth over the last 12 years.
• Real hourly wages (adjusted for inflation) grew on average just 0.7 percent a year from 2000 to 2012 for STEM work-ers, and annual wages grew even less — 0.4 percent a year. Wage growth is very modest for most subcategories of engineers and technology workers.
IntroductionPrior Research. Reports by Georgetown University, the Economic Policy Institute (EPI), the Rand Corporation, the Urban Institute, and the National Research Council have all found no evidence that science, technology, engineering and math (STEM) workers are in short supply.1 The press release that accompanied EPI’s 2013 report was very clear that there is “no shortage of STEM workers in the United States.”2 After looking at the evidence from the EPI study, PBS entitled its story on the report, “The Bogus High-Tech Worker Shortage: How Guest Workers Lower US Wages”.3
Rand’s analysis looked backward in time and found that, “Despite recurring concerns about potential shortages of STEM personnel ... we did not find evidence that such shortages have existed at least since 1990, nor that they are on the horizon.”4 A 2013 resume analysis of American technology workers looking for employment and companies seeking to hire workers through the H-1B visa program found that there was a huge supply of qualified applicants for the vast majority of jobs that employers were seeking to fill with foreign workers. Steve Goodman of Bright Media, which conducted the analysis, con-ceded that, “We’re Silicon Valley people, we just assumed the shortage was true. It turns out there is a little Silicon Valley groupthink going on about this, though it’s not comfortable to say that.”5
Hal Salzman, a public policy professor at Rutgers University and one of the authors of the EPI report, observed in a differ-ent article that, “The nation graduates more than two times as many STEM students each year as find jobs in STEM fields.” In his research, he has emphasized the lack of evidence that STEM workers are in short supply, particularly the lack of wage growth.6 After reviewing the same evidence as Salzman, B. Lindsey Lowell of Georgetown University’s Institute for the Study of International Migration and a coauthor of the EPI report, has argued that, “Those who advocate increasing the supply of STEM talent should cool their ardor.”7
In a March 2014 article for the Atlantic Monthly entitled “The Science and Engineering Shortage Is a Myth”, demographer Michael Teitelbaum summarized much of the recent literature on STEM employment. For many years, Teitelbaum directed the Alfred P. Sloan Foundation’s research on the science and engineering labor market. He is currently a researcher at the La-bor and Worklife Program at Harvard Law School. In his Atlantic article he observed that, “No one has been able to find any evidence indicating current widespread labor market shortages or hiring difficulties in science and engineering occupations that require bachelor’s degrees or higher.”8 While Teitelbaum thinks that primary and secondary schools should emphasize math and science more, and that a shortage could possibly develop someday, he is clear that there is not now, nor has there been a shortage of STEM workers. Although a significant body of research confirms this observation, employers and many in Congress continue to push for additional increases in the number of STEM workers allowed into the country.
In recent years, Bill Gates, Mark Zuckerberg, and other employers in technology have provided millions of dollars to lobby Congress to increase the number of workers, including those with STEM degrees allowed into the country. They have argued that the nation needs more of such workers.9 The Chamber of Commerce and other employer groups have worked tirelessly to increase employment-based immigration, for both permanent (green card) and guest workers.10 At the behest of employ-ers, the Gang of Eight’s Immigration bill that passed the Senate in 2013 (S.744) included very large increases in the number of both temporary and permanent STEM workers allowed into the country.11 In the House of Representatives, a number of bills have been introduced designed to increase the number of both temporary and permanent STEM workers allowed into the country.12 The incongruity between what the employment and wage data show and what employers and Congress want is difficult to reconcile.

3
Center for Immigration Studies
MethodsData Sources. This analysis draws primarily on the public-use files of the American Community Survey (ACS) collected by the Census Bureau and to a lesser extent on the Bureau’s Current Population Survey (CPS).13 The 2012 ACS has a sample size of 137,000 STEM degree holders and 57,000 individuals in STEM jobs with at least bachelor’s degrees. As already indicated, the acronym STEM stands for science (life and physical), technology (computer science), engineering, and math. While there are other potential data sources for studying STEM employment, the Census Bureau data has a number of strengths: 1) the ACS sample is very large, providing robust estimates; 2) it is designed to be nationally representative; 3) it is available to the public, and results can be easily replicated by other researchers; 4) it is relatively consistent over time; and 5) because STEM employment, STEM degrees, and earnings all come from the same source, they are directly comparable.
STEM Occupations. Though there are other ways to define STEM jobs, we use the same formulation (based on the ACS) of what constitutes STEM occupations and degrees as the Department of Commerce has used in its analysis.14 Table A1 in the Appendix at the end of this report lists in detail the occupations that are considered STEM. STEM, as defined in this report, includes those considered to be “STEM management”. It should be noted that the Census Bureau reclassifies occupations every few years.15 However, these changes are relatively minor and do not impact our 2012 analysis and also do not affect the broad STEM categories from 2000 to 2012.
While we employ the most common definition of STEM occupations, it is possible to define STEM more broadly. Some have suggested that high school and college teachers, some mangers (beyond STEM mangers), health professions, or even most social scientists should be considered STEM.16 There are a number of problems with including occupations outside of the traditional STEM fields in an analysis of this kind. First, in the context of immigration, the argument for allowing in STEM workers is expressed in terms of a need for more engineers or scientists, not more sociologists or managers. Thus, at least when thinking about immigration policy, it makes sense to limit the analysis to traditional STEM fields.17
There are also limitations in the data that make a very broad definition of STEM difficult. For example, the ACS does not indicate an educator’s subject area, such as math or history. The inclusion of social scientists also seems problematic because a good deal of research in the constituent fields (e.g. anthropology or political science) is qualitative or even normative in nature and goes well beyond even what is normally considered science. In terms of health care professionals, many do have biology undergraduate degrees, but a central idea behind examining STEM fields is that the workers are involved in some way with research and development rather than practitioners, such as nurses or physicians.18 For those wanting to see a de-tailed analysis of the occupational distribution of native-born STEM degree holders working in non-STEM jobs, Table A5 provides this information.
Consistent with most, but not all, research in this field, we confine our analysis of STEM occupations to only those with bach-elor’s degrees or higher. However, the degree does not have to be in a STEM field. Defined in this way there were 5.3 million STEM workers in 2012.19 Limiting the examination to those with at least a bachelor’s degree makes sense because it confines the analysis to only more skilled STEM workers, for whom demand is presumably the highest. Moreover, programs like the H1-B visa as well as all proposals to admit more foreign STEM workers focus on those with at least a bachelor’s degree. Thus, when thinking about STEM workers in the context of immigration policy, it makes sense to compare natives and immigrants with at least this level of education.
STEM Degrees. Beginning in 2009, the ACS began to ask those with bachelor’s degrees about their undergraduate majors in college.20 Table A2 in the Appendix shows the degrees that are considered STEM. Although the ACS records if an individual has a graduate degree, it does not record respondents’ graduate field of study. As a result, throughout this report a STEM degree refers to an individual’s undergraduate education only. The ACS shows that, of native-born Americans with STEM degrees holding any job (STEM and non-STEM), 59 percent have only an undergraduate degree. Of STEM degree holders employed in STEM occupations, 69 percent have only an undergraduate degree.
In this report, we focus on the number of STEM graduates not working in STEM jobs. We report figures for both native-born Americans and immigrants. We use the terms immigrant and foreign-born synonymously. The Census Bureau defines the foreign-born as individuals who are not U.S. citizens at birth.21 We also use the terms native, native-born, and U.S.-born to mean those who are U.S. citizens at birth.

4
Center for Immigration Studies
Recent Trends in STEM OccupationsGrowth in STEM Employment. Figure 1 uses the American Community Survey (ACS) to show the total number of people employed in science, technology, engineering, and math jobs from 2000 to 2012. Table A4 in the Appendix provides numbers and percentages from 2000 to 2012 for immigrants and natives in STEM jobs in more detail than Figure 1. Overall, there were 5.3 million STEM workers (immigrant and native) in 2012, up from 4.3 million in 2000. In 2012, immigrants accounted for 1.4 million of the nation’s STEM workers — 27 percent of the total. Immigrant STEM employment increased 453,000 from 2000 to 2012, accounting for 45 percent of the net gain in STEM employment in the last decade. Even though the number of immigrants entering the country since 2007 has slowed with the economy, immigrants still accounted for 45 percent of STEM employment growth from 2007 to 2012.
Figure 1. Growth in STEM Employment 2000 to 2012
Source: Public-use files of the 2000-2012 American Community Surveys. STEM employment is confined to those with a bachelor’s degree or higher employed in a STEM field.
23%
27%
20%
22%
24%
26%
28%
30%
-
1.0
2.0
3.0
4.0
5.0
6.0
2000 2001 2002 2003 2004 2005 2006 2007 2008 2009 2010 2011 2012
Immigrant Native Immigrant Share
4.3
5.3
Mil
lion
s
Over the last decade, 65 percent of employment growth in science jobs went to immigrants, in technology (computer sci-ence) 45 percent went to immigrants, in engineering 39 percent, and in math 18 percent. There is no question that immigra-tion has had a very significant impact on STEM occupations over the last decade, especially in science and technology.
New Immigrants. In addition to the net change in the number of employed immigrants, we can also examine new arrivals. The ACS asks immigrants when they came to the United States to live. New arrivals and the net increase are not the same because there is significant churn in the foreign-born population as new immigrants arrive each year and some leave the country. Despite the economic downturn, the 2012 ACS shows that there were 704,000 immigrants with STEM degrees who arrived from the beginning of 2007 to the middle of 2012 — 129,000 new arrivals each year on average. These new arrivals are primarily new permanent residents (green card holders), guest workers, and others who have legally immigrated to the United States, as well as a small number of illegal immigrants with STEM degrees who are included in Census Bureau data. Because Census data of this kind tends to undercount immigrants generally and new arrivals in particular, the actual number of new STEM immigrants is higher than estimates from the ACS.22 The ACS does not report immigration category or status

5
Center for Immigration Studies
of these new arrivals, and we do not attempt to impute their statuses. We do know that the vast majority of these immigrants arrived with their STEM undergraduate degrees. That is, they did not earn their degrees in the United States.23
Of these post-2007 immigrants with STEM degrees, a little more than a third (249,000) took a STEM job, a similar share took a job outside of STEM (252,000), and the rest (203,000) were not working in 2012. It is also worth noting that a little over 37,000 post-2007 immigrants with non-STEM undergraduate degrees also found work in a STEM field. Although many do not find work in STEM jobs, the Census Bureau data show that in recent years the United States has admitted about 129,000 immigrants with STEM degrees each year, yet total STEM employment growth since 2000 has averaged only about 84,000 jobs each year (see Table A4). If we examine growth from 2007 to 2012, we find that STEM employment growth was some-what higher, but it still averaged only 105,000 jobs annually. Thus, based on the ACS, the number of new immigrants with STEM degrees admitted each year is by itself higher than the total growth in STEM employment. This is truly extraordinary when one considers that the same data show that the number of U.S.-born STEM graduates is growing by 115,000 a year.24 Given these numbers, it should not be surprising that most STEM graduates (immigrant or native) do not have STEM jobs.
Moreover, as we will see later in this report, there are 6.7 million natives and immigrants already here with STEM degrees working in non-STEM jobs. There are an additional 1.8 million STEM degree holders in the country not working at all. All of this calls into question the current level of STEM immigration. The dramatic increases in STEM immigration called for by employers and many in Congress would seem to be out of step with the absorption capacity of the STEM labor market. It is clearly the case that most new immigrants with STEM degrees are not finding STEM jobs.
The Total Potential STEM Workforce
Natives with STEM Degrees. The top of Table 1 (next page) reports the number of native-born Americans with STEM un-dergraduate degrees working in and out of STEM occupations, based on the 2012 ACS.25 Table 1 reads as follows: In 2012 there were 558,000 natives with technology degrees (computer science) working in technology, 8,000 natives with technology degrees working in math occupations, and so on across the row. In total, there were 603,000 natives with technology degrees working in a STEM job of some kind and another 509,000 with such degrees working outside of any STEM field. Of course, the skills for one STEM job overlap with those from another. For example, someone with a math background can work in other fields requiring quantitative skills. But of all natives with a STEM degree, only about one-third (2.5 million) work in any STEM occupation, while 5.1 million work outside of STEM. (For a more specific information about the spread of natives across the occupations that comprise STEM, Table A9 in the Appendix reports figures for each occupation at the highest level of detail possible with the ACS.)
The right side of Table 1 reports the number of individuals with STEM degrees who are unemployed and those who are out of the labor market — not working or looking for work. If we add together those who are unemployed and those who are entirely out of the labor market (under age 65) to those with STEM degrees that work outside of STEM occupations, there are 6.3 million native-born Americans with STEM degrees not working at STEM jobs. This would seem to be a huge supply of potential STEM workers for the industry to draw upon. This is especially true given that the total number of people (im-migrant and native) working in STEM occupations is only 5.3 million.
Of course, some natives with STEM degrees may not wish to work in STEM. But it would be incorrect to say that STEM jobs do not interest natives. Table A9 in the appendix shows that a majority of workers in all 48 STEM occupations in 2012 were native-born. Thus, it is not the case that there are STEM jobs in which natives show no interest.
Total Population with STEM Degrees. The middle section of Table 1 shows the same information as the top of the table except it reports figures for immigrants. The bottom of the table shows the numbers for immigrants and natives combined. Looking at the combined figures for immigrants and natives at the bottom of Table 1 shows that there are 10.3 million immi-grants and natives working who have STEM degrees and another 1.8 million unemployed or out of the labor force. Of these, 12.1 million (10.3 plus 1.8 million) STEM degree holders, only 3.7 million have STEM jobs. The rest are working outside of any STEM job or are not working at all. (Later in this report we will discuss STEM workers who do not have STEM degrees.)

6
Center for Immigration Studies
Degree
TechnologyMathEngineeringScienceSTEM DegreeNon-STEM Degree
Table 1. Employment by Occupation and Degree for Natives and Immigrants with a Bachelor’s Degree or More (thousands)
Technology
558 89
260 104
1,010 901
Science
5 9
33 319 366 166
Total Working Who Have STEM Degree
1,112 549
2,771 3,139 7,571
n/a
Occupations
Source: Public-use files of the 2012 American Community Survey. Analysis confined to those with a bachelor’s degree or higher.
Engineering
32 15
955 77
1,080 230
Non-STEM Job
509 426
1,515 2,630 5,080
30,550
Not in Labor Force <65 Years of Age
104 92
243 461 900 n/a
Math
8 11
7 9
34 77
Any STEM Job
603 123
1,256 509
2,491 1,374
Unemployed
46 23
106 115 291 n/a
Natives
Degree
TechnologyMathEngineeringScienceSTEM DegreeNon-STEM Degree
Technology
273 33
307 44
657 155
Science
5 3
31 121 160
41
Total Working Who Have STEM Degree
497 151
1,368 762
2,777 n/a
Occupations
Engineering
18 5
310 19
352 35
Non-STEM Job
196 106 717 576
1,595 4,236
Not in Labor Force <65 Years of Age
79 34
177 148 438 n/a
Math
4 4 4 2
14 9
Any STEM Job
301 45
651 186
1,183 241
Unemployed
24 9
59 33
125 n/a
Immigrants
Degree
TechnologyMathEngineeringScienceSTEM DegreeNon-STEM Degree
Technology
830 122 567 148
1,668 1,057
Science
10 12 64
440 526 207
Total Working Who Have STEM Degree
1,609 700
4,139 3,901
10,348 n/a
Occupations
Engineering
51 20
1,265 96
1,432 265
Non-STEM Job
705 532
2,232 3,206 6,675
34,786
Not in Labor Force <65 Years of Age
182 126 420 609
1,338 n/a
Math
12 14 11 10 48 85
Any STEM Job
904 168
1,907 695
3,673 1,614
Unemployed
70 32
165 148 415 n/a
Natives and Immigrants

7
Center for Immigration Studies
Figure 2 shows the large difference between the relatively modest number of STEM jobs and the much larger number of STEM degree holders (immigrant and native). Figure 3 shows the same numbers for the specific STEM degrees. Figure 3 reads as follows: There are 700,000 people with technology degrees not working in technology jobs and another 250,000 not working at all (unemployed or under age 65 and out of the labor force). The total number of people (immigrant and native) with STEM degrees is certainly very large and would seem to be more than adequate to meet the demand for the limited number of STEM jobs.
Figure 2. The number of potential STEM workers (immigrant and native) vastly exceeds the number of STEM jobs.
Source: Public-use files of the 2012 American Community Survey. STEM employment is confined to those with a bachelor’s degree or higher employed in a STEM field.* Includes 1.8 million with STEM degrees unemployed, out of the labor market, and under age 65.
5.3
12.1
8.4
1.6
Total workers in STEM jobs Total with STEM degrees* STEM degree holders not working in a STEM job*
Workers in STEM jobs without STEM degrees
Figure 3. There are an enormous number of STEM degree holders (immigrant and native) not working or working outside of any STEM job.
Source: Public-use files of the 2012 American Community Survey. Analysis confined to those with a bachelor’s degree or higher.
0.71 0.53
2.23 3.21
6.67
0.25 0.16 0.59 0.76 1.75
Technology Math Engineering Science Total
Degree
Working Non-STEM Job
Unemployed or Out of Labor Force

8
Center for Immigration Studies
Share of Natives in Non-STEM Jobs. Table 2 uses the numbers from Table 1 to report the percentages of those with STEM degrees working in their field. Like Table 1, the top of the table reports figures for natives, the middle of the table reports figures for immigrants, and the bottom of the table is for both groups together. Table 2 reads as follows: 50 percent of natives with a technology degree have a technology job. The grayed boxes show the share of those working in the same field as their undergraduate degrees. Thus, only 2 percent of natives with a math degree have a math job, only 34 percent of the U.S.-born with an engineering degree work as an engineer, and 10 percent of those with a science degree have a job in science.
Degree
TechnologyMathEngineeringScienceSTEM Degree
Table 2. Share of Degree Holders Working in and out of Their Fields
Source: Public-use files of the 2012 American Community Survey. Analysis confined to those with a bachelor’s degree or higher.
Natives
Degree
TechnologyMathEngineeringScienceSTEM Degree
Occupations
Immigrants
Degree
TechnologyMathEngineeringScienceSTEM Degree
Occupations
Natives and Immigrants
Technology
50%16%
9%3%
13%
Science
0%2%1%
10%5%
Engineering
3%3%
34%2%
14%
Math
1%2%0%0%0%
Any STEM Job
54%22%45%16%33%
Technology
55%22%22%
6%24%
Science
1%2%2%
16%6%
Engineering
4%3%
23%2%
13%
Math
1%2%0%0%0%
Any STEM Job
61%30%48%24%43%
Technology
52%17%14%
4%16%
Science
1%2%2%
11%5%
Engineering
3%3%
31%2%
14%
Math
1%2%0%0%0%
Any STEM Job
56%24%46%18%35%

9
Center for Immigration Studies
As already discussed, most Americans with STEM undergraduate degrees, including degrees in engineering, do not work in the field in which they earned their undergraduate degrees. The last column in Table 2 reports the share of those with each type of degree working in any STEM job. The table shows only 33 percent of all natives with an undergraduate STEM degree who hold a job do so in a STEM field. It is worth adding that all of these percentages would be lower if we included those with STEM degrees who are unemployed or out of the labor force.
Immigrants in Non-STEM Jobs. The middle section of Table 2 shows that, like natives, most immigrants with STEM de-grees also do not work at a job that corresponds to their undergraduate degrees. Compared to natives, immigrants with tech-nology degrees (computer science) are somewhat more likely to have a job in their field of study than natives with technology degrees — 55 percent vs. 50 percent. The share for immigrants (16 percent) and natives (10 percent) with science degrees who work in science jobs is very low. The percentage of immigrants and natives with math degrees working in math jobs is even lower, just 2 percent for both groups. It should be pointed out that the total number of math jobs is very small, less than 200,000. Therefore, there are not that many opportunities for employment in a math-specific occupation.
Because of a perceived need, there has been significant pressure to admit more immigrant engineers. But Table 2 shows that the share of immigrant engineers holding an engineering job is actually lower than natives — 23 vs. 34 percent. Even if more immigrant engineers are allowed into the country, the available evidence indicates that most will not find work as engineers. This indicates that increasing the number of immigrant engineers allowed into the country is not very efficient at increasing the number of people working as engineers. Overall, there are some differences between immigrants and natives with STEM degrees; however, the majority of both groups work outside of the area in which they earned their undergraduate degrees.
Those Working Outside Their Field. What about STEM degree holders who are not employed in STEM jobs? Table A5 in the Appendix reports the occupational categories of native-born STEM graduates who are not employed in STEM jobs. Overall, healthcare and non-STEM management tend to be the most common non-STEM jobs held by STEM graduates. However, these occupational categories account for only 41 percent of non-STEM employment for STEM degree holders. For those natives with technology degrees, management, office and administrative support, and sales occupations account for about half of their non-STEM employment. For native holders of math degrees, roughly one-fifth teach in high school or college and roughly the same share are in management. About one-third of natives with engineering degrees working at non-STEM jobs are employed in non-STEM management occupations. For natives with science degrees working at non-STEM jobs, about one-third are in some kind of healthcare job and one-fifth are doctors. In general, Table A5 shows that some oc-cupations are more common than others for U.S.-born STEM graduates working outside of STEM occupations. But STEM graduates are spread out in many different occupations, including 66,000 in community and social service jobs, a similar number in protective services (e.g. security guard), 62,000 in food preparation and serving, and 45,000 in building cleaning and maintenance occupations. Non-Degree Holders in STEM Fields. As we have seen, there are many more STEM degree holders than there are STEM jobs. Another aspect of this issue that is sometimes overlooked is that many workers in STEM jobs do not have undergradu-ate degrees in the areas in which they work. When the argument is made that the country needs more workers with technical skills, it is sometimes assumed that to work in a STEM job one has to have a STEM degree. Figure 4 (next page) shows this is not the case. Figure 4 reads as follow: in technology, 70 percent of workers (immigrant and native) do not have a technology undergraduate degree, and 39 percent do not have a STEM degree of any kind. Overall, 52 percent of STEM workers do not have an undergraduate degree in the specific field in which they hold a job. Moreover, 31 percent of all STEM workers do not have a STEM undergraduate degree of any kind. Again, it must be remembered that these individuals do have bachelor’s de-grees, just not in a STEM field. The large share of STEM workers who do not have an undergraduate STEM degree certainly indicates that the supply of STEM workers is much larger and more flexible than is sometimes thought.
The 1.6 million STEM workers without STEM degrees must have gained their training on the job or in some other way. Some surely went back to school and earned a graduate degree in a STEM field. As already discussed, the ACS does not identify the field of study for those with graduate degrees, though it does record that a person has a graduate degree. We do know that the overwhelming majority of non-STEM degree holders who work in STEM jobs do not have graduate degrees. Of the 1.6 million people without STEM undergraduate degrees working in a STEM field, 1.1 million or 70 percent have only an undergraduate degree.

10
Center for Immigration Studies
Figure 4. Many STEM jobs are filled by workers (immigrant and native) without a degree specific to the occupation or without any STEM degree.
Source: Public-use files of the 2012 American Community Survey. Analysis confined to those with a bachelor’s degree or higher.
70%
89%
25%
40%
52% 39%
64%
16%
28% 31%
Without degree specific to field
Without any STEM degree
Technology Math Engineering Science Any STEM Job
It is worth pointing out that the vast majority (85 percent) of those working in STEM occupations without STEM degrees are native-born. This indicates that allowing in large numbers of immigrants who seek STEM employment may create competi-tion for natives who themselves do not have STEM degrees, but who can do such work nonetheless. The large share of STEM workers who do not have a STEM degree of any kind is a clear indication that it would be a mistake to think that the supply of STEM workers is limited only to those who have a STEM degree.
Wages for Those Outside of Their FieldWhile most natives and immigrants who have STEM degrees do not have STEM jobs, this does not necessarily mean that they earn less because of this. It is entirely possible that STEM degree holders who work in non-STEM jobs earn more than those employed in STEM occupations. This may partly explain why so many work in non-STEM fields. On the other hand, it is very possible that immigration is reducing wages or employment opportunities for natives in STEM jobs. This would make non-STEM employment more attractive by default. If this is the case, non-STEM jobs may pay STEM degree holders more than STEM jobs, but this is due to the concentration of immigrants in STEM occupations. We do not know what STEM jobs would have paid absent immigration. We can, however, compare the current wages of natives with STEM degrees who work in their fields with those who work outside of their fields.
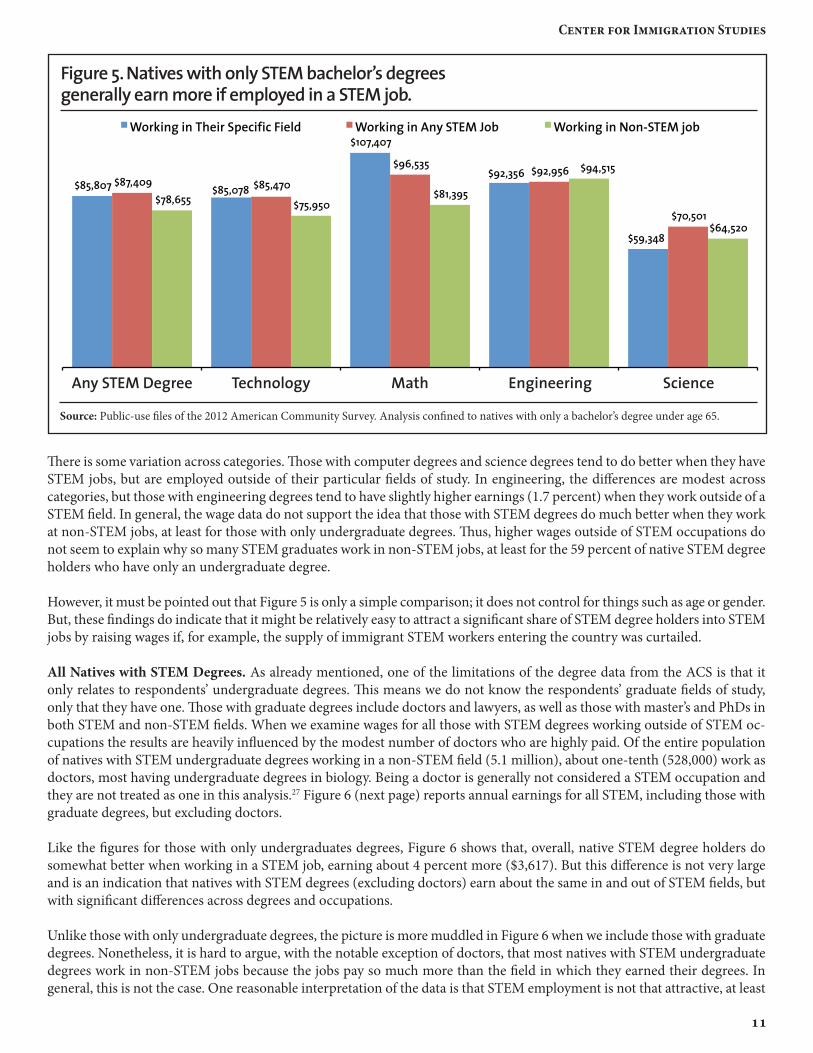
Natives with Only Bachelor’s Degrees. Figure 5 (next page) compares the average annual wages of natives with only STEM bachelor’s degrees working in and out of their fields.26 In 2012, 38 percent of natives with only a STEM bachelor’s degree worked in a STEM job. (As already discussed, if we include those with graduate degrees, the figure for natives is 33 percent in Table 2). Figure 5 shows that, in general, those with STEM bachelor’s degrees working in STEM fields do better than their counterparts in non-STEM fields. Overall, STEM graduates earn about 10 percent ($8,754) more in STEM occupations com-pared to those employed in non-STEM occupations.
11
Center for Immigration Studies
Figure 5. Natives with only STEM bachelor’s degrees generally earn more if employed in a STEM job.
Source: Public-use files of the 2012 American Community Survey. Analysis confined to natives with only a bachelor’s degree under age 65.
$85,807 $85,078
$107,407
$92,356
$59,348
$87,409
$85,470
$96,535 $92,956
$70,501 $78,655
$75,950
$81,395
$94,515
$64,520
Working in Their Specific Field Working in Any STEM Job Working in Non-STEM job
Technology Math Engineering ScienceAny STEM Degree
There is some variation across categories. Those with computer degrees and science degrees tend to do better when they have STEM jobs, but are employed outside of their particular fields of study. In engineering, the differences are modest across categories, but those with engineering degrees tend to have slightly higher earnings (1.7 percent) when they work outside of a STEM field. In general, the wage data do not support the idea that those with STEM degrees do much better when they work at non-STEM jobs, at least for those with only undergraduate degrees. Thus, higher wages outside of STEM occupations do not seem to explain why so many STEM graduates work in non-STEM jobs, at least for the 59 percent of native STEM degree holders who have only an undergraduate degree.
However, it must be pointed out that Figure 5 is only a simple comparison; it does not control for things such as age or gender. But, these findings do indicate that it might be relatively easy to attract a significant share of STEM degree holders into STEM jobs by raising wages if, for example, the supply of immigrant STEM workers entering the country was curtailed.
All Natives with STEM Degrees. As already mentioned, one of the limitations of the degree data from the ACS is that it only relates to respondents’ undergraduate degrees. This means we do not know the respondents’ graduate fields of study, only that they have one. Those with graduate degrees include doctors and lawyers, as well as those with master’s and PhDs in both STEM and non-STEM fields. When we examine wages for all those with STEM degrees working outside of STEM oc-cupations the results are heavily influenced by the modest number of doctors who are highly paid. Of the entire population of natives with STEM undergraduate degrees working in a non-STEM field (5.1 million), about one-tenth (528,000) work as doctors, most having undergraduate degrees in biology. Being a doctor is generally not considered a STEM occupation and they are not treated as one in this analysis.27 Figure 6 (next page) reports annual earnings for all STEM, including those with graduate degrees, but excluding doctors.
Like the figures for those with only undergraduates degrees, Figure 6 shows that, overall, native STEM degree holders do somewhat better when working in a STEM job, earning about 4 percent more ($3,617). But this difference is not very large and is an indication that natives with STEM degrees (excluding doctors) earn about the same in and out of STEM fields, but with significant differences across degrees and occupations.
Unlike those with only undergraduate degrees, the picture is more muddled in Figure 6 when we include those with graduate degrees. Nonetheless, it is hard to argue, with the notable exception of doctors, that most natives with STEM undergraduate degrees work in non-STEM jobs because the jobs pay so much more than the field in which they earned their degrees. In general, this is not the case. One reasonable interpretation of the data is that STEM employment is not that attractive, at least

12
Center for Immigration Studies
Figure 6. Natives with bachelor’s STEM degree or higher generally earn about the same in or out of a STEM job.
Source: Public-use files of the 2012 American Community Survey. Analysis confined to natives with a bachelor’s degree or higher, under age 65, excluding doctors (physicians, surgeons, podiatrists, dentists, and optometrists).
Technology Math Engineering ScienceAny STEM Degree
in terms of wages relative to non-STEM jobs. If STEM workers were in short supply, we would expect to see a significant wage premium for STEM degree holders working in STEM fields compared to those working outside of STEM. But Figure 6 shows this is not the case.
Wage TrendsWhile Census Bureau data from the ACS on those with STEM degrees only go back to 2009, data on wages for workers in STEM occupations go back much further. Wage trends are a key measure of labor demand. As already discussed, those that want to allow more foreign STEM workers into the country argue that the demand exceeds the supply of such workers. One clear sign that demand for workers is outstripping supply would be rapidly rising wages as employers try to recruit and retain the limited number of workers available.
Hourly Wages. Figure 7 (next page) reports average hourly wages for STEM workers from 2000 to 2012 based on the month-ly Current Population Survey (CPS). The CPS is collected by the Census Bureau and is similar to the ACS, but it is smaller and collects data on a monthly basis; it is the primary source of information on unemployment and wages. Table A7 in the Appendix reports more detailed information on average hourly wages for sub-categories of STEM workers using the CPS. (Unlike the ACS, the CPS does not ask about degree field.)
The top of Figure 7 reports hourly wages for STEM workers with only bachelor’s degrees, and the bottom of the figure reports hourly wages for all STEM workers, including those with graduate degrees. Not surprisingly, the graph shows that when those with graduate degrees are included, hourly wages for STEM workers are somewhat higher. However, the overall trends are the same — hourly wages for STEM workers show very modest growth for more than a decade.
Over the entire period of 2000 to 2012, real hourly wages (adjusted for inflation) grew on average just 0.65 percent annually for those with only a bachelor’s degree and 0.71 percent for all STEM workers. Thus, in both cases average hourly wages grew less than 1 percent a year from 2000 to 2012. What growth there has been in hourly wages for STEM workers mostly occurred from 2000 to 2007. There has been almost no hourly wage growth since 2007. Hourly wage growth of less than 1 percent an-nually for over a decade is certainly not the pattern we would expect to see if workers were in short supply.
$91,797 $88,048
$117,600
$99,141
$75,135
101,948 $90,067
$82,954 $89,174
$78,316
Working in Their Specific Field Working in Any STEM Job Working in Non-STEM job
$93,684 $88,718 $99,685 $107,803
$82,571

13
Center for Immigration Studies
Figure 7. Hourly Wages for STEM workers show little growth 2000-2012
Source: Public-use files of the 2000 to 2012 Current Population Surveys. Each year averages 12 months of data. Analysis confined to STEM workers with at least a bachelor’s degree age below age 65. Pareto-imputed mean values for top-coded weekly wages are from the “State of Working America”, 12th edition, Economic Policy Institute, p. 467. Pareto-imputed means for 2012 were provided by EPI sepa-rately. Figures for math tend to be more volatile because of small sample size.
$15
$20
$25
$30
$35
$40
2000 2001 2002 2003 2004 2005 2006 2007 2008 2009 2010 2011 2012
Average Hourly Wages for STEM Workers with Only a Bachelor's Degree in 2012 Dollars
Engineering Technology
All STEM
Science
$15
$20
$25
$30
$35
$40
$45
2000 2001 2002 2003 2004 2005 2006 2007 2008 2009 2010 2011 2012
Average Hourly Wages for STEM Workers with a Bachelor's Degree or Higher in 2012 Dollars
Mathematics Engineering Technology All STEM
Science

14
Center for Immigration Studies
Annual Wages. Hourly wages have the advantage in comparison to annual earnings of controlling for hours worked. On the other hand, annual wages may be seen as providing a more complete picture of trends by reflecting what people are earning on a yearly basis. Figure 8 (next page) reports annual wages from 2000 to 2012 for full-time workers who worked for the entire year based on the ACS. Table A8 in the Appendix reports more detailed annual figures. Figure 8 and Table A8 show the same pattern as hourly wages from the CPS. Real annual wages for STEM workers with only bachelor’s degrees grew on average just 0.32 percent per year from 2000 to 2012 and 0.42 percent for all STEM workers. In fact, all the growth was from 2000 to 2007. From 2007 to 2012, real annual wages actually declined slightly for STEM workers overall. Like the hourly data from the CPS, the lack of growth in annual earnings from the ACS strongly indicates that demand for STEM workers is not outstripping the supply of such workers, at least since 2000.
The Petroleum Engineer Exception. Some may wonder whether the ACS data is able to discern wage growth. In Table A8, we report annual earnings growth for petroleum, mining, and geological engineers, who should have benefited enormously from the massive increase in oil and gas production due to fracking in the United States during recent years. (We do not report hourly figures from the CPS because the sample of petroleum engineers is too small in that data source.) Real an-nual wages for this type of engineer with only an undergraduate degree were $46,000 higher in 2012 than 2000 — 14 times the $3,300 increase for all engineers with only undergraduate degrees. When those with graduate degrees are included, the increase was nearly $51,000 between 2000 and 2012. These findings are entirely consistent with what others have found for this type of engineer.28
This is a clear indication that increases in demand can drive up earnings in a STEM occupation. The laws of supply and de-mand apply to STEM worker wages just as they do to other things in the economy. It is also equally important to note that this finding indicates that Census Bureau data are able to capture an increase in wages. This makes the finding that wages for STEM workers grew modestly in the last decade all the stronger.
Wage trends show no shortage. Overall, the low hourly and annual wage growth for more than a decade indicates that de-mand for STEM workers in general is not particularly strong relative to supply. If it were, wages would be rising quickly, as they have for petroleum engineers. But Figures 7 and 8, along with Tables A7 and A8, show that STEM occupations have experienced a prolonged period of very modest wage increases, much less than 1 percent a year on average. In fact, in re-cent years wage growth has been virtually nonexistent. Like the employment data showing that there are many more STEM graduates than there are STEM jobs, trends in wages and earnings strongly indicate that the supply of workers is adequate to meet the demand.
Even though wage growth has been modest for STEM jobs, the goal of many employers is to keep wages in check by using immigration to increase the supply of workers. Alan Greenspan certainly has made this point. Speaking at a U.S. Treasury conference on U.S. Capital Markets Competitiveness in 2007, Greenspan argued that, “Our skilled wages are higher than anywhere in the world. If we open up a significant window for skilled guest workers, that would suppress the skilled-wage level and end the concentration of income.”29 Greenspan believes that reducing wages for skilled workers, including those in STEM fields, has a number of desirable policy outcomes. Given how active many STEM employers have been in pushing for increases in immigration, they appear to agree with the former Federal Reserve chairman that immigration limits wage growth.
Measuring Wage Growth. With the very notable exception of petroleum engineers, STEM workers have generally experi-enced modest wage growth since 2000. However, some researchers have argued the contrary. Jonathan Rothwell of Brook-ing has made the case that STEM wages have, in fact, increased significantly. In a report arguing the merit of the H-1B visa program, Rothwell and a colleague report that wage growth for U.S.-born workers has been “high” for some types of STEM workers. But inexplicably their analysis of wages is “not adjusted for inflation”. They even make a point of arguing that “nomi-nal wages” (not inflation adjusted) in computer occupations increased from 2000 to 2011 by “2.7 percent each year”.30 But this almost exactly matches the inflation rate over this time period reported by the Bureau of Labor Statistics.31 Thus, there was no wage growth once inflation is taken into account. Adjusting for inflation is a basic component of almost all economic analysis of this kind. Their decision not to incorporate inflation and then argue that wage growth has been “high” makes little sense.
Elsewhere Rothwell has emphasized the “relative” growth of STEM wages compared to non-STEM occupations to explicitly make the case that that there is STEM shortage.32 Given the modest level of real wage growth in STEM occupations (as shown

15
Center for Immigration Studies
Figure 8. Annual wages for STEM workers show little growth over the last decade (2000-2012).
Source: Public-use files of the 2000 to 2012 American Community Surveys. Analysis confined to STEM workers with at least a bachelor’s degree under age 65, working 35 hours or more per week and at least 50 weeks a year. Figures for math tend to be more volatile because of small sample size.
$10,000
$20,000
$30,000
$40,000
$50,000
$60,000
$70,000
$80,000
$90,000
$100,000
2000 2001 2002 2003 2004 2005 2006 2007 2008 2009 2010 2011 2012
Average Annual Wages for STEM Workers with a Bachelor's Degree or Higher (2012 Dollars)
Engineering
All STEM
Mathematics
Science
$10,000
$20,000
$30,000
$40,000
$50,000
$60,000
$70,000
$80,000
$90,000
2000 2001 2002 2003 2 004 2005 2006 2007 2008 2009 2010 2011 2012
Average Annual Wages for STEM Workers with only a Bachelor's Degree (2012 Dollars)
Engineering
Technology
All STEM
Science
Technology

16
Center for Immigration Studies
in Figures 7 and 8 and Tables A7 and A8) it is not clear why Rothwell feels that relative wages are a key measure of labor demand.
It is true that STEM workers have done somewhat better than most non-STEM workers. For example, Table A7 shows that real hourly wages for all STEM workers increased 0.7 percent on average each year from 2000 to 2012 and 0.2 percent for all other workers with at least a bachelor’s degree. Table A8 shows that annual STEM wage growth averaged just 0.4 percent and non-STEM wages declined slightly. The underlying real wage growth is still less than 1 percent a year whether measured hourly and annually. A more reasonable interpretation of the data would be that wage growth has been weak for STEM and non-STEM occupation alike, rather than emphasize the relative difference. Long-term wage growth of less than 1 percent a year is certainly not evidence of a shortage, even if it is higher than for some other occupations.
Conclusion The findings in this analysis are consistent with other examinations of the STEM labor market. We find no evidence of a general shortage of STEM workers. In 2012, there were more than twice as many people with STEM degrees (immigrant and native) as there were STEM jobs — 5.3 million STEM jobs vs. 12.1 million with STEM degrees. Only one-third of natives who have a STEM degree and hold a job do so in a STEM occupation. Further, one-third of STEM workers do not have a STEM degree, indicating that the supply of STEM workers in many cases is very flexible. Perhaps most important, real wages for almost all categories of STEM workers have shown only modest growth — both hourly and annual — for more than a decade. None of this is consistent with the idea that STEM workers are in short supply.
The number of immigrants with STEM degrees entering the country each year by itself is already more than all of the annual growth in STEM employment. Census Bureau data shows that over the last decade the number of STEM workers has grown on average by 84,000, while more than 129,000 new immigrants with STEM degrees have been allowed to settle in the coun-try each year. At the same time, the number of natives with STEM degrees is increasing by about 115,000 a year. These figures, coupled with the enormous number of STEM graduates already in the country not working in a STEM job, and the fact that many STEM jobs are done by workers without STEM degrees, calls into question the current level of STEM immigration. The large increases in STEM workers pushed by employers and many in Congress seem entirely divorced from what is actually going on in the U.S. labor market.
When formulating policy, elected representatives need to consider the actual conditions in the U.S. labor market, rather than simply responding to pressure from employers in industries that wish to hire large numbers of foreign STEM graduates. In general, STEM jobs still provide a good income and middle-class lifestyle. By allowing in many more immigrants than the labor market has been able to absorb, Congress is almost certainly holding down wage growth and reducing the incentive for native-born Americans to undertake the challenging course work that is often necessary for STEM careers. While employers may find this situation desirable, it is difficult to argue this is the interest of American people as a whole.
There may be a specific geographic area or a highly specialized field in which demand really is outstripping supply. However, it makes little sense to allow public policy to be driven by very narrow interests. If there is some special need in a highly tech-nical field then perhaps a narrowly focused immigration program is necessary. But overall, the data indicate that the supply of STEM workers vastly exceeds the number of STEM jobs, and there has been only modest wage growth in these profes-sions. This reality should inform and shape public policy moving forward.

17
Center for Immigration Studies
End Notes 1 “Hard Time: College Majors, Unemployment and Earnings”, Georgetown University, 2013. Hal Salzman, Daniel Kuehn, and B. Lindsay Lowell, “Guestworkers in the high-skill U.S. labor market: An analysis of supply, employment, and wage trends”, Economic Policy Institute, 2013. B. Lindsay Lowell and Hal Salzman, “Into the Eye of the Storm: Assessing the Evi-dence on Science and Engineering Education, Quality, and Workforce Demand”, Urban Institute, 2007. “Assuring the U.S. Department of Defense a Strong Science, Technology, Engineering, and Mathematics (STEM) Workforce”, National Research Council, 2012.
2 “EPI analysis finds no shortage of STEM workers in the United States”, Economic Policy Institute, press release, April 24, 2013.
3 Paul Solman, “The Bogus High-Tech Worker Shortage: How Guest Workers Lower US Wages”, PBS Newshour, July 24, 2013.
4 William P. Butz, Terrence K. Kelly, David M. Adamson, Gabrielle A. Bloom, Donna Fossum, and Mihal E. Gross, “Will the Science and Technology Workforce Meet the Needs of the Federal Government”, Rand Corporation, 2004.
5 Daniel Maurath, “Domestic Prospects Shaded By H1-B Labor Condition Applications”, Bright Media Corporation, 2013.
6 Hal Salzman, “What Shortages? The Real Evidence about the STEM Workforce”, Issues in Science and Technology, Summer 2013.
7 Quoted in Science Insider, October 2009.
8 Michael S. Teitelbaum, “The Myth of the Science and Engineering Shortage”, The Atlantic, March 19, 2014.
9 Matt Egan, “Silicon Valley Goes to Washington to Take on Immigration Reform”, Fox News, March 27, 2014.
10 The Chamber’s immigration website provides a good overview of its views and efforts on immigration. The Business Roundtable’s efforts and position on the issue can be found here.
11 The CBO has estimated the increases that the bill will create in temporary and permanent STEM workers in “S. 744 Border Security, Economic Opportunity, and Immigration Modernization Act”.
12 H.R. 15, with 200 co-sponsors, it is very similar to the S.744 bill that has already passed the Senate. It contains a very large increase in both skilled and unskilled immigration. Also introduced in the House is H.R. 714, which includes 50,000 new vi-sas for STEM workers; H.R.2131, which has 55,000 permanent visas for STEM workers and 90,000 new H-1B visas; and H.R. 1227 referred to as the STAPLE Act, which exempts STEM PhDs from H-1B numerical limitations among other changes designed to increase skilled immigration.
13 The ACS comes from the University of Minnesota’s IPUMS public-use data website. The CPS data come from the Census Bureau’s Dataferrett public-use data website.
14 “STEM: Good Jobs Now and for the Future”, U.S. Department of Commerce Economics and Statistics Administration. Issue Brief #03-11, 2011. David Beede, Tiffany Julian, David Langdon, George McKittrick, Beethika Khan, and Mark Doms, “Women in STEM: A Gender Gap to Innovation”, U.S. Department of Commerce, 2011. Some government statistics are con-fined to those over age 16, others are confined to adults, and still others report figures for those 25 and older.
15 The ACS has consistent occupational codes 2000 to 2004, 2005 to 2009, and 2010 to 2012. Table A1 shows how the codes and categories have changed.
16 See for example the National Science Foundation’s list which can be found here.

18
Center for Immigration Studies
17 Actuaries and architects are two occupations that could more reasonably be considered STEM, but are not considered as such in most research or in this analysis. Architecture is a modestly sized profession, employing about 190,000 people equal to less than 5 percent of STEM occupations defined traditionally. On the other hand, the number of actuaries is small (~25,000) so its inclusion or exclusion would make little difference to this analysis.
18 It should be noted that if health care really is part of STEM, then there are also many more people with STEM degrees that are not included in this or most other analyses, such as pre-med and nursing. These degrees are not considered STEM degrees because they are focused on practicing medicine, not research and development.
19 If we include everyone in STEM occupations, including those who have less than a bachelor’s degree, the total is 7.8 million.
20 Persons can select up to two undergraduate majors to report in the ACS. Throughout this report, we consider a person to have a STEM undergraduate degree if at least one of the majors the person lists was in a STEM field.
21 This includes legal permanent residents, naturalized citizens, temporary workers, and illegal immigrants, but it does not include those born in outlying territories (e.g. Puerto Rico) or those born abroad to American citizen parents.
22 The Department of Homeland Security estimates an undercount of post-1980 immigrants (foreign-born) in the ACS of al-most 1.9 million or 5.8 percent. See Table 2 of “Estimates of the Unauthorized Immigrant Population Residing in the United States: January 2012”. We also know that the ACS undercounts STEM arrivals based on administrative data. For example ,the State Department’s Bureau of Consular Affairs reports more than 775,000 H1-B visas were issued 2007 to 2012. This does not include other temporary visa categories (e.g. L1, F1) in which a significant share of the applicants have STEM degrees, nor does it include new arrivals issued green cards (permanent immigration) who have STEM degrees.
23 The ACS is weighted to reflect the population as of July 1 of the year in which it was taken. Thus, the arrival figures for 2012 reflect the number of immigrants who reported in the survey that they have a STEM degree and entered January 2007 to the end of June 2012 and were still in the country in 2012 — a period of 5.5 years. The vast majority of these individuals arrived with an undergraduate STEM degree. We know this because 93 percent of these recent arrivals were over age 21. (The ACS asks questions making it easy to determine age at arrival.) Based on an analysis of the prior individual years of the ACS (2007 to 2011), there are only a tiny number of post-2007 arrivals living in the country in 2012 with STEM degree that did not have the degree when they arrived.
24 We can measure the growth in native-born STEM graduates using the 2009 ACS forward. As Table 1 shows, there were a total of 8.761 million natives holding STEM degrees in 2012 (working and not working). In 2009, the number was 8.417 million — a growth of roughly 345,000. Thus, annual growth averaged slightly less than 115,000 over the last three years.
25 Table A6 in the Appendix reports the same figures for individuals with only bachelor’s degrees.
26 In 2012, 59 percent of those with a STEM degree had only a bachelor’s degree. Of those in STEM jobs, 69 percent had only a bachelor’s degree.
27 In this analysis, doctors are defined as physicians and surgeons (MDs), podiatrists, dentists, and optometrists. Roughly two-thirds of doctors defined in this way have a STEM undergraduate degree. If we include doctors, then the average an-nual wage for all STEM degree holders in non-STEM jobs is $100,361. This is a good deal higher than the $90,067 for STEM degree holders in non-STEM jobs when doctors are excluded, as shown in Figure 6.
28 Leonard Lynn, Hal Salzman, and Daniel Kuehn, “Dynamics of Engineering Labor Markets: Petroleum Engineering and Responsive Supply”, conference paper presented at “U.S. Engineering in the Global Economy”, sponsored by the Alfred P. Sloan Foundation and the National Bureau of Economic Research, September 26-27, 2011.
29 Bloomberg News, “Greenspan: Let more skilled immigrants in”, March 14, 2007.
30 Jonathan Rothwell and Neil G. Ruizhttp, “H-1B Visas and the STEM Shortage”, Brookings, 2013.
31 The Bureau of Labor Statistics (BLS) reports individual year inflation rates. It must be remembered that inflation builds

19
Center for Immigration Studies
on itself because of the concept of compound interest. The BLS inflation calculator shows that inflation was 30.6% in from 2000 to 2011.
32 As part of an online debate in March of this year, sponsored by the Information Technology & Innovation Foundation, Jonathan Rothwell presented a PowerPoint entitled “The Shortage of STEM Skills”. In the PowerPoint Rothwell reports rela-tive wage growth to make the case that STEM workers are in short supply. The entire debate can be found here. His Power-Point is here.

20
Center for Immigration Studies
Table A1. STEM Occupations in the American Community Survey
Source: Code book from Integrated Public Use Microdata Series (IPUMS) website. IPUMS code book has been corrected for error dealing with occupation 172XXX in years 2000 to 2004.
2000-2004 ACS OCCSOC Code
Computer Science1510XX (see 151121, 151111, 151143, 151199)
151021151030 see 15113X)
151041151061151071 (see 151143)
151081 (see 151122, 151134, 151150, 151143)113021
Mathematics1520211520311520411520XX
Engineers171020172011
1720411720511720611720701720811721101721211721311721411721611721XX172XXX
173010173020173031419031119041
Science191010191020191030191040
192010192021192030192040192099194011194021194031194041
1940511940XX
119121
2005-2009 ACS OCCSOC Code
Computer Science1510XX (see 151121, 151111, 151143, 151199)
151021151030 see 15113X)
151041151061151071 (see 151143)
151081 (see 151122, 151134, 151150, 151143)113021
Mathematics
152031
1520XX (includes 152021, 152041, 1520XX)
Engineers1710201720111720XX 172041172051172061172070172081172110172121172131172141
1721XX
1721YY (includes 172161, 172XXX)173010173020173031419031119041
Science191010191020191030191040
192010192021192030192040192099194011194021194031194041
1940XX (includes 194051) (see 1940YY)
119121
2010-2012 ACS OCCSOC Code
Computer Science151121151111151122151131
15113X151134151150151141151142151143 (includes 1510XX, 151071)151199
113021
Mathematics
152031
1520XX (includes 152021, 152041, 1520XX)
Engineers1710201720111720XX 172041172051172061172070172081172110172121172131172141
1721XX
1721YY (includes 172161, 172XXX)173010173020173031419031119041
Science191010191020191030
1910XX (includes 191040)192010192021192030192040192099194011194021194031
1940XX (includes 194041, 194051)
1940YY (includes 1940XX)119121
Occupation Title
Computer ScienceComputer Scientists & Systems AnalystComputer Scientists & Systems AnalystsComputer & Information Research ScientistsInformation Security AnalystsComputer ProgrammersComputer Software EngineersSoftware Developers, Applications & Systems SoftwareWeb DevelopersComputer Support SpecialistsDatabase AdministratorsNetwork & Computer Systems AdministratorsComputer Network ArchitectsComputer Occupations, All OtherNetwork Systems & Data Communications AnalystsComputer & Information Systems Managers
MathematicsMathematiciansOperations Research AnalystsStatisticiansMisc. Mathematical Scientists & TechniciansMisc. Mathematical sci. occups., w/statisticians
EngineersSurveyors, Cartographers, & PhotogrammetristsAerospace EngineersBiomedical & agricultural engineersChemical EngineersCivil EngineersComputer Hardware EngineersElectrical & Electronics EngineersEnvironmental EngineersIndustrial Engineers, w/Health & SafetyMarine Engineers & Naval ArchitectsMaterials EngineersMechanical EngineersNuclear EngineersPetroleum, mining & geological engineers, w/mine safety engineersEngineers, All OtherMisc. engineeers w/nuclear engineersDraftersEngineering Technicians, Except DraftersSurveying & Mapping TechniciansSales EngineersArchitectural & Engineering Managers
ScienceAgricultural & Food ScientistsBiological ScientistsConservation Scientists & ForestersMedical ScientistsMedical Scientists, & Life Scientists, All OtherAstronomers & PhysicistsAtmospheric & Space ScientistsChemists & Materials ScientistsEnvironmental Scientists & GeoscientistsPhys. Scientists, All OtherAgricultural & Food Science TechniciansBiological TechniciansChemical TechniciansGeological & Petroleum TechniciansGeological & Petroleum Technicians, & Nuclear TechniciansNuclear TechniciansOther life, Phys., & Soc. science techniciansMisc. life, Phys., & Soc. science techs, w/Soc. science research assistants & nuclear techsMisc. Life, Phys., & Soc. Science Technicians, w/Soc. Science Research AssistantsNatural Science Managers

21
Center for Immigration Studies
Table A2. Undergraduate Degrees Considered to Be STEM in the 2012 ACS
Source: Code book from Integrated Public Use Microdata Series (IPUMS) website.
Technology DegreesCensus Code 2100 Computer & Information Systems 2101 Computer Programming & Data Processing 2102 Computer Science 2105 Information Sciences 2106 Computer Admin. Management & Security 2107 Computer Networking & Telecom. Mathematics Degrees Census Code 3700 Mathematics 3701 Applied Mathematics 3702 Statistics & Decision Science 4005 Mathematics & Computer Science Engineering Degrees Census Code 2400 General Engineering 2401 Aerospace Engineering 2402 Biological Engineering 2403 Architectural Engineering 2404 Biomedical Engineering 2405 Chemical Engineering 2406 Civil Engineering 2407 Computer Engineering 2408 Electrical Engineering 2409 Enging. Mechanics Physics & Science 2410 Environmental Engineering 2411 Geological & Geophysical Engineering 2412 Industrial & Manufacturing Engineering 2413 Materials Enging.& Materials Science 2414 Mechanical Engineering 2415 Metallurgical Engineering2416 Mining & Mineral Engineering2417 Naval Architecture & Marine Engineering2418 Nuclear Engineering2419 Petroleum Engineering2499 Miscellaneous Engineering2500 Enging.Technologies2501 Enging.& Industrial Management2502 Electrical Enging.Technology2503 Industrial Production Technologies2504 Mechanical Enging.Related Technologies2599 Miscellaneous Enging.Technologies3801 Military Technologies
Science Degrees Census Code 1103 Animal Sciences1104 Food Science1105 Plant Science & Agronomy1106 Soil Science1301 Environmental Science3600 Biology3601 Biochemical Sciences3602 Botany3603 Molecular Biology3604 Ecology3605 Genetics3606 Microbiology3607 Pharmacology3608 Physiology3609 Zoology3611 Neuroscience3699 Miscellaneous Biology4002 Nutrition Sciences4003 Neuroscience4006 Cognitive Science & Biopsychology5102 Nuclear, Radiology, & Biological Technologies5000 Physical Sciences5001 Astronomy & Astrophysics5002 Atmospheric Sciences & Meteorology5003 Chemistry5004 Geology & Earth Science5005 Geosciences5006 Oceanography5007 Physics

22
Center for Immigration Studies
Table A3. Number of Native STEM Workers with Technology Degrees by Detailed Occupation 2012
Occupation
Cmm-Software Developers, Applications & Sys. SoftwareCmm-Computer ProgrammersMgr-Computer & Information Sys. ManagersCmm-Computer Sys. AnalystsCmm-Computer Support SpecialistsCmm-Computer Occups, All OtherCmm-Network & Computer Sys. Admins.Cmm-Web DevelopersCmm-Computer Network ArchitectsCmm-Database Admins.Cmm-Information Security AnalystsEng-Misc. Engs., w/ Nuclear Engs.Cmm-Operations Research AnalystsEng-Computer Hardware Engs.Eng-Engineering Techs., Except DraftersEng-Civil Engs.Cmm-Computer & Information Research ScientistsEng-Aerospace Engs.Mgr-Architectural & Engineering ManagersEng-Electrical & Electronics Engs.Sci-Physical Scientists, All OtherEng-Industrial Engs., w/ Health & SafetySci-Chemists & Materials ScientistsEng-Mechanical Engs.Sal-Sales Engs.Cmm-Misc. Mathematical Sci. OccupsEng-DraftersEng-Biomedical & Agricultural Engs.Sci-Medical Scientists, & Life Scientists, All Other Eng-Surveyors, Cartographers, & PhotogrammetristsEng-Materials Engs.Sci-Chemical Techs.Sci-Misc. Life, Physical, & Soc. Sci. Techs.Sci-Agricultural & Food ScientistsSci-Biological ScientistsEng-Marine Engs. & Naval ArchitectsSci-Biological Techs.Eng-Chemical Engs.Eng-Petroleum, Mining & Geological Engs., w/ Mining Safety Engs.Sci-Geological & Petroleum Techs., & Nuclear Techs. *Eng-Surveying & Mapping Techs.Total
Percent of Natives with Tech. Degree
in Occupation
27.516.010.3
8.78.66.54.83.32.22.21.91.31.2
.6
.5
.5
.5
.5
.5
.5
.3
.2
.2
.2
.1
.1
.1
.1
.1
.1
.1
.1
.0
.0
.0
.0
.0
.0
.0
.0
.0100.0
Number
165,799 96,483 61,821 52,649 51,815 39,135 29,018 19,944 13,344 13,331 11,175
7,960 7,030 3,804 3,102 3,050 2,995 2,913 2,891 2,888 2,017 1,504 1,135 1,025
894 842 615 602 528 398 329 304 282 274 225 191
83 79 66 51 46
602,637
Source: Public-use files of the 2012 American Community Survey. Analysis confined to native-born STEM workers with a bachelor’s degree or higher. Prefix shows occupational category: Sci. stands for science; Eng. stands for engineering; Cmm. stand for computer science (technology) and math; Sal. stands for sales; and Mgr. stands for management.

23
Center for Immigration Studies
Table A3 Cont. Number of Native STEM Workers with Math Degrees by Detailed Occupation 2012
Occupation
Cmm-Software Developers, Applications & Sys. SoftwareCmm-Computer ProgrammersMgr-Computer & Information Sys. ManagersCmm-Computer Sys. AnalystsCmm-Misc. Mathematical Sci. OccupsCmm-Computer Occups, All OtherEng-Misc. Engs., w/ Nuclear Engs.Cmm-Computer Support SpecialistsCmm-Operations Research AnalystsSci-Physical Scientists, All OtherCmm-Network & Computer Sys. Admins.Cmm-Web DevelopersEng-Aerospace Engs.Cmm-Database Admins.Eng-Civil Engs.Cmm-Computer Network ArchitectsSci-Medical Scientists, & Life Scientists, All Other Mgr-Architectural & Engineering ManagersEng-Industrial Engs., w/ Health & SafetyEng-Electrical & Electronics Engs.Sci-Misc. Life, Physical, & Soc. Sci. TechsEng-Engineering Techs., Except DraftersSci-Environmental Scientists & GeoscientistsSci-Biological ScientistsEng-Mechanical Engs.Sci-Chemists & Materials ScientistsEng-Computer Hardware Engs.Mgr-Natural Sci.s ManagersEng-DraftersSci-Astronomers & PhysicistsCmm-Computer & Information Research ScientistsEng-Surveyors, Cartographers, & PhotogrammetristsSci-Atmospheric & Space ScientistsCmm-Information Security AnalystsSal-Sales Engs.Eng-Biomedical & Agricultural Engs.Eng-Petroleum, Mining & Geological Engs., w/ Mining Safety Engs.Eng-Materials Engs.Eng-Chemical Engs.Eng-Environmental Engs.Sci-Agricultural & Food ScientistsEng-Surveying & Mapping Techs.Sci-Chemical Techs.Eng-Marine Engs. & Naval ArchitectsTotal
Percent of Natives with Math Degree
in Occupation
22.014.410.510.2
6.34.23.02.92.32.32.22.11.71.61.31.21.01.0
.9
.8
.7
.7
.6
.5
.5
.5
.5
.5
.4
.4
.4
.4
.4
.3
.2
.2
.2
.1
.1
.1
.1
.1
.0
.0100.0
Number
27,104 17,785 12,940 12,619
7,732 5,210 3,719 3,626 2,849 2,778 2,742 2,620 2,044 1,982 1,550 1,462 1,254 1,225 1,146
938 872 814 787 676 671 600 563 555 519 506 501 443 434 409 302 221 202 151 145 144 112
96 60 52
123,160
Source: Public-use files of the 2012 American Community Survey. Analysis confined to native-born STEM workers with a bachelor’s degree or higher. Prefix shows occupational category: Sci. stands for science; Eng. stands for engineering; Cmm. stand for computer science (technology) and math; Sal. stands for sales; and Mgr. stands for management.

24
Center for Immigration Studies
Table A3 Cont. Number of Native STEM Workers with Engi-neering Degrees by Detailed Occupation 2012
Occupation
Eng-Misc. Engs., w/ Nuclear Engs.Eng-Civil Engs.Cmm-Software Developers, Applications & Sys. SoftwareEng-Mechanical Engs.Eng-Electrical & Electronics Engs.Mgr-Architectural & Engineering ManagersEng-Aerospace Engs.Eng-Industrial Engs., w/ Health & SafetyMgr-Computer & Information Sys. ManagersEng-Chemical Engs.Cmm-Computer ProgrammersCmm-Computer Sys. AnalystsEng-Petroleum, Mining & Geological Engs., w/ Mining Safety Engs.Cmm-Computer Support SpecialistsEng-Engineering Techs., Except DraftersEng-Materials Engs.Eng-Environmental Engs.Cmm-Computer Occups, All OtherSci-Physical Scientists, All OtherEng-DraftersEng-Computer Hardware Engs.Sal-Sales Engs.Cmm-Network & Computer Sys. Admins.Eng-Biomedical & Agricultural Engs.Cmm-Computer Network ArchitectsCmm-Operations Research AnalystsEng-Marine Engs. & Naval ArchitectsEng-Surveyors, Cartographers, & PhotogrammetristsCmm-Database Admins.Cmm-Web DevelopersSci-Environmental Scientists & GeoscientistsSci-Misc. Life, Physical, & Soc. Sci. Techs.Sci-Medical Scientists, & Life Scientists, All Other Cmm-Information Security AnalystsSci-Chemists & Materials ScientistsSci-Chemical Techs.Sci-Astronomers & PhysicistsMgr-Natural Sci.s ManagersEng-Surveying & Mapping Techs.Sci-Agricultural & Food ScientistsCmm-Misc. Mathematical Sci. OccupsCmm-Computer & Information Research ScientistsSci-Atmospheric & Space ScientistsSci-Biological Techs.Sci-Biological ScientistsSci-Conservation Scientists & ForestersSci-Agricultural & Food Sci. Techs.Sci-Geological & Petroleum Techs., & Nuclear Techs.Total
Percent of Natives with Eng. Degree
in Occupation
17.213.8
9.18.77.56.35.85.03.02.62.31.51.51.41.21.21.11.11.0
.9
.8
.7
.7
.7
.6
.5
.5
.4
.4
.4
.4
.3
.2
.2
.2
.1
.1
.1
.1
.1
.1
.1
.0
.0
.0
.0
.0
.0100.0
Number
215,511 173,420 114,153 109,801
94,576 78,523 73,369 62,211 37,434 32,283 28,603 19,121 19,008 17,028 15,381 15,380 14,258 14,192 12,435 11,700
9,795 9,119 8,673 8,542 7,362 6,200 5,839 5,508 5,355 5,255 4,870 3,727 2,849 2,299 2,160 1,767 1,354 1,092 1,074
923 895 755 545 427 415 408 171 140
1,255,906
Source: Public-use files of the 2012 American Community Survey. Analysis confined to native-born STEM workers with a bachelor’s degree or higher. Prefix shows occupational category: Sci. stands for science; Eng. stands for engineering; Cmm. stand for computer science (technology) and math; Sal. stands for sales; and Mgr. stands for management.

25
Center for Immigration Studies
Table A3 Cont. Number of Native STEM Workers with Science Degrees by Detailed Occupation 2012
Occupation
Sci-Physical Scientists, All OtherSci-Chemists & Materials ScientistsSci-Biological ScientistsSci-Environmental Scientists & GeoscientistsSci-Medical Scientists, & Life Scientists, All OtherSci-Misc. Life, Physical, & Soc. Sci. Techs, w/ Soc. Sci. Cmm-Software Developers, Applications & Sys. SoftwareSci-Chemical Techs.Eng-Misc. Engs., w/ Nuclear Engs.Mgr-Computer & Information Sys. ManagersCmm-Computer Sys. AnalystsCmm-Computer ProgrammersSci-Agricultural & Food ScientistsCmm-Computer Support SpecialistsEng-Engineering Techs., Except DraftersEng-Industrial Engs., w/ Health & SafetyMgr-Architectural & Engineering ManagersCmm-Operations Research AnalystsEng-Civil Engs.Cmm-Computer Occups, All OtherMgr-Natural Sci.s ManagersSci-Conservation Scientists & ForestersSci-Astronomers & PhysicistsEng-Aerospace Engs.Cmm-Network & Computer Sys. Admins.Eng-Environmental Engs.Sci-Atmospheric & Space ScientistsSci-Biological Techs.Cmm-Web DevelopersEng-Mechanical Engs.Eng-Electrical & Electronics Engs.Eng-Surveyors, Cartographers, & PhotogrammetristsCmm-Database Admins.Sci-Agricultural & Food Sci. Techs.Cmm-Misc. Mathematical Sci. OccupsCmm-Computer Network ArchitectsEng-Petroleum, Mining & Geological Engs., w/ Mining Safety Engs.Eng-Chemical Engs.Eng-Biomedical & Agricultural Engs.Eng-Materials Engs.Sci-Geological & Petroleum Techs., & Nuclear Techs. Eng-DraftersCmm-Information Security AnalystsEng-Computer Hardware Engs.Cmm-Computer & Information Research ScientistsEng-Marine Engs. & Naval ArchitectsSal-Sales Engs.Eng-Surveying & Mapping Techs.Total
Percent of Natives with Sci. Degree
in Occupation
12.68.98.68.17.55.85.73.63.42.82.82.62.22.21.61.61.21.21.21.11.1
.9
.9
.9
.9
.9
.8
.8
.8
.8
.7
.7
.7
.6
.5
.4
.4
.4
.3
.3
.3
.3
.2
.2
.2
.1
.1
.1100.0
Number
64,034 45,347 43,790 41,015 38,281 29,676 29,074 18,073 17,256 14,407 14,341 13,339 11,247 11,087
8,316 8,164 6,143 6,026 6,014 5,666 5,372 4,773 4,563 4,545 4,486 4,387 4,172 4,120 4,014 3,867 3,766 3,641 3,421 2,998 2,675 1,973 1,973 1,925 1,663 1,657 1,595 1,473 1,072 1,028
837 624 478 418
508,812
Source: Public-use files of the 2012 American Community Survey. Analysis confined to native-born STEM workers with a bachelor’s degree or higher. Prefix shows occupational category: Sci. stands for science; Eng. stands for engineering; Cmm. stand for computer science (technology) and math; Sal. stands for sales; and Mgr. stands for management.

26
Center for Immigration Studies
Table A4. Number and Share of Immigrants and Natives in STEM Occupations, 2000 to 2012 (thousands)
Natives
TechnologyMathEngineeringScienceAll STEM
Immigrants
TechnologyMathEngineeringScienceAll STEM
Immigrant and Native
TechnologyMathEngineeringScienceAll STEM
Immigrant Share by Occupation
TechnologyMathEngineeringScienceAll STEM
2000
1,518 75
1,217 499
3,310
485 15
328 143 971
2,003 90
1,544 642
4,281
24.2%16.5%21.2%22.3%22.7%
2001
1,598 84
1,262 498
3,442
542 18
326 177
1,062
2,140 102
1,588 675
4,504
25.3%17.2%20.5%26.2%23.6%
2002
1,543 72
1,245 510
3,370
515 13
324 166
1,017
2,058 85
1,568 676
4,388
25.0%15.0%20.6%24.5%23.2%
2003
1,551 60
1,262 504
3,378
529 14
340 181
1,064
2,080 74
1,602 685
4,442
25.4%18.5%21.2%26.4%23.9%
2004
1,538 79
1,291 503
3,412
560 12
330 187
1,090
2,098 92
1,621 691
4,501
26.7%13.4%20.3%27.1%24.2%
2005
1,573 84
1,290 493
3,440
592 17
352 172
1,133
2,165 101
1,642 665
4,573
27.4%16.5%21.4%25.9%24.8%
2006
1,635 85
1,300 506
3,527
647 19
361 196
1,222
2,282 103
1,661 702
4,749
28.4%17.9%21.7%27.9%25.7%
2007
1,673 90
1,333 481
3,578
643 18
357 167
1,185
2,316 108
1,690 648
4,762
27.8%16.4%21.1%25.8%24.9%
2008
1,729 91
1,359 529
3,708
682 20
383 192
1,278
2,411 112
1,743 721
4,986
28.3%18.3%22.0%26.7%25.6%
2009
1,771 96
1,282 521
3,669
696 24
366 197
1,283
2,467 119
1,648 718
4,952
28.2%19.8%22.2%27.5%25.9%
2010
1,722 100
1,286 517
3,624
715 22
372 217
1,326
2,436 122
1,658 734
4,950
29.3%18.2%22.4%29.6%26.8%
2011
1,816 123
1,275 528
3,742
768 23
357 218
1,365
2,584 146
1,632 746
5,107
29.7%15.7%21.9%29.2%26.7%
2012
1,912 111
1,310 532
3,864
813 23
387 202
1,424
2,724 133
1,697 733
5,288
29.8%16.9%22.8%27.5%26.9%
Source: Public-use files of the 2000 to 2012 American Community Survey. Analysis confined to those with a bachelor’s degree or higher.

27
Center for Immigration Studies
Table A5. Occupational Categories for Natives with Technology Degrees Not Working in STEM Occupations, 2012 Occupation
ManagementOffice and Administrative SupportSales and Related Education and training Post Secondary (college) Teachers High School TeachersBusiness OperationsInstallation, Maintenance, and Repair Arts, Design, Entertainment, Sports, and MediaFinancial SpecialistsProductionTransportation and Material Moving.Healthcare Practitioners and Technical Doctors* Laboratory Technologists & TechniciansProtective Service Personal Care and ServiceLegalCommunity and Social ServicesConstructionFood Preparation and ServingMilitaryBuilding and Grounds Cleaning and MaintenanceHealthcare supportArchitectsLife, Physical, and Social ScienceExtraction, Farming and Fishing (combined)ActuariesTotal
Percent
25.313.811.4
7.92.9
.67.75.44.44.53.22.62.1
.4
.22.01.51.51.41.31.2
.9
.6
.6
.4
.2
.1
.0100.0
Frequency
128,914 70,047 57,832 40,150 14,683
2,889 39,314 27,306 22,583 23,076 16,521 13,168 10,906
2,345 1,160
10,436 7,708 7,531 6,973 6,689 5,888 4,522 3,084 2,917 1,953 1,159
669 72
509,418
Source: Public-use files of the 2012 American Community Survey. Analysis confined to native-born STEM workers with a bachelor’s degree or higher. *Physicians, surgeons, podiatrists, dentists, and optometrists.

28
Center for Immigration Studies
Table A5 Cont. Occupational Categories for Natives with Math Degrees Not Working in STEM Occupations, 2012 Occupation
Education and training Post Secondary (college) Teachers High School TeachersManagementOffice and Administrative SupportSales and Related Financial SpecialistsBusiness OperationsHealthcare Practitioners and Technical Doctors* Laboratory Technologists & TechniciansActuaries LegalArts, Design, Entertainment, Sports, and MediaProductionCommunity and Social ServicesTransportation and Material Moving.Personal Care and ServiceFood Preparation and ServingMilitaryProtective Service Installation, Maintenance, and Repair ConstructionBuilding and Grounds Cleaning & MaintenanceLife, Physical, and Social ScienceArchitects Healthcare supportExtraction, Farming and Fishing (combined)Total
Percent
30.711.5
6.517.2
7.87.16.75.95.33.3
.22.52.52.01.81.61.51.21.1
.9
.8
.8
.8
.7
.4
.3
.2
.1100.0
Frequency
130,777 48,942 27,654 73,152 33,394 30,218 28,477 25,274 22,627 14,069
741 10,731 10,727
8,600 7,716 6,994 6,220 4,995 4,712 3,800 3,429 3,342 3,320 3,007 1,619 1,329
895 495
425,850
Source: Public-use files of the 2012 American Community Survey. Analysis confined to native-born STEM workers with a bachelor’s degree or higher. *Physicians, surgeons, podiatrists, dentists, and optometrists.

29
Center for Immigration Studies
Table A5 Cont. Occupational Categories for Natives with Engineering Degrees Not Working in STEM Occupations, 2012 Occupation
ManagementSales and Related Business OperationsEducation and training Post Secondary (college) Teachers High School TeachersOffice and Administrative SupportProductionArts, Design, Entertainment, Sports, and MediaConstructionHealthcare Practitioners and Technical Doctors* Laboratory Technologists & TechniciansInstallation, Maintenance, and Repair Transportation and Material Moving.Financial SpecialistsLegalProtective Service MilitaryCommunity and Social ServicesFood Preparation and ServingBuilding and Grounds Cleaning & MaintenancePersonal Care and ServiceArchitects Extraction, Farming and Fishing (combined)Healthcare supportLife, Physical, and Social ScienceActuariesTotal
Percent
35.511.4
6.96.83.3
.95.94.93.13.33.31.8
.13.33.12.82.51.41.21.0
.9
.9
.7
.4
.3
.2
.2
.0100.0
Frequency
537,297 172,125 104,401 102,965
49,762 12,884 89,896 74,568 46,886 50,732 50,658 27,645
1,941 49,279 47,449 41,858 37,898 21,290 18,102 14,987 13,725 13,314 10,277
5,842 5,184 2,835 2,759
663 1,514,990
Source: Public-use files of the 2012 American Community Survey. Analysis confined to native-born STEM workers with a bachelor’s degree or higher. *Physicians, surgeons, podiatrists, dentists, and optometrists.

30
Center for Immigration Studies
Table A5 Cont. Occupational Categories for Natives with Science Degrees Not Working in STEM Occupations, 2012 Occupation
Healthcare Practitioners and Technical Doctors* Laboratory Technologists & TechniciansManagementEducation and training Post Secondary (college) Teachers High School TeachersSales and Related Office and Administrative SupportBusiness OperationsLegalProductionArts, Design, Entertainment, Sports, and MediaPersonal Care and ServiceFinancial SpecialistsHealthcare supportFood Preparation and ServingCommunity and Social ServicesTransportation and Material MovingProtective Service Building and Grounds Cleaning & MaintenanceConstructionInstallation, Maintenance, and Repair Extraction, Farming and Fishing (combined)Life, Physical, and Social ScienceMilitaryArchitects Actuaries Total
Percent
33.418.4
2.314.713.6
6.41.87.26.24.32.22.11.81.81.81.71.41.41.31.21.0
.9
.6
.5
.5
.3
.2
.0100.0
Frequency
879,709 484,160
59,581 387,375 358,221 167,506
46,122 189,200 163,210 111,922
57,014 54,015 46,385 48,083 46,260 43,601 37,561 37,311 34,625 31,229 25,741 24,725 15,947 12,661 11,903
7,714 5,082
513 2,630,007
Source: Public-use files of the 2012 American Community Survey. Analysis confined to native-born STEM workers with a bachelor’s degree or higher. *Physicians, surgeons, podiatrists, dentists, and optometrists.

31
Center for Immigration Studies
Degree
TechnologyMathEngineeringScienceSTEM DegreeNon-STEM Degree
Table A6. Employment by Occupation and Degree for Natives and Immigrants with only a Bachelor’s Degree, 2012 (thousands)
Technology
464 55
179 64
761 677
Science
3 3
13 164 183
94
Total Working Who Have STEM Degree
882 285
1,831 1,463 4,461
n/a
Occupations
Source: Public-use files of the 2012 American Community Survey. Analysis confined to those with only a bachelor’s degree.
Engineering
24 8
670 44
747 179
Non-STEM Job
385 216 965
1,188 2,754
20,120
Not in Labor Force <65 Years of Age
86 54
169 312 621 n/a
Math
6 3 3 3
15 45
Any STEM Job
497 69
866 275
1,706 995
Unemployed
39 13 76 75
203 n/a
Natives
Degree
TechnologyMathEngineeringScienceSTEM DegreeNon-STEM Degree
Technology
138 11
151 13
313 91
Science
2 0 6
20 28 12
Total Working Who Have STEM Degree
278 63
688 227
1,256 n/a
Occupations
Engineering
10 2
136 6
153 24
Non-STEM Job
126 49
394 188 757
2,778
Not in Labor Force <65 Years of Age
53 17
115 78
263 n/a
Math
3 1 1 0 5 3
Any STEM Job
152 14
295 39
500 130
Unemployed
16 6
34 16 72
n/a
Immigrants
Degree
TechnologyMathEngineeringScienceSTEM DegreeNon-STEM Degree
Technology
602 66
330 77
1,074 768
Science
5 3
20 183 211 106
Total Working Who Have STEM Degree
1,160 348
2,519 1,690 5,717
n/a
Occupations
Engineering
34 10
806 50
900 203
Non-STEM Job
511 265
1,359 1,377 3,511
22,898
Not in Labor Force <65 Years of Age
139 72
284 390 885 n/a
Math
8 4 5 4
20 48
Any STEM Job
649 83
1,160 313
2,206 1,125
Unemployed
55 18
111 91
275 n/a
Natives and Immigrants

32
Center for Immigration Studies
Tabl
e A7.
Hour
ly W
ages
for W
orke
rs in
STEM
Occ
upat
ions
2000
to 20
12 (i
n 20
12 d
olla
rs)
Bach
elor
’s O
nly
Tech
nolo
gy (C
ompu
ter S
cien
ce)
Com
pute
r and
info
rmat
ion
syst
ems m
anag
ers
Com
pute
r sci
entis
ts a
nd sy
stem
s ana
lyst
s C
ompu
ter p
rogr
amm
ers
Mat
hem
atic
s*En
gine
erin
g C
ivil
engi
neer
s E
lect
rical
and
elec
tron
ic e
ngin
eers
Mec
hani
cal e
ngin
eers
Scie
nce
Che
mist
s and
mat
eria
ls sc
ient
ists
Bio
logi
cal S
cien
tists
Env
ironm
enta
l Sci
entis
ts P
hysic
al S
cien
tists
All
STEM
Oth
er
Bach
elor
’s an
d H
ighe
r
Tech
nolo
gy (C
ompu
ter S
cien
ce)
Com
pute
r and
info
rmat
ion
syst
ems m
anag
ers
Com
pute
r sci
entis
ts a
nd sy
stem
s ana
lyst
s C
ompu
ter p
rogr
amm
ers
Mat
hem
atic
s*En
gine
erin
g C
ivil
engi
neer
s E
lect
rical
and
elec
tron
ic e
ngin
eers
Mec
hani
cal e
ngin
eers
Scie
nce
Che
mist
s and
mat
eria
ls sc
ient
ists
Bio
logi
cal S
cien
tists
Env
ironm
enta
l Sci
entis
ts P
hysic
al S
cien
tists
All
STEM
Oth
er
** ** ** **
2000
35.1
8n/
a35
.75
34.5
342
.70
34.8
732
.98
37.8
335
.69
27.0
527
.51
23.4
9n/
a33
.41
34.2
727
.72
36.9
2n/
a37
.67
35.7
341
.14
37.1
435
.38
40.1
237
.82
31.6
031
.98
26.6
9n/
a36
.42
36.3
230
.17
2001
36.4
6n/
a37
.34
35.7
729
.92
36.1
535
.47
38.6
634
.83
26.3
627
.42
22.2
1n/
a29
.09
35.2
328
.32
37.7
6n/
a38
.77
36.2
438
.70
37.7
735
.36
40.3
537
.01
31.2
133
.78
27.3
7n/
a35
.39
36.8
331
.21
2002
35.8
8n/
a36
.71
34.9
423
.55
35.9
734
.47
39.2
237
.87
27.6
931
.82
25.4
7n/
a34
.55
34.9
628
.53
38.0
4n/
a38
.84
36.8
734
.43
37.7
636
.21
41.0
138
.69
31.9
935
.84
31.1
4n/
a36
.70
37.0
331
.12
2003
36.3
944
.57
35.3
734
.69
33.7
636
.85
37.0
339
.49
37.6
128
.00
30.8
524
.78
32.3
327
.71
35.5
228
.30
37.6
945
.73
36.7
535
.13
34.6
238
.39
38.3
441
.67
38.0
631
.19
31.3
328
.69
33.7
537
.56
36.8
930
.91
2004
35.6
841
.96
34.3
034
.22
33.5
236
.38
33.0
938
.79
32.7
826
.93
30.3
919
.19
24.2
925
.64
34.8
827
.86
37.3
243
.35
34.9
635
.54
35.5
238
.23
34.6
439
.42
36.1
931
.32
29.8
228
.29
28.1
242
.24
36.6
830
.54
2005
35.3
439
.69
33.5
134
.16
38.4
335
.70
33.0
738
.71
35.5
427
.04
28.6
825
.72
35.2
132
.19
34.5
328
.14
37.5
941
.91
36.0
935
.32
41.2
838
.12
36.0
640
.12
37.2
932
.92
37.1
128
.02
39.3
138
.41
37.0
830
.76
2006
36.3
040
.62
36.9
835
.06
36.0
836
.32
36.2
239
.29
33.2
529
.14
29.9
426
.00
34.3
332
.77
35.4
728
.13
38.3
943
.08
38.9
535
.77
36.2
039
.06
38.8
942
.62
35.8
833
.24
36.0
928
.44
37.4
739
.24
37.7
430
.79
2007
37.6
843
.61
36.6
737
.51
35.2
837
.65
37.7
539
.44
37.1
928
.47
34.0
928
.34
29.4
628
.25
36.6
428
.15
39.0
845
.45
38.2
637
.67
39.1
539
.35
39.3
341
.82
39.3
333
.64
35.1
329
.19
35.7
141
.41
38.3
830
.77
2008
37.3
045
.47
36.4
534
.70
32.9
436
.27
35.4
136
.70
39.2
826
.86
31.2
327
.35
29.9
028
.47
35.8
128
.12
38.8
746
.44
37.6
736
.54
34.8
239
.12
39.1
341
.47
40.7
833
.02
35.0
332
.64
33.9
638
.63
38.0
930
.83
2009
36.8
945
.70
37.2
237
.53
30.1
137
.28
37.5
539
.12
40.3
231
.61
38.4
731
.05
37.0
044
.55
36.3
227
.69
39.2
346
.56
39.0
439
.03
35.4
040
.22
40.9
744
.02
39.9
834
.85
36.8
030
.98
36.2
837
.71
38.8
330
.84
2010
38.3
644
.39
38.0
335
.07
34.9
537
.89
35.2
142
.73
35.9
328
.53
34.6
025
.90
30.2
126
.75
37.0
828
.27
40.5
746
.40
39.5
535
.60
37.8
540
.72
37.8
545
.07
36.2
632
.89
40.3
827
.81
35.7
832
.27
39.4
431
.31
2011
37.2
341
.30
39.1
135
.97
36.3
336
.95
36.9
139
.83
36.6
928
.98
32.0
528
.32
35.6
331
.90
36.2
127
.38
39.4
343
.62
39.7
637
.46
38.4
238
.98
37.7
942
.16
37.6
933
.15
38.1
528
.49
40.4
137
.44
38.3
430
.41
2012
38.0
543
.75
36.1
936
.85
38.5
537
.58
36.9
138
.88
36.3
429
.23
31.6
326
.11
33.1
433
.86
36.9
327
.58
40.3
545
.00
38.2
139
.30
39.8
040
.34
37.9
142
.04
37.8
033
.73
34.2
431
.95
38.4
538
.00
39.4
030
.75
Aver
age
Wag
e G
row
th 2
000-
2012
0.7%
-0.2
%0.
1%0.
6%-0
.8%
0.6%
1.0%
0.2%
0.2%
0.7%
1.2%
0.9%
0.2%
0.1%
0.6%
0.0%
0.8%
-0.1
%0.
1%0.
8%-0
.3%
0.7%
0.6%
0.4%
0.0%
0.6%
0.6%
1.6%
1.2%
0.4%
0.7%
0.2%
Sour
ce: P
ublic
-use
file
s of t
he 2
000
to 2
012
Curr
ent P
opul
atio
n Su
rvey
.. Ea
ch y
ear a
vera
ges 1
2 m
onth
s of d
ata.
Ana
lysis
confi
ned
to S
TEM
wor
kers
with
at le
ast a
bac
helo
r’s d
egre
e a
ge 6
4 an
d un
der.
Pare
to-im
pute
d m
ean
valu
es fo
r top
-cod
ed w
eekl
y w
ages
are
from
the
“Sta
te o
f Wor
king
Am
eric
a”, 1
2th
editi
on, E
cono
mic
Pol
icy
Inst
itute
, p. 4
67. V
alue
s for
201
2 w
ere
prov
ided
by
EPI
sepa
rate
ly.
* Fig
ures
for m
ath
tend
to b
e m
ore
vola
tile
beca
use
of it
s sm
all s
ampl
e siz
e.**
* A
nnua
l inc
reas
e is
from
200
3 to
201
2.

33
Center for Immigration Studies
Tabl
e A8.
Ann
ual E
arni
ngs f
or W
orke
rs in
STEM
Occ
upat
ions
2000
to 20
12 (i
n 20
12 d
olla
rs)
Bach
elor
’s O
nly
Tech
nolo
gy (C
ompu
ter S
cien
ce)
Com
pute
r and
info
rmat
ion
syst
ems m
anag
ers
Com
pute
r Sci
entis
ts a
nd S
yste
ms A
naly
st C
ompu
ter P
rogr
amm
ers
Mat
h*En
gine
erin
g C
ivil
Engi
neer
s E
lect
rical
and
Ele
ctro
nics
Eng
inee
rs M
echa
nica
l Eng
inee
rs P
etro
leum
eng
inee
rSc
ienc
e C
hem
ists a
nd M
ater
ials
Scie
ntist
s B
iolo
gica
l Sci
entis
ts E
nviro
nmen
tal S
cien
tists
Phy
sical
Sci
entis
tsA
ll ST
EMO
ther
Bach
elor
’s an
d H
ighe
r
Tech
nolo
gy (C
ompu
ter S
cien
ce)
Com
pute
r and
info
rmat
ion
syst
ems m
anag
ers
Com
pute
r Sci
entis
ts a
nd S
yste
ms A
naly
st C
ompu
ter P
rogr
amm
ers
Mat
h*En
gine
erin
g C
ivil
Engi
neer
s E
lect
rical
and
Ele
ctro
nics
Eng
inee
rs M
echa
nica
l Eng
inee
rs P
etro
leum
eng
inee
rSc
ienc
e C
hem
ists a
nd M
ater
ials
Scie
ntist
s B
iolo
gica
l Sci
entis
ts E
nviro
nmen
tal S
cien
tists
Phy
sical
Sci
entis
tsA
ll ST
EMO
ther
2000
$82
,896
$
101,
544
$82
,215
$
82,3
82
$73
,252
$
85,5
38
$75
,668
$
95,4
44
$78
,791
$
86,4
48
$58
,617
$
63,2
00
$48
,492
$
63,6
82
$59
,173
$
81,3
88
$69
,380
$87
,485
$
110,
730
$84
,585
$
85,6
11
$81
,441
$
89,8
02
$82
,530
$
97,5
84
$83
,626
$
84,3
70
$74
,782
$
77,4
16
$58
,086
$
70,0
09
$80
,576
$
86,4
49
$78
,989
2001
$86
,320
$1
11,1
75
$81
,603
$
82,8
03
$80
,323
$
87,3
92
$83
,794
$
91,2
19
$83
,527
$1
17,6
56
$62
,673
$
67,9
37
$56
,969
$
65,3
31
$61
,826
$
84,5
66
$70
,710
$91
,516
$
116,
875
$88
,324
$
85,0
03
$88
,437
$
92,7
26
$86
,517
$
97,3
71
$86
,764
$
122,
583
$77
,461
$
78,8
74
$64
,183
$
73,0
87
$82
,209
$
89,9
53
$79
,810
2002
$87
,527
$1
08,1
53
$86
,020
$
83,2
58
$76
,082
$
87,8
66
$82
,948
$
91,6
67
$87
,913
$1
10,4
05
$63
,618
$
70,1
61
$58
,742
$
71,8
56
$60
,565
$
85,1
61
$71
,127
$92,
119
$113
,412
$
89,2
36
$86
,927
$
86,0
16
$94
,253
$
87,2
26
$100
,844
$
89,7
69
$109
,900
$
76,4
44
$82
,579
$
63,5
06
$76
,388
$
84,4
78
$90
,528
$
80,8
99
2003
$85
,595
$1
04,4
52
$83
,581
$
82,3
43
$73
,712
$
86,2
82
$80
,977
$
93,2
37
$83
,157
$1
09,7
39
$61
,148
$
67,2
12
$56
,429
$
69,5
49
$58
,890
$
83,2
80
$69
,784
$90
,831
$1
12,3
42
$89
,151
$
84,5
75
$91
,546
$
92,3
62
$85
,828
$
98,9
69
$87
,754
$1
09,8
43
$76
,030
$
75,9
39
$64
,946
$
77,9
87
$79
,073
$
89,2
60
$79
,945
2004
$89
,385
$1
15,2
06
$86
,880
$
84,3
02
$85
,620
$
91,2
03
$84
,539
$
96,2
77
$87
,912
$1
28,3
10
$60
,881
$
66,6
51
$53
,724
$
63,3
14
$62
,870
$
87,1
95
$70
,677
$96
,000
$1
26,4
08
$94
,461
$
87,2
92
$92
,682
$
98,8
86
$88
,679
$1
06,4
39
$93
,059
$1
30,2
85
$77
,972
$
79,8
22
$65
,415
$
79,4
15
$85
,460
$
94,4
02
$79
,231
2005
$84
,277
$1
02,5
73
$80
,039
$
80,0
39
$81
,239
$
88,0
41
$85
,537
$
93,1
69
$84
,315
$1
09,9
21
$60
,979
$
69,0
04
$55
,350
$
65,2
52
$63
,188
$
83,4
59
$70
,988
$89
,399
$1
08,3
67
$86
,556
$
83,1
54
$87
,493
$
93,9
42
$89
,302
$
98,8
98
$87
,901
$1
11,4
87
$77
,032
$
81,6
52
$63
,607
$
77,6
78
$85
,854
$
89,3
18
$81
,396
2006
$84
,446
$1
04,8
81
$81
,283
$
78,9
12
$75
,173
$
87,3
92
$83
,114
$
92,9
20
$84
,565
$1
31,6
12
$63
,142
$
67,1
51
$60
,819
$
72,5
39
$63
,478
$
83,4
73
$70
,184
$89
,368
$1
11,7
00
$86
,083
$
82,4
74
$87
,902
$
93,7
15
$88
,435
$
98,8
35
$87
,491
$1
33,3
25
$78
,541
$
79,7
69
$65
,543
$
86,2
81
$87
,825
$
89,4
07
$80
,430
2007
$85
,816
$1
05,2
96
$83
,885
$
81,3
83
$78
,562
$
89,1
48
$88
,373
$
94,0
73
$82
,296
$1
39,3
00
$64
,733
$
67,9
98
$57
,416
$
75,8
13
$70
,228
$
85,1
20
$71
,123
$91
,101
$1
12,0
91
$89
,124
$
83,8
87
$88
,593
$
95,3
66
$91
,864
$
99,2
31
$86
,243
$1
32,2
78
$79
,719
$
80,1
39
$65
,457
$
86,7
55
$90
,509
$
91,1
17
$81
,780
2008
$84
,450
$
106,
436
$80
,508
$
79,9
49
$77
,705
$
87,2
12
$85
,646
$
92,9
55
$81
,953
$
130,
375
$61
,200
$
65,1
77
$54
,782
$
73,0
07
$64
,850
$
83,0
49
$67
,956
$89
,691
$
111,
910
$85
,951
$
82,8
92
$86
,337
$
94,5
34
$91
,394
$
102,
061
$86
,166
$
131,
263
$76
,575
$
78,2
04
$63
,168
$
84,5
79
$84
,022
$
89,5
18
$78
,842
2009
$87
,323
$1
10,9
47
$84
,269
$
83,3
73
$77
,457
$
89,6
52
$85
,823
$
91,6
73
$82
,973
$1
18,0
40
$63
,106
$
64,8
79
$56
,683
$
76,7
30
$63
,097
$
85,8
03
$69
,889
$92
,581
$1
16,9
61
$89
,192
$
86,7
37
$87
,762
$
96,6
49
$90
,478
$
98,5
75
$88
,353
$1
34,7
99
$79
,285
$
79,3
29
$69
,052
$
86,7
01
$83
,003
$
92,0
02
$81
,155
2010
$85
,892
$1
08,7
68
$82
,847
$
81,0
27
$79
,626
$
90,8
27
$86
,560
$
92,2
86
$83
,581
$1
29,1
17
$62
,959
$
67,0
55
$58
,027
$
78,0
41
$63
,871
$
85,4
10
$68
,422
$91
,293
$1
12,5
13
$87
,013
$
84,9
90
$93
,067
$
96,8
32
$90
,921
$
98,4
89
$86
,467
$1
37,5
02
$78
,104
$
78,8
67
$63
,270
$
88,1
05
$80
,789
$
91,3
32
$79
,123
2011
$86
,064
$1
06,8
05
$81
,196
$
83,6
92
$75
,823
$
89,3
27
$87
,376
$
93,9
61
$82
,634
$1
23,1
95
$61
,318
$
62,7
34
$54
,755
$
84,2
83
$57
,524
$
84,7
00
$67
,377
$91
,578
$1
11,0
99
$87
,218
$
85,5
94
$88
,093
$
96,2
80
$90
,329
$1
00,7
56
$87
,760
$1
30,9
89
$77
,384
$
73,7
38
$62
,706
$
94,4
80
$80
,777
$
91,0
12
$77
,847
2012
$85
,896
$1
07,5
39
$80
,929
$
81,2
49
$79
,023
$
88,7
90
$86
,035
$
94,4
79
$83
,180
$1
32,6
18
$60
,799
$
64,3
76
$57
,436
$
70,4
29
$66
,760
$
84,4
89
$66
,631
$90
,997
$1
12,7
39
$86
,182
$
84,3
46
$87
,221
$
96,4
74
$90
,888
$1
03,0
57
$86
,583
$1
35,2
22
$76
,728
$
75,0
63
$65
,681
$
83,5
33
$80
,458
$
90,7
78
$77
,113
Aver
age
Wag
e G
row
th
2000
-201
2
0.3%
0.5%
-0.1
%-0
.1%
0.7%
0.3%
1.1%
-0.1
%0.
5%4.
5%0.
3%0.
2%1.
5%0.
9%1.
1%0.
3%-0
.3%
0.3%
0.2%
0.2%
-0.1
%0.
6%0.
6%0.
8%0.
5%0.
3%5.
0%0.
2%-0
.3%
1.1%
1.6%
0.0%
0.4%
-0.2
%
Sour
ce: P
ublic
-use
file
s of t
he 2
000-
2012
Am
eric
an C
omm
unity
Sur
veys
. Ana
lysis
confi
ned
to S
TEM
wor
kers
with
at le
ast a
bac
helo
r’s d
egre
e ag
e 64
and
und
er, w
orki
ng 3
5 ho
urs o
r mor
e pe
r wee
k an
d at
leas
t 50
wee
ks a
yea
r. *F
igur
es fo
r mat
h te
nd to
be
mor
e vo
latil
e be
caus
e of
its s
mal
l sam
ple
size.

34
Center for Immigration Studies
Table A9. Number and Share of STEM Occupations Comprised of Natives
Occupation
Sci-Conservation Scientists & ForestersEng-Surveying & Mapping Techs.Eng-Surveyors, Cartographers, & PhotogrammetristsSci-Geological & Petroleum Techs, & Nuclear TechsSci-Environmental Scientists & GeoscientistsSci-Atmospheric & Space ScientistsSci-Agricultural & Food ScientistsCmm-Operations Research AnalystsSal-Sales EngineersCmm-Web DevelopersEng-Materials EngineersSci-Chemical Techs.Sci-Biological ScientistsEng-Marine Engineers & Naval ArchitectsCmm-Information Security AnalystsEng-Civil EngineersEng-Environmental EngineersSci-Agricultural & Food Sci. Techs.Sci-Misc. Life, Physical, & Soc. Sci. TechsEng-Aerospace EngineersEng-Chemical EngineersCmm-Computer Support SpecialistsEng-DraftersMgr-Architectural & Engineering ManagersEng-Mechanical EngineersCmm-Network & Computer Systems Admin.Eng-Petroleum, Mining & Geo. EngsEng-Industrial Engineers, w/ Health & SafetyMgr-Natural Sci.s ManagersMgr-Computer & Information Systems ManagersSci-Biological Techs.Cmm-Computer & Information Research ScientistsSci-Chemists & Materials ScientistsEng-Biomedical & Agricultural EngineersEng-Engineering Techs., Except DraftersCmm-Computer Occups, All OtherEng-Misc. Engineers, w/ Nuclear EngineersCmm-Misc. Mathematical Sci. OccupsCmm-Computer Network ArchitectsCmm-Computer ProgrammersSci-Astronomers & PhysicistsCmm-Computer Systems AnalystsCmm-Database AdministratorsEng-Electrical & Electronics EngineersSci-Physical Scientists, All OtherCmm-Software Developers, Applications & Sys. SoftwareSci-Medical Scientists, & Life Scientists, All OtherEng-Computer Hardware EngineersAll STEM Occupations
Native Share of Occupation
98.5%91.8%91.3%91.0%90.2%89.4%88.5%87.1%86.4%85.1%83.4%83.4%82.8%82.7%81.7%81.6%81.4%80.8%80.8%80.7%80.5%80.3%80.2%79.8%79.6%79.6%79.4%79.3%78.5%77.6%77.5%76.2%75.4%75.1%74.8%74.4%74.0%73.5%73.3%73.0%72.8%72.7%70.8%68.9%61.9%56.6%53.3%52.3%73.1%
Number U.S.-Born
19,688
5,278 25,385
4,748 61,975
7,614 19,338 81,935 18,081
104,567 19,961 24,951 59,346
7,963 31,539
207,816 22,511
6,822 56,855 92,763 37,707
182,352 34,460
100,706 127,220
89,643 25,537
100,396 12,849
295,410 8,040 8,200
57,570 13,104 53,356
137,791 280,882
28,842 40,381
237,035 8,005
258,284 54,609
115,346 116,105 471,909
67,666 21,648
3,864,189
Source: Public-use files of the 2012 American Community Survey. Analysis confined to STEM workers with a bachelor’s degree or higher. Prefix shows occupational category: Sci. stands for science; Eng. stands for engineering; Cmm. stands for computer science (technology) and math; and Mgr. stands for management.