Is the US chemicals renaissance a flash - Bloomberg Finance LP · assumption that oil returns to...
13
© Bloomberg Finance L.P.2015 No portion of this document may be reproduced, scanned into an electronic system, distributed, publicly displayed or used as the basis of derivative works without the prior written consent of Bloomberg Finance L.P. For more information on terms of use, please contact [email protected]. Copyright and Disclaimer notice on page 13 applies throughout. Page 1 of 13 Is the US chemicals renaissance a flash in the pan? BACKGROUND AND STRUCTURE OF PAPER Cheap gas has led to a boom in North American supply of many of the chemical intermediates that require natural gas and natural gas liquids as a fuel and feedstock. These intermediates include olefins, methanol, and ammonia. Yet demand for these products is growing faster elsewhere – especially in Asia. In our – and many others’ – base case, North America remains the most cost-advantaged region for the production of ammonia, methanol, and olefins, save for facilities in the Middle East and those in Asia that gasify coal. In this paper, we examine what might need to happen to change this, making either Europe or Asia price-competitive with US chemicals producers. • Our Back to Black scenario details our forecast for fuel and feedstock prices based on the assumption that oil returns to $90/bbl in the long-term, and presents the corresponding cost of chemicals production by region. • In our Technological Advancement scenario, we examine a world where the advances in drilling and completion technology that have made the US a low-cost gas producer spill over into other geographies. Shale gas and tight oil become global phenomena, leading to lower feedstock prices across the board. • In our Stringent Emissions Regulations scenario, we measure how a global carbon price would affect relative economics, with a particular focus on coal gasification versus steam methane reformation (SMR) for methanol and ammonia production. Bloomberg New Energy Finance is a specialist not in global chemical markets, but in global chemical feedstock markets. Therefore, our analysis is underpinned by fundamental views on price trajectories of those feedstocks. The feedstocks covered in this analysis include North American natural gas, global oil and naphtha, propane (LPG), ethane, natural gas from other regions, and Asian coal. Each section of this White Paper first presents our projections for feedstock prices in a given scenario and then uses that analysis to ultimately construct a view on two simple questions: “Does North America remain the lowest cost region to produce chemicals?”, and “What could happen to change that?”. SCENARIO 1: BACK TO BLACK Again, the chemicals we consider are olefins, methanol, and ammonia; for the latter two, the possible feedstock options are gas (for steam methane reformation, SMR) and coal (for gasification). For olefins, the feedstocks range from natural gas liquids (ethane/LPG) to light oils (naphtha or gasoils). Assumptions: Back to Black scenario Global oil prices Historically, the confluence of geopolitical and broader macroeconomic factors which affect oil markets globally has made a pure cost of supply methodology often insufficient for oil price forecasting. In our ‘Back to Black’ scenario, we assume that the recent drop in oil prices is short- lived: Saudi Arabia and other OPEC country members pull back production and oil prices return to WHITE PAPER 20 January 2014 Contents BACKGROUND AND STRUCTURE OF PAPER .1 SCENARIO 1: BACK TO BLACK ..............................1 SCENARIO 2: TECHNOLOGICAL ADVANCEMENT ...............8 SCENARIO 3: STRINGENT EMISSIONS REGULATIONS...............11 Meredith Annex +1 212 617 4462 [email protected]
Transcript of Is the US chemicals renaissance a flash - Bloomberg Finance LP · assumption that oil returns to...
© Bloomberg Finance L.P.2015
No portion of this document may be reproduced, scanned into an electronic system, distributed, publicly displayed or used as the basis of derivative works without the prior written consent of Bloomberg Finance L.P. For more information on terms of use, please contact [email protected]. Copyright and Disclaimer notice on page 13 applies throughout. Page 1 of 13
Is the US chemicals renaissance a flash in the pan?
BACKGROUND AND STRUCTURE OF PAPER
Cheap gas has led to a boom in North American supply of many of the chemical intermediates that
require natural gas and natural gas liquids as a fuel and feedstock. These intermediates include
olefins, methanol, and ammonia. Yet demand for these products is growing faster elsewhere –
especially in Asia.
In our – and many others’ – base case, North America remains the most cost-advantaged region for
the production of ammonia, methanol, and olefins, save for facilities in the Middle East and those in
Asia that gasify coal. In this paper, we examine what might need to happen to change this, making
either Europe or Asia price-competitive with US chemicals producers.
• Our Back to Black scenario details our forecast for fuel and feedstock prices based on the
assumption that oil returns to $90/bbl in the long-term, and presents the corresponding cost
of chemicals production by region.
• In our Technological Advancement scenario, we examine a world where the advances in
drilling and completion technology that have made the US a low-cost gas producer spill over
into other geographies. Shale gas and tight oil become global phenomena, leading to lower
feedstock prices across the board.
• In our Stringent Emissions Regulations scenario, we measure how a global carbon price
would affect relative economics, with a particular focus on coal gasification versus steam
methane reformation (SMR) for methanol and ammonia production.
Bloomberg New Energy Finance is a specialist not in global chemical markets, but in global
chemical feedstock markets. Therefore, our analysis is underpinned by fundamental views on
price trajectories of those feedstocks. The feedstocks covered in this analysis include North
American natural gas, global oil and naphtha, propane (LPG), ethane, natural gas from other
regions, and Asian coal. Each section of this White Paper first presents our projections for
feedstock prices in a given scenario and then uses that analysis to ultimately construct a view on
two simple questions: “Does North America remain the lowest cost region to produce chemicals?”,
and “What could happen to change that?”.
SCENARIO 1: BACK TO BLACK
Again, the chemicals we consider are olefins, methanol, and ammonia; for the latter two, the
possible feedstock options are gas (for steam methane reformation, SMR) and coal (for
gasification). For olefins, the feedstocks range from natural gas liquids (ethane/LPG) to light oils
(naphtha or gasoils).
Assumptions: Back to Black scenario
Global oil prices
Historically, the confluence of geopolitical and broader macroeconomic factors which affect oil
markets globally has made a pure cost of supply methodology often insufficient for oil price
forecasting. In our ‘Back to Black’ scenario, we assume that the recent drop in oil prices is short-
lived: Saudi Arabia and other OPEC country members pull back production and oil prices return to
WHITE PAPER
20 January 2014
Contents BACKGROUND AND
STRUCTURE OF PAPER .1 SCENARIO 1: BACK TO
BLACK ..............................1 SCENARIO 2:
TECHNOLOGICAL
ADVANCEMENT ...............8 SCENARIO 3: STRINGENT
EMISSIONS
REGULATIONS............... 11
Meredith Annex
+1 212 617 4462
© Bloomberg Finance L.P.2015
No portion of this document may be reproduced, scanned into an electronic system, distributed, publicly displayed or used as the basis of derivative works without the prior written consent of Bloomberg Finance L.P. For more information on terms of use, please contact [email protected]. Copyright and Disclaimer notice on page 13 applies throughout. Page 2 of 13
WHITE PAPER
20 January 2014
~$90/bbl in the long-term, which is the price necessary to incentivise long-term investments for
production growth globally.
North American natural gas prices
We derive a North American gas price forecast based on the cost of supply. Our model uses
inputs on drilling and completion costs, as well as production profiles (‘type curves’) for oil, gas
and natural gas liquids (NGLs) to calculate the ‘breakeven price’ – the price of gas at which a
producer will hit a pre-specified after-tax internal rate of return (we use 20%).
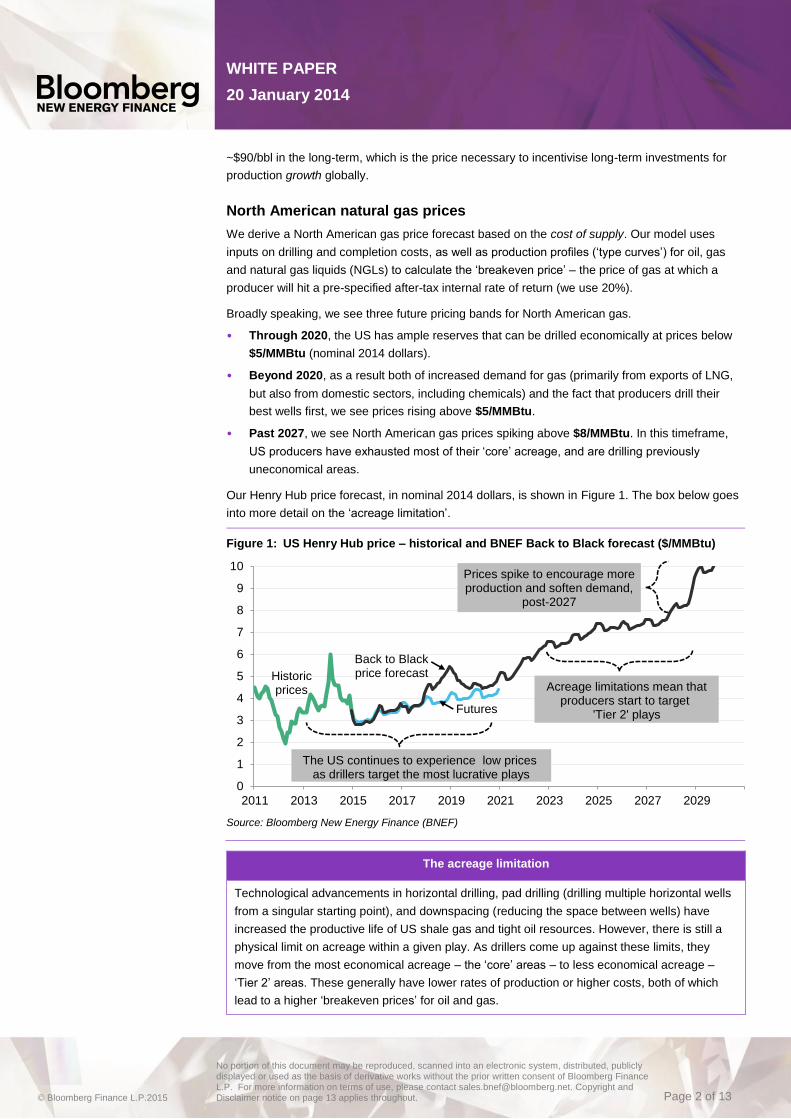
Broadly speaking, we see three future pricing bands for North American gas.
• Through 2020, the US has ample reserves that can be drilled economically at prices below
$5/MMBtu (nominal 2014 dollars).
• Beyond 2020, as a result both of increased demand for gas (primarily from exports of LNG,
but also from domestic sectors, including chemicals) and the fact that producers drill their
best wells first, we see prices rising above $5/MMBtu.
• Past 2027, we see North American gas prices spiking above $8/MMBtu. In this timeframe,
US producers have exhausted most of their ‘core’ acreage, and are drilling previously
uneconomical areas.
Our Henry Hub price forecast, in nominal 2014 dollars, is shown in Figure 1. The box below goes
into more detail on the ‘acreage limitation’.
Figure 1: US Henry Hub price – historical and BNEF Back to Black forecast ($/MMBtu)
Source: Bloomberg New Energy Finance (BNEF)
The acreage limitation
Technological advancements in horizontal drilling, pad drilling (drilling multiple horizontal wells
from a singular starting point), and downspacing (reducing the space between wells) have
increased the productive life of US shale gas and tight oil resources. However, there is still a
physical limit on acreage within a given play. As drillers come up against these limits, they
move from the most economical acreage – the ‘core’ areas – to less economical acreage –
‘Tier 2’ areas. These generally have lower rates of production or higher costs, both of which
lead to a higher ‘breakeven prices’ for oil and gas.
0
1
2
3
4
5
6
7
8
9
10
2011 2013 2015 2017 2019 2021 2023 2025 2027 2029
Futures
Historicprices
The US continues to experience low prices as drillers target the most lucrative plays
Acreage limitations mean thatproducers start to target
'Tier 2' plays
Prices spike to encourage moreproduction and soften demand,
post-2027
Back to Blackprice forecast
© Bloomberg Finance L.P.2015
No portion of this document may be reproduced, scanned into an electronic system, distributed, publicly displayed or used as the basis of derivative works without the prior written consent of Bloomberg Finance L.P. For more information on terms of use, please contact [email protected]. Copyright and Disclaimer notice on page 13 applies throughout. Page 3 of 13
WHITE PAPER
20 January 2014
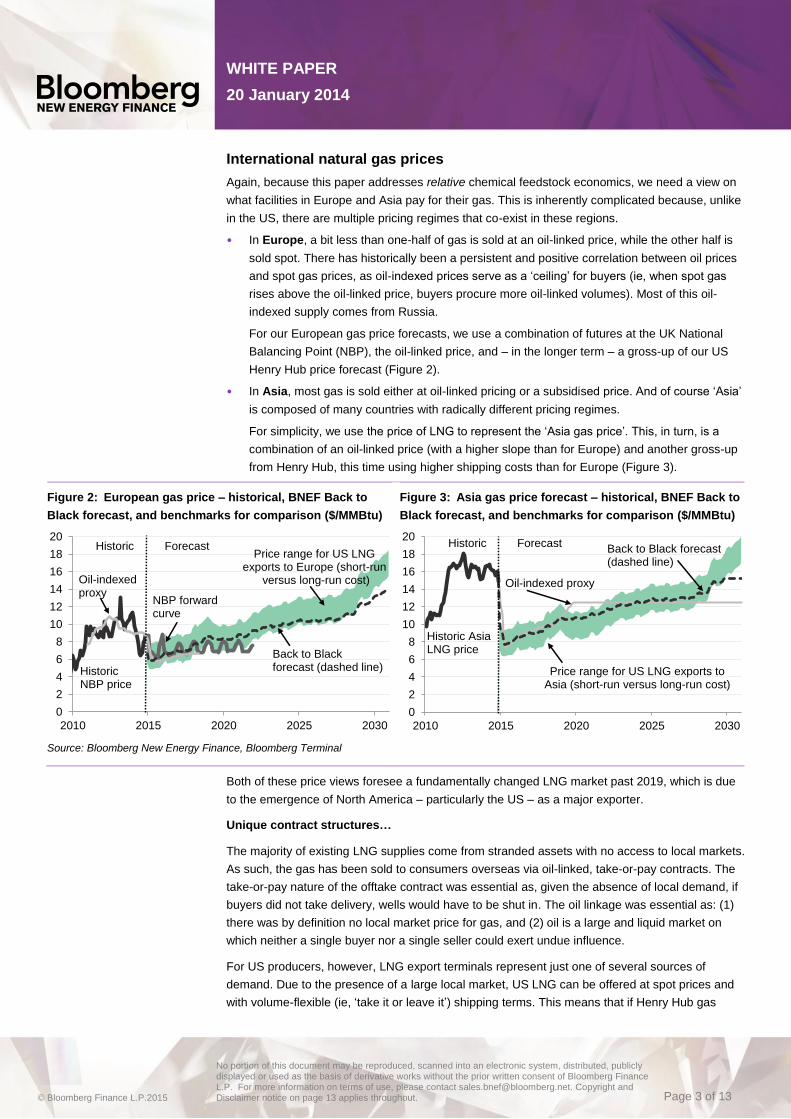
International natural gas prices
Again, because this paper addresses relative chemical feedstock economics, we need a view on
what facilities in Europe and Asia pay for their gas. This is inherently complicated because, unlike
in the US, there are multiple pricing regimes that co-exist in these regions.
• In Europe, a bit less than one-half of gas is sold at an oil-linked price, while the other half is
sold spot. There has historically been a persistent and positive correlation between oil prices
and spot gas prices, as oil-indexed prices serve as a ‘ceiling’ for buyers (ie, when spot gas
rises above the oil-linked price, buyers procure more oil-linked volumes). Most of this oil-
indexed supply comes from Russia.
For our European gas price forecasts, we use a combination of futures at the UK National
Balancing Point (NBP), the oil-linked price, and – in the longer term – a gross-up of our US
Henry Hub price forecast (Figure 2).
• In Asia, most gas is sold either at oil-linked pricing or a subsidised price. And of course ‘Asia’
is composed of many countries with radically different pricing regimes.
For simplicity, we use the price of LNG to represent the ‘Asia gas price’. This, in turn, is a
combination of an oil-linked price (with a higher slope than for Europe) and another gross-up
from Henry Hub, this time using higher shipping costs than for Europe (Figure 3).
Figure 2: European gas price – historical, BNEF Back to
Black forecast, and benchmarks for comparison ($/MMBtu)
Figure 3: Asia gas price forecast – historical, BNEF Back to
Black forecast, and benchmarks for comparison ($/MMBtu)
Source: Bloomberg New Energy Finance, Bloomberg Terminal
Both of these price views foresee a fundamentally changed LNG market past 2019, which is due
to the emergence of North America – particularly the US – as a major exporter.
Unique contract structures…
The majority of existing LNG supplies come from stranded assets with no access to local markets.
As such, the gas has been sold to consumers overseas via oil-linked, take-or-pay contracts. The
take-or-pay nature of the offtake contract was essential as, given the absence of local demand, if
buyers did not take delivery, wells would have to be shut in. The oil linkage was essential as: (1)
there was by definition no local market price for gas, and (2) oil is a large and liquid market on
which neither a single buyer nor a single seller could exert undue influence.
For US producers, however, LNG export terminals represent just one of several sources of
demand. Due to the presence of a large local market, US LNG can be offered at spot prices and
with volume-flexible (ie, ‘take it or leave it’) shipping terms. This means that if Henry Hub gas
0
2
4
6
8
10
12
14
16
18
20
2010 2015 2020 2025 2030
Historic Forecast
Oil-indexed proxy
HistoricNBP price
NBP forwardcurve
Back to Blackforecast (dashed line)
Price range for US LNG exports to Europe (short-run
versus long-run cost)
0
2
4
6
8
10
12
14
16
18
20
2010 2015 2020 2025 2030
Historic Forecast
Oil-indexed proxy
Historic AsiaLNG price
Back to Black forecast(dashed line)
Price range for US LNG exports toAsia (short-run versus long-run cost)
© Bloomberg Finance L.P.2015
No portion of this document may be reproduced, scanned into an electronic system, distributed, publicly displayed or used as the basis of derivative works without the prior written consent of Bloomberg Finance L.P. For more information on terms of use, please contact [email protected]. Copyright and Disclaimer notice on page 13 applies throughout. Page 4 of 13
WHITE PAPER
20 January 2014
prices rise too high, the buyer can refuse the volumes and the gas will remain in the domestic
market. This in turn will tend to push US prices down until equilibrium is (re-)established.
… + substantial volumes…
In addition to the novel contract structure, the volumes will be substantial. We forecast North
American LNG exports of 7Bcfd (56MMtpa) by 2020 and 13Bcfd (104MMtpa) by 2030. For
context, total global LNG demand is forecasted to reach 43Bcfd (354MMtpa) by 2020, and closer
to 52Bcfd (425MMtpa) by 2030. In other words, North American LNG exports could meet up to
16% of demand in 2020, and 24% by 2030.
… = US becomes price-setter for spot LNG
The emergence of such a large amount of volume-flexible LNG has several important
implications. First, due to all the new supply (both from North America and elsewhere, especially
Australia), the LNG market will move from being a sellers’ to a buyers’ market by end-2016, giving
buyers more power in renegotiating terms. This will put downward pressure on prices for LNG
bought via long-term contracts.
The implications for those volumes of LNG bought on the spot market are even more profound.
‘Spot’ LNG sales have, to date, been mostly those small portions of un-contracted volumes from
terminals or re-loads of cargoes after buyers take their contract minimums. In the future, though,
the spot market will essentially be comprised of much of the new volume out of the US (given the
flexibility around whether or not those volumes are actually shipped). Also important to note is that
most traditional LNG export projects have extremely high upfront costs (capex), but relatively low
ongoing costs (opex). In the US, this situation is reversed – the terminals come cheaper, but the
gas is purchased at a market price, not at cost.
The combination of all of these factors makes us think that the spot price of LNG past 2019 (after
a large number of US LNG projects come online) will be set by the price of gas at the Henry Hub.
Asian coal prices
We rely on the forward curve for coal at Newcastle, Australia, to establish our view on Asian coal
prices as well. Currently, the curve sees coal holding stable at roughly $2.75/MMBtu ($65/tonne).
The air pollutants emitted with coal burn make it a fuel of last resort around the world: you only
burn it if it’s the cheapest option. Therefore, the price of gas and alternative hydrocarbons serve
as an upper-bound for coal prices going forward.
International NGL and naphtha prices
As noted earlier, ammonia and methanol production commonly use natural gas as a feedstock.
Olefins, in contrast, are produced either from natural gas liquids (NGLs: ethane, propane and
butanes) or heavy liquids (naphtha or vacuum gasoil). Ethylene – the most widely produced olefin
– is produced alongside other saleable products in different concentrations depending on both the
feedstock and other operating conditions.
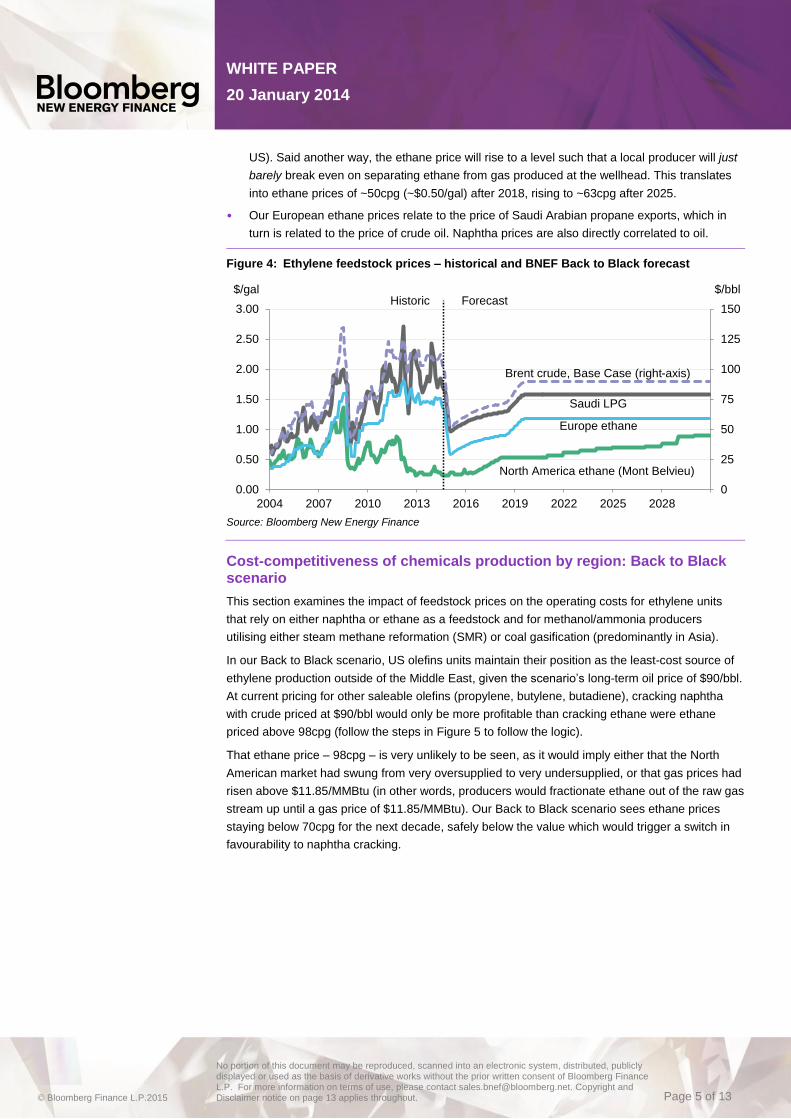
We simplify the analysis somewhat by assuming that ethane – currently the preferred cracker
feedstock in North America – will retain its link to natural gas prices in the US and propane prices
elsewhere. Similarly, we assume naphtha and crude oil prices continue to correlate closely, as
they have in the past (Figure 4). Lastly, our analysis implicitly assumes that the prices for other
saleable olefins (‘co-products’ like propylene, butylene and butadiene) remain constant.
• In North America, ethane will be priced at heating value at the marginal source of supply (we
assume the marginal ethane barrel will come from the Appalachian Basin in the Northeast
© Bloomberg Finance L.P.2015
No portion of this document may be reproduced, scanned into an electronic system, distributed, publicly displayed or used as the basis of derivative works without the prior written consent of Bloomberg Finance L.P. For more information on terms of use, please contact [email protected]. Copyright and Disclaimer notice on page 13 applies throughout. Page 5 of 13
WHITE PAPER
20 January 2014
US). Said another way, the ethane price will rise to a level such that a local producer will just
barely break even on separating ethane from gas produced at the wellhead. This translates
into ethane prices of ~50cpg (~$0.50/gal) after 2018, rising to ~63cpg after 2025.
• Our European ethane prices relate to the price of Saudi Arabian propane exports, which in
turn is related to the price of crude oil. Naphtha prices are also directly correlated to oil.
Figure 4: Ethylene feedstock prices – historical and BNEF Back to Black forecast
Source: Bloomberg New Energy Finance
Cost-competitiveness of chemicals production by region: Back to Black scenario
This section examines the impact of feedstock prices on the operating costs for ethylene units
that rely on either naphtha or ethane as a feedstock and for methanol/ammonia producers
utilising either steam methane reformation (SMR) or coal gasification (predominantly in Asia).
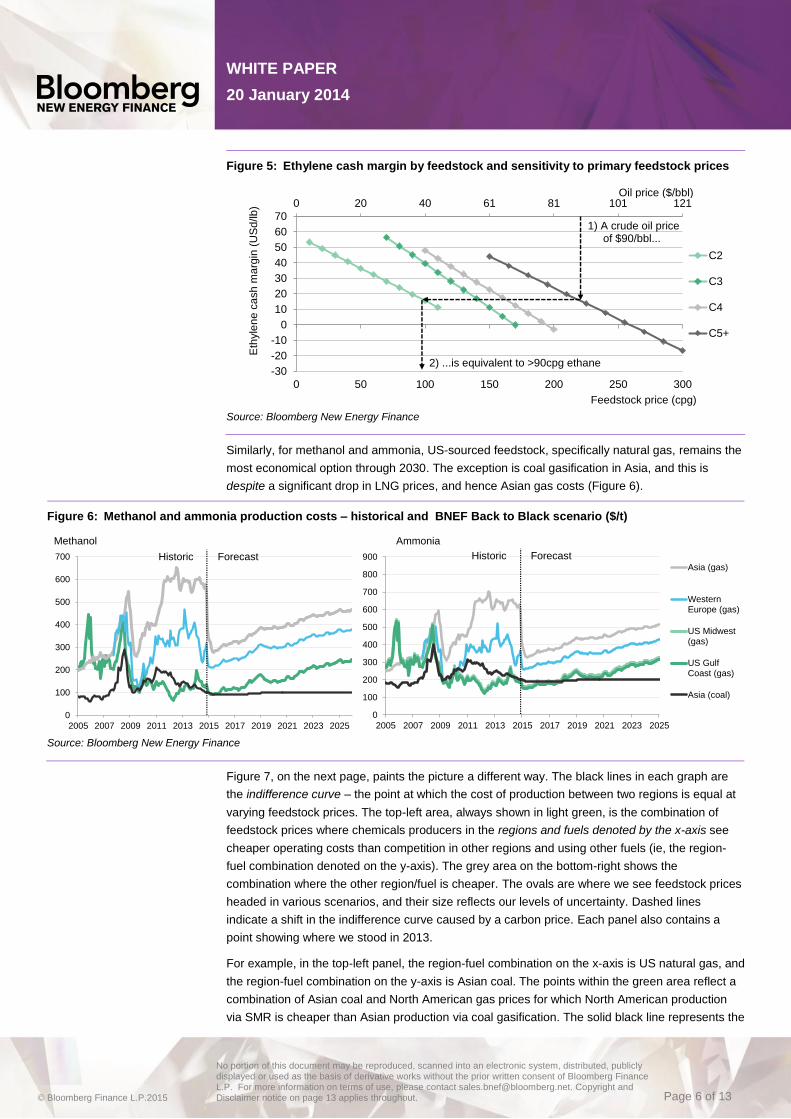
In our Back to Black scenario, US olefins units maintain their position as the least-cost source of
ethylene production outside of the Middle East, given the scenario’s long-term oil price of $90/bbl.
At current pricing for other saleable olefins (propylene, butylene, butadiene), cracking naphtha
with crude priced at $90/bbl would only be more profitable than cracking ethane were ethane
priced above 98cpg (follow the steps in Figure 5 to follow the logic).
That ethane price – 98cpg – is very unlikely to be seen, as it would imply either that the North
American market had swung from very oversupplied to very undersupplied, or that gas prices had
risen above $11.85/MMBtu (in other words, producers would fractionate ethane out of the raw gas
stream up until a gas price of $11.85/MMBtu). Our Back to Black scenario sees ethane prices
staying below 70cpg for the next decade, safely below the value which would trigger a switch in
favourability to naphtha cracking.
0
25
50
75
100
125
150
0.00
0.50
1.00
1.50
2.00
2.50
3.00
2004 2007 2010 2013 2016 2019 2022 2025 2028
$/gal $/bblHistoric Forecast
Brent crude, Base Case (right-axis)
Saudi LPG
Europe ethane
North America ethane (Mont Belvieu)
© Bloomberg Finance L.P.2015
No portion of this document may be reproduced, scanned into an electronic system, distributed, publicly displayed or used as the basis of derivative works without the prior written consent of Bloomberg Finance L.P. For more information on terms of use, please contact [email protected]. Copyright and Disclaimer notice on page 13 applies throughout. Page 6 of 13
WHITE PAPER
20 January 2014
Figure 5: Ethylene cash margin by feedstock and sensitivity to primary feedstock prices
Source: Bloomberg New Energy Finance
Similarly, for methanol and ammonia, US-sourced feedstock, specifically natural gas, remains the
most economical option through 2030. The exception is coal gasification in Asia, and this is
despite a significant drop in LNG prices, and hence Asian gas costs (Figure 6).
Figure 6: Methanol and ammonia production costs – historical and BNEF Back to Black scenario ($/t)
Source: Bloomberg New Energy Finance
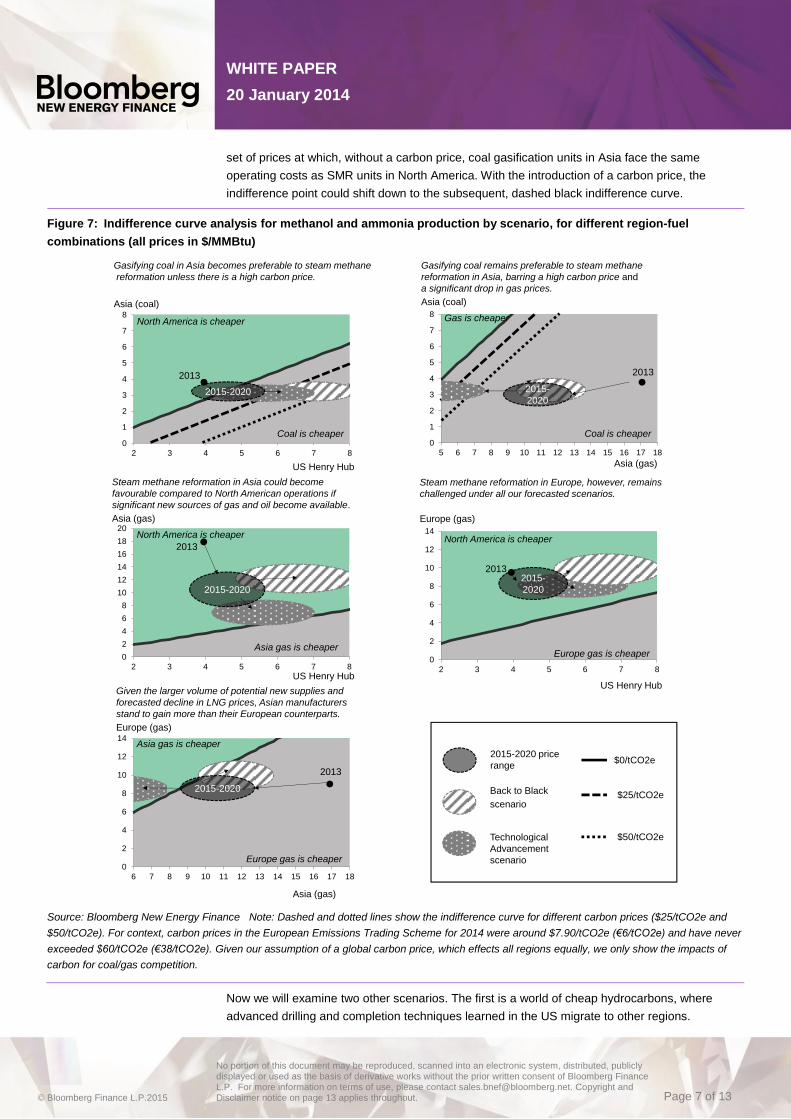
Figure 7, on the next page, paints the picture a different way. The black lines in each graph are
the indifference curve – the point at which the cost of production between two regions is equal at
varying feedstock prices. The top-left area, always shown in light green, is the combination of
feedstock prices where chemicals producers in the regions and fuels denoted by the x-axis see
cheaper operating costs than competition in other regions and using other fuels (ie, the region-
fuel combination denoted on the y-axis). The grey area on the bottom-right shows the
combination where the other region/fuel is cheaper. The ovals are where we see feedstock prices
headed in various scenarios, and their size reflects our levels of uncertainty. Dashed lines
indicate a shift in the indifference curve caused by a carbon price. Each panel also contains a
point showing where we stood in 2013.
For example, in the top-left panel, the region-fuel combination on the x-axis is US natural gas, and
the region-fuel combination on the y-axis is Asian coal. The points within the green area reflect a
combination of Asian coal and North American gas prices for which North American production
via SMR is cheaper than Asian production via coal gasification. The solid black line represents the
0 20 40 61 81 101 121
-30
-20
-10
0
10
20
30
40
50
60
70
0 50 100 150 200 250 300
C2
C3
C4
C5+
Eth
yle
ne
ca
sh
ma
rgin
(U
Sd
/lb
)
Oil price ($/bbl)
Feedstock price (cpg)
1) A crude oil priceof $90/bbl...
2) ...is equivalent to >90cpg ethane
0
100
200
300
400
500
600
700
800
900
2005 2007 2009 2011 2013 2015 2017 2019 2021 2023 2025
Asia (gas)
WesternEurope (gas)
US Midwest(gas)
US GulfCoast (gas)
Asia (coal)
0
100
200
300
400
500
600
700
2005 2007 2009 2011 2013 2015 2017 2019 2021 2023 2025
Methanol Ammonia
Historic Forecast Historic Forecast
© Bloomberg Finance L.P.2015
No portion of this document may be reproduced, scanned into an electronic system, distributed, publicly displayed or used as the basis of derivative works without the prior written consent of Bloomberg Finance L.P. For more information on terms of use, please contact [email protected]. Copyright and Disclaimer notice on page 13 applies throughout. Page 7 of 13
WHITE PAPER
20 January 2014
set of prices at which, without a carbon price, coal gasification units in Asia face the same
operating costs as SMR units in North America. With the introduction of a carbon price, the
indifference point could shift down to the subsequent, dashed black indifference curve.
Figure 7: Indifference curve analysis for methanol and ammonia production by scenario, for different region-fuel
combinations (all prices in $/MMBtu)
Source: Bloomberg New Energy Finance Note: Dashed and dotted lines show the indifference curve for different carbon prices ($25/tCO2e and
$50/tCO2e). For context, carbon prices in the European Emissions Trading Scheme for 2014 were around $7.90/tCO2e (€6/tCO2e) and have never
exceeded $60/tCO2e (€38/tCO2e). Given our assumption of a global carbon price, which effects all regions equally, we only show the impacts of
carbon for coal/gas competition.
Now we will examine two other scenarios. The first is a world of cheap hydrocarbons, where
advanced drilling and completion techniques learned in the US migrate to other regions.
0
1
2
3
4
5
6
7
8
5 6 7 8 9 10 11 12 13 14 15 16 17 18
0
2
4
6
8
10
12
14
2 3 4 5 6 7 8
0
2
4
6
8
10
12
14
16
18
20
2 3 4 5 6 7 8
0
1
2
3
4
5
6
7
8
2 3 4 5 6 7 8
Gasifying coal in Asia becomes preferable to steam methane
reformation unless there is a high carbon price.
Asia (coal)
North America is cheaper
2013
Coal is cheaper
2015-2020
US Henry Hub
2015-
2020
Gasifying coal remains preferable to steam methane
reformation in Asia, barring a high carbon price and
a significant drop in gas prices.
Asia (coal)
Gas is cheaper
Coal is cheaper
Asia (gas)
Steam methane reformation in Asia could become
favourable compared to North American operations if
significant new sources of gas and oil become available.
Asia (gas)
US Henry Hub
North America is cheaper
2013
Asia gas is cheaper
2015-2020
0
2
4
6
8
10
12
14
6 7 8 9 10 11 12 13 14 15 16 17 18
2013
Steam methane reformation in Europe, however, remains
challenged under all our forecasted scenarios.
Europe (gas)
US Henry Hub
North America is cheaper
Asia gas is cheaper
Asia (gas)
Given the larger volume of potential new supplies and
forecasted decline in LNG prices, Asian manufacturers
stand to gain more than their European counterparts.
Europe (gas)
2013
Europe gas is cheaper
Europe gas is cheaper
2015-2020 price
range
Back to Black
scenario
Technological
Advancement
scenario
$0/tCO2e
$25/tCO2e
$50/tCO2e
2013
2015-2020
2015-
2020
© Bloomberg Finance L.P.2015
No portion of this document may be reproduced, scanned into an electronic system, distributed, publicly displayed or used as the basis of derivative works without the prior written consent of Bloomberg Finance L.P. For more information on terms of use, please contact [email protected]. Copyright and Disclaimer notice on page 13 applies throughout. Page 8 of 13
WHITE PAPER
20 January 2014
SCENARIO 2: TECHNOLOGICAL ADVANCEMENT
Assumptions: Technological Advancement scenario
Under this scenario, we see continued advances in drilling and completion technology such that
unconventional gas production becomes a global phenomenon. This, combined with continued
high oil production, serves to keep all feedstock prices down.
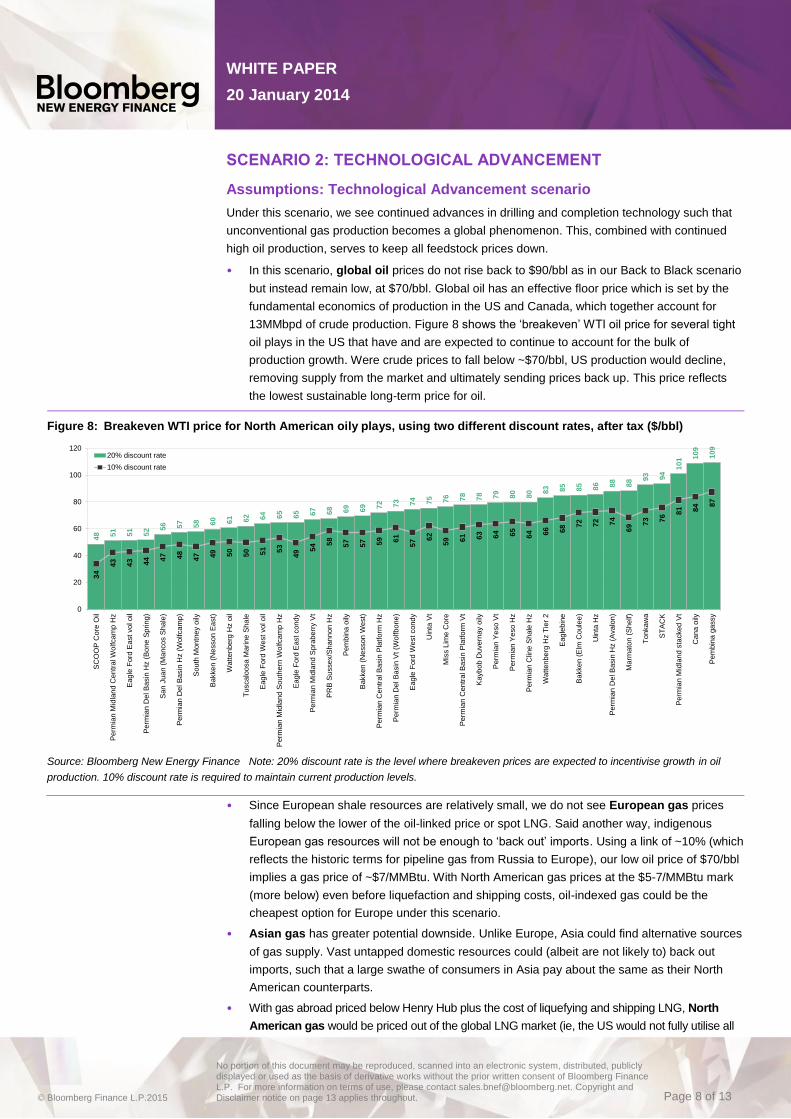
• In this scenario, global oil prices do not rise back to $90/bbl as in our Back to Black scenario
but instead remain low, at $70/bbl. Global oil has an effective floor price which is set by the
fundamental economics of production in the US and Canada, which together account for
13MMbpd of crude production. Figure 8 shows the ‘breakeven’ WTI oil price for several tight
oil plays in the US that have and are expected to continue to account for the bulk of
production growth. Were crude prices to fall below ~$70/bbl, US production would decline,
removing supply from the market and ultimately sending prices back up. This price reflects
the lowest sustainable long-term price for oil.
Figure 8: Breakeven WTI price for North American oily plays, using two different discount rates, after tax ($/bbl)
Source: Bloomberg New Energy Finance Note: 20% discount rate is the level where breakeven prices are expected to incentivise growth in oil
production. 10% discount rate is required to maintain current production levels.
• Since European shale resources are relatively small, we do not see European gas prices
falling below the lower of the oil-linked price or spot LNG. Said another way, indigenous
European gas resources will not be enough to ‘back out’ imports. Using a link of ~10% (which
reflects the historic terms for pipeline gas from Russia to Europe), our low oil price of $70/bbl
implies a gas price of ~$7/MMBtu. With North American gas prices at the $5-7/MMBtu mark
(more below) even before liquefaction and shipping costs, oil-indexed gas could be the
cheapest option for Europe under this scenario.
• Asian gas has greater potential downside. Unlike Europe, Asia could find alternative sources
of gas supply. Vast untapped domestic resources could (albeit are not likely to) back out
imports, such that a large swathe of consumers in Asia pay about the same as their North
American counterparts.
• With gas abroad priced below Henry Hub plus the cost of liquefying and shipping LNG, North
American gas would be priced out of the global LNG market (ie, the US would not fully utilise all
48 51
51
52 5
6 57
58 60 61 62 64 65
65 67 68 69 69 72 73 74 75 76 78
78 79
80
80 8
3 85
85 86 88
88 9
3 94
10
1 10
9
10
9
34
43
43 44 47 48
47 49 50
50 51 53
49 5
4 58
57
57 59 61
57 6
2
59 61 63 64 65
64 66 68 7
2
72 74
69 7
3 76 8
1 84 8
7
0
20
40
60
80
100
120
SC
OO
P C
ore
Oil
Perm
ian M
idla
nd C
en
tral W
olfca
mp
Hz
Eag
le F
ord
East
vo
l oil
Perm
ian D
el B
asin
Hz (
Bo
ne
Sp
rin
g)
San
Jua
n (
Ma
nco
s S
ha
le)
Perm
ian D
el B
asin
Hz (
Wolfcam
p)
Sou
th M
on
tne
y o
ily
Bakke
n (
Nesson
Ea
st)
Wa
tten
be
rg H
z o
il
Tu
scalo
osa M
ari
ne
Sh
ale
Eag
le F
ord
West
vol o
il
Perm
ian M
idla
nd S
outh
ern
Wolfca
mp H
z
Eag
le F
ord
East
co
nd
y
Perm
ian M
idla
nd S
pra
be
rry V
t
PR
B S
ussex/S
han
no
n H
z
Pem
bin
a o
ily
Bakke
n (
Nesson
West)
Perm
ian C
en
tral B
asin
Pla
tfo
rm H
z
Perm
ian D
el B
asin
Vt (W
olfbo
ne
)
Eag
le F
ord
West
con
dy
Uin
ta V
t
Mis
s L
ime
Co
re
Perm
ian C
en
tral B
asin
Pla
tfo
rm V
t
Kaybo
b D
uvern
ay o
ily
Perm
ian Y
eso V
t
Perm
ian Y
eso H
z
Perm
ian C
line
Sha
le H
z
Wa
tten
be
rg H
z T
ier
2
Eag
lebin
e
Bakke
n (
Elm
Co
ule
e)
Uin
ta H
z
Perm
ian D
el B
asin
Hz (
Ava
lon
)
Ma
rmato
n (
Sh
elf)
To
nka
wa
ST
AC
K
Perm
ian M
idla
nd s
tacked
Vt
Cana
oily
Pem
bin
a g
assy
20% discount rate
10% discount rate
© Bloomberg Finance L.P.2015
No portion of this document may be reproduced, scanned into an electronic system, distributed, publicly displayed or used as the basis of derivative works without the prior written consent of Bloomberg Finance L.P. For more information on terms of use, please contact [email protected]. Copyright and Disclaimer notice on page 13 applies throughout. Page 9 of 13
WHITE PAPER
20 January 2014
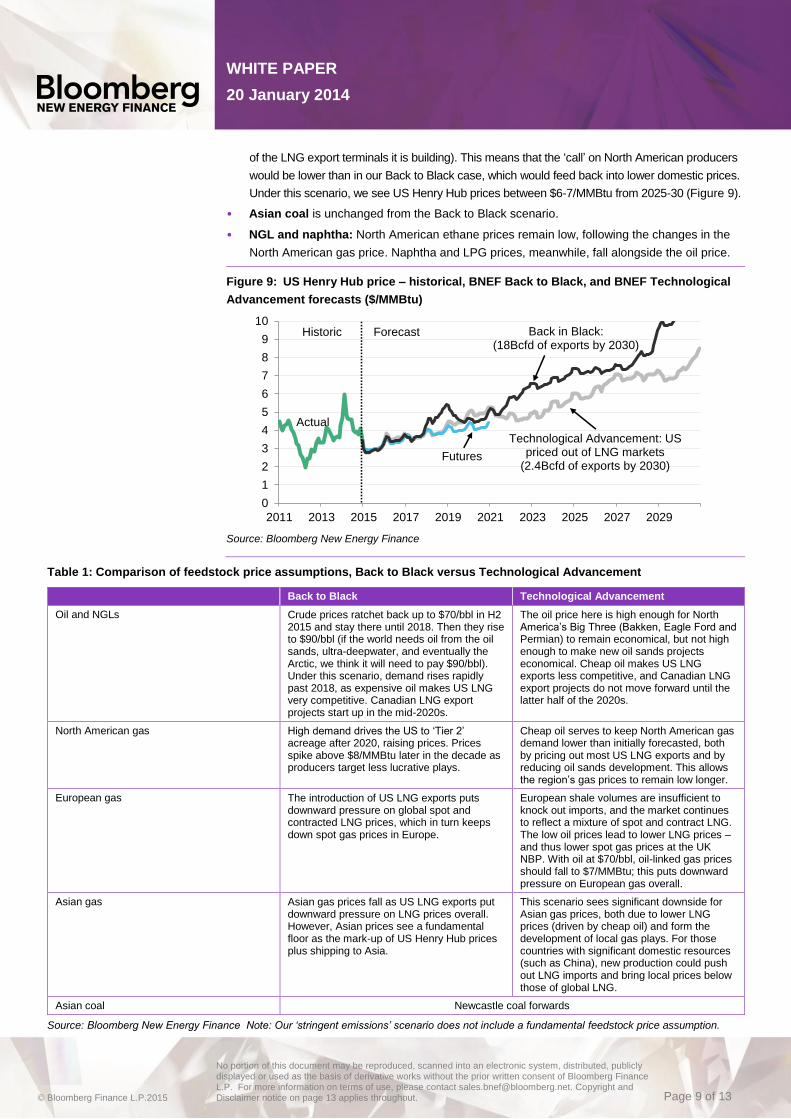
of the LNG export terminals it is building). This means that the ‘call’ on North American producers
would be lower than in our Back to Black case, which would feed back into lower domestic prices.
Under this scenario, we see US Henry Hub prices between $6-7/MMBtu from 2025-30 (Figure 9).
• Asian coal is unchanged from the Back to Black scenario.
• NGL and naphtha: North American ethane prices remain low, following the changes in the
North American gas price. Naphtha and LPG prices, meanwhile, fall alongside the oil price.
Figure 9: US Henry Hub price – historical, BNEF Back to Black, and BNEF Technological
Advancement forecasts ($/MMBtu)
Source: Bloomberg New Energy Finance
Table 1: Comparison of feedstock price assumptions, Back to Black versus Technological Advancement
Back to Black Technological Advancement
Oil and NGLs Crude prices ratchet back up to $70/bbl in H2 2015 and stay there until 2018. Then they rise to $90/bbl (if the world needs oil from the oil sands, ultra-deepwater, and eventually the Arctic, we think it will need to pay $90/bbl). Under this scenario, demand rises rapidly past 2018, as expensive oil makes US LNG very competitive. Canadian LNG export projects start up in the mid-2020s.
The oil price here is high enough for North America’s Big Three (Bakken, Eagle Ford and Permian) to remain economical, but not high enough to make new oil sands projects economical. Cheap oil makes US LNG exports less competitive, and Canadian LNG export projects do not move forward until the latter half of the 2020s.
North American gas High demand drives the US to ‘Tier 2’ acreage after 2020, raising prices. Prices spike above $8/MMBtu later in the decade as producers target less lucrative plays.
Cheap oil serves to keep North American gas demand lower than initially forecasted, both by pricing out most US LNG exports and by reducing oil sands development. This allows the region’s gas prices to remain low longer.
European gas The introduction of US LNG exports puts downward pressure on global spot and contracted LNG prices, which in turn keeps down spot gas prices in Europe.
European shale volumes are insufficient to knock out imports, and the market continues to reflect a mixture of spot and contract LNG. The low oil prices lead to lower LNG prices – and thus lower spot gas prices at the UK NBP. With oil at $70/bbl, oil-linked gas prices should fall to $7/MMBtu; this puts downward pressure on European gas overall.
Asian gas Asian gas prices fall as US LNG exports put downward pressure on LNG prices overall. However, Asian prices see a fundamental floor as the mark-up of US Henry Hub prices plus shipping to Asia.
This scenario sees significant downside for Asian gas prices, both due to lower LNG prices (driven by cheap oil) and form the development of local gas plays. For those countries with significant domestic resources (such as China), new production could push out LNG imports and bring local prices below those of global LNG.
Asian coal Newcastle coal forwards
Source: Bloomberg New Energy Finance Note: Our ‘stringent emissions’ scenario does not include a fundamental feedstock price assumption.
0
1
2
3
4
5
6
7
8
9
10
2011 2013 2015 2017 2019 2021 2023 2025 2027 2029
Historic Forecast Back in Black:(18Bcfd of exports by 2030)
Technological Advancement: USpriced out of LNG markets
(2.4Bcfd of exports by 2030)Futures
Actual
© Bloomberg Finance L.P.2015
No portion of this document may be reproduced, scanned into an electronic system, distributed, publicly displayed or used as the basis of derivative works without the prior written consent of Bloomberg Finance L.P. For more information on terms of use, please contact [email protected]. Copyright and Disclaimer notice on page 13 applies throughout. Page 10 of 13
WHITE PAPER
20 January 2014
Cost-competitiveness of chemicals production by region: Technological Advancement scenario
The US loses some of its ‘gas advantage’ under the Technological Advancement scenario, but
remains the lowest cost production region for methanol and ammonia when only SMR is
considered. Coal gasification remains the cheaper option where available.
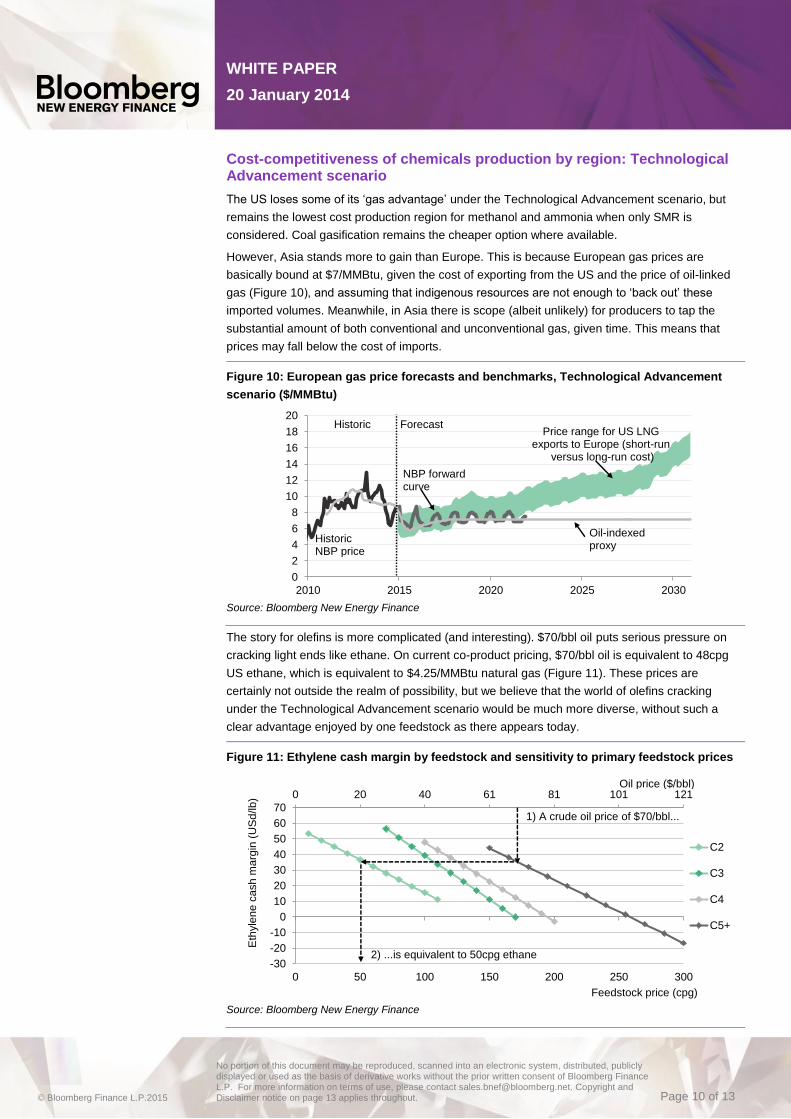
However, Asia stands more to gain than Europe. This is because European gas prices are
basically bound at $7/MMBtu, given the cost of exporting from the US and the price of oil-linked
gas (Figure 10), and assuming that indigenous resources are not enough to ‘back out’ these
imported volumes. Meanwhile, in Asia there is scope (albeit unlikely) for producers to tap the
substantial amount of both conventional and unconventional gas, given time. This means that
prices may fall below the cost of imports.
Figure 10: European gas price forecasts and benchmarks, Technological Advancement
scenario ($/MMBtu)
Source: Bloomberg New Energy Finance
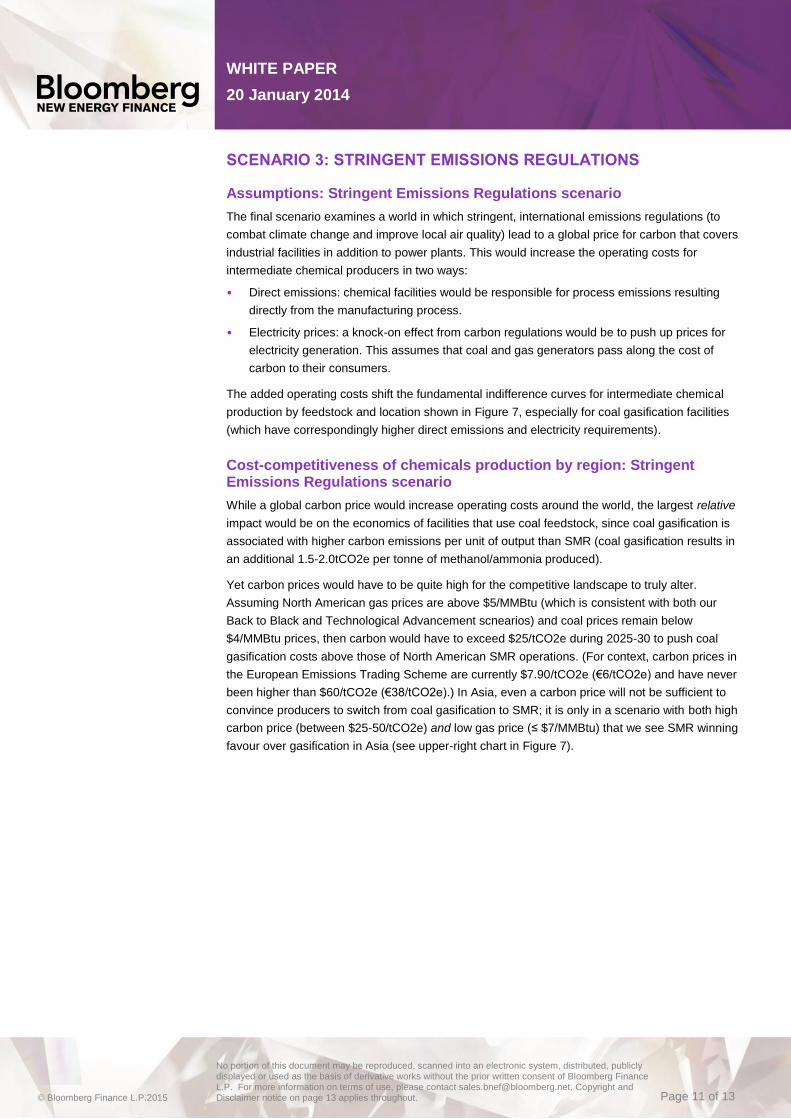
The story for olefins is more complicated (and interesting). $70/bbl oil puts serious pressure on
cracking light ends like ethane. On current co-product pricing, $70/bbl oil is equivalent to 48cpg
US ethane, which is equivalent to $4.25/MMBtu natural gas (Figure 11). These prices are
certainly not outside the realm of possibility, but we believe that the world of olefins cracking
under the Technological Advancement scenario would be much more diverse, without such a
clear advantage enjoyed by one feedstock as there appears today.
Figure 11: Ethylene cash margin by feedstock and sensitivity to primary feedstock prices
Source: Bloomberg New Energy Finance
0
2
4
6
8
10
12
14
16
18
20
2010 2015 2020 2025 2030
Historic Forecast
Oil-indexed proxy
HistoricNBP price
NBP forwardcurve
Price range for US LNG exports to Europe (short-run
versus long-run cost)
0 20 40 61 81 101 121
-30
-20
-10
0
10
20
30
40
50
60
70
0 50 100 150 200 250 300
C2
C3
C4
C5+
Eth
yle
ne
ca
sh
ma
rgin
(U
Sd
/lb
)
Oil price ($/bbl)
Feedstock price (cpg)
1) A crude oil price of $70/bbl...
2) ...is equivalent to 50cpg ethane
© Bloomberg Finance L.P.2015
No portion of this document may be reproduced, scanned into an electronic system, distributed, publicly displayed or used as the basis of derivative works without the prior written consent of Bloomberg Finance L.P. For more information on terms of use, please contact [email protected]. Copyright and Disclaimer notice on page 13 applies throughout. Page 11 of 13
WHITE PAPER
20 January 2014
SCENARIO 3: STRINGENT EMISSIONS REGULATIONS
Assumptions: Stringent Emissions Regulations scenario
The final scenario examines a world in which stringent, international emissions regulations (to
combat climate change and improve local air quality) lead to a global price for carbon that covers
industrial facilities in addition to power plants. This would increase the operating costs for
intermediate chemical producers in two ways:
• Direct emissions: chemical facilities would be responsible for process emissions resulting
directly from the manufacturing process.
• Electricity prices: a knock-on effect from carbon regulations would be to push up prices for
electricity generation. This assumes that coal and gas generators pass along the cost of
carbon to their consumers.
The added operating costs shift the fundamental indifference curves for intermediate chemical
production by feedstock and location shown in Figure 7, especially for coal gasification facilities
(which have correspondingly higher direct emissions and electricity requirements).
Cost-competitiveness of chemicals production by region: Stringent Emissions Regulations scenario
While a global carbon price would increase operating costs around the world, the largest relative
impact would be on the economics of facilities that use coal feedstock, since coal gasification is
associated with higher carbon emissions per unit of output than SMR (coal gasification results in
an additional 1.5-2.0tCO2e per tonne of methanol/ammonia produced).
Yet carbon prices would have to be quite high for the competitive landscape to truly alter.
Assuming North American gas prices are above $5/MMBtu (which is consistent with both our
Back to Black and Technological Advancement scnearios) and coal prices remain below
$4/MMBtu prices, then carbon would have to exceed $25/tCO2e during 2025-30 to push coal
gasification costs above those of North American SMR operations. (For context, carbon prices in
the European Emissions Trading Scheme are currently $7.90/tCO2e (€6/tCO2e) and have never
been higher than $60/tCO2e (€38/tCO2e).) In Asia, even a carbon price will not be sufficient to
convince producers to switch from coal gasification to SMR; it is only in a scenario with both high
carbon price (between $25-50/tCO2e) and low gas price (≤ $7/MMBtu) that we see SMR winning
favour over gasification in Asia (see upper-right chart in Figure 7).
© Bloomberg Finance L.P.2015
No portion of this document may be reproduced, scanned into an electronic system, distributed, publicly displayed or used as the basis of derivative works without the prior written consent of Bloomberg Finance L.P. For more information on terms of use, please contact [email protected]. Copyright and Disclaimer notice on page 13 applies throughout. Page 12 of 13
WHITE PAPER
20 January 2014
About Us
Gas
Charles Blanchard
Team Lead, Gas
+1 212 617 6428
Meredith Annex
Associate, Gas
+1 212 617 4462
© Bloomberg Finance L.P. 2015. No portion of this document may be reproduced, scanned into
an electronic system, distributed, publicly displayed or used as the basis of derivative works
without the prior written consent of Bloomberg Finance L.P.
Subscription details
Contact details
Copyright
© Bloomberg Finance L.P.2015
No portion of this document may be reproduced, scanned into an electronic system, distributed, publicly displayed or used as the basis of derivative works without the prior written consent of Bloomberg Finance L.P. For more information on terms of use, please contact [email protected]. Copyright and Disclaimer notice on page 13 applies throughout. Page 13 of 13
WHITE PAPER
20 January 2014
This service is derived from selected public sources. Bloomberg Finance L.P. and its affiliates, in
providing the service, believe that the information it uses comes from reliable sources, but do not
guarantee the accuracy or completeness of this information, which is subject to change without
notice, and nothing in this document shall be construed as such a guarantee. The statements in
this service reflect the current judgment of the authors of the relevant articles or features, and do
not necessarily reflect the opinion of Bloomberg Finance L.P., Bloomberg L.P. or any of their
affiliates (“Bloomberg”). Bloomberg disclaims any liability arising from use of this document and/or
its contents, and this service. Nothing herein shall constitute or be construed as an offering of
financial instruments or as investment advice or recommendations by Bloomberg of an
investment or other strategy (e.g., whether or not to “buy”, “sell”, or “hold” an investment). The
information available through this service is not based on consideration of a subscriber’s
individual circumstances and should not be considered as information sufficient upon which to
base an investment decision. BLOOMBERG, BLOOMBERG PROFESSIONAL, BLOOMBERG
MARKETS, BLOOMBERG NEWS, BLOOMBERG ANYWHERE, BLOOMBERG TRADEBOOK,
BLOOMBERG BONDTRADER, BLOOMBERG TELEVISION, BLOOMBERG RADIO,
BLOOMBERG PRESS, BLOOMBERG.COM, BLOOMBERG NEW ENERGY FINANCE and NEW
ENERGY FINANCE are trademarks and service marks of Bloomberg Finance L.P. or its
subsidiaries.
This service is provided by Bloomberg Finance L.P. and its affiliates. The data contained within
this document, its contents and/or this service do not express an opinion on the future or
projected value of any financial instrument and are not research recommendations (i.e.,
recommendations as to whether or not to “buy”, “sell”, “hold”, or to enter or not to enter into any
other transaction involving any specific interest) or a recommendation as to an investment or
other strategy. No aspect of this service is based on the consideration of a customer’s individual
circumstances. You should determine on your own whether you agree with the content of this
document and any other data provided through this service. Employees involved in this service
may hold positions in the companies covered by this service.
Disclaimer