Is the Time Allocated to Review Patent Applications ... · 1 Is the Time Allocated to Review Patent...
57
1 Is the Time Allocated to Review Patent Applications Inducing Examiners to Grant Invalid Patents?: Evidence from Micro-Level Application Data Michael D. Frakes and Melissa F. Wasserman We explore how examiner behavior is altered by the time allocated for reviewing patent applications. Insufficient examination time may crowd out examiner search and rejection efforts, leaving examiners more inclined to grant otherwise invalid applications. To test this prediction, we use application-level data to trace the behavior of individual examiners over the course of a series of promotions that carry with them reductions in examination-time allocations. We find evidence demonstrating that the promotions of interest are associated with reductions in examination scrutiny and increases in granting tendencies. Our findings imply that if all examiners were given the same time to review applications as is extended to those examiners with the most generous time allocations, the Patent Office would grant nearly 20 percent fewer patents. Moreover, we find evidence suggesting that those additional patents being issued on the margin as a result of such time pressures are of below-average levels of quality. Frakes: Associate Professor of Law, Northwestern University School of Law; Faculty Research Fellow, National Bureau of Economic Research; Fellow, Northwestern Institute for Policy Research (e-mail: [email protected]). Wasserman: Associate Professor of Law; Richard and Anne Stockton Faculty Scholar; & Richard W. and Marie L. Corman Scholar, University of Illinois College of Law. The work was funded in part by University of Illinois at Urbana Champaign Research Board, Award 12088 and the Cornell Institute for the Social Sciences Small Grant Award. We are grateful to Matt Berry at the National Center for Supercomputing Applications at the University of Illinois for collecting data from the Patent Office’s PAIR database. We are grateful to Alberto Galasso for providing data on pairwise citations and for providing helpful comments. We are likewise grateful to Bhaven Sampat for providing data on examiner-driven citations. We thank Rochelle Dreyfuss, Paul Heald, Mark Lemley, Ronald Mann, Alan Marco, Peter Molk, Jim Poterba, Arti Rai, Saurabh Vishnubhakat, Heidi Williams, and participants at the 14 th Annual Intellectual Property Scholar Conference, the Big Ten Untenured Conference, the Northwestern Law School Profs Talk, the 3 rd Annual Empirical Patent Law Conference, and the Georgetown Law and Economics Workshop for useful comments.
Transcript of Is the Time Allocated to Review Patent Applications ... · 1 Is the Time Allocated to Review Patent...

1
Is the Time Allocated to Review Patent Applications Inducing Examiners to Grant Invalid Patents?: Evidence from Micro-Level Application Data
Michael D. Frakes and Melissa F. Wasserman
We explore how examiner behavior is altered by the time allocated for reviewing patent
applications. Insufficient examination time may crowd out examiner search and rejection
efforts, leaving examiners more inclined to grant otherwise invalid applications. To test this
prediction, we use application-level data to trace the behavior of individual examiners over the
course of a series of promotions that carry with them reductions in examination-time allocations.
We find evidence demonstrating that the promotions of interest are associated with reductions in
examination scrutiny and increases in granting tendencies. Our findings imply that if all
examiners were given the same time to review applications as is extended to those examiners
with the most generous time allocations, the Patent Office would grant nearly 20 percent fewer
patents. Moreover, we find evidence suggesting that those additional patents being issued on the
margin as a result of such time pressures are of below-average levels of quality.
Frakes: Associate Professor of Law, Northwestern University School of Law; Faculty Research Fellow, National
Bureau of Economic Research; Fellow, Northwestern Institute for Policy Research (e-mail:
[email protected]). Wasserman: Associate Professor of Law; Richard and Anne Stockton Faculty Scholar;
& Richard W. and Marie L. Corman Scholar, University of Illinois College of Law. The work was funded in part by
University of Illinois at Urbana Champaign Research Board, Award 12088 and the Cornell Institute for the Social
Sciences Small Grant Award. We are grateful to Matt Berry at the National Center for Supercomputing
Applications at the University of Illinois for collecting data from the Patent Office’s PAIR database. We are
grateful to Alberto Galasso for providing data on pairwise citations and for providing helpful comments. We are
likewise grateful to Bhaven Sampat for providing data on examiner-driven citations. We thank Rochelle Dreyfuss,
Paul Heald, Mark Lemley, Ronald Mann, Alan Marco, Peter Molk, Jim Poterba, Arti Rai, Saurabh Vishnubhakat,
Heidi Williams, and participants at the 14th
Annual Intellectual Property Scholar Conference, the Big Ten Untenured
Conference, the Northwestern Law School Profs Talk, the 3rd
Annual Empirical Patent Law Conference, and the
Georgetown Law and Economics Workshop for useful comments.

2
Evidence suggests that patents play an important role in both promoting innovative activity
and shaping the direction of technological growth (Moser, 2004). Yet in recent years the patent
system has come under voracious criticism (Burk & Lemley, 2009). Critiques of the system has
largely coalesced around one charge: the U.S. Patent and Trademark Office (Patent Office or
Agency) is issuing too many invalid patents—i.e., patents on inventions that fail to meet the
patentability requirements (Jaffe & Lerner, 2004). In board terms, a Patent Office that is
routinely granting patents on inventions that are already known or represent only a trivial
advancement over current scientific understanding will tend to burden society with the
deadweight losses associated with monopoly protection without reaping the benefits of spurred
innovation (Nordhaus 1969). In addition, invalidly issued patents can be utilized by
nonpracticing entities or “patent trolls” to opportunistically extract licensing fees from
innovators, while also stunting follow-on discoveries in markets characterized by cumulative
innovation (Scotchmer 1991, Sampat and Williams 2014, Galasso and Schankerman 2014).
Echoing these concerns, five U.S. Senators sent a letter to Penny Pritzker, the U.S. Secretary of
Commerce, on August 6, 2014, urging that the Patent Office improve the quality of its
application review and stating that abusive patent litigation by patent trolls “raises questions
about whether too many illegitimate patents are being issued.”1
Although commentators have suggested a plethora of reasons as to why the Agency may be
biased towards allowing patents, there exists little compelling empirical evidence that any
particular feature of the Patent Office actually induces the Agency to over-grant patents.2 Absent
such evidence, policymakers are provided with little guidance as to how to address the root
causes of the patent quality crisis. This paper begins to rectify this deficiency by addressing one
feature of the Patent Office that scholars have identified as likely to influence an examiner’s
decision to grant a patent: the time allotted to review a patent application (Jaffe and Lerner,
2004). Because patent applications are presumed to comply with the statutory patentability
requirements when filed, the burden of proving unpatentability rests with the Agency. That is, a
patent examiner who fails to explicitly set forth reasons as to why the application fails to meet
the patentability standards must grant the patent. To the extent that examiners are given
1 This letter can be downloaded from Senator Merkley’s webpage at http://merkley.senate.gov/
download/?id=37c2507f-7272-4814-97e3-10e85fbafdbc. 2 See, however, Frakes and Wasserman (2013, 2015), which explore how the Patent Office’s fee schedule,
along with the Office’s inability to finally reject a patent application, creates an incentive for a financially
constrained agency to allow additional patents.

3
insufficient examination time, one might expect them to conduct limited reviews of applications
and therefore grant patents at elevated rates. Much anecdotal evidence has been put forth to
suggest that patent examiners indeed face binding examination time constraints, implicating such
concerns.3
To more comprehensively test this simple hypothesis and challenge this anecdotal sentiment,
we rely upon the fact that examination times decrease upon certain types of examiner promotion.
Our basic empirical strategy is to follow individual examiners throughout the course of their
careers and to track the evolution of their examination behavior—including their granting rates—
as they experience promotions that diminish the amount of examination time at their disposal.
Bolstering our ability to separate the effect of allocated examination time from other factors that
may change generally upon promotion is the fact that examiner promotions and pay raises come
in several varieties, some of which bear on examination times and some of which do not. Our
identification strategy is further strengthened by the fact that the promotions of interest do not
transpire lock-step with increases in years of experience, allowing us to decouple an experience
effect from a promotion-of-interest effect, combined with the fact that applications are generally
randomly assigned to examiners within technology groups.
To execute this empirical strategy, we estimate examiner fixed-effects specifications using
novel, micro-level data on 1.4 million patent applications disposed of between 2002 and 2012,
merged with rich, examiner roster data received from the Patent Office pursuant to a series of
Freedom of Information Act requests (FOIA). Our results suggest that as an examiner is given
less time to review an application, the less active she becomes in searching for prior art, the less
likely she becomes to make obviousness rejections (which are especially time-intensive
exercises),4 and the more likely she becomes to grant the patent. Under the assumption that
patent examiners who are allocated sufficient time to review applications will, on average, make
the correct patentability determinations, our results suggest that the time allotments may be
3 In an August 2010 report commissioned by the Patent Office to reassess the schedule by which they set
examination-time expectations (which we obtained pursuant to a Freedom of Information Act Request), the
Manhattan Strategy Group stated the following:
Examiners consistently expressed the need for additional time. This was stated mostly in concern to not
being able to do a high-quality examination and to avoid taking short-cuts. As one examiner in
[Technology Center] 1700 explained, “when you add it up its not enough time to do a proper job on a
case.” A junior examiner expressed a similar sentiment, stating that “rather than doing what I feel is
ultimately right, I’m essentially fighting for my life.” 4 To the best of our knowledge, our analysis is the first to report comprehensive application level rejection
data. Alcacer et al., 2012, however, have previously reported rejection data for 1,554 patents issued in 2007.

4
inducing patent examiners to grant invalid patents on the margin. Moreover, supporting the view
that these marginal patents may be of questionable quality, we estimate that the frequency by
which an issued patent is either renewed or cited by other patents generally decreases as the
examiner associated with the patent receives the examination-time-reducing promotions of
interest.
At first blush, it may not be surprising that the level of scrutiny afforded applications may, at
some point, fall as allocated examination time becomes sufficiently strained. Importantly, our
findings demonstrate that this is not merely a hypothetical scenario but instead that examiners
indeed appear to be operating at the point where time constraints bind. That is, our results
suggest that current reduction in time allocations upon promotion are hampering the ability of
examiners to fully evaluate the merits of the given applications and thus ensure that only
meritorious applications are granted. Moreover, we demonstrate that the magnitude of the
resulting impact on examiner granting tendencies is substantial. As examination time is cut
roughly in half (i.e., as an examiner rises from GS-7 to GS-14 along the General Schedule scale,
controlling for changes in years of experience), our findings suggest that grant rates rise by as
much as 9 to 19 percentage points, or by roughly 13 to 28 percent.5 Considering the distribution
of examinations across GS levels, our findings imply that if all examiners were allocated as
many hours as are extended to GS-7 examiners, the Patent Office’s overall grant rate would fall
by roughly 14 percentage points, or nearly 20 percent.
Despite a substantial literature in economics bearing on the patent system,6 the administrative
process by which patent rights are initially established has received scant attention. To date,
only a handful of studies have explored the dynamics of the Patent Office, primarily by
investigating the role of examiner heterogeneity in explaining the outcomes of the patenting
process (Cockburn, Kortum, & Stern, 2003; Lichtman, 2004; Mann, 2014). These
groundbreaking studies raise concerns of an inefficient and inequitable Patent Office,
demonstrating that an applicant’s experience with the application process is largely a function of
the examiner that she randomly receives. However, these studies fail to explore arguably the
5 Notably, our findings also challenge the widely held belief that decreasing patent examiner attrition is vital to
increasing patent quality (Jaffe & Lerner, 2004). 6 This literature has ranged from analyses on how to value patent rights (Pakes, 1986; Jaffe et al., 1993; Harhoff et
al., 1999; Hall et al., 2005), to studies exploring the effect of patents on innovation (Mansfield, 1986; Griliches,
1990; Cohen et al., 2000), to research on the ways in which patents are used and enforced once granted (Lanjouw
and Lerner, 1997), among other investigations.

5
most important outcome of this process—that is, whether the examiner granted the patent—
while also failing to examine whether a particular feature of the Patent Office influenced the
examiner’s behavior.7
Lemley and Sampat (2012) arguably come closest to filling this gap in the literature,
estimating a monotonically increasing relationship between years of examiner experience and
examiner grant rates. Given the natural connection between experience and promotion, their
analysis undoubtedly captures some aspects of the impact of allotted examination time on grant
rates; though, absent data on examiner promotions, they are unable to decouple an experience
effect from an examination-time-allotment effect. Moreover, their analysis is largely cross-
sectional in nature (observing 10,000 patent applications filed in January 2001) and cannot fully
rule out that the observed relationship is attributable to a story of selective retention—i.e., that
senior examiners represent those that have elected to stay and may thus be of a distinct
disposition. By tracking individual examiners over the course of a ten-year period, our fixed-
effects specifications are able to overcome these concerns. While our focus is on understanding
the impact of reductions in allocated examination time and not necessarily on the independent
impacts of examiner experience, we note that the imposition of examiner fixed effects produces
an inverse-U shape in the relationship between grant rates and experience, as opposed to the
monotonically increasing relationship documented in Lemley and Sampat (2012). Some
specifications even suggest a strictly negative influence of experience (in years) on grant rates.
In the next section, we provide a background on the patent examination process and discuss
our theoretical predictions. In Sections II and III, we describe our data and empirical
methodology, respectively. Section IV presents results from our examiner fixed-effects analysis.
Finally, Section V concludes.
I. BACKGROUND AND THEORY
A. Description of Examination Process
Each year between 300,000 and 500,000 patent applications are filed at the Patent Office.
Every patent application contains a specification, which describes the invention, and a set of
claims that defines the metes and bounds of the legal rights the applicant is seeking. In addition,
7 Complicating the study of examiner grant rate was the absence of data on patent applications that failed to
matriculate into an issued patent. Even once this data became publically available in 2001 the
6
to satisfy applicants’ duty of candor under U.S. law,8 patent applications typically disclose to the
Agency “prior art,” that is previous patents, patent applications, or other publications, that are
material to the patentability of the relevant invention.
Before an application enters examination, it is routed to an Art Unit, a group of eight to fifteen
patent examiners who review applications in the same technological field. Upon arrival, the
Supervisory Patent Examiner (SPE) of that Art Unit randomly assigns the application to a
specific examiner. Occasionally, SPEs make non-random assignments, but in those instances,
they do so not based on any characteristic that would affect the patentability of the application
but instead, for instance, on an examiner’s backlog of applications (Lemley & Sampat, 2012).9
The assigned examiner assesses the patentability of the invention based on the criteria outlined
in the Patent Act. Without making any reference to prior art, an examiner can deny a patent on
the grounds that the claimed invention does not involve statutory subject matter (35 U.S.C. §
101), that the invention is not useful (35 U.S.C. §101) or that the application fails to satisfy the
disclosure requirements (35 U.S.C. § 112). In contrast, two other grounds for rejection—i.e.,
lack of novelty (35 U.S.C. § 102) and obviousness (35 U.S.C. § 103)—require the examiner to
make a comparison of the claimed invention with the background art already known to the
public. Before making this assessment, the examiner conducts her own prior art search to
supplement that disclosed by the patent applicant. Because lack-of-novelty and obviousness
rejections require this delicate prior art comparison (and underlying search), they are typically
viewed as being more time consuming to perform than non-art-based rejections. Obviousness
rejections are especially time intensive in this regard, even relative to novelty rejections. While
novelty assessments require that examiners determine whether the claimed invention is covered
by a single prior publication or patent, an obviousness determination requires an examiner to
start with a prior art reference that covers only a portion of the invention and then piece together
additional references or rely upon what is known to one of ordinary skill in the art. The
challenge with, and thus the extra effort associated with, an obviousness rejection comes in
determining whether it would be “obvious” in light of this group of multiple prior art references
8 This duty does not include a duty to search for material information but only a duty to disclosure material
information of which an applicant is aware of. 9 We conducted a series of telephone interviews with former SPEs to confirm these details of patent examination
assignment. Our interviews further substantiated that SPEs do not make any substantive evaluation of an application
before assigning it to a particular examiner.

7
(and/or what is known to one of ordinary skill in the art) to modify any one of the cited prior art
references to achieve the claimed invention.
After assessing the patentability of the claimed invention, an examiner composes a “first office
action” letter to the applicant that accepts, or rejects, the claims. Importantly, because patent
applications are presumed to meet the patentability requirements when filed, a patent examiner
who fails to set forth a basis of rejection must grant the patent. Although some applications will
be allowed in their entirety upon first examination, more frequently, some or all of the claims
will fail to meet at least one of the patentability requirements, as the examiner will detail in the
first office action letter. The applicant then responds by amending the patent claims or disputing
the rejection. After the response, a patent examiner may issue a final rejection or allow the
patent to issue.10
B. Examination-Time Allocations
A number of scholars have surmised that the time constraints facing patent examiners in
assessing the patentability of claims are partly responsible for the Patent Office allowing too
many invalid patents (Jaffe & Lerner, 2004; Lemley, 2001). Although it may take several years
from filing a patent application for an applicant to receive a final patentability decision from the
Patent Office, on average, an examiner spends only nineteen hours reviewing an application,
including reading the patent application, searching for prior art, comparing the prior art with the
patent application, writing a rejection, responding to the patent applicant’s arguments, and often
conducting an interview with the applicant’s attorney (Frakes & Wasserman, 2014).
As explained in greater detail in the Online Appendix, the Patent Office sets expectations
regarding the amount of time examiners should spend on applications.11
The number of hours
allocated for review depends on both the technological field in which the examiner is working
and on her position in the general schedule (GS) pay scale. A patent examiner in a more
complex field is allocated more hours to review an application than an examiner of the same
10
After receiving a final rejection, an aggrieved patent applicant can restart the examination process by filing
a continuation application, appeal the denied application to Patent Trial and Appeal Board, or abandon the
application altogether. 11
These time allotments have largely remained unchanged since 1976. The Patent Office has created new
patent classifications as a result of new and emerging technology. Once the Agency has set the time allotments for a
new technology these allocations also have largely remained unchanged. In 2010, however, the Patent Office
increased the time allotments for every application by two hours.

8
grade who is working in a less complex field. The higher the pay grade of an examiner within a
technology area the fewer number of hours the Patent Office allocates to that examiner. A
promotion to each subsequent pay grade is roughly equated to a ten to fifteen percent decrease in
the number of allocated examination hours.
To demonstrate the degree to which time allocations scale with GS-level changes, we present
in Table 1 the examination time expectations facing a patent examiner working in one of the
most complex fields, artificial intelligence, and one of the least complex fields, compound tools.
Examiners operating at GS-level 14 are expected to review the same patent in approximately half
that time of examiners operating at GS-level 7.
TABLE 1: EXAMINATION HOURS ALLOCATED TO EXAMINER AS A FUNCTION OF GS-LEVEL
(1) (2)
GS-level Compound Tools Artificial
Intelligence
GS-7 19.7 45.1
GS-9 17.3 39.5
GS-11 15.3 35.1
GS-12 13.8 31.6
GS-13 12.0 27.5
GS-13, partial signatory 11.0 25.3
GS-14 10.2 23.4
C. Promotion Process
Patent examiners are hired at different pay grades (GS-5, GS-7, GS-9 or GS-11) depending
upon their educational background and prior experience. Promotions at low pay grades typically
(though not always) occur within a year for examiners that meet their workload expectations
with few errors. In contrast, promotions at the high pay grades (GS-12, 13, and 14) often require
more time, as they generally involve the completion of additional testing or programs.
While we contend that the most significant change associated with a promotion that bears on
the examiner’s decision to grant a patent application is the time allocated to review an
application, there is, upon promotion within GS-13 and to GS-14, also a change in the scrutiny of
their work. Examiners at pay grades GS-13 and below must have their decisions reviewed by an

9
examiner that has “full signatory authority.”12
Patent examiners at pay grades GS-13 may begin
to work towards obtaining such authority by undergoing an evaluation period, which upon
successful completion will result in a promotion to a patent examiner with “partial signatory
authority.” This latter promotion, though not associated with a change in the GS level, does
entail a decrease in the examination time allotted to the promoted examiner and provides that
examiner the ability to sign off independently on first office actions. Upon completing a second
period of evaluation, a GS-13 partial-signatory patent examiner can be promoted to GS-14, a
promotion which provides the examiner with full signatory authority or the right to sign off on
all aspects of an application independently. The fact that variations in scrutiny of this nature
does not occur upon all examination-time-reducing promotions is an important component to our
identification strategy, as discussed in Section IV below.
To our knowledge, nothing else changes upon GS-level promotions that would affect the
manner in which examiners conduct their examination. For instance, the basic structure of
overtime and bonuses remains constant upon GS-level promotions as does the ways in which
examiners earn work credits, in which event one would not expect examiners to face enhanced
financial incentives to grant patents (to the extent that they ever face such incentives) upon
promotions to higher grade levels. We confirmed that GS-level promotions are not associated
with such changes through our review of examiner compensation materials made available by
the Patent Office and through our interviews with former SPEs.
D. Hypothesis
We assume that, when given sufficient time, examiners will conduct their examination
practices in line with proper patentability standards. However, binding time constraints may
force examiners of this otherwise competent disposition to decrease the degree to which they
search prior art, decrease their ability to extend meaningful obviousness rejections and thus
increase the propensity by which they grant patents. We surmise that examiner promotions of
the variety that decrease the amount of time expected to review applications will only tighten
these constraints and intensify such outcomes.
12
Even though these “junior” examiners do most of the work on the application they are listed as secondary
examiners on the application.
10
II. DATA
Most prior investigations into the determinants of examiner behavior have explored only
issued patents (for example, Cockburn, Kortum, and Stern, 2003). Among other things, a
sampling frame of this nature is insufficient to capture arguably the most important decision that
an examiner must make: whether or not to grant the given patent application. Moreover, when
prior studies have considered application-level data, they have done so only with respect to a
subset of applications at one snapshot in time,13
which is insufficient to account for sources of
examiner heterogeneity that may bias the analysis. To overcome these deficiencies and to
facilitate a rich examiner-fixed-effects design, we collected individual application data from the
Patent Office’s Patent Application Information Retrieval (PAIR) database on all 1.4 million
utility patent applications that were filed on or after March, 2001 and that reached a final
disposition—i.e., excluding ongoing applications—by July 2012. The Online Appendix provides
more specifics regarding the construction of this sample.
Though especially rich in content, the PAIR database is not readily suitable for a
comprehensive, machine-readable analysis of granting practices considering that the data is
divided into separate webpages for each individual application, with each webpage providing
information via numerous tab delimited and portable document format (pdf) files. Because of
the nontrivial nature of this data collection we utilized the National Center for Supercomputing
Applications at the University of Illinois to amass and coordinate information contained across
the 1+ million different webpages. Specifically, we collected information on the status of the
application as well as other information about the prosecution process, including, among others,
the patent examiner charged with reviewing the application and the basis of any rejection
associated with the application (e.g., obviousness).
Critical to our analysis is determining the experience (in years) and the GS-level for each of
the 9,000 examiners represented in our analytical file. For these purposes, we match the
examiner field in the PAIR data with the two sets of examiner rosters received pursuant to
separate FOIA requests (one of which dates back to 1992 to facilitate the identification of
experienced examiners at the beginning of our sample). We describe these rosters and this
matching process (including our handling of “fuzzy” name matches) in greater detail in the
13
For example, Lemley and Sampat (2012) consider only 10,000 applications filed in January of 2001.

11
Online Appendix. We likewise provide a breakdown in the Online Appendix of the percentage
of applications reviewed by examiners in each of the relevant GS-levels and experience groups
considered below. The greatest percentages are accounted for by the higher GS-levels (GS-level
12+) considering that examiners spend considerably more time at such ranges. Finally, we treat
the individual who did the majority of work on the application as the examiner charged with
reviewing that application: (1) the non-signatory examiner, when both a non-signatory and an
examiner with signatory authority are associated with an application, or (2) the signatory
examiner, when only one examiner is associated with an application.
For each application in our sample, we relate examiner characteristics, including their pay
grade and experience level, to whether or not the application was granted, our key outcome of
interest. All told, 68 percent of the applications disposed of over this time period were granted
(see Table 2).14
To form our second set of outcome measures, we determine whether the given
application had at least one claim rejected during examination based on each of the following
statutory bases: § 101 (lack of patentable subject matter or utility), § 102 (lack of novelty), § 103
(obvious), and § 112 (failure to meet the disclosure requirements). To the best of our
knowledge, we are the first to report the bases of rejections for any substantial sample of patent
applications.15
Details regarding the process utilized to collect the rejection-type data can be
found in the Online Appendix. The likelihood that a given application received each of the
indicated types of rejections in the sample are as follows: (1) 10 percent, lack of patentable
subject matter or utility; (2) 56 percent, lack of novelty; (3) 72 percent, obvious; and (4) 36
percent, failure to meet the disclosure requirements.
To proxy for how intensively examiners are searching for prior art, we focus on the sample of
patents issued over the above-specified time period (as distinct from the sample of applications
over this time period) and collect information on the share of prior art references listed in each
14
As stated previously, continuation applications, as distinct from the now more common RCEs, are counted
as a rejection / abandonment of the original application and the filing of a new application within the PAIR database
(RCEs, which keep the same serial number and stay with the same examiner, are not treated as new applications).
Accordingly, this 70 percent rate does not necessarily capture the percentage of original applications that are
ultimately allowed considering that some continuation applications may successfully issue. It is important to note
that this is merely a classification question—i.e., do these events contribute or not contribute to the Patent Office’s
grant rate? Our focus is largely on exploring the relationship between the grant rate, however it is defined, and
certain characteristics of the examiners. 15
Cotropia, et al., 2012, however, have previously reported rejection data for 1,554 patents issued in 2007.

12
issued patent that emanate from the examiner rather than the applicant.16
Previous investigations
have reported that examiners are more likely to rely upon prior art they discovered during their
own search, rather than art disclosed by an applicant, to reject a patent application (Cotropia,
Lemley, and Sampat, 2012).
TABLE 2. SUMMARY STATISTICS
Incidence of Gran ted Pa ten t 0.676
(0.468)
Incidence of Any Obviousness Reject ion 0.718
(0.449)
Share of Reject ions based on Obviousness 0.454
(0.283)
Share of Pr ior Art Cita t ions Origina t ing from Examiner 0.545
(0.367)
Incidence of Pa ten t Renewal a t 4 Years (Issued between 2002 and 2009) 0.886
(0.318)
Incidence of Pa ten t Renewal a t 8 Years (Issued between 2002 and 2005) 0.716
(0.451)
Forward-looking Cita t ions (from Ut ility Pa ten ts) 1.884
(5.466)
Genera lity Score 0.216
(0.357)
Incidence of Large-Ent ity Applican t 0.734
(0.442)
Sta t ist ics a re from the collect ion of applica t ions in the PTO’s PAIR da tabase tha t reached a final
disposit ion and tha t were published in the PAIR records between March , 2001 and J u ly, 2012.
Sta t ist ics bear ing on prior a r t cita t ions, renewal incidences , forward-looking cita t ions and
genera lity scores a re from the subset of pa ten ts gran ted ou t of th is init ia l set of applicat ions.
A final set of outcome measures considered in the analysis below is meant to reflect on the
quality and value of the patents issued by the Patent Office. Consistent with the relevant patent
literature, we amass for each issued patent in our sample the following metrics of value: (1) the
incidence of patent renewal at both 4 and 8 years (Schankerman and Pakes, 1986), (2) the
number of citations made by subsequent patents, normalized by the number of claims (Hall, Jaffe
and Trajtenberg, 2005), and (3) the degree of concentration among various technologies in the
16
Several studies have used the share of references listed in an issued patent originating from the applicant or
examiner as a proxy for the extent to which the party in question (examiner or applicant) searched the prior art
(Lemley and Sampat, 2012; Sampat, 2010; Alcacer et al., 2009).

13
subsequent citations made to the relevant patent—i.e., the patent’s “generality” score—which is
suggestive of the patent’s breadth in impact (Hall, Jaffe and Trajtenberg, 2001).17
III. METHODOLOGY
To explore how patent examination practices change upon promotions that leave examiners
with less examination time, we estimate the following:
( )
(1)
where a indexes the individual application, i indexes the individual examiner, k indexes the
technology associated with the application and t indexes the year in which the application is
disposed of by the examiner. GRANTaikt indicates whether or not the given application was
allowed by the examiner. Year fixed effects are captured by . GSit represents a set of dummy
variables capturing the incidence of the examiner assigned to the underlying application falling
into each of the general schedule (GS) pay-grade levels. This variable also includes separate
categories for GS-13 without partial signatory authority and GS-13 with partial signatory
authority, considering that this unique within-GS-level promotion likewise carries with it
reductions in examination-time expectations. The ability to draw upon a within-GS-level change
in the time allotment extended to examiners provides us with a welcome opportunity to challenge
the argument that the analysis may be purely driven by factors changing with GS-level
promotions other than examination time allocations.
Furthermore, EXPERit captures a set of dummy variables for the incidence of the relevant
examiner falling into a range of experience-level categories (0-1 years, 2-3 years, etc.), where
experience is signified by the number of years (in 2-year bins) at the time of the application’s
disposition that the relevant examiner has been with the Patent Office. In other specifications, as
discussed in detail in Section IV, we nest experience within GS-level categories and thus create
dummy variables capturing a series of experience categories within each GS-level. In certain
17
Patent generality is calculated as 1 minus the Herfindahl Index of the technological concentration of forward-looking
citations (using the 37 NBER technology sub-categories). The generality score is set at 0 for those patents without any forward-
looking citations, though the pattern of results presented below is robust to simply conditioning the analysis on those issued
patents with at least one forward-looking citation (as discussed below). Forward-looking citations are often corrected for sample
truncation at a technology-specific level (Hall et al, 2001). As an alternative to this truncation correction, we estimate the
forward-looking-citation specifications while including technology-by-year fixed effects.

14
robustness checks, we include a set of technology-by-year fixed effects, (using the 37
technology subcategories set forth in Hall et al, 2001) , to alleviate concerns that examiners may
be reassigned to different technologies as they ascend to higher pay-grades and that such
reallocation schemes may change over time (e.g., with fluctuating economic conditions). Other
specifications include certain individual characteristics of the applications, , including the
entity size status of the applicant (large versus small) and the length of time being the filing and
the disposition of the application (and its square).
Importantly, a set of examiner fixed effects are captured by . Such fixed effects help address
concerns that more experienced examiners and higher GS-level examiners are fundamentally
different from their more junior counterparts, for reasons beyond mere differences in seniority
and promotion levels—e.g., concerns that examiners who have reached higher grade levels and
thus who have been successful in attaining promotions may be those with a stronger inherent
disposition towards granting in the first place, along with concerns that more experienced
examiners may also differ from less experienced examiners simply because they elected to stay
at the Patent Office.
IV. RESULTS
A. Grant-Rate Analysis
1. Primary Results
We begin our exploration into the effects of allotted examination time—as identified by the
occurrence of certain examiner promotions—by plotting the evolution of grant rates observed
over the course of a given examiner’s career as they rise in the ranks. More specifically, in
Figure 1, we plot results from a regression of the incidence of an application being granted on a
set of dummy variables capturing each of the relevant examiner pay grades (7, 9, 11, 12, 13, 13
partial signatory, and 14), in addition to a set of year fixed effects and examiner fixed effects (see
Column 1 of Table 3 for the tabular regression results underlying this figure).18
Figure 1
suggests that the grant rates increase with each grade-level promotion, including increases as
18
Standard errors are clustered at the examiner level to account for autocorrelation over time in examiner-
specific residuals. Given computational considerations in light of the over-1-million observations and nearly 9,000
examiner fixed effects, we elect to estimate linear probability models throughout. We note, however, that the
pattern of results we present are virtually unchanged when we instead take a 10-percent random sub-sample of
examiners and estimate conditional logit specifications (available upon request from the authors).

15
given examiners initially ascend to GS-level 13 and subsequently ascend to GS-level 13 with
partial signatory authority. We find that as an examiner moves from GS-level 7 to GS-level 9,
they increase their grant rates by 2.8 percentage points (or by roughly 4 percent). As the
examiner ascends even higher in ranks and thus as the examiner receives less and less time to
review her applications, this increase in grant rates continues monotonically until the point at
which her grant rate at GS-level 14 is 19.0 percentage points (or nearly 28 percent) higher than it
was when she was at GS-7.

16
TABLE 3. RELATIONSHIP BETWEEN GRANT RATES AND EXPERIENCE AND GRADE LEVELS OF
THE ASSOCIATED PATENT EXAMINER
(1) (2) (3) (4) (5) (6)
Omit ted: GS-7 (omit ted:
GS-11)
GS-9 0.028***
(0.008)
0.012
(0.008)
0.026***
(0.008)
0.016**
(0.007)
-0.002
(0.022) -
GS-11 0.064***
(0.009)
0.016*
(0.009)
0.057***
(0.008)
0.035***
(0.008)
0.011
(0.020) -
GS-12 0.102***
(0.009)
0.032***
(0.009)
0.085***
(0.009)
0.052***
(0.008)
0.045**
(0.022)
0.034***
(0.005)
GS-13 0.135***
(0.010)
0.050***
(0.010)
0.104***
(0.009)
0.072***
(0.009)
0.059**
(0.024)
0.072***
(0.006)
GS-13 (with pa r t ia l signa tory
au thor ity)
0.161***
(0.010)
0.077***
(0.010)
0.124***
(0.009)
0.098***
(0.009)
0.067***
(0.022)
0.095***
(0.008)
GS-14 0.190***
(0.011)
0.108***
(0.011)
0.144***
(0.010)
0.122***
(0.009)
0.093***
(0.027)
0.130***
(0.009)
Omit ted: 0-1 Years Exper ien ce
2-3 Years Exper ience - 0.076***
(0.004) - - - -
4-5 Years Exper ience - 0.081***
(0.006) - - - -
6-7 Years Exper ience - 0.073***
(0.007) - - - -
8-9 Years Exper ience - 0.057***
(0.009) - - - -
10-11 Years Exper ience - 0.045***
(0.010) - - - -
12-13 Years Exper ience - 0.027**
(0.012) - - - -
14+ Years Exper ience - 0.001
(0.015) - - - -
N 1149033 1149033 1019145 1019145 48460 273070
Examiner and Year F ixed
Effects? YES YES YES YES YES YES
Applica t ion Covar ia tes and
Technology-by-Year F ixed
Effects?
NO NO YES YES NO NO
Control for Incidence of RCE? NO NO NO YES NO NO
Balanced Sample of
Examiners from
GS-7 to GS-14?
NO NO NO NO YES NO
Balanced Sample of
Examiners from
GS-11 to GS-14
NO NO NO NO NO YES
* significant at 10%; ** significant at 5%; *** significant at 1%. Standard errors are reported in parentheses and are clustered to correct for autocorrelation within given examiners over time. Each observation is a given application from the PAIR database that reached a final disposition and that was published in the PAIR records between March, 2001 and July, 2012. The specification in Column 5 includes applications only from those examiners that started the sample period at GS-7 and ascended to at least GS-14 over the sample period. The specification in Column 6 includes applications only from those examiners that started the sample period at GS-11 and below and ascended to at least GS-14 over the sample period, focusing only those applications that they disposed of while at GS-11 through GS-14.

17
Figure 1: Relationship between Examiner GS Levels and Grant Rate
Notes: this figure presents results from a regression of the incidence of a granted application on dummy variables representing each General
Schedule level between 7 and 14, including both GS-13 with and without partial signatory authority. The dummy variable for GS-level 7 is
omitted, representing the reference group. The vertical bars represent 95% confidence intervals for the estimated coefficients. Regressions
include examiner and year fixed effects. Standard errors are clustered at the examiner level.
Essential to our analysis is the separation of the effects stemming from grade-level promotions
and from the acquisition of additional years of experience within the Agency. Note from the
outset that while such events naturally correlate with each other, they do not do so perfectly.
That is, examiners do not always receive promotions lockstep with experience, allowing us to
separately identify these forces. This is especially true from GS-12 onwards when examiners
begin to routinely spend multiple years (to varying degrees) at the respective grade.19
By
including year fixed effects in a specification with examiner fixed effects, we are necessarily
capturing year-by-year changes in the behavior of the individual examiners under investigation.
In other words, the regression specification underlying Figure 1 estimates the relationship
between grant rates and GS-level changes while necessarily controlling for yearly changes in
examiner experience.
19
Over 75 percent of examiners who have reached the stage of GS-level 14 stay at that grade level over a
year, with over 20 percent staying for at least 8 years. On the other hand, only 16 percent of examiners who have
been at GS-level 7 stay at that grade beyond 1 year.
0.0
00
.05
0.1
00
.15
0.2
0
Gra
nt R
ate
at In
dica
ted
Gra
de
Rel
ativ
e to
GS
-Lev
el 7
GS-7 GS-9 GS-11 GS-12 GS-13 (1) GS-13 (2) GS-14
Grade
Relative Grant Rate: Confidence Internval Relative Grant Rate: Mean

18
Examiner behavior may change over time under a range of theories. For instance, with more
years of experience, examiners may become better at identifying allowable subject matter. On
the other hand, it could be the case that examiners simply lessen their scrutiny as time goes by in
the Patent Office due to an increased tendency to shirk. To the extent that any such stories are
even present in the first place—which we address more directly below—the above findings
demonstrate a distinct jump in grant rates that occurs upon GS-level promotion independent of
any flexible pattern of grant rates that examiners exhibit over time itself. Considering that the
key channel by which the act of promotion may theoretically impact subsequent examination
behavior stems from its effect on the time allotted to examination (as discussed above), these
results provide greater confidence that (1) time constraints may be binding on examiners and (2)
that tightening such constraints may leave examiners with less time to adequately challenge the
patentability of applications.20
We further support this contention below with even richer
methods of decoupling experience from promotions and with investigations into examiner search
efforts and rejection patterns. Beforehand, however, we briefly discuss the relationship that we
nonetheless estimate between grant rates and an increase in examiner experience in years.
2. Experience Effects
Though experience effects are arguably subsumed within the year fixed effects in the above
specification, it would be of interest to identify the effects of experience independently in order
to more fully evaluate the determinants of examiner behavior. Analogous to the well-known
difficulty in separately identifying year, age and cohort effects in labor economics settings
(Heckman and Robb 1985),21
it is not possible to distinguish year effects from annual experience
effects in specifications that include examiner fixed effects, absent additional normalization
restrictions. In our primary approach to isolating the independent impacts of experience, we
20
We acknowledge that some examiners may attempt to increase their chances of promotion by granting
more permissively as a general matter of course, either because such behavior may facilitate the processing of a
greater number of applications or in light of the financial interests of the Agency in over-granting patent (Frakes and
Wasserman 2013). Our fixed effects methodology is designed to place inherent granting tendencies aside—
including those stemming from promotion-seeking behavior—and instead focus on within-examiner changes in
behaviors over the course of a career. For a story of this nature to explain the results, it would have to be the case
that promotion-seeking behavior elevates in intensity upon each promotion. Cutting against this latter theory are the
drops in grant rates that we observe within particular GS levels over time, as we discuss below. 21
Behind this problem is the identity: calendar year = year of birth (cohort) + age.

19
estimate specifications that achieve the necessary restrictions by specifying examiner experience
dummies into two-year blocks—i.e., 0-1 years of experience, 2-3 years of experience, etc.22
Figure 2: Relationship between Examiner Experience Groups and Grant Rate, Controlling for
GS Level
Notes: this figure presents results from a regression of the incidence of a granted application on dummy variables representing each General
Schedule level between 7 and 14, including both GS-13 with and without partial signatory authority, along with dummy variables representing
the incidence of 8 different experience (in years) groups. This figure presents the coefficients of the experience group dummies only. The
vertical bars represent 95% confidence intervals for the estimated coefficients. Regressions include examiner and year fixed effects. Standard
errors are clustered at the examiner level.
In Column 2 of Table 3, we present results from this attempt to separately estimate GS-level,
year and experience effects, where we focus on presenting the effects of GS-level changes and
experience changes, leaving year effects as a nuisance control. Encouragingly, the pattern of
estimated GS-level dummy coefficients from this specification is similar to that depicted in
Column 1 of Table 3 and in Figure 1, especially over the higher GS-levels where, as above, it
22
By specifying experience groups in this manner, it is no longer the case that experience dummies would be
perfectly collinear with year dummies (as would be the case with both yearly examiner fixed effects and year
effects). See de Ree and Alessie (2011) for a discussion as to how specifying age effects in blocks breaks the age +
cohort = year identity. We note that our results generalize to alternative normalization restrictions, including the use
of 3- or 4-year experience bins or to the use of a 0-1 year experience bin along with yearly experience dummies
thereafter. In each case, we continue to document an inverse-U pattern (results available upon request).
-0.0
50.
000.
050.
10
Gra
nt R
ate
at In
dica
ted
Gro
up R
elat
ive
to
Firs
t Exp
erie
nce
Gro
up
0-1 Yrs 2-3 Yrs 4-5 Yrs 6-7 Yrs 8-9 Yrs 10-11 Yrs 12-13 Yrs 14+ Yrs
Group
Relative Grant Rate: Confidence Internval Relative Grant Rate: Mean

20
becomes easier to separate the effects of promotions from experience. In Figure 2, we plot the
estimated coefficients of the experience group dummies from this specification. As
demonstrated by this figure (and by Figure A4 in the Online Appendix where we include only
experience dummies and not GS-level dummies), the relationship between examiner experience
(in years) and grant rate follows an inverse-U pattern. Controlling for grade-level dummies and
year effects, grant rates do increase by close to 8 percentage points as an examiner moves from
0-1 to 2-3 years of experience. The grant rate effectively stays at this level through 5 years of
experience and thereafter begins to fall, until the point at which the grant rate at 14+ years of
experience is identical to the 0-1 year experience level.
These findings stand in contrast with Lemley and Sampat (2012), who found that grant rates
increase monotonically with experience. While Lemley and Sampat acknowledged the
possibility that their findings could be attributable to changes in time allotments upon
promotions—i.e., the focus of the present study—they did not have data sufficient to decouple
experience from other factors that would allow them to draw any such inference. In addition to
the lack of GS-level data, Lemley and Sampat’s analysis, though very careful, was largely cross-
sectional and could not fully account for the possibility that the results are driven by selective
retention—i.e., that those who stayed with the Agency longer and thus formed the senior group
were of a different disposition.23
As presented in the Online Appendix, we do replicate the
monotonic rise in grant rates found in Lemley and Sampat (2012) when we likewise take a cross-
sectional approach that includes only year and experience-group dummies.24
However, when we
account more flexibly for examiner heterogeneity through the inclusion of examiner fixed
effects, we find the inverse-U pattern presented in Figure 2.
3. Within-Grade Experience Effects
In this sub-section, we take an alternative approach to separating grade-level effects from
experience effects. Instead of simply estimating the overall impacts of being at the PTO for a
23
To partially address selection concerns, Lemley and Sampat (2012) did, however, include a dummy
variable for whether or not the examiner associated with the given application ultimately stayed with the Agency for
at least five years. This approach cannot account for as many sources of examiner heterogeneity as can be provided
by an examiner fixed effects specification. 24
Moreover, we note that the monotonically increasing pattern of results from this cross-sectional
specification remains nearly unchanged with the inclusion of a control variable for whether or not the examiner
associated with the application ultimately stays at least five years, following Lemley and Sampat (2012).

21
given number of years, we nest experience years within grade levels. In other words, we
estimate specifications that include a series of dummy variables capturing the presence of
specific years within specific grade levels—e.g., 0-1 years in GS-13, 2-3 years in GS-13, 0-1
years in GS-14, 2-3 years in GS-14 etc. This approach allows us to more comprehensively
follow the course of a hypothetical examiner over the various stages of a career and thus better
visualize the independent impacts of examination-time-reducing promotions. For this analysis,
we focus only on those examiners in GS-12 and above considering that the majority (though not
all) of those within lower grade levels achieve promotions within their first year at those grades,
providing little ability to reliably track the evolution of grant rates over years while at GS-7, 9 or
11.
Figure 3: Relationship between Grant Rate and Increases in Experience Years within Distinct
Grade Levels
Notes: In the specification underlying this figure, we regress the incidence of the application being granted on a series of dummy variables
capturing specific experience years within each grade level, beginning at GS-level 12. We track examiners for 1-2, 3-4, 5-6, 7-8 and 9+ years
within GS level 12 and then the same within each of GS-level 13 without signatory authority, GS-level 13 with signatory authority and, finally, GS-level 14. Specifications include both examiner and year fixed effects. Standard errors are clustered at the examiner level.
-0.1
0-0
.05
0.0
00
.05
0.1
00
.15
Gra
nt R
ate
at In
dica
ted
Gra
de/E
xper
ienc
e
Gro
up R
elat
ive
to G
S-L
evel
12
/ 1st
Yea
r G
roup
GS-12 GS-13 (1) GS-13(2) GS-14
Grade Level / Experience Group (2-Year Incrementswithin each Level)
Relative Grant Rate: Confidence Internval Relative Grant Rate: Mean

22
Figure 3 plots the results of this exercise, presenting the coefficients of each of these separate
dummy variables, with the 0-1 year period at GS-12 serving as the omitted reference group. The
results only further solidify the contention that examination practices change upon the
occurrence of career events with respect to which the time allocated to examiners is reduced.
Upon each such promotion, the observed grant rate jumps. Importantly, these promotion-level
increases do not appear to be mere reflections of continuing trends in grant rates over the
duration of an examiner’s tenure at the specific grades, which might otherwise suggest a simple
experience-level story or which might otherwise suggest a selection story in which the PTO
elects to promote examiners at points in time in which the examiners begin to grant at elevated
rates. Consider, for instance, GS-level 14, a level in which examiners spend on average 4.5
years upon reaching. While the grant rate jumps distinctly once one enters this GS level (to a
degree that is 8 percentage points higher than the reference period), the grant rate actually begins
to fall thereafter. By the time a GS-14 examiner reaches her 5-6th
year at that level, her grant rate
has fallen by 2 percentage points below the rate she applied in her first year at GS-level 14. In
the period represented by her 9th
year and beyond, her grant rate is 8 percentage points below the
initial GS-14 grant rate. If the grant rate had incrementally continued to rise over such years,
especially at levels commensurate with those experienced upon grade level changes, it would
instill less confidence in an interpretation of the results as emanating from reductions in the
amount of time at the disposal of examiners.
Indeed, if anything, this picture depicts a story in which experience (in years) alone ultimately
corresponds to a reduction in granting tendencies, standing in stark contrast with the positive
relationship documented in Lemley and Sampat (2012). With respect to each of the four given
promotion categories considered in Figure 3, the grant rate ultimately begins to fall over time as
one stays within the respective category long enough. These drops in grant rates with experience
are periodically corrected by successive promotions of the sort that leave examiners with
diminished examination time. If anything, the declines in grant rates observed over the temporal
dimension of Figure 3—that is, over the increases in years within the various grade levels—
perhaps suggest a story in which examiners in general learn over time how to form more
effective bases of rejection (thus contributing to falling grant rates), only to have this learning
process interrupted by occasional promotions that diminish the amount of time they have to
derive such rejections (thus re-elevating grant rates).
23
In discussing Figure 3, it also bears mentioning that examiners may continue to receive salary
increases throughout their tenure at each GS-level. The presence of such alternative types of
promotions—that is, within-GS-level increases in salary that are tied only to experience—are
further helpful for our analysis in providing support against an argument that the primary
findings set forth above are attributable merely to any increases in income associated with GS-
level promotions.25
If such a story were driving the results, one would further expect to observe
increases in grant rates over the course of years while in specific GS-levels, especially GS-level
14, where examiners stay many years on average.
4. Caveats
To be sure, our identification of GS-level effects as distinct from experience effects is drawn
from the experiences of those examiners that happen to stay within those GS levels for some
time before being promoted. For low GS levels, this group of examiners is more select. It is
unclear whether such local findings generalize to the quick risers within the Agency.
Nonetheless, the same pattern of grant-rate increases upon promotion is present as we proceed to
higher and higher grade levels, where it is more common for examiners to spend multiple years
within given GS levels, lending some confidence to a more general story.
Similar concerns arise for the case of the within-GS-level declines in grant rates over time
demonstrated in Figure 3. After all, only a small minority of examiners at GS-levels 12 and 13
stay at those grades over the full course of years depicted in Figure 3. Perhaps the most
conservative way to interpret our results is that with respect to at least some examiners—that is,
those that happen to achieve promotions relatively more slowly—the effects of increased
temporal experience on grant rates appears to generally be negative. For those other examiners
that experience early promotions more rapidly, it is difficult to say what role experience plays as
distinct from GS-level changes during these early years. Nonetheless, such quick risers at least
stay for a long time at GS-14 at which point their grant rates do indeed fall with more years of
experience.
25
Examiners are promoted to different “steps”—e.g., Step 1 at GS-12, Step 2 at GS-12, etc. These step
promotions generally transpire with increases in experience over time, as distinct from merit based promotions, and
generally entail a meaningful increase in salary level. For instance, a GS-level 14 at “Step 5” is paid $128,941 while
a GS-level 14 at Step 10 is paid $147,900.

24
5. Sample Balance
A related concern stems from the sample imbalance in the above specifications. Take Figure 1
for instance. Though examiners in our sample experience on average nearly 4 of the 7 possible
promotions depicted in this figure and though the relevant GS-level coefficients are identified by
actual within-examiner changes in grade levels for at least some subset of examiners (as opposed
to across-examiner comparisons), the underlying specification does not follow all examiners
throughout each of the indicated grade levels. Nonetheless, in Columns 4 and 5 of Table 3, we
present results of a balanced-sample analog of Column 1/Figure 1 in which we follow a more
select group of examiners that experience each of the indicated promotions. The findings
parallel those presented above. We present a range of similar balanced-sample exercises in the
Online Appendix generally confirming the robustness of the above findings.
6. Other Robustness Checks
Covariates and Technology Effects. We further challenge the above grant-rate results through
a range of additional robustness exercises. For instance, we demonstrate in Column 3 of Table 3
that the above findings remain virtually unchanged when we include controls for the entity size
status of the applicant (large or small entity) and for the duration (in days) of the period between
filing and final disposition of the application, along with the square of this duration. The results
are also not affected by the inclusion of technology-by-year fixed effects to rule out concerns
that the results may be a reflection of examiners switching to different technologies as they are
promoted, with this switching occurring to a differential degree over time, as general economic
conditions change (Column 3 of Table 3).
Falsification Exercise. In Column 7 of Table 4, we conduct a falsification test in which we
estimate the relationship between the promotions of interest and one characteristic of the
underlying application with respect to which the examiner has no ability to alter (and with
respect to which we have data): whether or not the applicant is a large or small entity (as such
terms are used by the Patent Office to set application fees). Encouragingly, from GS-level 11
onwards, we estimate no significant change in the incidence of a large-entity applicant, with the
levels virtually identical from GS-12 onwards. This lends further confidence to the contention

25
that applications are randomly sorted, especially in the grade levels of most interest for our
analysis. We note, however, a small increase in this likelihood leading up to GS-11.
RCE Controls. As demonstrated by the Online Appendix, the results are also robust to the
inclusion of a control for the incidence of a request-for-continued examination (RCE) associated
with the application, which is a device used by applicants to continue the examination process in
the face of an examiner’s final rejection. Given the tendency of RCEs to prolong the
examination process, it is not surprising that the percentage of an examiner’s dispositions that
involve an RCE filing will grow with experience. With this in mind, one may be concerned that
grant rates may rise with experience and/or promotions given the possibility that continuation
devices such as RCE filings increase the ultimate chances that the underlying application will be
allowed. Alleviating this concern, we find that the estimated pattern of results persists (though
with slightly smaller magnitudes) when controlling for the incidence of an RCE filing in the
underlying application and, alternatively, when conditioning the analysis on those applications
without an RCE filing.
Examination Duration Imbalance. Given that we only observe applications filed after March
2001, one may also be concerned that applications reaching a final disposition in the early years
in the sample will be disproportionately comprised of quicker moving applications, whereas
those observed in the later years in the sample represent a richer mix of quick- and slow-moving
applications. This may be of consequence considering that prosecution durations may impact
grant rates due to the higher likelihood of applicants abandoning their applications during long
durations. However, an increased incidence of longer-duration prosecution periods later in the
sample does not necessarily confound the above analysis considering (1) the imposition of year
fixed effects to capture any general trends in granting practices, (2) that we observe overlapping
cohorts of examiners, in which event examiners are moving among each of the various grade
(and experience) levels during every year of the sample and (3) that controls are available for the
time between filing and disposition of each application. Nonetheless, to more comprehensively
address any inconsistency in the set of applications under investigation, we also estimate an
alternative specification in which we begin the period of observation in 2004 and confine the
sample of applications to those that are disposed of within a three-year period. By focusing only
on applications of limited prosecution duration, we ensure consistency in the relative mix of
26
application durations observed.26
In the Online Appendix, we demonstrate that the above results
are likewise robust to this alternative sampling approach.
GS-15 Examiners. For the reasons set forth in the Online Appendix, we exclude those few
applications examined by GS-15 examiners from the primary analysis (< 3 percent of all
applications). While published, official records regarding the scaling of time allotments upon
promotions suggest that GS-15 examiners should be given even less time than GS-14 examiners
to review applications, the examiner-level time allotment information we received from the
Patent Office suggested that this may not be the case for many of the GS-15 examiners. In spite
of this discrepancy, we estimate specifications in the Online Appendix that include these GS-15-
examined applications and assume that GS-15 examiners are indeed given less time for review,
as the official schedules suggest they should. As demonstrated by Figures A6 and A7, we
continue to estimate the same pattern of results with this inclusion.
26
Of course, imposing this duration limitation forces us to exclude 2002 and 2003 as there will be few
applications disposed of in these years that fall near the 3-year duration mark, despite the fact that we would observe
more of such applications in the later sample years, which could otherwise undercut the balancing impulse of this
exercise.

27
TABLE 4. RELATIONSHIP BETWEEN VARIOUS APPLICATION / PATENT OUTCOMES AND GRADE
LEVELS OF THE ASSOCIATED PATENT EXAMINER
(1) (2) (3) (4) (5) (6)
SHARE OF
REJ ECTIONS
BASED ON
OBVIOUS-
NESS
SHARE OF
P RIOR ART
CITATIONS
FROM
EXAMINER
INCIDENCE
OF
RENEWAL
AT 4 YEARS
(2002-2009)
INCIDENCE
OF
RENEWAL
AT 8 YEARS
(2002-2005)
F ORWARD-
LOOKING
CITATIONS
(LOGGED)
GENERAL-
ITY SCORE
(LOGGED)
LARGE
ENTITY
STATUS OF
APPLICANT
(F ALSIFICAT
ION TEST)
Omit ted: GS-7
GS-9 -0.001
(0.004)
-0.002
(0.006)
0.018*
(0.010)
0.047
(0.034)
0.030***
(0.010)
0.041
(0.028)
0.018***
(0.005)
GS-11 -0.007*
(0.004)
-0.013*
(0.007)
0.009
(0.010)
0.023
(0.036)
0.049***
(0.011)
0.085***
(0.028)
0.038***
(0.005)
GS-12 -0.023***
(0.004)
-0.029***
(0.007)
-0.033***
(0.011)
-0.049
(0.038)
0.045***
(0.012)
0.062**
(0.029)
0.045***
(0.006)
GS-13 -0.025***
(0.004)
-0.037***
(0.007)
-0.080***
(0.012)
-0.156***
(0.040)
0.028**
(0.013)
0.041
(0.030)
0.045***
(0.006)
GS-13 (with
par t ia l signatory
au thor ity)
-0.031***
(0.004)
-0.040***
(0.007)
-0.154***
(0.012)
-0.288***
(0.040)
-0.002
(0.013)
-0.012
(0.031)
0.045***
(0.006)
GS-14 -0.044***
(0.005)
-0.040***
(0.007)
-0.217***
(0.014)
-0.417***
(0.042)
-0.014
(0.014)
-0.039
(0.032)
0.046***
(0.006)
N 881433 634558 544791 200412 742390 742390 1019225
Examiner and
Year F ixed
Effects?
YES YES YES YES YES YES YES
* significant at 10%; ** significant at 5%; *** significant at 1%. Standard errors are reported in parentheses and are clustered to correct for autocorrelation within given examiners over time. Each observation is a given application from the PAIR database that reached a final disposition and that was published in the PAIR records between March, 2001 and July, 2012. Columns 1 is run on the sample of applications over the relevant time period that include at least one rejection in the prosecution history. Columns 2 – 6 are run on the subsample of applications over the relevant time period that culminate in an issuance of a patent. Column 7 is run on the full sample of applications over the relevant time period.
B. Analysis of Rejection Patterns
1. Obviousness
A key prediction set forth above is that examiners will begin to perform fewer and fewer
rejections based on the argument that the proposed claims are obvious—an especially time
intensive analysis—upon the occurrence of promotions that leave them with less and less
allocated examination time. We now attempt to illuminate the above grant-rate findings by
testing this secondary hypothesis and exploring the effects of promotions on the incidence of
obviousness rejections among the underlying applications.

28
Figure 4: Relationship between Obviousness Rejection Rates / Search Scrutiny and Grade
Levels of Associated Patent Examiner
Notes: this figure plots results of the coefficients estimated in Columns 1 and 2 of Table 4, in which we regress the indicated outcome on dummy
variables representing each General Schedule level between 7 and 14, including both GS-13 with and without partial signatory authority. The
dummy variable for GS-level 7 is omitted, representing the reference group. Confidence bounds are omitted for visual clarity. Regressions include examiner and year fixed effects.
One limitation of the data that we collected for this analysis, as novel as it is, is that we simply
capture the incidence of any obviousness rejection without knowing the full force of such
rejection. Does it simply cover one claim or many claims? Is it easy to overcome or difficult?
Such questions cannot be adequately resolved with the data collected. With this limitation in
mind, we first take an approach where we do not view obviousness rejections in an absolute
sense, but instead specify the dependent variable as the ratio of obviousness rejections to total
rejections, more specifically the incidence of an obviousness rejection divided by the sum of the
incidence of the following types of rejections: obviousness, lack of novelty, lack of patentable
subject matter/utility, and failure to satisfy the disclosure requirements. Though each of the
variables underlying this ratio suffer from the above limitation, this measure at least provides us
with a sense of the relative effort spent on obviousness rejections. In Column 1 of Table 4
(depicted in Figure 4), we replicate the basic specification estimated above but use this
-.1
-.08
-.06
-.04
-.02
0
Rel
evan
t Out
com
e at
Indi
cate
d G
rade
,
Rel
ativ
e to
Cor
resp
ondi
ng O
utco
me
at G
S-L
evel
7
GS-7 GS-9 GS-11 GS-12 GS-13 (1) GS-13 (2) GS-14Grade
Obviousness_Share Examiner_Cite_Share

29
obviousness share measure as the dependent variable. The results suggest a monotonically
strengthening decline in this obviousness rejection share upon the promotions of interest,
suggesting a story in which examiners begin to spend less and less of their efforts on time-
intensive obviousness analyses upon promotions that leave them with less and less time at their
disposal. Figures A11 and A12 of the Online Appendix plots trends over GS-level increases in
the incidence of each type of rejection separately, further illuminating the pattern of results
presented in Column 1 of Table 4.
Figure 5: Relationship between Examiner GS Levels and Share of Rejections based on
Obviousness
Notes: this figure replicates that of Figure 3 except that it replaces the incidence of an application being granted with the share of rejections for
the application constituting an obviousness rejection as the dependent variable.
In Figure 5, we follow the approach of Figure 3 and track how the share of obviousness
rejections evolves as an examiner increases in tenure over time within particular grades.
Complementing Figure 3, which demonstrates a general trend to decrease grant rates over time
within given grade levels, Figure 5 likewise demonstrates a corresponding tendency over the
time dimension to increase rates of obviousness rejections. This may even be consistent with a
-0.0
50
.00
0.0
50
.10
Obvi
ousn
ess
Reje
ctio
n S
hare
at In
dic
ate
d
Gra
de/E
xperience
Gro
up R
ela
tive to
GS
-Leve
l 12 / 1
st Y
ear
Gro
up
GS-12 GS-13 (1) GS-13(2) GS-14
Grade Level / Experience Group(2-Year Increments within each Level)
Relative Obviousness RejectionShare: Confidence Internval
Relative Obviousness RejectionShare: Mean

30
learning story in which examiners get better and better at forming obviousness determinations
over time. Periodically, however, examiners will experience promotions that cut short the time
they have to make such rejections. Figure 5 suggests that upon such instances, the rates at which
they are able to form obviousness rejections fall back down (also see Figure __ in the Online
Appendix which replicates this figure using the incidence of an obviousness rejection as opposed
to the share of obviousness rejections as the relevant dependent variable).
2. Caveats
As discussed in Section I, once an examiner reaches the second GS-13 classification and GS-
level 14, she attains more authority of her own to sign off on decisions, thus representing a
decline in the level of scrutiny placed on her by her superiors. One may be concerned that the
increase in grant rates and the decline in the incidence of obviousness rejections observed upon
promotion are merely a reflection of this lightening of scrutiny. However, the fact that this
pattern of increasing granting tendencies and decrease in obviousness rejections occurs over
earlier promotions, which do not come with the formal extension of greater authority and less
oversight, lends support to the idea that the documented pattern of results may stem from the
allotted-hours reduction associated with these promotions and not simply from changes in the
degree of oversight.
We acknowledge, however, it is possible that informally examiners experience a lightening of
scrutiny as they are promoted. That is, supervisors may lessen the extent they review an
examiner’s work as she gets promoted from GS-7 through GS-13, even though there is no formal
policy by the Patent Office to do so. If this occurs, our results would still hold but their
interpretation would differ. Examiners may grant more patents and make less obviousness
rejections upon promotion not because they become more time constrained but instead because
the work is subject to less review, enabling examiners to increasingly shirk their responsibilities.
Nevertheless, one may take our findings as being more consistent with increasing time
constraints rather than a lightening of scrutiny for several reasons. First, and most importantly,
we demonstrate in Figures A8-A10 in the Online Appendix that the basis of rejection that falls
the most—both in terms of consistency and magnitude—relates to the obviousness of the
application—i.e., to the basis of rejection that is most time sensitive. With respect to § 101
rejections (utility/patentable subject matter), we actually do not observe a reduction at all over

31
the relevant promotions. Once an examiner reaches GS-13 (or GS-12 in some specifications), §
112 rejections (written description/enablement) begin to fall; however, only with respect to the
move from GS-13 without signatory authority to GS-13 with signatory authority does the decline
in § 112 rejections match the scope of the decline in obviousness rejections. Section 102
rejections (novelty) likewise begin to fall at some point in an examiner’s career and perhaps
come to the closest to matching the pattern of obviousness rejections, which is not surprising
considering that novelty analyses likewise entail prior-art searching on the part of examiners;
however, this decline is novelty rejections is generally less consistent and substantial than the fall
in the more time-intensive obviousness rejections. Ultimately, if examiners are truly shirking
work upon promotion, it is less clear why obviousness rejections would receive the emphasis of
their reduced attention. The observed pattern is arguably more consistent with time-management
developments.
Second, consider our results in Figure 3 and 5, which track how the grant rate and rate of
obviousness rejections evolves as an examiner increases in tenure over time within particular
grades. These figures demonstrate that an examiner’s grant rate initially increases upon
promotion and then falls with each additional year an examiner spends at the grade level in
question. If these findings were driven by a lightening of informal scrutiny, supervisors must
lessen their review of an examiner’s work immediately upon promotion but they slowly increase
their review as the examiner garners more experience within a particular grade level. This seems
less plausible than the binding time constraint explanation—i.e., an examiner’s grant rate
increase upon promotion and then gradually decreases as she learns to adjust to her new time
allocation.
C. Investigation of Prior Art Citations
To further illuminate whether the above patterns of rising grant rates and falling obviousness
rejections upon the relevant promotions are indeed a reflection of reduced examination effort
stemming from binding examination-time constraints, we next estimate the relationship between
GS-level promotions and the share of total prior-art citations listed in the final patent that are
provided by the examiner as opposed to the applicant, a proxy (even if crude) for the search
effort of the examiner. In Column 2 of Table 4 (depicted in Figure 4), we estimate this
relationship over the full sample of patents issued between 2002 and 2012. This specification is,

32
of course, somewhat compromised by the fact that it relies only on issued patents, the incidence
of which we already know (as above) is likely to increase upon the promotions of interest,
leading to possible selection concerns. With this caveat in mind, we note that the findings
parallel those of the obviousness-rejection analysis above.27
D. Assessment of Marginal Nature of Increased Grants
The analysis above suggests that, as time constraints tighten, examiners will grant some
patents that they might have otherwise rejected if given sufficient time. Assuming an otherwise
competent examination process, these additional patent grants should be of marginally
questionable validity—i.e., they should fail to satisfy a proper application of patentability
standards. Acknowledging that legal validity is difficult to address systematically, we shed light
on this claim by attempting to identify the quality or value of those marginally issued patents,
drawing upon metrics of patent value customarily employed by the literature to date. Of course,
it is perhaps not possible to pinpoint the exact patents that are issued on the margin—i.e., that
might have otherwise been rejected—and to evaluate their particular quality. Nonetheless, one
can arguably achieve the same effect by looking at the full sample of issued patents and
assessing how the average values of the various quality scores change as examiners experience
the promotions of interest. After all, if one adds some object to an existing set of objects and the
average value of the overall set of objects falls, it must be case that the object added on the
margin is of below-average value. In the case at hand, to the extent that average quality scores
fall in connection with the observed rise in patent issuances documented above, it must be that
the marginal patents being issued are of an increasingly below-average level of quality (Frakes
2013).28
In Columns 3-6 of Table 4 (as depicted in Figures 6 and 7), we test for the presence of falling
mean rates upon promotion for each of the various patent quality metrics discussed in Section II
above. Consistent with expectations, we indeed estimate monotonically declining patterns of this
nature, especially in the GS-11+ range (as discussed further below), suggestive of marginal
patent issuances of weakening value. This decline is especially precipitous in the case of patent
27
We further note that no discernable pattern exists when we estimate the relationship between examiner
grade-level promotions and the number of prior-art citations made by applicants. We likewise present such results
in the Online Appendix. 28
In other words, if I add something to a set and bring the overall average down, that thing that I added must
be of a below-average value.
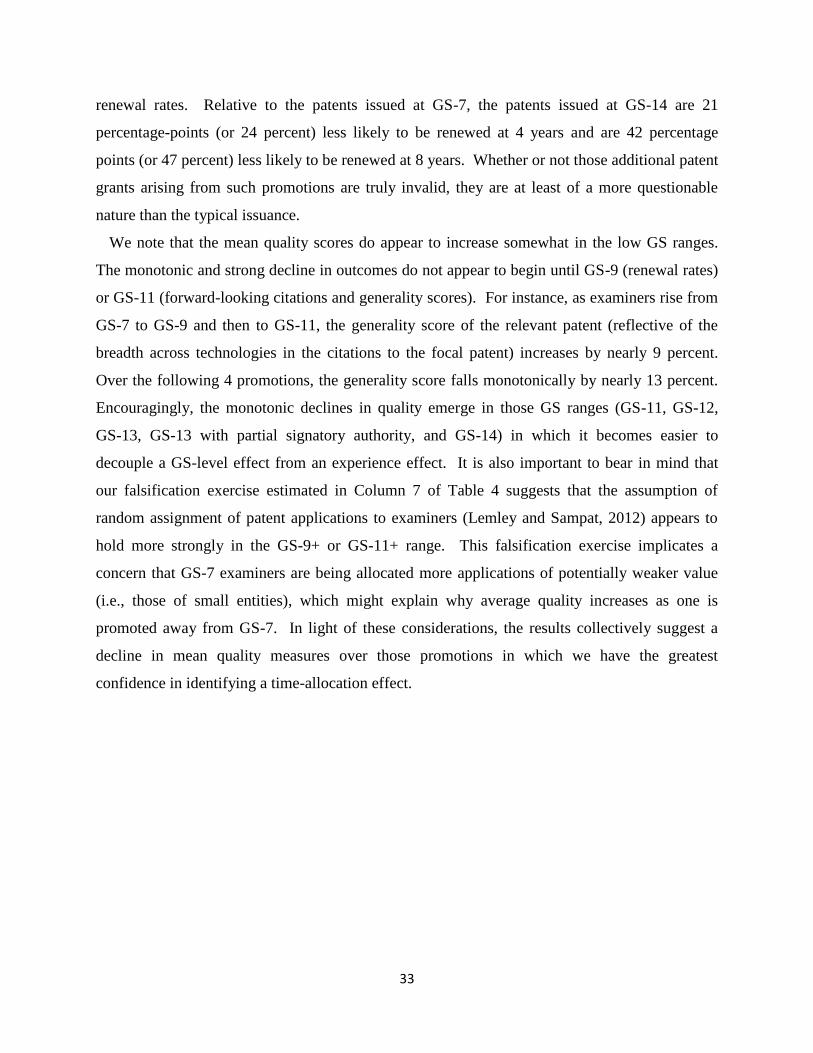
33
renewal rates. Relative to the patents issued at GS-7, the patents issued at GS-14 are 21
percentage-points (or 24 percent) less likely to be renewed at 4 years and are 42 percentage
points (or 47 percent) less likely to be renewed at 8 years. Whether or not those additional patent
grants arising from such promotions are truly invalid, they are at least of a more questionable
nature than the typical issuance.
We note that the mean quality scores do appear to increase somewhat in the low GS ranges.
The monotonic and strong decline in outcomes do not appear to begin until GS-9 (renewal rates)
or GS-11 (forward-looking citations and generality scores). For instance, as examiners rise from
GS-7 to GS-9 and then to GS-11, the generality score of the relevant patent (reflective of the
breadth across technologies in the citations to the focal patent) increases by nearly 9 percent.
Over the following 4 promotions, the generality score falls monotonically by nearly 13 percent.
Encouragingly, the monotonic declines in quality emerge in those GS ranges (GS-11, GS-12,
GS-13, GS-13 with partial signatory authority, and GS-14) in which it becomes easier to
decouple a GS-level effect from an experience effect. It is also important to bear in mind that
our falsification exercise estimated in Column 7 of Table 4 suggests that the assumption of
random assignment of patent applications to examiners (Lemley and Sampat, 2012) appears to
hold more strongly in the GS-9+ or GS-11+ range. This falsification exercise implicates a
concern that GS-7 examiners are being allocated more applications of potentially weaker value
(i.e., those of small entities), which might explain why average quality increases as one is
promoted away from GS-7. In light of these considerations, the results collectively suggest a
decline in mean quality measures over those promotions in which we have the greatest
confidence in identifying a time-allocation effect.

34
Figure 6: Relationship between Renewal Rates and Examiner Grade Levels
Notes: this figure plots results of the coefficients estimated in Columns 3 and 4 of Table 4, in which we regress the indicated outcome on dummy
variables representing each General Schedule level between 7 and 14, including both GS-13 with and without partial signatory authority. The dummy variable for GS-level 7 is omitted, representing the reference group. Confidence bounds are omitted for visual clarity. Regressions
include examiner and year fixed effects.
-.6-.4
-.20
.2
Rel
evan
t Out
com
e at
Indi
cate
d G
rade
,
Rel
ativ
e to
Cor
resp
ondi
ng O
utco
me
at G
S-L
evel
7
GS-7 GS-9 GS-11 GS-12 GS-13 (1) GS-13 (2) GS-14Grade
Four_Year_Renewal Eight_Year_Renewal

35
Figure 7: Relationship between Examiner Grade Levels and Citation-Related Quality Measures
Notes: this figure plots results of the coefficients estimated in Columns 5-7 of Table 4, in which we regress the indicated outcome on dummy
variables representing each General Schedule level between 7 and 14, including both GS-13 with and without partial signatory authority. The
dummy variable for GS-level 7 is omitted, representing the reference group. Confidence bounds are omitted for visual clarity. Regressions include examiner and year fixed effects.
V. DISCUSSION AND CONCLUSION
Our analysis finds that as examiners are given less time to review applications upon certain
types of promotions, the less prior art they cite, the less likely they are to make time-consuming
obviousness rejections, and the more likely they are to grant patents. Moreover, our evidence
suggests that these marginally issued patents are of weaker-than-average value. These findings
demonstrate that a factor other than the patentability of applications may be pushing grant rates
upwards. All else equal, they thus support the general sentiment that the PTO may be biased
towards allowing patents. Of course, all else is not necessarily equal and we cannot say
definitively that the net effect of all features of the Patent Office pushes in this direction.
Nonetheless, we stress that the feature that we do emphasize in this analysis is one that may
meaningfully alter the granting landscape of the Agency. Combining the estimated impacts of
GS-level changes on grant rates depicted in Column 1 of Table 3 with the distribution of
applications examined across the various grade levels, as depicted in Column 1 of Table ___ in
the Online Appendix, our analysis implies that if all examiners were allocated as many hours as
-.05
0
.05
.1
Rel
evan
t Out
com
e at
Indi
cate
d G
rade
,
As
a P
erce
nt o
f Out
com
e at
GS
-Lev
el 7
GS-7 GS-9 GS-11 GS-12 GS-13 (1) GS-13 (2) GS-14Grade
Forward-Looking Citations Generality Score
Falsification Test: Large Entity Incidence

36
are extended to GS-7 examiners, the Patent Office’s overall grant rate would fall by roughly 14
percentage points, or nearly 20 percent.29
Based on 2013 filing numbers this would amount to
approximately 114,000 fewer issued patents for that year.
Setting the time allocated to review patent applications undoubtedly involves a trade-off
between patent quality and examination capacity. A Patent Office whose sole objective is to
maximize patent quality would set the hour allotments much higher in order to ensure that
examiner error was minimized. The Agency, however, also seeks to use its limited resources to
process a sufficient number of applications in a given time period. With this tradeoff in mind,
the Patent Office decision to decrease hour allotments upon promotion appears prudent. After
all, examiners who have repeatedly demonstrated their ability to provide high quality patent
examination, and are rewarded for their admirable behavior by promotion, are likely to be able to
complete a review of an application faster than an examiner who has yet to demonstrate this
competency. Nevertheless, our results suggest that the current scaling of the time allotments
upon promotion—a scaling that leaves GS-14 examiners with nearly half the time to review
applications relative to GS-level 7 examiners—may be rather misaligned to reflect any such
efficiency gains. A full welfare analysis as to whether this scaling is too aggressive is perhaps
beyond the scope of the present paper. This open question aside, our results nonetheless imply
that the process of promoting examiners, which is meant to reward admirable behavior on the
part of examiners, may, in part, be responsible for the agency issuing patents of marginal quality.
Additionally, our analysis highlights the inequitable nature of patent outcomes, building on the
prior work of Cockburn, Kortum, and Stern (2003) and Lemley and Sampat (2012), each of
which had raised concerns over the equity of the examination process. The decision to grant or
reject a patent is intimately dependent, in part, upon the examiner that is by and large randomly
assigned to the application. Thus, our findings suggest that the patent system may be treating
similar patent applicants in dissimilar ways.
29
For example, roughly 35 percent of applications are disposed of by GS-14 examiners, whom we have estimated to
grant at a nearly 19 percentage-point (or 28 percent) higher rate than GS-7 examiners, accounting fully for examiner
heterogeneity. This implies that if, those applications disposed of by GS-14 examiners were granted at the same rate
applied by GS-7 examiners, the Agency would experience a reduction in its grant rate of roughly 7 percentage points
(=0.19*0.35) or by roughly 10 percent (0.28*0.35). Extending this exercise to the remaining grades and aggregating
the amounts delivers the indicated 20 percent effect.

37
REFERENCES
Alcacer, Juan, Michelle Gittelman, and Bhaven Sampat, “Applicant and Examiner Citations to
Patents: An Exploration and Overview,” Research Policy (2009), 415–427.
Allison, John R., Mark A. Lemley, and Joshua Walker, “Patent Quality and Settlement Among
Repeat Patent Litigants,” Georgetown Law Journal, 99 (2011), 677–712.
Bessen, James and Michael J. Meurer, Patent Failure: How Judges, Bureaucrats, and Lawyers
Put Innovators at Risk (2008).
Burk, Dan and Mark A. Lemley, The Patent Crisis and How the Courts Can Solve It (2009).
Cockburn, I., S. Korum, and S. Stern, “Are All Patent Examiners Equal? Examiners, Patent
Characteristics, and Litigation Outcomes,” in W. M. Cohen and S.A. Merril (Eds.),
Patents in Knowledge-Based Economy (Washington, DC: National Academies Press,
2003).
Cohen, Wesley M., Richard R. Nelson, and John P. Walsh, “Protecting Their Intellectual Assets:
Appropriability Conditions and Why U.S. Manufacturing Firms Patent (or Not),” NBER
working paper 7552 (2000).
Cotropia, Christopher, Mark Lemley, and Bhaven Sampat, “Do Applicant Citations Matter?”,
working paper (2012).
de Ree, Joppe, and Rob Alessie, “Life Satisfaction and Age: Dealing with Underidentification in
Age-Period-Cohort Models,” Social Science and Medicine, 73 (2011), 177–82.
Frakes, Michael D. "The Impact of Medical Liability Standards on Regional Variations in
Physician Behavior: Evidence from the Adoption of National-Standard Rules." American
Economic Review, 103(1) (2013), 257-76.
Frakes, Michael D. and Melissa F. Wasserman, “Does Agency Funding Affect Decisionmaking?:
An Empirical Assessment of the PTO’s Granting Patterns,” Vanderbilt Law Review,
(2013), 67–147.
Frakes, Michael D. and Melissa F. Wasserman, “The Failed Promise of User Fees: Empirical
Evidence from the United States Patent and Trademark Office,” Journal of Empirical
Legal Studies, forthcoming 2014.
Frakes, Michael D. and Melissa F. Wasserman, “Does the U.S. Patent and Trademark Office
Grant Too Many Bad Patents?: Evidence from a Quasi-Experiment,” Stanford Law
Review, forthcoming 2015.
Griliches, Zvi, “Patent Statistics as Economic Indicators: A Survey,” Journal of Economic
Literature, 28 (1990), 1661–1707.
Hall, B. H., A. Jaffe, and M. Trajtenberg, “Market Value and Patent Citations,” Rand Journal of
Economics, 36 (2005), 16–38.
Harhoff, D., F. Narin, F. M. Scherer and K. Vopel, “Citation Frequency and the Value of
Patented Innovation,” Review of Economics and Statistics, 81 (1999), 511–515.

38
Heckman, J. and Robb, R, “Using Longitudinal Data to Estimate Age, Period and Cohort Effects
in Earnings Equations,” pp. 137-150 in WM. Mason and SE. Fienberg (eds.) Cohort
Analysis in Social Research: Beyond the Identification Problem, Springer-Verlag: New
York (1985).
Jaffe, A. B., M. Trajtenberg, and R. Henderson, “Geographic Localization of Knowledge
Spillovers as Evidence by Patent Citations,” The Quarterly Journal of Economics, 108
(1993), 577–598.
Jaffe, A. B. and Josh Lerner, Innovation and Its Discontents: How our Broken Patent System is
Endangering Innovation and Progress, and What to Do about It (Princeton, NJ: Princeton
University Press, 2004).
Lanjouw, Jean O. and Josh Lerner, “The Enforcement of Intellectual Property Rights: A Survey
of the Empirical Literature,” NBER working paper 6296 (1997).
Lemley, Mark A. and Bhaven Sampat, “Examiner Characteristics and Patent Office Outcomes,”
The Review of Economics and Statistics, (2012), 817–827.
Lemley, Mark A., “Rational Ignorance at the Patent Office,” Northwestern University Law
Review, (2001), 1495–1532.
Lichtman, Douglas, “Rethinking Prosecution History Estoppel,” University of Chicago Law
Review, (2004), 151–82.
Mann, Ronald, “The Idiosyncrasy of Patent Examiners: Effects of Experience and Attrition,”
Texas Law Review, (2014), 2149–76.
Mansfield, Edwin, “Patents and Innovation: An Empirical Study,” Management Science, 32
(1986), 173–181.
Moser, Petra, “How Do Patent Laws Influence Innovation? Evidence from Nineteenth-Century
World’s Fair,” American Economics Review, (2004), 1214–1236.
Nordhaus, William, Invention, Growth, and Welfare (Cambridge, MA: MIT Press, 1969).
Pakes, Ariel, “Patents as Options: Some Estimates of the Value of Holding European Patent
Stocks,” Econometrica, 54 (1986), 755–784.
Sampat, Bhaven, “When Do Applicants Search for Prior Art?” Journal of Law and Economics
53 (2010), 399–416.
Sampat, Bhaven and Heidi L. Williams, “How do Patents Affect Follow-on Innovation?
Evidence from the Human Genome,” available athttp://economics.mit.edu/files/9778
(2014).
Scotchmer, Suzanne, “Standing on the Shoulder of Giants: Cumulative Research and the Patent
Law,” Journal of Economic Perspectives, 5 (1991), 29–41.

39
ONLINE APPENDIX TO
IS THE TIME ALLOCATED TO REVIEW PATENT APPLICATIONS
INDUCING EXAMINERS TO GRANT INVALID PATENTS?: EVIDENCE
FROM MICRO-LEVEL APPLICATION DATA
Michael D. Frakes and Melissa F. Wasserman
A. Background on Patent Examiner Workload Expectations
Examiners are generally expected to meet certain workload goals, whereby they are expected to attain a
certain number of credits, often referred to as “counts”. Credits, however, have historically been
earned only upon the issuance of a first office action and at final disposal, which occurs when a patent
application is allowed by the examiner or abandoned by the applicant (often after receipt of a final
rejection or in anticipation of such a rejection).30 By setting expectations regarding the number of
credits examiners should attain, the Patent Office contemporaneously sets expectations regarding the
amount of time examiners should spend on applications.31 The number of expected hours allocated to
review a patent application depends on both the technological field in which the examiner is working
and on her position in the general schedule (GS) pay scale. A patent examiner in a more complex field is
allocated more hours to review an application than an examiner of the same grade who is working in a
less complex field. The higher the pay grade of an examiner within a technology area the fewer number
of hours the Patent Office allocates to earn two credited work units.
B. Background on Collection of Rejection Types in USPTO PAIR Data
Through reading of a number of office actions in the PTO PAIR data, we identified the following phrases
that were either (1) likely to be associated with the examiner rejecting a claim as failing to meet the
patentability standards, (2) likely to be associated with the examiner objecting to the form of the claim
30
Since 2010 examiners can also earn partial credits for final office actions and examiner-initiated interviews
with the patent applicant or her attorney. Under either system, a patent examiner earns a maximum of two credits
per patent application examined. While examiners are free to average these time allotments over their caseload, they
are strongly encouraged to meet their credit quota on a biweekly basis. Examiner’s performance appraisal plan
(PAP) was also modified in 2010 in order to better align patent examiner incentives with those of the agency. These
modifications were largely uniform across examiner pay grade, with the exception of SPEs (GS-15) who PAP
changes differed from those of GS-5 through GS-14 patent examiners. 31
These time allotments have largely remained unchanged since 1976. The Patent Office has created new
patent classifications as a result of new and emerging technology. Once the Agency has set the time allotments for a
new technology these allocations also have largely remained unchanged. In 2010, however, the Patent Office
increased the time allotments for every application by two hours.

40
(as distinguished from its substance), (3) likely to be associated with an examiner objecting to other
aspect of the application or making additional requirements of the patentee (e.g., objection to drawings,
objection to the abstract, restriction requirement, etc.). To be clear, the focus of this article is claim
rejections not objections. However, for completeness we reproduce the list of phrases we searched,
including phrases that are directed only at identifying objections, below.
rejected under; rejected are under; rejected as unpatentable; as being unpatentable; rejected
as failing to define; objected to; election of species; fails to define a statutory; antecedent
basis; new title is required; title of the application will; notice to comply; part of paper; prior
art made of record and; rejected as being based; rejected as being directed; rejected on the
ground; restriction to one of the fol; restriction is required under; status identifiers; fail to
meet; fail to comply; fail to contain; fail to provide; fail to identify; fail to include; do not
comply with; not in accordance with; cannot be patented; defective because; non-compliant
because; renders the claim indefinite; not of sufficient quality; filed after the issue fee was;
filed after publication; drawings in compliance with; declaration is missing; are not consistent;
is not a proper submission; not include a support; claim rejections; this is a provisional
obvious; because it is unsigned; not filed a certified copy; is non-responsive; required to
furnish; introduce new matter; not contain a concise explan; the following omission; request
for information; requirement for information; abstract exceeds 150 words; elect a single
disclosed spec; elect disclosed species; not properly annotated; not signed by an; not
authorized to sign; not been submitted; not appear to be relevant to; non-elected subject
matter in; terminal disclaimer needs to; associate poa are no longer; include common
ownership as; other copending United States; application conflict with cla; contain every
element of cla; believed to interfere; has not been met; not indicated the appropria; contain(s)
every element of; claimed invention is differe; contains every element of cl; declaration in
compliance wi; does not have publication da; do not have corresponding pa; filed well after
the applica; list of all patents. Publica; notice of non-compliant amen; reference relevant to the
ex; required information for the; requires that the summary of; restriction is hereby require;
the appropriate statement ac; Website is not considered a.
After compiling this list of phrases we then searched for approximate matches to each of the above
listed phrases in office actions. Once such a match was identified we captured (or excerpted) the
matched phrase and a small amount of surrounding text (approximately the sentence that contained the
phrase). After this list of excerpts was compiled, we wrote a simple program that allowed us to perform
an iterative procedure to match an excerpt containing a phrase listed above to a specific rejection type
(e.g., 101, 102, 103, etc.) or objection type (e.g., 37 C.F.R. 1.121(d)). The program began by displaying all
excerpts containing a phrase listed above that had not yet been assigned to a rejection or objection
type. By inspection of this list, we choose a string of text (e.g., “35 USC 103”) appearing in at least one
excerpt that ought to be associated with a particular rejection type (e.g., obviousness). We then
identified all excerpts containing an exact match of the string of text that also contained a match to the
41
same phrase listed above and assign each of them to the identified rejection or objection type. That is,
each time we matched rejection or objection type to an excerpt we did so for only for that group of
excerpts containing the same above-listed phrase (e.g., “rejected under,” “rejected are under,” etc.).
We continued this iterative process until there were no more unassigned excerpts.
B. Supplementary Notes Regard Data Collection
Our sample includes all 1,956,493 utility applications that were filed on or after March 2001 and were
published in the PAIR database by July 2012.32 By the end of 2012, 49 percent of these applications had
resulted in patents, 25 percent were not patented because they had been abandoned by the applicant,33
and the remainder were still pending. Applicants may elect to abandon their applications when they are
unable to overcome an examiner’s rejection or for other business-related reasons. Our study focuses on
the 1.4 million utility applications filed from 2001 onwards that received a final disposition—those that
were granted of abandoned—by July, 2012.
Critical to our analysis is determining the experience (in years) and the GS-level for each of the 9,000
examiners represented in our sample. For these purposes, we match the examiner field in the PAIR data
with the two sets of examiner rosters received pursuant to separate FOIA requests. In order to calculate
the relevant examiner’s experience, we take the difference between the year at the time of disposal of
the application and the first year at which the examiner joined the Patent Office, as determined by
observing when each examiner was first represented in annual examiner lists that we received from the
Patent Office. To ensure that this approach accurately captures the experience of long-tenure
examiners, we began collecting these annual rosters in 1992—that is, nearly ten years prior to the
commencement of our sample period. Naturally, this cannot ensure complete precision in the
experience assignment given that some examiners may have joined the Patent Office long before 1992
(making it difficult to distinguish between 10-year examiners and 20-year examiners for those
applications disposed of in 2002). To alleviate these final censoring concerns, we simply focus the
empirical analysis on those examiners who joined the Office in 1993 and beyond, though we present
results without any such restriction—see Table A2 below. On average, this restricted set of examiners
stays at the Patent Office for roughly 6.8 years with roughly 25 percent of such examiners staying at
least 10 years.
32
In November 2000, there was a change in the law that required newly filed patent applications to be
published 18 months after they were filed. 35 U.S.C. § 122(b). Applicants abandoned within the first 18 months of
filing, Id. § 122(b)(2)(A)(i) and applications wherein the applicant filed a special exemption to maintain
confidentiality are exempted from this requirement, Id. § 122(b)(2)(B)(i). Such applications are thus absent from the
PAIR database. When some or all of an applicant’s claims are not allowed by the Patent Office, the aggrieved party
will sometimes file a continuation application. This application is given a new serial number and may be assigned
to a different examiner. Continuation applications are treated as unique applications in the PAIR database. A
related and now far more commonly used device, known as a Request for a Continued Examination (RCE), does not
receive a new application serial number and effectively allows an aggrieved applicant to keep the application on the
examiner’s docket for further prosecution. RCEs are not treated as new, unique filings in the PAIR database; rather,
they are treated as a continuation in the prosecution of original applications. 33
A small portion of these applications were actually abandoned after being allowed by the examiner.

42
Pursuant to a second FOIA request, we received an additional set of annual rosters from 2001 to 2012
indicating the GS level associated with each examiner on staff over those years. Furthermore, a third
and final FOIA request allowed us to determine whether GS-13 examiners did or did not have partial
signatory authority at that time, a distinction, as above, that bears on the hours allocated to the
examiner for review. 34
The examiner field in PAIR had a number of typographical errors and variations in the spelling or
formatting of names, complicating efforts to perform the above matches. To overcome this difficulty,
we utilized the reclink Stata module, a “fuzzy” matching program designed to deal with variations in
names over time (e.g., inclusions of full middle names versus middle initials, name changes upon
marriage, etc.). Having performed this match, we then ensured the creation of a stable set of examiner
field effects. All told, our analytical file contained roughly 9,000 examiners.
In Columns 1 of Table A1, we set forth the percentage of applications in our sample that are disposed
of by examiners in each of the relevant GS-levels and experience groups. Examiners spend considerably
more time in higher GS ranges, especially GS-level 14, thus accounting for the higher percentage of
applications associated with high GS-level examiners. Also contributing to the relatively weaker
presence of GS-levels 7 and 9 in the data is the fact that many examiners (nearly 1/3 of new examiners)
begin at GS-level 11. In Column 2, we further illuminate this breakdown by taking all of the examiner
rosters over the 2002–2012 period and indicating what percentage of these total examiner years were
represented by examiners in the various GS-level and experience categories. For the reasons just
discussed, this representation also tends to be weighted near the higher GS ranges.
Finally, we exclude those few applications—roughly 3 percent of the raw sample—examined by
individuals at GS-15 given uncertainty over the examination time allocated to those reaching this final,
largely supervisory level from our sample. Published time allocation schedules suggest that GS-15
examiners should receive 67 or 71 percent of the time extended to their GS-12 counterparts. However,
the specific time allocation amounts that we received from the PTO for each GS-15 examiner in our
sample differ markedly and erratically from this generally published schedule.35 In any event, as
demonstrated by the Online Appendix, our results are robust to likewise tracking changes in grant rates
upon the ascension to GS-15.
On a final note, we exclude 2001 from our analytical sample, since the PAIR database only began
collecting application data for filings commencing in March of 2001, leaving very few final dispositions of
such applications in 2001 and thus leaving us with a weak ability to assess the determinants of granting
34
There were slight inconsistencies in the treatment of within-year promotions between the examiner roster data
employed above and the secondary roster of GS-13 examiners we received pursuant to our second FOIA request.
That is, many of those examiners receiving this within-GS-13 promotion were registered as doing so during the year
in which our primary roster indicated that they ascended to GS-level 14. We give priority to the timings of
promotions set forth in this secondary data source. 35
Hoping that the difference in time allotments to GS-15 examiners would provide another within-GS-level
degree of variation, we filed an additional FOIA request with the PTO asking for the specific examination-time
allotments associated with each GS-15 examiner, for each year from 2002-2012. The provided data, however, list
the majority of such GS-15 examiners as having the same amount of time allocated to GS-12 and GS-13 examiners,
as opposed to the anticipated 67 percent and 71 percent values. In the Online Appendix, we estimate specifications
that treat all GS-15 examiners alike under the assumption, as expected from their published schedule, that GS-15
examiners would receive even less time than their GS-14 counterparts. However, the uncertainties in the data
received pursuant to this final FOIA request leaves us inclined to treat this as a supplementary exercise only.

43
decisions at such time (after all, patent prosecution durations are generally longer than a year).
Similarly, we note that only 0.2 percent of the original sample were examined by GS-5 examiners. Given
such a small level of representation, we exclude these applications from the analysis, though again we
note that this exclusion is of little significance to our findings.
TABLE A1: REPRESENTATION OF GS-LEVEL AND EXPERIENCE GROUPS
(1) (2)
GS-level & Experience
Group
Percentage of Applications
Disposed of by Examiner in
Indicated Group (%)
Percentage of Total
Examiner Years
Spent in Indicated
Group Between
2002 and 2012 (%)
GS-7 1.8 5.0
GS-9 5.7 9.9
GS-11 9.9 12.1
GS-12 13.6 13.4
GS-13 19.2 17.1
GS-13, partial signatory 15.3 12.3
GS-14 34.5 30.1
0-1 Years 8.8 19.8
2-3 Years 15.2 19.0
4-5 Years 15.9 15.7
6-7 Years 12.8 11.6
8-9 Years 10.7 7.6
10-11 Years 10.8 8.6
12-13 Years 10.1 6.7
14+ Years 15.7 11.0

44
Additional Robustness Checks
Figure A1: Relationship between Examiner Experience and Grant Rates, without Examiner Fixed Effects
Notes: this figure presents estimated coefficients of a regression of the incidence of the application being granted on a set of dummy variables
capturing various experience groups (in years) of the relevant examiner. This figure also includes year fixed effects, but does not include
examiner fixed effects or controls for the GS-level of the examiner. Standard errors are clustered at the examiner level.
0.0
00
.10
0.2
00
.30
0.4
0
Gra
nt R
ate
at In
dic
ate
d G
roup R
ela
tive to
First
Exp
erience
Gro
up
0-1 Yrs 2-3 Yrs 4-5 Yrs 6-7 Yrs 8-9 Yrs 10-11 Yrs 12-13 Yrs 14+ Yrs
Group
Relative Grant Rate: Confidence Internval Relative Grant Rate: Mean

45
Figure A2: Relationship between Examiner Experience and Grant Rates, including Indicator for Long-
Tenure Examiner (>= 5 Years with Agency), without Examiner Fixed Effects
Notes: this figure replicates that of Figure A1, but includes a control for whether the examiner associated with the relevant application ultimately
stays with the Agency for at least five years (following Lemley and Sampat, 2012).
0.0
00
.10
0.2
00
.30
0.4
0
Gra
nt R
ate
at In
dic
ate
d G
roup R
ela
tive to
First
Exp
erience
Gro
up
0-1 Yrs 2-3 Yrs 4-5 Yrs 6-7 Yrs 8-9 Yrs 10-11 Yrs 12-13 Yrs 14+ Yrs
Group
Relative Grant Rate: Confidence Internval Relative Grant Rate: Mean

46
Figure A3: Relationship between Examiner Experience and Grant Rates, including Indicator for Long-
Tenure Examiner (>= 10 Years with Agency), without Examiner Fixed Effects
Notes: this figure replicates that of Figure A1, but includes a control for whether the examiner associated with the relevant application ultimately
stays with the Agency for at least ten years (following Lemley and Sampat, 2012).
0.0
00
.10
0.2
00
.30
Gra
nt R
ate
at In
dic
ate
d G
roup R
ela
tive to
First
Exp
erience
Gro
up
0-1 Yrs 2-3 Yrs 4-5 Yrs 6-7 Yrs 8-9 Yrs 10-11 Yrs 12-13 Yrs 14+ Yrs
Group
Relative Grant Rate: Confidence Internval Relative Grant Rate: Mean

47
Figure A4: Relationship between Examiner Experience and Grant Rates, with Examiner Fixed Effects
Notes: this figure
replicates that of Figure A1, but includes a set of examiner fixed effects.
-0.0
50
.00
0.0
50
.10
Gra
nt R
ate
at In
dic
ate
d G
roup R
ela
tive to
First
Exp
erience
Gro
up
0-1 Yrs 2-3 Yrs 4-5 Yrs 6-7 Yrs 8-9 Yrs 10-11 Yrs 12-13 Yrs 14+ Yrs
Group
Relative Grant Rate: Confidence Internval Relative Grant Rate: Mean

48
Figure A5: Relationship between Examiner GS-Level and Grant Rates, Restricted Duration-Window
Approach
Notes: this figure presents estimated coefficients of a regression of the incidence of the application being granted on a set of dummy variables
capturing the incidence of the relevant examiner falling into each general schedule pay grade. This figure also includes year fixed effects and
examiner fixed effects. The sample is limited to those applications that reach a disposition within three years from filing and that were filed in
2004 and beyond. Standard errors are clustered at the examiner level.
0.0
00
.05
0.1
00
.15
Gra
nt R
ate
at In
dic
ate
d G
rade R
ela
tive to G
S-L
eve
l 7
GS-7 GS-9 GS-11 GS-12 GS-13 (1) GS-13 (2) GS-14Grade
Relative Grant Rate: Confidence Internval Relative Grant Rate: Mean

49
Figure A6: Relationship between Grant Rates and Experience Years within Distinct Grade Levels,
Including GS-15
Notes: this figure replicates that of Figure 3 in the text except that it includes examiners at GS-15.
-0.1
00
.00
0.1
00
.20
0.3
0
Gra
nt R
ate
at In
dic
ate
d G
rade/E
xperience
Gro
up
Rela
tive to G
S-L
eve
l 12 / 1
st Y
ear
Gro
up
GS-12 GS-13 (1) GS-13(2) GS-14 GS-15Grade Level / Experience Group (2-Year Increments within each Level)
Relative Grant Rate: Confidence Internval Relative Grant Rate: Mean
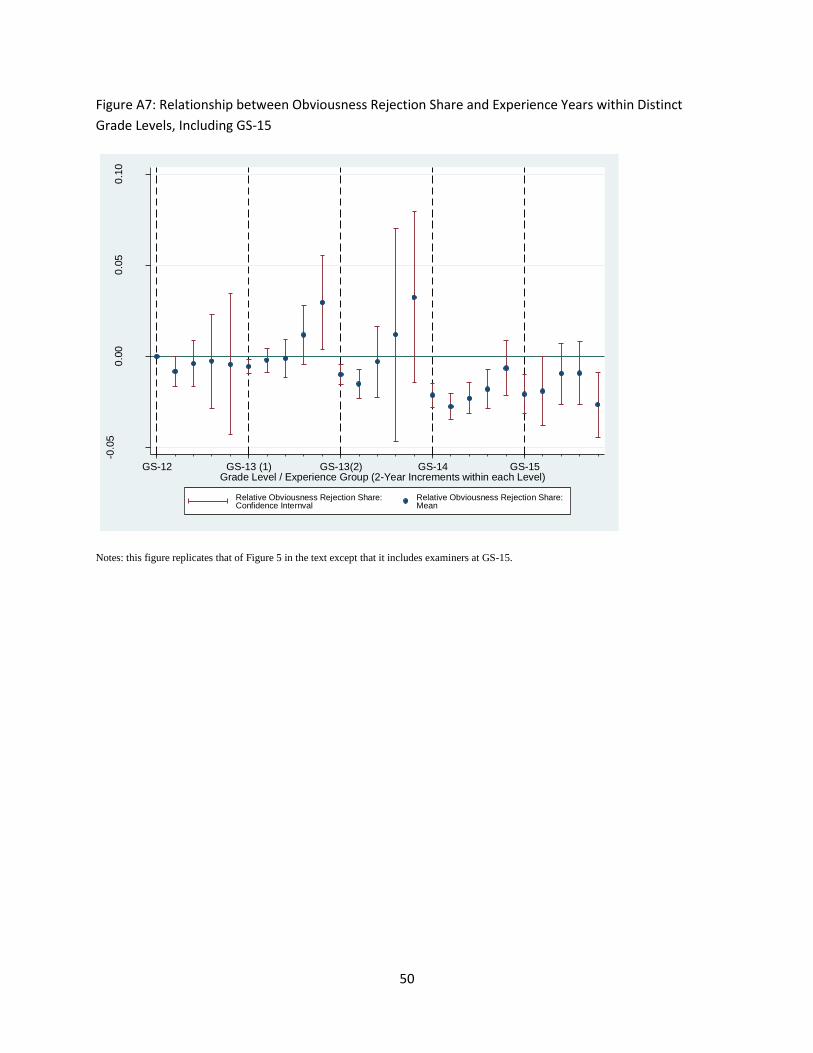
50
Figure A7: Relationship between Obviousness Rejection Share and Experience Years within Distinct
Grade Levels, Including GS-15
Notes: this figure replicates that of Figure 5 in the text except that it includes examiners at GS-15.
-0.0
50
.00
0.0
50
.10
Obvio
usness R
eje
ction S
hare
at In
dic
ate
d G
rade/E
xperience G
roup
Rela
tive to G
S-L
evel 12 / 1
st Y
ear
Gro
up
GS-12 GS-13 (1) GS-13(2) GS-14 GS-15Grade Level / Experience Group (2-Year Increments within each Level)
Relative Obviousness Rejection Share:Confidence Internval
Relative Obviousness Rejection Share:Mean

51
Figure A8: Relationship between Incidence of each of Section 101, Section 102, Section 103 and Section
112 Rejections and Examiner GS-Level (Percentage Results)
Notes: this figure presents three sets of regression results. Each line represents the estimated mean coefficients of a regression of the incidence of
the indicated rejection type on set of dummy variables capturing the incidence of the relevant examiner falling into each general schedule pay
grade along with a set of dummy variables capturing the various experience groups (in years) of the relevant examiner. Coefficients are scaled by
the mean incidence of each rejection type to facilitate an interpretation of this trend in percentage terms. This figure also includes year fixed
effects and examiner fixed effects. Standard errors are omitted.
0.1
.2.3
.4.5
Rele
vant R
eje
ctio
n R
ate
at In
dic
ate
d G
rade R
ela
tive to G
S-L
evel 7
GS-7 GS-9 GS-11 GS-12 GS-13 (1) GS-13 (2) GS-14Grade
Section_101 Section_102
Section_112 Section_103

52
Figure A9: Relationship between Incidence of each of Section 101, Section 102, Section 103 and Section
112 Rejections and Examiner GS-Level (Percentage Results), Controlling for Application Characteristics
and Technology-by-Year Fixed Effects
Notes: this figure replicates that of Figure A8, but it includes controls for application entity size and prosecution duration, along with a full set of
technology-by-year fixed effects.
-.0
5
0
.05
.1.1
5.2
Rele
vant R
eje
ction R
ate
at In
dic
ate
d G
rade R
ela
tive to G
S-L
evel 7
GS-7 GS-9 GS-11 GS-12 GS-13 (1) GS-13 (2) GS-14Grade
Section_101 Section_102
Section_112 Section_103

53
Figure A10: Relationship between Incidence of each of Section 101, Section 102, Section 103 and
Section 112 Rejections and Examiner GS-Level (Percentage-Point Results), Controlling for Application
Characteristics and Technology-by-Year Fixed Effects
Notes: this figure replicates that of Figure A9, but it does not scale the coefficients by the mean incidence of the relevant rejection. .
-.0
2
0
.02
.04
.06
Rele
vant R
eje
ction R
ate
at In
dic
ate
d G
rade R
ela
tive to G
S-L
evel 7
GS-7 GS-9 GS-11 GS-12 GS-13 (1) GS-13 (2) GS-14Grade
Section_101 Section_102
Section_112 Section_103

54
Figure A11: Relationship between Number of Applicant-Provided Citations in Final Patents (Logged) and
Examiner GS-Level
Notes: this figure presents estimated coefficients of a regression of the number of applicant-provided citations (logged) on a set of dummy
variables capturing the incidence of the relevant examiner falling into each general schedule pay grade along with a set of dummy variables
capturing the various experience groups (in 2 year bins) of the relevant examiner. This figure also includes year fixed effects and examiner fixed
effects. Standard errors are clustered at the examiner level.
0.0
00
.10
0.2
00
.30
Num
ber
of A
pplic
ant-
Origin
atin
g P
rior
Art
Cita
tions
at In
dic
ate
d G
rade
Rela
tive to G
S-L
evel 7
, Logged
GS-7 GS-9 GS-11 GS-12 GS-13 (1) GS-13 (2) GS-14Grade
Relative Applicant Prior Art Citations: Confidence Internval Relative Applicant Prior Art Citations: Mean

55
Figure A12: Relationship between Number of Examiner-Provided Citations in Final Patents (Logged) and
Examiner GS-Level
Notes: this figure replicates that of Figure A11 except that the dependent variable is the number of examiner-provided citations (logged).
-0.0
50
.00
0.0
50
.10
0.1
5
Num
ber
of E
xam
iner-
Origin
atin
g P
rior
Art
Cita
tions
at In
dic
ate
d G
rade
Rela
tive to G
S-L
eve
l 7, Logged
GS-7 GS-9 GS-11 GS-12 GS-13 (1) GS-13 (2) GS-14Grade
Relative Examiner Prior Art Citations: Confidence Internval Relative Examiner Prior Art Citations: Mean

56
Treatment of Examiners who Leave Agency and Return
We note that 5 percent of the examiners in our sample left the Agency at some point only to
return at a later point in time. With the possibility that this hiatus from the Agency may disrupt
the learning / interruption story hypothesized in the text, we estimate alternative specifications
that simply drop these examiners. The results are virtually identical in this alternative
specification (results available upon request from the authors).
Balanced Sample Analysis: Estimations using Select Sample of Examiners Consistently Present
over Estimated Time Periods / Grade-Level Changes
Estimating balanced-sample counterparts to Figure 3 in the text is tricky insofar as it is not
possible to follow individual examiners over the entire course of years set forth in the figure
given that (1) we are only following examiners over a 10-year period, as opposed to the longer
period implicitly depicted in Figure 4 and (2) it is rare to find an examiner that stayed for a long
period of time in every single grade. Nonetheless, in this Online Appendix, we also estimate a
series of specifications that at least use balanced samples to estimate portions of Figure 4. For
instance, to explore the robustness of the distinct jump in grant rates as we move from GS-13
(with signatory authority) to GS-14, we take a sample of those individuals who stay at GS-13
(with signatory authority) for at least 2 years before being promoted to GS-14 (we have also
estimated balanced samples using longer time periods and may provide those results upon
request, though sample sizes diminish considerably as we impose long tenures within GS-12 and
GS-13). We then estimate a similar specification on these select (yet balanced) examiners only,
focusing on the following time periods” 0-1 Years at GS-13(2) (the omitted category), 2+ Years
at GS-3(2) and 0-1 Years at GS-14. We do similar exercises for each of the jumps depicted in
Figure 4 in the text. In the case of the move from GS-13(2) to GS-14 and from GS-13(1) to GS-
13(2), we estimate a distinct jump in grant rates upon the promotion itself that does not appear to
be reflective of a pre-existing time trend while operating at those pre-promotion grade levels.
However, rather than documenting a decline in grant rates over the time dimension, these
specifications find flatness in granting tendencies over time followed by jumps in grant rates
upon the relevant promotion, nonetheless consistent with expectations. With respect to the move
from GS-12 to GS-13(1), we continue to document a jump in grant rates upon the promotion, but
we also find an increase in grant rates over the first two years while at GS-12, which is actually
consistent with Figure 4 itself.

57
TABLE A4: ESTIMATES OF WITHIN-GRADE CHANGES IN GRANT RATES OVER TIME AND
SUBSEQUENT J UMPS UPON GRADE-LEVEL CHANGES, FOCUSING ON SEPARATE BALANCED
SAMPLES OF EXAMINERS
P ane l A: fo llow ing balance d sam ple of e xam ine rs w ho stay at GS -13 (w ith partia l s ignatory
authority) for 2+ ye ars and subse que ntly asce nd to GS -14. Om itte d cate gory: 0-1 Ye ars at GS -13(2)
2+ Years a t GS-13(2) 0.010
(0.007)
0-1 Years a t GS-14 0.034***
(0.006)
N 97585
P ane l B: fo llow ing balance d sam ple of e xam ine rs w ho stay at GS -13 (w ithout partia l s ignatory
authority) for 2+ ye ars and subse que ntly asce nd to GS -13(2) (w ith partia l s ignatory authority).
Om itte d cate gory: 0-1 Ye ars at GS-13(1)
2+ Years a t GS-13(1) 0.004
(0.008)
0-1 Years a t GS-13(2) 0.030***
(0.010)
N 78224
P ane l C: fo llow ing balance d sam ple of e xam ine rs w ho stay at GS -12 for 2+ years and subse que ntly
asce nd to GS-13 (w ithout partia l s ignatory authority). Om itte d cate gory: 0 -1 Ye ars at GS-12.
2+ Years a t GS-12 0.056***
(0.010)
0-1 Years a t GS-13(1) 0.081***
(0.011)
N 56533
* sign ifican t a t 10%; ** sign ifican t a t 5%; *** sign ifican t a t 1%. Standard er rors a re r epor ted in pa ren theses
and a re clustered to correct for au tocorrela t ion with in individua l examiners over t ime. In the specifica t ion
est imated in each panel, we regress the incidence of th e applica t ion being gran ted on a ser ies of dummy
var iables captur ing specific exper ience years with in each grade level, focusing in Panel A, for instance, on GS-
13 examiners with pa r t ia l signa tory au thor ity and GS-14 examiners. We t rack examiners in Panel A for 0-1
and 2+ years with in GS-13(2) and then for the first 2 years with in GS-14, a llowing for an observa t ion of the
jump in gran t ra tes upon promot ion to GS-14. To ach ieve ba lance in this exercise, we focus on ly on those
examiners who (1) stay a t GS-13 (with pa r t ia l signa tory au thor ity) for a t least 2 year s and (2) then ascend to
GS-14. Panels B and C conduct simila r exercises for the in dica ted groups. Specifica t ions include both
examiner and year fixed effects.
![Is the Time Allocated to Review Patent Applications …...being able to do a high-quality examination and to avoid taking short-cuts. As one examiner in [Technology Center] 1700 explained,](https://static.fdocuments.net/doc/165x107/5f4e1db7ed7b1f38be52d7b7/is-the-time-allocated-to-review-patent-applications-being-able-to-do-a-high-quality.jpg)