IS SKILL–BIASED TECHNOLOGICAL CHANGE HERE YET… · Eli Berman Economics, University of...
32
1 IS SKILL–BIASED TECHNOLOGICAL CHANGE HERE YET?: Evidence from Indian Manufacturing in the 1990'S 1 Eli Berman Economics, University of California San Diego, and National Bureau of Economic Research Rohini Somanathan Economics, University of Michigan, and Indian Statistical Institute Hong W. Tan Lead Economist, World Bank Institute August 2003 1 The project was funded by a research grant from the Research Committee of the World Bank. We benefited from expert research assistance by Bahar Biyikli at Rice University, Callie Scott at the University of Michigan and Saumik Paul and Rajesh Suraj at the Indian Statistical Institute and from the comments of participants at a CREST- INSEE Conference in Memory of Zvi Griliches.
Transcript of IS SKILL–BIASED TECHNOLOGICAL CHANGE HERE YET… · Eli Berman Economics, University of...

1
IS SKILL–BIASED TECHNOLOGICAL CHANGE HERE YET?: Evidence from Indian Manufacturing in the 1990'S1
Eli Berman Economics, University of California San Diego,
and National Bureau of Economic Research
Rohini Somanathan Economics, University of Michigan,
and Indian Statistical Institute
Hong W. Tan Lead Economist, World Bank Institute
August 2003
1 The project was funded by a research grant from the Research Committee of the World Bank. We benefited from expert research assistance by Bahar Biyikli at Rice University, Callie Scott at the University of Michigan and Saumik Paul and Rajesh Suraj at the Indian Statistical Institute and from the comments of participants at a CREST-INSEE Conference in Memory of Zvi Griliches.

2
ABSTRACT
In cross-country tests of the skill-biased technological change hypothesis for the 1980s, India – a low income country – is unusual. It does not show evidence of skill upgrading in manufacturing common to high and middle-income countries. In this period, India's traditionally controlled economy may have limited skill-biased technology transfer. However, the economy underwent a sharp reform in 1991, suggesting the possibility that technology absorption may have accelerated during the past decade. We investigate the hypothesis that skill-biased technological change did in fact arrive in India in the 1990s using panel data disaggregated by industry and state from the Annual Survey of Industry (ASI). The ASI data confirm that while the 1980s was a period of falling skills demand, the 1990s showed generally rising demand for skills with variation across states. At least half of this increase in demand can be explained by two related factors – (1) increased output, and (2) an increase in capital-skill complementarity combined with accelerated capital investment – with increased output being the best predictor of skill upgrading. The second factor we interpret as skill-biased technological change embodied in capital, as capital which did not complement skills was replaced with newer capital that does. Indian manufacturing did not undergo disproportionate skills upgrading in the same set of industries as did other countries, indicating that the increased demand for skills in Indian manufacturing is not due to international diffusion of recent vintages of skill-biased technologies. JEL keywords: O300 - Technological Change; J240 - Human Capital; Skills; O530 - Economywide Country Studies: Asia ; O120 - Microeconomic Analyses of Economic Development; F160 - Trade and Labor Market Interactions.

3
TABLE OF CONTENTS 1. Introduction ………………………………………………………………… 1 2. Skill Bias and Skills Upgrading in Indian Industry …………….……………. 2 International Context ………………………………………………………... 2 Economic Reform and Industrial Policy in India ………………………... 3 Skills Upgrading in India in the 1990s …………………………………… 4 3. Skill-biased Technological Change – A Framework ………………………… 5 Evidence of SBTC from Demand Shifts ………………………………… 5 Within-Between Decompositions ………………………………………… 6 Capital-Skill Complementarity ………………………………………… 7 4. Data and Results ………………………………………………………………… 9 Data Sources ………………………………………………………………… 9 Empirical Results ………………………………………………………… 10 Tests of Robustness ………………………………………………………… 12 International SBTC and India ……………………………………………….. 13 Unsolved Puzzles ………………………………………………………… 14 5. Conclusions ………………………………………………………………… 15 6. References ………………………………………………………………… 16

4
1
IS SKILL–BIASED TECHNOLOGICAL CHANGE HERE YET?
Evidence from Indian Manufacturing in the 1990s
Eli Berman, Rohini Somanathan, and Hong Tan 1. INTRODUCTION Motivated by evidence of skill-biased technological change (SBTC) in middle income and OECD countries in the 1980s, we investigate if SBTC was present in Indian manufacturing in the 1980s and 1990s. In the Berman and Machin (2000) sample it appeared to be conspicuously absent in the 1980s in India. Yet, India's traditionally controlled economy underwent a sharp reform in 1991, suggesting the possibility that technology absorption may have accelerated during the past decade. We investigate the hypothesis that skill-biased technological change did in fact arrive in India in the 1990s by examining Indian registered manufacturing using the Annual Survey of Industry (ASI). We look for patterns familiar from the manufacturing sectors of other countries. From our analysis of pooled cross-section time-series ASI data – aggregated by industry and state and covering the 1984-1998 period – we find the following about Indian registered manufacturing:
a. The mid- to late 1980s indeed appear to be a period of falling demand for skilled labor in manufacturing, as reported in cruder data used in the Berman-Machin (2000) sample. This is true to a varying degree in most Indian States;
b. In contrast, following the reforms of the late 1980s and early 1990s demand for skilled labor in manufacturing increased throughout the 1990-1998 period, fairly consistently over time, though not consistently across states;
c. At least half of this increase in demand can be explained by two related factors, increased output and an increase in capital-skill complementarity combined with accelerated capital investment. Both these increases appear fairly consistently across states and industries. The best predictor of skill-upgrading is increased output. The second factor we interpret as skill-biased technological change embodied in capital, as capital which did not complement skills was replaced with newer capital that does;
d. In developing and middle income countries, skill upgrading in manufacturing tends to be concentrated in the same industries across countries. Indian manufacturing did not undergo disproportional skill upgrading in those typical industries, indicating that increased demand for skills in Indian manufacturing is qualitatively different than the phenomenon common to OECD and middle-income countries.

2
2. SKILL BIAS AND SKILL UPGRADING IN INDIAN INDUSTRY International Context The Indian economy grew at unprecedented rates in the 1990s (Table 1). Rapid economic growth raises questions about what her labor market will look like in the near future. If the experience of developed countries over the past few decades is any guide, demand for education will increase substantially. Predicting demand for education over the next few decades is important, both because of the practical need to guide investments by individuals and institutions and because accelerated demand for education not matched by a matching surge in supply will lead to increased income inequality. A growing consensus among labor economists is that the major factor leading to increased demand for education in the U.S. is the bias of technological change toward more educated labor, so called “skill-biased” technological change (SBTC). Autor and Katz (1999) provide a survey of this literature. Several authors have extended this conclusion to other OECD countries, including Katz, Loveman and Blanchflower (1995) and Berman, Bound and Griliches (1998).
Berman and Machin (2000) provide evidence of SBTC in manufacturing industries of middle-income economies as well, suggesting that SBTC could be a global phenomenon. Manufacturing industries are particularly interesting as they tend to show the fastest growth within developing countries, they are the most likely to generate export-led growth and they are most likely to absorb new technologies. The figures in Table 1 suggest that manufacturing has led India’s economic growth over the past few decades, with manufacturing growth rates exceeding those of the rest of the economy fairly consistently since the mid 1970s.
Table 2 reproduces descriptive data on skill-upgrading in manufacturing industries of 37
countries in the 1970s and 1980s. Consider the share of non-production (or non-manual) workers in total wage-bill as a measure of skill use in manufacturing. (We explain the advantages of this measure below). The table can be summarized as follows: In a typical high income country the non-manual wage-bill share in manufacturing increased by 3-4 percentage points over the 1970s and by about 4 percentage points in the 1980s. In a typical middle income country the non-manual wage-bill share in manufacturing was stagnant in the 1970s and increased by 4-5 percentage points in the 1980s. It is hard to speak of a typical low income country since India dwarfs the other six countries in that sample. India’s non-manual wage-bill share increased by 0.19 percentage points in the 1970s but declined by 0.08 percentage points in the 1980s.
The decline in India’s non-manual (skilled) share of the wage-bill in the 1980s was
exceptional in the international context. Only three other countries in the sample of 37 experienced such a decline, and none of those were low income countries. Observers of India may not be surprised that she did not participate in this international trend, as India has a tradition of strict regulation and centralized control in manufacturing that might inhibit flexibility to respond to new technologies with appropriate investment. Before turning to skill-upgrading in the 1990s it is important to understand how heavily regulated industry was in India at least until the late 1980s.

3
Economic Reform and Industrial Policy in India Indian industrial policies that were put in place just after independence in the 1950s, stayed more or less unchanged until the mid-eighties. The Industries Development and Regulation Act of 1951 and the Industrial Policy Resolution of 1948 outline these policies. Their major objective was to achieve economic self-reliance through import substitution policies and large-scale public investment in heavy industry. Investment by private firms were governed by strict licensing requirements to ensure that the resulting pattern of production was in line with the priorities set out in the Five Year Plans.
In addition to the above legislation, the Monopolies and Restrictive Trade Policies (MRTP) Act of 1969 and the Foreign Exchange Regulation Act of 1973, were introduced to limit foreign equity in Indian industry and discourage market concentration. Statements of changes in industrial policy were made in 1973, 1977 and 1980 which involved some streamlining of the licensing process and additional advantages for small and medium sized firms, especially those which exported most of their additional production. No significant liberalization measures were taken before the mid-1980s.2 Most firms had to get licenses for any capacity expansion or changes in their product mix, foreign equity was severely restricted and foreign exchange restrictions and import quotas and tariffs on both consumer and capital goods were used to encourage the growth of indigenous heavy industry. Starting in 1985, the regulatory framework started to change considerably. The clearances needed for capacity expansion were reduced and industrial categories were broadened so that firms would not need approval for small changes in their product mix.3 Each successive year shortened the list of industries which needed licenses and these changes were accompanied by a significant acceleration in the growth of manufacturing, which, for the first time since Independence, averaged over 6 per cent in the second half of the 1980s.
In 1991, a new industrial policy ushered in a period of truly dramatic reforms. The number of industries reserved for the public sector was halved,4 licensing was abolished in all but a small group of industries and, perhaps more importantly from our perspective, there were complementary policy changes in policies relating to trade and financial markets. Foreign investment was encouraged, quantitative import restrictions largely abandoned and tariffs significantly reduced. A phased reduction in import tariffs has been undertaken since then. Prior to the reform tariffs on several categories of goods were above 300 percent. The peak tariff rate was brought down to 110 percent in 1992, 85 percent in 1993, 65 percent in 1994, 50 percent in 1995 and now stands at 25 percent.5
2 A description of these policies can be found in the relevant volumes of the Handbook of Industrial Policy and Statistics and the Economic Survey, both annual government publications. 3 Economic Survey , 1985-6, chapter 4. 4 The number of industries reserved for the public sector went down from 17 in 1956 to 8 in 1991 (Economic Survey, 1991-2). 5 The rates up until 1995 have been taken from the Economic Survey, 1995-6, p31. The current rate is from the Budget Speech of the Finance Minister, February 28, 2003.

4
Skill-Upgrading in India in the 1990s
It seems plausible that these regulatory reforms, taken together, made it much easier for
firms to adopt technologies that were developed outside the country. We also might expect that changes in the pattern of labor demand that were seen in developed countries adopting these technologies would be repeated in India in the liberalized environment of the 1990s. The ASI display a clear pattern of skill upgrading in the 1990s. Figure 1 shows that during the 1990s the proportion of non-manual workers in registered manufacturing increased (from 23.5 to 24.4 percent) despite the increase in their relative wages (from 1.88 to 2.04).6 This, in contrast to the period of declining relative wages of non-manual workers between 1985 and 1991. Not shown is the pattern of employment growth in registered manufacturing, which has increased steadily with an acceleration since 1991. Since both the relative wage and the proportion of non-manual workers increased in the 1990s, it follows that the increased quantities of non-manual workers employed represent an aggregate demand shift towards these more skilled workers. During the 1985-90 period it is hard to make a clear statement about whether demand or supply for skills dominates. Since wages and quantities change in opposite directions one cannot tell if shifts in demand dominate movements along a demand curve (for manual relative to non-manual workers) in response to changes in relative wages. One way of approaching that problem is to see what the diagnosis would be with an assumed aggregate elasticity of substitution. If that elasticity were unity, then the wage-bill share of non-manual workers would not be changed by supply, as changes in relative wage (in isolation) would exactly be compensated by changes in proportion employed, leaving the wage-bill constant. Any change in wage-bill share could then be attributed to relative demand shifts. The wage-bill share of non-manual workers declined by 0.12 percentage points per year in the 1985-91 period, indicating a reduction in demand for skills under the unitary elasticity assumption. In contrast, the wage-bill share of non-manual (i.e. skilled) workers increased in the 1990s, indicating an acceleration in demand for skills between the 1980s and the 1990s. Our goal is to investigate the causes of that increase in demand for skills in Indian manufacturing. The next section describes a framework for estimation and derives an estimating equation. We then present results.
6 These figures exclude West Bengal because of an apparent measurement problem in 1984 (see text in Section 4 for details).

5
3. SKILL–BIASED TECHNOLOGICAL CHANGE – A FRAMEWORK
The first aspect of our framework is a definition of factor-biased technological change.7
Consider a production technology Y = g (K, S, L, t) , (1)
where K is capital, S is skilled labor, L is unskilled labor and t is time.
Now define the bias of technological change as the rate at which the elasticity of output
with respect to any factor f ∈ (K, S, L), fY
lnln
∂∂ , changes with time,
ftfY γ≡
∂∂∂
ln lnln2
.
In this context, technological change is absolutely skill-biased if γs>0. Absolute skill-bias
implies increased demand for skills because their marginal product is increasing. Conversely, technological change is absolutely labor-saving if γl<0, which implies decreased demand for unskilled labor.
The literature has defined skill-bias as a relative shift in demand from unskilled to skilled
workers, a definition which does not require an absolute decline in demand for unskilled workers.
(Technically, it is equivalent to SY
lnln
∂∂ growing at a faster rate than
LY
lnln
∂∂ , or in the Cobb-
Douglas case to the exponent of S growing at a faster rate than the exponent of L.) Evidence on Skill-Biased Technological Change from Demand Shifts
The skill-biased technological change (SBTC) hypothesis argues that employers’
increased demand for skilled workers has been largely driven by the kinds of new technologies that are permeating into modern workplaces. The critical idea is that these new technologies lead not only to higher productivity, but also favor more educated workers. As such, employers increase demand for more skilled (i.e., more educated) workers8 who complement the new technology. At the same time workers who do not possess the appropriate skills to operate the new technologies face decreased demand. As such, the wages and employment of the more skilled rise relative to their less skilled counterparts.
7 See Berman (2000) for a more detailed derivation. 8 We follow the standard practice in this literature of using the term “skill” to loosely refer to human capital accumulated through education. A craftsman with low education in manufacturing would be an “unskilled” worker in this analysis.

6
One can illustrate simultaneously rising relative wages and employment for the skilled workers in terms of a simple relative demand and supply framework, making the standard assumption that factors are paid their marginal products. Consider the following Figure:
The Figure shows a labor market with two skill types, skilled and unskilled (viz non-
manual and manual workers), where employers demand a certain number of each. Equilibrium in the model is given by the intersection of the relative demand and supply curves given by D0 and S0 in the Figure, with a relative wage of (Ws/WL)0 and relative employment of (S/L)0.
The experience of many countries in recent years is that the ratio of skilled to unskilled
wages has increased or remained steady while the ratio of skilled to unskilled employment has risen (Berman, Bound and Machin, 1998). To get such an outcome, there has to have been an outward shift in the relative demand curve. Suppose the demand curve shifts out to D1 one then ends up with simultaneously higher relative wages and employment for the skilled at (Ws/WL)1 and (S/L)1. Much of the literature has argued that the key driver of the observed relative demand shifts has been skill-biased technological change. A range of evidence has been brought to bear on this question. Some is rather indirect, and some relates the observed changes to direct measures of technology.
“Within-Between” Decompositions
The SBTC hypothesis requires that technology drives shifts in skill demand. Because of
this one should see skill use shifts occurring where employers have more to gain from the introduction of new technology. Consequently there should be systematic differences in the extent of relative demand shifts within particular workplaces, firms and industries, each of whom is likely to differ in their demand for and the extent of their use of new technologies. One test of relevance to the SBTC argument therefore comes from a decomposition of aggregate changes in skill demand (usually measured by wage bill or employment shares of skilled workers), say ∆Sn, for i =1,…N industries as follows:
S0
D0D1
Skilled/Unskilled Employment
Skilled/Unskilled Wages
(S/L)0(S/L)1
(WS /WL)
(WS /WL)0

7
∑∑=
−
=
−
+=N
1ii
N
1ii ii Sn∆PP∆Sn∆Sn (2)
The decomposition breaks the overall shift in skill demand into two components. The first is the within-industry component of skill upgrading (weighted by P, the relative size of industry i, where a bar is a time mean). The second measures the contribution of between-industry shifts, namely how much bigger or smaller an industry is becoming over time (weighted by the time averaged skill demand).
A number of studies using this kind of decomposition have systematically found that the bulk of the aggregate changes have occurred within, rather than between industries or workplaces. These studies cover different countries, levels of aggregation, time period and skill measures. It is clear the bulk of the skill upgrading that has occurred in OECD manufacturing since the start of the 1970s has been within, rather than between, industries.9
Moreover, the same is true in the developing world. Table 2 reports within-between decompositions for high, middle and low income countries and again the within-industry component is seen to be more important almost everywhere.10 It therefore seems that across the world the within industry aspect of skill demand is what matters most. Of course it could be consistent with other possible explanations but the fact that the bulk of the shifts are seen within industries, when increased relative wages of skilled workers predict within industry skill-downgrading (i.e., substitution away from the input with the rising relative wage) provides one form of evidence. This is entirely consistent with SBTC altering relative wage and employment outcomes globally.
Capital-Skill Complementarity
The evidence of the previous sub-section is consistent with SBTC being important, but
does not relate shifts in skills demand to observable technologies. Indicators of technological change such as use of computers or R&D investments have been shown to be correlated with skill-upgrading in the U.S. and U.K. (see a summary in Berman and Machin (2000)). One frequently used formal test is to estimate cost share equations relating changes in the skilled wagebill/employment share in a given industry to observable measures of technology (see Berman, Bound and Griliches, 1994). Define Sn as the wage-bill share of skilled workers. For industry i in year t, the share equation
∆Snit = α+ β∆log(Kit/Y) + γ∆log(Yit) + δ∆log (wS/wL )it (3) can be derived from a translog cost function dual to the production function in (1) with two labor inputs (skilled and unskilled), assuming capital to be a quasi-fixed factor. Constant returns to scale would imply that γ=0, though γ may also capture short term cyclical fluctuations likely in Sn (perhaps due to differential adjustment costs in hiring and firing skilled and unskilled workers). 9 For example, Berman and Machin (2000) provide a summary of studies from the US and UK. 10 Sanchez-Paramo and Schady (2002) confirm the same finding for six Latin American countries (Argentina, Bolivia, Brazil, Chile, Colombia and Mexico).
8
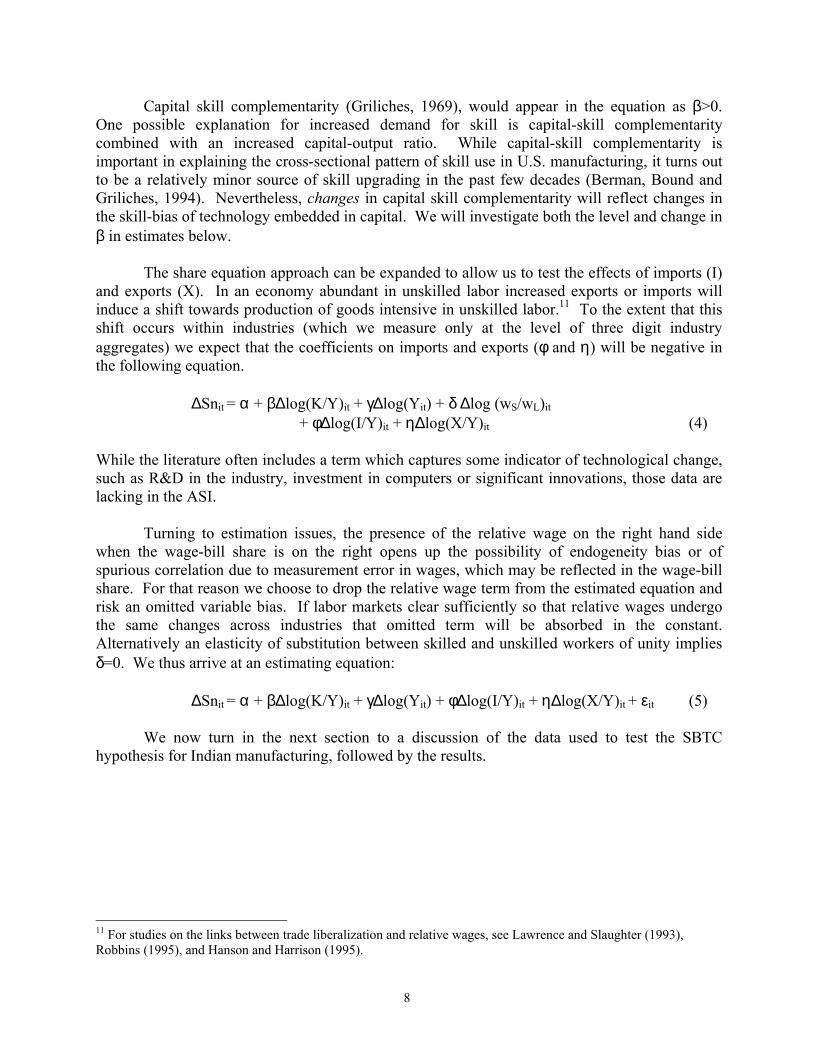
Capital skill complementarity (Griliches, 1969), would appear in the equation as β>0. One possible explanation for increased demand for skill is capital-skill complementarity combined with an increased capital-output ratio. While capital-skill complementarity is important in explaining the cross-sectional pattern of skill use in U.S. manufacturing, it turns out to be a relatively minor source of skill upgrading in the past few decades (Berman, Bound and Griliches, 1994). Nevertheless, changes in capital skill complementarity will reflect changes in the skill-bias of technology embedded in capital. We will investigate both the level and change in β in estimates below. The share equation approach can be expanded to allow us to test the effects of imports (I) and exports (X). In an economy abundant in unskilled labor increased exports or imports will induce a shift towards production of goods intensive in unskilled labor.11 To the extent that this shift occurs within industries (which we measure only at the level of three digit industry aggregates) we expect that the coefficients on imports and exports (φ and η) will be negative in the following equation.
∆Snit = α + β∆log(K/Y)it + γ∆log(Yit) + δ ∆log (wS/wL)it + φ∆log(I/Y)it + η∆log(X/Y)it (4) While the literature often includes a term which captures some indicator of technological change, such as R&D in the industry, investment in computers or significant innovations, those data are lacking in the ASI. Turning to estimation issues, the presence of the relative wage on the right hand side when the wage-bill share is on the right opens up the possibility of endogeneity bias or of spurious correlation due to measurement error in wages, which may be reflected in the wage-bill share. For that reason we choose to drop the relative wage term from the estimated equation and risk an omitted variable bias. If labor markets clear sufficiently so that relative wages undergo the same changes across industries that omitted term will be absorbed in the constant. Alternatively an elasticity of substitution between skilled and unskilled workers of unity implies δ=0. We thus arrive at an estimating equation:
∆Snit = α + β∆log(K/Y)it + γ∆log(Yit) + φ∆log(I/Y)it + η∆log(X/Y)it + εit (5)
We now turn in the next section to a discussion of the data used to test the SBTC hypothesis for Indian manufacturing, followed by the results.
11 For studies on the links between trade liberalization and relative wages, see Lawrence and Slaughter (1993), Robbins (1995), and Hanson and Harrison (1995).

9
4. DATA AND RESULTS Data Sources.
The analysis is based on the India Annual Survey of Industry (ASI) which was available to us from 1983/84 through 1997/98 disaggregated by state and 3 digit (NIC) industry.12 This is a survey of registered manufacturing firms, reporting employment in two skill categories (non-manual and manual workers) which we interpret as representing skilled and unskilled labor, respectively; wage-bills for each labor category, output, value added, capital stock and a number of other variables. Before using the ASI, we adjusted the pre-1990 data (based on NIC-70) to reflect the adoption in 1990 of a new industrial classification system (NIC-87). This involved developing and applying a cross-walk between NIC-70 and NIC-87 to accommodate the industries that were either merged, split up, or mixed (both merged and split).13
The public-use ASI data was of uneven quality. We discovered numerous internal and external inconsistencies in these data and believe that we have resolved most of them. We examined time-series of employment for sudden changes in each 3 digit industry by state, then compared these figures with totals available from the Indian Statistical Institute and with data from other sources when inconsistencies remained unexplained. We found three types of data problems, which are discussed in turn below:
1) Missing data - All observations are missing for Uttar Pradesh in 1992. This was simple enough to identify. It appears to be the only state with such a stunning absence. We are currently seeking to recover those data from the Indian Statistical Institute.
2) Coding mistakes - The data indicate a very sharp decline in employment in West Bengal
between 1984 and 1985, from 1.1 million manufacturing workers to 800 thousand. 180 thousand of that decline is reported in one three digit industry, aluminum manufacturing (NIC 335)14. Similar declines are reported for value added, output and other statistics. That sharp reduction in employment is inconsistent with the slight but steady employment increase reported in official statistics by the Bureau of Economics and Statistics in the Government of West Bengal.15 Compared to national totals for employment, the 1984 figures from our ASI data seem to be about 160,000 too high, indicating that this one industry is probably the source of the entire mistake. Recognizing this, our analysis is conducted both with and without the suspect West Bengal data. Conveniently, the focus of our analysis – the wage-bill share of non-manual workers – is not particularly sensitive to the treatment of West Bengal in 1984.
12 NIC is the National Industrial Classification used in India. 13 The NIC70-NIC87 cross-walk is available upon request from the authors. 14 NIC code 335 corresponds to ISIC code 3720, which is classified as non-ferrous metal basic industries. 15 Sources: Table 4.2 in Statistical Appendix to Economic Review 1990-91 of Government of West Bengal. The Table in turn cites the following: National Employment Service, West Bengal, and Bureau of Applied Economics, Bengal; Table 11.5 in West Bengal Statistical Handbook 1997 of Bureau of Applied Economics and Statistics, Government of West Bengal. The Table itself uses as source the Directorate of Cottage and Small Scale Industries, West Bengal; Chief Inspector of Factories, West Bengal. We thank Professor Dilip Mookherjee of Boston University for generously pursuing this investigation.

10
3) Inconsistent aggregation - Finally, we found that at the 3 digit industry level a large
number of industry-state observations were present in some years but missing in previous or subsequent years, apparently due to a policy of aggregating observations across industry classifications in order to preserve confidentiality. This policy is described in ASI documentation. Unfortunately, this aggregation is not performed consistently over time, so that industries seem to pop in and out of the data. Our solution to this problem was to deal with industries at the 2 digit level of aggregation in (state x industry) analysis and to restrict our attention to States in which employment was large enough to avoid confidentiality problems at the two digit level.
Empirical Results
Table 3 reports the changes in relative wages and quantities for non-manual and manual workers for the pre- and post-reform sample periods, 1984-89 and 1990-98 respectively. Recall that non-manual workers are the higher education, or “skilled” category. During the 1990-98 period, the proportion of non-manual workers in employment increased by 0.10 percentage points per year, while their relative wages increased by 1.07 percent annually. In contrast, during the 1984-89 period the employment share of non-manual workers dropped by 0.23 percentage points annually, while their relative wages increased at a rate of 0.26 percent per year.
The aggregate increase in demand for non-manual workers in the 1990s is evident in the fact that their proportion and relative wage increased at the same time. What accounted for this demand shift? Skill-bias in technological change is one possibility, but not the only one. A shift in the composition of manual due to trade, shifts in tastes or scale effects could all cause demand for non-manual workers to increase as skill-intensive industries increase their employment shares. A useful approach to diagnosis is to decompose changes in the proportion of skilled labor in employment into within- and between- industry components as outlined in the section above. Within-industry shifts in the wage-bill indicate a shift in demand within industries. Those could be due to SBTC or capital-skill complementarity (which we analyze below), but cannot be due to shifts in the industrial distribution. The latter are reflected in the “between” industry term. The key point of Table 3 is that during the 1990s these “within” industry proportions are positive and the dominant term in Indian manufacturing. A full 85 percent of the increase in employment share and 89 percent of the increase in wage-bill share of skill occur within two digit industries. That indicates industries were substituting toward the employment of skilled labor despite the rising relative wage of skill. In this sense India in the 1990s reproduces the pattern familiar from our other studies in the 1980s in the manufacturing sectors of the vast majority of countries surveyed, as reported in Table 2. In diagnosing changes in demand for skills shifts in supply are a confounding factor. One convenient approach to neutralizing the effects of supply shifts is to assume an elasticity of substitution of unity between skilled and unskilled labor, so that the wage-bill is invariant to movement along the relative demand curve in the Figure above. That approach recommends the wage-bill share of non-manual workers as a measure of demand for skills, since it shifts only with demand under the assumption. Figure 2 illustrates that approach for the ASI data. The non-

11
manual share of wage-bill drops between 1984 and 89 and then rises fairly steadily through the 1990s. Compared to the two series in Figure 1, relative wages and proportion of non-manual workers in employment, the wage-bill share series is smoother, suggesting that indeed supply shifts are being muted in this series by motion along a demand curve. India is a country of diverse manufacturing technologies spread across vast distances with poor transport between States and between interior States and foreign markets. So one might suspect that shifts in demand for skill would differ across States. Table 4 investigates cross-State differences in demand for skills in manufacturing, reporting for each State in both periods the change in wage-bill shares of non-manual workers, the proportion of that change that occurs within industries and the change in relative wages. Note that registered manufacturing employment varies widely across States (as does population) from a high of 1.5 million in Maharashtra to just 11 thousand in Chandigarh. Six States are not reported as they have so little employment that reclassification across 2 digit industries (NIC) may be suspect. Table 4 reports three clear findings about demand for skills in the 1990s. First, in fully 19 of the 21 States the wage-bill share of non-manual workers increased in the post-reform sample period between 1991 and 1998. The only exception among the large States was West Bengal. Second, in 10 of those 14 cases the proportion of that change which occurred within industries was strongly positive (over 60 percent), providing a preliminary indication of SBTC. Third, despite the similar sign of these changes, the size varied considerably across regions. This last finding—of diversity in skill upgrading—mimics the popular perception of widely different growth in manufacturing across regions. To estimate equation (5), the share equation, we have divided the ASI data into two sub-periods, from 1984 through 1989 and from 1990 through 1998. (The 1989-1990 transition is excluded because we suspect inconsistencies due to redefinition of industries as noted above). Table 5 reports summary statistics. Recall that the 1984-1989 period largely preceded economic reforms, and was characterized by a decreased proportion of non-manual (skilled) workers by 0.41 percentage points per year. In contrast, the 1990-1998 period was one of an increased proportion of non-manual workers by 0.31 percentage points per year.16 Note that imports and exports also grew rapidly in both periods, but the 1990s stand out in the rapid growth of investment and value added — capital grew by over 13.1 percent per year and value added by 10.4 percent so that the capital/value added ratio increased by 2.7 percent annually.
The share equations derived above can demonstrate the relative importance of output growth, capital, imports and exports in demand for skills. Table 6 reports the result of estimating equation (5) using the national data for 76 “4 digit” (ISIC)17 industries. The left four columns of results report separate estimates for each period, revealing the contrast between periods. In the 1984-89 period growth in the K/Y explains little of the decline in the wage-bill share of non-manual workers, with a small and statistically insignificant coefficient. In contrast in the 1990-98
16 These figures differ slightly from those in Table 2 as we have restricted the sample to observations in which all the covariates are present. 17 Three-digit NIC translates into four-digit ISIC.

12
period the coefficient on growth in K/Y is large and statistically significant, at 0.0263. This larger coefficient in the 1990s indicates that capital-skill complementarity increased between the 1980s and 1990s. That increase in capital-skill complementarity, coupled with the growing K/Y ratio in the 1990s, may explain some fraction of the increased demand for skills in manufacturing during the 1990s.
The other variables in this specification are also interesting. The coefficient on value
added indicates that faster growing industries also increased their wage-bill share of non-manual workers, in violation of the constant-returns hypothesis which implies that input shares are invariant to scale. Imports and exports have negative coefficients in this regression, as would be predicted by a Heckscher-Ohlin approach to our industry regressions, suggesting that exports and imports will reduce skill content within industries in an unskilled labor abundant country by reallocating production to less skill-intensive products. These coefficients are small, though, and statistically insignificant. They nevertheless do explain some of the reduced demand for non-manual workers, especially in the 1980s.
The four rightmost columns of Table 6 examine how much of the acceleration in the
wage-bill share of non-manual workers can be attributed to covariates, mostly output growth and capital-skill complementarity. Using the pooled sample, the coefficient on the constant is the annualized change in the non-manual wage-bill share between 1984 and 1989, which is negative 0.0041 in the baseline specification (as in Table 5). The coefficient on the indicator for the 1990s, 0.0071, reflects the acceleration in the non-manual wage-bill share from -0.0041 to +0.0031 (with a little rounding error). Adding covariates as we move to the right explains about half that acceleration, reducing the coefficient to 0.0033 in the rightmost column. Specifically, including the change in log K/Y and the change in log Y explain about half the acceleration between them, if those coefficients are allowed to differ between the 1980s and 1990s. Yet, the specification with only the capital skill complementarity term (the 6th column) has a coefficient on the 1990s of 0.0067, indicating that the change in capital-skill complementarity alone explains very little of the acceleration (1 - .0067/.0071 = 6 percent).
Table 7 reports sharper estimates using the richer dataset available by using variation
across both states and industries. The result is qualitatively the same looking at state-industry pairs: capital-skill complementarity is much stronger in the 1990s, after the reforms, the coefficient increasing by an order of magnitude, from 0.0024 to 0.0343. The two rightmost columns report that this increase in the capital-skill complementarity coefficient (0.0320 or 0.0278, depending on specification) is large and statistically significant. As in Table 6, though, very little of the acceleration in skill upgrading is explained by capital-skill complementarity, as the inclusion of a K/Y term which varies over time reduces the coefficient on the 1990s indicator only slightly, from 0.0073 to 0.0068.
Tests of Robustness
We carried out a number of experiments to check the robustness of the share equation
estimates in Tables 6 and 7. Sensitive to the idea that states may have very different experiences, one robustness test is to run the same regression allowing each state a secular trend in the non-manual wage-bill share, perhaps to allow for local changes in trade, infrastructure investment,

13
regulation, business cycles or technological change. Allowing for state fixed effects in growth hardly changes the estimated coefficients, as shown in the rightmost column of Table 7. The 1990s increase in the capital-skill complementarity and output coefficients is reduced only slightly by allowing for state effects. Surprisingly, allowing states a separate trend in changing wage-bill shares of non-manual workers increases the R2 by only four percentage points.
Table 8 reports tests of robustness to alternative sampling methods. Recall that we split
the sample in an unusual way to avoid the 1989-90 industry recoding and that we had some doubts about observations in the early period from West Bengal (see Data Appendix A for details). Table 8 reports estimated share equations using two different definitions of the periods and excluding West Bengal. We try three approaches: a) redefining the periods as 1984-90 and 1990-98, spanning the industry recoding of 1989-90; b) redefining the periods as 1984-91 and 1991-98 to reflect the pre- and post-reform periods; and c) omitting West Bengal data altogether and using the period definitions 1984-89 and 1990-98 as in the previous tables. Increased capital-skill complementarity is evident in all these estimates and is statistically significant in 5 of the 6 specifications. As such, the finding of increased capital-skill complementarity in the 1990s is robust to different redefinitions of the sample.
To put the estimated capital-skill complementarity coefficients in context we compare
them with U.S. estimates. For U.S. manufacturing the comparable capital-skill complementarity coefficient (estimated in a similar regression) for the 1959-86 period is 0.038 (see Berman, Bound and Griliches, 1994), for the 1979-86 period the U.S. coefficient is 0.064. Thus, these estimates indicate that capital-skill complementarity in Indian manufacturing increased from an estimated zero in the 1980s to a level in the 1990s comparable to the U.S. level for the 1960s and 1970s. We interpret this as evidence of skill-biased technological change for technology embodied in new capital.
These different robustness tests together argue strongly for a clear conclusion: Increased demand for non-manual workers in Indian manufacturing in the 1990s can be largely attributed to the combination of three factors: increased capital-skill complementarity, increased investment and increased output. The first two are consistent with the idea of skill-biased technological change embodied in new investment yet they account for only a small fraction of the acceleration in skill-upgrading between the 1980s and 1990s. The increase in output alone predicts almost half of that acceleration, which is really a surprise. Fast growing industries are upgrading their skill mix faster than slow-growing or stable industries.
International SBTC and India Is increased capital-skill complementarity in Indian manufacturing related to the international pattern of skill-biased technological change evident in the manufacturing sectors of OECD and middle income countries? One way to look at this is to ask whether the same industries upgrade skills in different countries at the same time. This cross-country correlation approach has shown consistent patterns of skill upgrading in many industries across countries in the OECD in the 1980s (Berman, Bound and Machin, 1998). Those same industries generally underwent skill-upgrading in middle-income countries in the 1980s as well (Berman and Machin, 2000).

14
Table 9 reports the result of a similar exercise for the ASI data, in which we ask if skill upgrading in Indian industries in the 1990s is predicted by upgrading in the same industries in previous decades in the U.S., after accounting for the effects of capital-skill complementarity and increased output. The answer is negative. There is only weak evidence of a correlation with U.S. skill upgrading in the same industries in the 1960s and 1970s and a weak negative correlation with the U.S. pattern in the 1980s. Interestingly enough, the Indian pattern of skill upgrading in the 1990s is also not strikingly similar to that in middle-income countries either, showing a weak positive correlation with the middle-income pattern for the 1980s and a negative correlation with the middle income pattern of skill-upgrading for the 1970s. Thus, in contrast to middle-income countries, India’s participation in an international pattern of skill-biased technological change seems to be limited to technologies embodied in capital or somehow related to increased output. Unsolved Puzzles One remarkable feature of skill-upgrading in India is the different experiences across states in the 1990s. Even among the states with large manufacturing sectors, the growth in wage-bill share of skilled workers ranges from a high of 0.89 percentage points a year in Gujarat to a low of –0.07 percentage points per year in West Bengal (as reported in Table 4). Table 10 reports that this heterogeneity in skill upgrading across states remains evident when covariates are included in estimating the share equation. While including state effects in the regression has little effect on the estimated coefficients it does increase the R2 quite a bit, from 0.10 to 0.27. In unreported results we have attempted to investigate the effects of one state-specific factor: electricity generated within the state. That variable has no explanatory power. Further exploration of skill-upgrading in India may do well to focus on state-specific factors such as differences in infrastructure investment and regulation18, and in employment protection legislation19.
18 The Investment Climate, varying across Indian states, may also be a contributing factor for these differences 19 For example, see Besley and Burgess (2002) on the role of cross-state differences in employment protection legislation on variations in economic growth across states in India.

15
5. CONCLUSIONS Indian manufacturing was unusual in the 1980s in the falling proportion of non-manual (relatively skilled) workers in employment, bucking a worldwide trend which has been associated with skill-biased technological change. The 1990s were different, though. The proportion of non-manual workers in employment increased, as did the non-manual share of wagebill. This, against the backdrop of various economic reforms instituted in the early 1990s, and acceleration of investment and productivity. Is the increased use of skilled workers in Indian manufacturing in the 1990s due to SBTC? The answer is uncertain. On the one hand, most of the skill upgrading occurred within 4 digit industries (using the ISI classification), indicating that it was largely not due to shifts from low to high skill industries as would be the case if trade patterns or preferences for goods had changed. It is a within industry phenomenon. Furthermore, estimated capital-skill complementarity (in a translog share equation) increased significantly between the 1980s and 1990s from a level indistinguishable from zero, to one similar to that for U.S. manufacturing in the 1960s or 1970s. This could well be due to skill-biased change in technologies embodied in capital.
On the other hand, the combination of increased capital-skill complementarity and increased investment account for very little of measured skill-upgrading, assuming constant returns. The only variable that consistently predicts skill upgrading in Indian industries is increased output. Why growing output predicts skill upgrading is a mystery for future research which we can only speculate on. One possibility is that restrictions on layoffs reduce the ability of firms to adjust their skill mix to make it appropriate for new technologies. Rapidly growing firms can raise the proportion of skilled workers by hiring them disproportionately while firms with stable employment may not do so. That constrained labor demand explanation is consistent with the pattern shown by U.S. manufacturing in the recession of the early 1980s, when firms freed of the usual firing constraints by the crisis laid off less-skilled workers disproportionately while new hires in the recovery were on average more skilled.
Another reason to doubt that SBTC is a major influence is that the industries undergoing
skill-upgrading are not the typical suspects revealed by cross country correlations in the literature. Data on investments in technology is likely necessary to understand why demand for skills has increased in some industries and not in others. This would be a particularly interesting investigation in India as tariffs on computers were reduced sharply in the early 1990s.
An important topic for future research is the high cross-state variation in increased demand for skills in registered manufacturing. Among the states with large manufacturing sectors, the rapid increase in demand for skills in Haryana, Karnataka and Punjab in particular is not well explained by their industrial composition, capital-skill complementarity or the increased output effect.

16
REFERENCES Autor, David and Lawrence F. Katz (1999), “Changes in the Wage Structure and Earnings
Inequality,” in Orley Ashenfelter and David Card, eds., Handbook of Labor Economics, Volume 3A, Elsevier-North Holland, 1463-1555.
Berman, Eli, John Bound and Zvi Griliches (1994), "Changes in the demand for skilled labor within U.S. manufacturing industries: Evidence from the Annual Survey of Manufacturing," Quarterly Journal of Economics, CIX, 367-398.
Berman, Eli, John Bound and Stephen Machin (1998), "Implications of Skill-Biased Technological Change: International Evidence," Quarterly Journal of Economics, 113(4), 1245_1280.
Berman, Eli and Stephen Machin (2000), "Skill-Biased Technology Transfer Around the World,” Oxford Review of Economic Policy, 16(3).
Berman, Eli (2000), "Does Factor-Biased Technological Change Stifle International Convergence? Evidence from Manufacturing," Working Paper, Boston University.
Besley, Timothy and Robin Burgess (2002), “Can Labor Regulation Hinder Economic Performance? Evidence from India”, CEPR Discussion Paper 3260.
Freeman, Richard and Lawrence Katz (1994), "Rising wage inequality: The United States vs. other advanced countries," in Richard Freeman, ed., Working Under Different Rules, Russell Sage Foundation.
Goldin, Claudia, and Lawrence F. Katz (1998), "The Origins of Technology-Skill Complementarity, "Quarterly Journal of Economics, CXIII, 693-732.
Government of India (2002), “Handbook of Industrial Policy and Statistics, 2001”, Office of the Economic Advisor, Ministry of Commerce and Industry, New Delhi.
Government of India, “Economic Survey,” Office of the Economic Advisor, Ministry of Commerce and Industry, New Delhi, (various years).
Griliches, Zvi (1969), "Capital-Skill Complementarity," Review of Economics and Statistics, 51, 465-468.
Hanson, Gordon H. and Ann Harrison (1995), "Trade, Technology and Wage Inequality", NBER Working Paper 5110.
Katz, Lawrence F., Gary W. Loveman and David G. Blanchflower (1995), "A comparison of changes in the structure of wages in 4 OECD Countries," in Katz and Freeman, eds., Differences and Changes in Wage Structures, University of Chicago Press.
Katz, Lawrence F. and Kevin M. Murphy (1992), "Changes in Relative Wages, 1963-1987: Supply and Demand Factors," Quarterly Journal of Economics, CVII, 35-78.
Lawrence, Robert and Matthew Slaughter (1993), "International Trade and U.S. wages in the 1980s: Great sucking sound or small hiccup," Brookings Papers on Economic Activity, II, 161-227.
Mookherjee, Dilip (1995), "Introduction," in Mookherjee (ed.) Indian Industry: Policies and Performance, Delhi: Oxford.
Robbins, Donald J. (1995), "Trade, Trade Liberalization and Inequality in Latin America and East Asia: Synthesis of Seven Country Studies." Harvard, mimeo.
Sachs, Jeffrey and A. Warner (1995), "Economic Reform and the Process of Global Integration," Brookings Papers on Economic Activity (1), 1-95.
Sanchez-Paramo, Carolina and Norbert Schady (2003), “Off and Running: Technology, Trade and the Rising Demand for Skilled Workers in Latin America”, World Bank Policy Research Studies Working Paper.

17
Figure 1: Relative Wages of Non-manual Workers and their Proportion in Employment - 1984-98
Note: The figure excludes West Bengal and the year 1992, during which the data exclude Uttar Pradesh.
Wn/
Wp
year
Non
man
ual w
orke
rs/E
mpl
oym
ent
Wn/Wp Nonmanual workers/Employment
84 90 94 98
1.3
1.5
1.7
1.9
2.1
.23
.24
.25
.26
.27
.28

18
Sn
year84 90 94 98
.34
.36
.38
.4
Figure 2: Non-manual Wage-bill Share 1984-98

19
Table 1: Historical Sectoral Growth Rates in India
PLAN Agriculture Manufacturing GNP FIRST (1951-56) 2.5 5.0 3.7 SECOND (1956-61) 2.2 4.5 4.2 THIRD (1961-66) -.30 5.3 2.8 Three Annual Plans (1966-69) 4.5 2.7 3.9 FOURTH (1969-74) 1.3 1.8 3.4 FIFTH (1974-79) 3.6 5.9 5.0 SIXTH (1980-85) 3.1 4.9 5.4 SEVENTH (1985-90) 3.1 6.2 5.9 EIGHTH (1992-97) 3.4 6.9 6.8 Source: Government of India, Economic Survey, 2000-2001, Tables S-4 and S-5. Notes: GDP is estimated to be 27% industry, 25% agriculture for 2000. (World Bank India Data Profile: www.worldbank.org/data)

20
Table 2: Within/Between Decompositions in High, Middle and Low Income Countries
1970-80 1980-90 %∆Sn % Within %∆Sn % Within Notes
HIGH INCOME GROUP
US 0.19 86 0.51 76 Australia 0.06 52 0.42 92 1970, 80 ,87 Sweden 0.38 81 0.07 25 Norway 0.33 76 1970, 80, na West Germany 0.67 95 0.42 83 1970, 79, 90 Luxembourg 0.90 95 0.73 123 Denmark 0.12 42 0.64 89 1973, 80, 89 Belgium 0.77 86 -0.06 92 1973, 80, 85 Finland 0.27 82 0.70 83 Austria 0.69 93 0.36 76 1970, 81, 90 UK 0.39 91 0.62 92 Japan 0.37 98 0.14 98 1969-75, 78-90
MIDDLE INCOME GROUP
Venezuela 0.78 141 0.56 62 1970, 81, 91 Spain 0.70 92 na, 80, 90 Ireland 0.02 25 0.58 75 1970, 80, 89 Greece 0.38 104 0.93 90 Cyprus -0.07 108 na, 81, 91 Uruguay 0.17 51 na, 80, 88 Hungary 0.93 96 na, 80, 90 Portugal -0.97 96 0.48 90 1972, 80, 87 Malta -0.26 43 0.72 76 1970, 80, 88 Poland 0.06 80 1970, 80, 89 Chile 1.12 92 0.05 153 Czechoslovakia 0.06 61 0.22 92 1970, 80, 89 Malaysia -0.35 86 na, 83, 90 Korea 0.08 36 1973, 80, 90 Colombia -0.13 145 0.66 84 1972, 80, 90 Peru 0.13 -247 1.38 103 1972, 80, 88 Turkey 0.60 79 na, 83, 90 Guatemala 0.36 50 0.96 69 1973, 80, 87
LOW INCOME GROUP
Philippines 0.68 46 1970, 77, na Egypt 0.23 49 0.44 83 1971, 80, 88 Pakistan 0.50 72 na, 80, 88 Bangladesh 0.21 152 0.32 20 1970, 80, 88 India 0.19 -11 -0.08 303 1970, 80, 88 Tanzania -0.43 93 0.65 84 1970, 80, 85 Ethiopia 0.58 91 na, 80, 88
Note: ∆Sn is the change in non-manual wage-bill share×100. The percentage “within” is the percentage of the change due to within industry increases. Data from the United Nations General Industrial Statistics program. See Berman and Machin (2000) and Berman, Bound and Machin (1998) for data definitions and details.

21
Table 3: Within Industry Changes in Employment of Skilled Labor: Annualized Changes
84-89 90-98
∆ employment share (x100) -0.23 0.10
% within
128.05
85.14
∆ wagebill share (x100) -0.23 0.37
% within
175.31
89.45
% ∆ in relative wage (wn/ wp)
0.26 1.07
Note: percentage “within” is the percentage of the change due to within industry increases, according to the decomposition discussed in the text. The percentage change in the relative wage of non-manual workers is also an annual average.

22
Table 4: Changes in Wage-bill Shares by State and Period
84-89 90-98
State* ∆ Sn % within % ∆ wn/wp
∆ Sn % within % ∆ wn/wp
1998
EmploymentAndhra Pradesh -0.91 125.62 -8.49 0.43 45.34 0.90 985 Assam 0.05 55.81 0.70 -0.33 111.58 -1.43 132 Bihar -0.80 116.90 -2.33 0.26 143.20 -0.49 262 Chandigarh -0.37 -25.32 -2.96 0.82 124.42 -0.20 11 Delhi 0.33 -51.82 -2.14 0.64 116.21 1.80 128 Goa, Daman and Diu -0.94 69.80 -2.66 45 Gujarat 0.39 -60.98 -1.72 0.89 51.34 1.80 825 Haryana -0.61 109.84 -5.22 0.82 67.60 1.91 277 Himachal Paradesh -0.90 80.16 -0.77 0.85 55.57 2.54 38 Jammu and Kashmir 1.18 56.87 0.22 -0.02 -672.83 0.76 24 Karnataka 0.16 -120.96 -1.60 0.52 120.53 3.61 582 Kerala 0.18 18.22 -2.44 0.03 91.35 -3.67 360 Madhya Paradesh 0.20 -8.72 0.82 -0.11 182.23 -1.02 380 Maharashtra -0.43 144.10 -1.49 0.53 94.38 2.57 1,423 Orissa 0.06 -230.79 3.76 -1.44 99.53 -4.26 142 Punjab -0.33 139.48 5.25 0.88 96.58 2.42 332 Pandicherry 0.89 -33.03 3.84 1.22 27.13 7.22 35 Rajasthan 0.84 72.33 0.91 0.13 -67.10 -0.31 242 Tamil Nadu -0.44 78.40 -1.56 0.14 170.83 0.53 1,203 Uttar Pradesh 0.37 -0.78 -0.59 0.30 87.35 0.25 674 West Bengal -0.55 83.01 15.68 -0.07 -109.40 0.86 760
Total -0.23 175.31 0.26 0.37 89.45 1.07 8,900
Notes: 1. ∆Sn is the change in non-manual wage-bill share × 100. The percentage “within” is the percentage of the
change due to within industry increases, according to the decomposition discussed in the text. The percentage change in the relative wage of non-manual workers is also an annual average.
2. The table omits six State groupings with less than 10,000 employed persons in manufacturing: Dadar, Nagar and Haveli, Tripura, A&N Islands, Meghalaya, Nagaland and Manipur.

23
Table 5: Descriptive Statistics - Manufacturing Industries 1984-98
Annualized Change 1984-89 Annualized Change 1990-98
Mean Std. Dev Mean Std. Dev.
Non-manual share in wage-bill -0.0041 0.0062 0.0031 0.0036
Log capital 0.059 0.084 0.131 0.052
Log value added 0.043 0.074 0.104 0.045
Log imports 0.112 0.146 0.126 0.113
Log exports 0.139 0.144 0.115 0.092 Note: Annualized changes for 76 four-digit (ISIC) manufacturing industries for all of India in each period.

24
Table 6: Estimated Wage-bill Share Equations - National Manufacturing 1984-98 Estimates for 76 four digit industries at the National Level
Dependent variable: Change in non-manual wage-bill share
1984-89 1990-98 Pooled 1984-89 / 1990-98
1990s indicator 0.0071 0.0067 0.0036 0.0033 (.0010) (.0010) (.0014) (.0016)
d Log capital/value added 0.0022 0.0010 0.0263 0.0279 0.0007 0.0022 0.0011
(.0156) (.0150) (.0104) (.0103) (.0147) (.0157) (.0149)
d Log capital/value added x 1990s 0.0157 0.0240 0.0281
(.0179) (.0188) (.0184)
d Log value added 0.0050 0.0065 0.0297 0.0317 0.0050 -0.0043
(.0116) (.0123) (.0100) (.0114) (.0117) (.0147)
d Log value added x 1990s 0.0247 0.0254
(.0153) (.0165)
d Log imports/value added -0.0065 -0.0033 -0.0055
(.0067) (.0030) (.0045)
d Log exports/value added -0.0054 -0.0041 -0.0054
(.0088) (.0046) (.0065)
Constant -0.0043 -0.0029 -0.0007 -0.0001 -0.0041 -.0041 -.0043 -0.0030
(.0009) (.0015) (.0011) (.0015) (.0008) (.0008) (.0009) (.0013)
R2 0.00 0.05 0.16 0.17 0.33 0.34 0.36 0.38
Observations 76 76 76 76 152 152 152 152
Note: Annualized changes for 76 four-digit (ISIC) manufacturing industries for all of India in each period. Heteroskedasticity-consistent standard errors in parentheses. Estimated by weighted least squares with wage-bill shares averaged over the period as weights. Coefficients significant at the 5% level in bold face. See equation (4) in text.

25
Table 7: Estimated Wage-bill Share Equations -State Manufacturing 1984-98 Pooled sample of three digit industries for 22 states.
Dependent variable: Change in non-manual wage-bill share
1984-89 1990-98 Pooled 1984-89 / 1990-98
1990s indicator 0.0073 0.0066 0.0038 0.0044 0.0043 (.0010) (.0013) (.0014) (.0013) (.0015)
d Log capital/value added 0.0024 0.0343 0.0132 0.0024 0.0018 0.0045
(.0079) (.0067) (.0060) (.0079) (.0079) (.0072)
d Log capital/value added
x 1990s 0.0320 0.0278 0.0250 (.0104) (.0104) (.0101)
d Log value added -0.0001 0.0283 0.0111 -0.0001 -0.0002 0.0044
(.0088) (.0084) (.0065) (.0088) (.0081) (.0081)
d Log value added
x 1990s 0.0284 0.0219 0.0240 (.0121) (.0104) (.0120)
Constant -0.0043 -0.0005 -0.0042 -0.0048 -0.0043 -0.0042 -0.0046 (.0009) (.0011) (.0008) (.0009) (.0009) (.0008) (.0008)
State effects X
Industry effects X
R2 0.001 0.10 0.14 0.15 0.17 0.21 0.24
Observations 453 495 948 948 948 948 948 Note: Annualized changes for 3-digit manufacturing (ISIC) industries in twenty one state groups. Heteroskedasticity-consistent standard errors in parentheses. Coefficients significant at the 5% level in bold face. Estimated by weighted least squares with wage-bill shares averaged over the period as weights. See equation (4) in text.

26
Table 8: Robustness Tests
National Level State Level
Dependent variable: Change in non-manual wage-bill share
84-90
90-98
84-91
91-98
84-89
90-91
without WB
84-90
90-98
84-91
91-98
84-89
90-91
without WB
1990s indicator 0.0009 0.0017 0.0032 0.0015 0.0014 0.0036
(.0016) (.0017) (.0015) (.0015) (.0013) (.0016)
d Log capital/value added -0.0212 0.0035 -0.0067 -0.0153 -0.0088 0.0015
(.0173) (.0149) (.0157) (.0091) (.0079) (.0087)
d Log capital/value added x 0.0475 0.0192 0.0400 0.0496 0.0327 0.0331 1990s (.0202) (.0185) (.0198) (.0113) (.0097) (.0112)
d Log value added -0.0098 -0.0182 0.0056 -0.0017 -0.0165 -0.0003
(.0139) (.0122) (.0117) (.0095) (.0068) (.0090)
d Log value added x 1990s 0.0395 0.0457 0.0267 0.0300 0.0484 0.0297
(.0171) (.0161) (.0155) (.0127) (.0097) (.0126)
Constant -0.0016 -0.0014 -0.0042 -0.0020 -0.0014 -0.0041
(.0010) (.0009) (.0010) (.0009) (.0008) (.0010)
R2 0.21 0.31 0.36 0.12 0.17 0.17
Observations 152 156 151 947 949 896
Note: Annualized changes for 76 four-digit manufacturing industries for all of India in each period in columns 1-3 and for three-digit manufacturing industries in twenty two state groups in columns 4-6. Heteroskedasticity-consistent standard errors in parentheses. Estimated by weighted least squares with wage-bill shares averaged over the period as weights. Coefficients significant at the 5% level in bold face. See equation (4) in text.

27
Table 9: Estimated Wage-bill Share Equations allowing Cross-Country Correlations State Manufacturing 1990-98 using three digit industries for 22 states.
Dependent variable: Change in non-manual wage-bill share
1990-98
d Log capital/value added 0.0343 0.0343 0.0339 0.0338 0.0342
(.0067) (.0067) (.0067) (.0068) (.0066)
d Log value added 0.0285 0.0284 0.0282 0.0281 0.0285
(.0084) (.0084) (.0084) (.0085) (.0083)
d non-manual wage-bill share for US in 1960s 0.130
(.243)
d non-manual wage-bill share for US in 1970s 0.104
(.208)
d non-manual wage-bill share for US in 1980s
-0.097
D non-manual wage-bill share for middle income
in 1970s
D non-manual wage-bill share for middle income
in 1980s
(.256)
-0.006
(.015)
0.015
(.011)
Constant -0.0007 -0.0007 -0.0002 -0.0003 -0.0002
(.0011) (.0011) (.0014) (.0012) (.0014)
R2 0.10 0.10 0.10 0.10 0.11
Observations 495 495 495 495 495 Note: Annualized changes for three-digit manufacturing industries in twenty two state groups. Heteroskedasticity-consistent standard errors in parentheses. Coefficients significant at the 5% level in bold face. Estimated by weighted least squares with wage-bill shares averaged over the period as weights. See equation (4) in text.

28
Table 10: Estimated Wage-bill Share Equations – State and Industry Effects State Manufacturing 1990-98 using three digit industries for 22 states.
Dependent variable: Change in non-manual wage-bill share
1990-98
d Log capital/value added 0.0343 0.0328 0.0324
(.0067) (.0078) (.0067)
d Log value added 0.0283 0.0268 0.0184
(.0084) (.0092) (.0069)
Constant -0.0005 -0.0003 0.0006
(.0011) (.0012) (.0009)
28 industry effects X
20 state effects X
R2 0.10 0.16 0.27
Observations 495 495 495 Note: Annualized changes for three-digit manufacturing industries in twenty two state groups. Heteroskedasticity-consistent standard errors in parentheses. Coefficients significant at the 5% level in bold face. Estimated by weighted least squares with wage-bill shares averaged over the period as weights. See equation (4) in text.