is ideas DIRECTORS’ REPORT Dear Members Your Directors have pleasure in presenting the Eighteenth...
107
ideas is All the meticulous planning and detailing that goes into producing a generator is not something people think of – nor should they! We work hard to make sure that people don’t have to think about generators – after all that’s what we do for a living. In TDPS we make first class generators for the world. www.tdps.co.in TD Power Systems Limited Annual Report 2017
Transcript of is ideas DIRECTORS’ REPORT Dear Members Your Directors have pleasure in presenting the Eighteenth...

ideasis
All the meticulous planning and detailing that goes into producing a generator is not something people think of – nor should they! We work hard to make sure that people don’t have to think about generators – after all that’s what we do for a living. In TDPS we make first class generators for the world.
www.tdps.co.in
TD Power Systems Limited
Annual Report 2017

8 countries111 machines
2 countries11 machines
28 countries2894 machines
20 countries120 machines
24 countries220 machines
2 countries54 machines
“Over 3000 + generators are installed in 80+countries across the globe spanning Asian, European, American & African continents”.
is global

COMPANY INFORMATION
Registered Office & Unit 1 # 27, 28 & 29, KIADB Industrial Area Dabaspet, Nelamangala Taluk Bengaluru Rural District Bengaluru – 562 111, India Tel: + 91-80-2299 5700/6633 7700 Fax: + 91-80-7734 439/2299 5718
Unit 2 Survey No. 59/2, Yedehalli Village Dabaspet, Nelamangala Taluk Bengaluru Rural District Bengaluru - 562 111, India
Japan Branch Office 3-3 Kitashinagawa 3 Chome, Shingawa-KU Tokyo, Japan Zip code No. 140-0001
Wholly Owned Subsidiaries DF Power Systems Private Limited TD Power Systems (USA) Inc. TD Power Systems Japan Limited TD Power Systems Europe GmbH TD Power Systems Jenerator Sanayi AS -Turkey
Bankers Bank of Baroda Standard Chartered Bank ICICI Bank Limited
Auditors B.K. Ramadhyani & Co. LLP Chartered Accountants Bangalore – 560 055
Stock Exchanges (Where the shares of the Company are listed)
BSE Limited National Stock Exchange of India Ltd.
Registrar and Transfer Agents (RTA) Link Intime India Private Limited
Investors grievance redressal e-mail id
TD Power Systems Limited
Board of Directors
ChairmanMohib N. Khericha
Managing DirectorNikhil Kumar
Director and CFO K. G. Prabhakar
Independent Directors Arjun Kalyanpur Nitin Bagamane Ravi Kanth Mantha Nandita Lakshmanan- (Till 10/08/2017)
Company Secretary N. Srivatsa
www.tdps.co.in CIN: L31103KA1999PLC025071
INDEX
Directors’ Report 03
- Management Discussion & Analysis 28
- Corporate Governance Report 37
Auditors’ Report 52
Balance Sheet 56
Statement of Profit & Loss 57
Cash Flow Statement 58
Consolidated Financial Statements 80

3
DIRECTORS’ REPORT
Dear Members
Your Directors have pleasure in presenting the Eighteenth Annual Report (Boards’ Report) together with the Audited Financial Statements of the Company (Company or TDPS) for the financial year ended March 31, 2017.
Financial Results
For the year ended March 31, 2017(Rs. in Lakhs)
For the year endedMarch 31, 2016(Rs. in Lakhs)
Revenue from operations & other Income 38,738.07 47,436.15
Operating Profit (EBITDA) 3,247.46 5,011.73Finance cost 406.17 481.45
Depreciation & amortization 2,772.21 2837.62
Profit before Tax (PBT) 69.08 1,692.66
Tax expense 60.18 194.78
Profit after Tax (PAT) 8.90 1,497.88
Add: Surplus brought forward from the Previous Year 21,066.62 20,911.63
Available for appropriation - 22,409.51
Appropriations
Provision for Dividends and Tax thereon - 1,220.12
Transfer to General Reserves - 122.77
Surplus carried to Balance Sheet 21,075.52 21,066.62
During fiscal 2017, the company continued to experience challenging circumstances - an uncertain global environment, sluggish domestic market scenario, and severe competition both in the domestic & overseas markets. These challenges contributed to a lower total income of Rs. 38,738.07 lakhs in Fiscal 2017 (lower by 18.34%) as compared to Fiscal 2016. Net sales from manufacturing business was Rs. 30,912.57 lakhs compared to Rs. 35,925.91 lakhs in Fiscal 2016 contributing 79.80% of our Total Income in Fiscal 2017. Net sales from our Project Business was Rs. 6,031.46 lakhs compared to Rs. 9,609.10 Lakhs in Fiscal 2016 contributing 15.57% our Total Income in Fiscal 2017.
Exports and deemed exports contributed 67% of manufacturing Revenue in Fiscal 2017 as compared to 56% in Fiscal 2016 reflecting our continuing focus on growing our overseas markets. Your company continues to add new customers in steam, gas turbine, hydro & diesel segments in different parts of the world with a growing footprint of generator installations in over 80 countries worldwide .
Earnings Before interest, tax, depreciation & amortization (EBITDA) decreased by Rs 1,764.27 lakhs or 35.20% to Rs. 3,247.46 Lakhs in Fiscal 2017 as compared to Rs. 5,011.73 Lakhs in Fiscal 2016. Profit before tax and extraordinary items decreased by Rs. 1,623.58 Lakhs or 95.92%, to
Rs. 69.08 Lakhs in Fiscal 2017 from Rs. 1,692.66 Lakhs in Fiscal 2016 mainly due to reduced sales volumes. Profit after tax decreased by Rs. 1,488.98 Lakhs, or 99.41%, to Rs. 8.90 Lakhs in Fiscal 2017 from Rs. 1,497.88 Lakhs in Fiscal 2016.
The pending orders as of March 31, 2017 are Rs. 35,405.45 lakhs comprising of both manufacturing (Rs. 29,696.22 lakhs) and project business (Rs. 5,709.23 lakhs).
The net worth of the Company stands at Rs. 49,414.79 lakhs with the accretion of Rs. 8.9 lakhs to total reserves during the year.
No material changes & commitments affecting the financial position of the Company have occurred between the end of the financial year of the Company to which these financial statements relate and the date of this report.
DividendIn view of the reduced turnover and profits, the Directors have recommended a lower dividend of Rs. 1.80 per equity share for the year ended March 31, 2017 as against Rs. 3.05 per equity share for the year ended March 31, 2016. This Dividend is subject to approval of the shareholders at the forthcoming Annual General Meeting (AGM). The dividends will entail a payout of Rs. 720.07 lakhs including dividend distribution tax of Rs. 121.80 lakhs.
Note: The above figures are extracted from the standalone financial statement of the company

TD Power Systems Limited
4
Directors’ Report (contd.)
Particulars of contracts or arrangements made with related parties.
Particulars of contract or arrangement made with related parties referred to in Section 188 (1) of the Companies Act, 2013, in the prescribed Form AOC -2, is appended as Annexure 3 to the Board’s report.
Management Discussion & Analysis
Pursuant to Regulation 34 read with Schedule V of SEBI (Listing Obligations and Disclosure Requirements) Regulations, 2015 (hereinafter called as LODR / Listing Regulations) with the Stock Exchanges, the Management Discussion & Analysis report covering operations, performance & outlook of the Company is annexed as Annexure 9 to the Boards’ Report.
Corporate Governance Report
In terms of Regulation 34 read with Schedule V of LODR, a Report on Corporate Governance along with Compliance Certificate issued by Practicing Company Secretary is attached as Annexure 10 and forms an integral part of this Report (hereinafter referred to as “Corporate Governance Report”).
Note on Board evaluation, Board Diversity Policy, Training of independent directors - familiarization of directors, Whistle Blower policy / Vigil mechanism, Nomination and Remuneration policy form part of the Corporate Governance report.
Declaration by Independent Director
The Company has received necessary declaration from Independent Director under Section 149 (7) of the Companies Act, 2013, that he/she met the criteria of independence laid down in section 149 (6) of the Companies Act, 2013 and Regulation 25 of SEBI (Listing Obligation and Disclosure requirements) Regulations, 2015 (LODR).
Policy on Directors’ appointment and remuneration
The current policy is to have an appropriate mix of executive and independent directors to maintain the independence of the board, and separate its functions of governance and management.
The policy of the Company on directors’ appointment and remuneration, including criteria for determining qualifications, positive attributes, independence of directors and other matters as required under Section 178 (3) of the Companies Act, 2013 is available on the Company’s website www.tdps.co.in. There has been no change in the policy since the last fiscal year. We affirm that, remuneration paid to the directors is as per the terms laid out in the Nomination and Remuneration policy of the Company.
Details of Policy on directors’ appointment and remuneration form part of the Corporate Governance report - Annexure 10.
Subsidiaries
As on March 31, 2017, the Company has four (4) wholly owned subsidiaries - DF Power Systems Private Limited (an Indian Subsidiary), TD Power Systems (USA) Inc., in the United States of America, TD Power Systems Japan Limited, in Japan and TD Power Systems Europe GmbH in Germany.
During the year, the Board of Directors reviewed the affairs of the subsidiaries. In accordance with Section 129(3) of the Companies Act, 2013, read with Rule 8 of Companies (Accounts) Rules, 2014, the Company has prepared its consolidated financial statement including all the said Subsidiaries which is forming part of this Report. Further, a statement containing the salient features of the financial statement of the said subsidiaries in Form AOC-1 is appended as Annexure 2 to the Boards’ Report.
In accordance with Section 136 of the Companies Act, 2013, the audited financial statements, including the consolidated financial statements and related information of the Company and audited accounts of each of its subsidiaries, are available on our website www.tdps.co.in. These documents will also be available for inspection during business hours at our registered office in Bengaluru, India.
A review of the operations of the subsidiaries is as follows:
Indian Subsidiary
During the year ended March 31, 2017, the Wholly Owned Subsidiary (WOS) DF Power Systems Private Limited completed the residual activities in respect of completed projects and has fulfilled all warranty obligations in respect of EPC contracts undertaken by it. For the year ended March 31, 2017 the WOS incurred a loss of Rs. 107.80 lakhs on a total revenue of Rs. 297.37 lakhs mainly due to fall in revenues consequent on scaling down of business.
US Subsidiary
The operations of this subsidiary have been revived during the second half of the year based on certain market opportunities which are promising. The Marketing team has been strengthened to meet market requirements which resulted in growing enquiry pipeline resulting in orders during the year. The operations of this Company during the year under report have resulted in revenue of Rs. 1,887.17 lakhs as compared to Rs 451.28 lacs in Fiscal 2016-an increase of about 318% over Fiscal 2016. This increased revenue has enabled the Company to reduce operating losses to Rs. 70.59 lakhs as compared to Rs 337.75 lacs in fiscal 2016 – a decrease of 79%.

5
Directors’ Report (contd.)
Japan Subsidiary
Major activities of this subsidiary are now conducted through the Company’s Branch office at Japan. Accordingly, the revenues for Fiscal 2017 has reduced to Rs. 932.28 lakhs as compared to Rs 2871.55 lacs In Fiscal 2016 with profit before tax of Rs. 22.06 lacs in Fiscal 2017 as compared to a loss of Rs 19.23 lacs in Fiscal 2016.
German Subsidiary
Certain orders were executed in steam & Hydro segment during the Fiscal 2017 resulting in a revenue of Rs. 167.77 lakhs as compared to Rs 1.19 lacs in fiscal 2016. The loss for the Fiscal 2017 is Rs. 282.83 lakhs mainly due to fixed overheads.
The market in Europe is mainly in the hydro segment from European customers. The Steam generators market is improving gradually. TDPS Europe has is enhanced our market outreach in Europe improving access to European customers with potential to grow our order pipeline.
Internal Financial Control
The Company has designed and implemented a process driven framework for Internal Financial Controls (“IFC”) within the meaning of the explanation to Section 134(5)(e) of the Companies Act, 2013. For the year ended March 31, 2017, the Board is of the opinion that the Company has sound IFC commensurate with the nature and size of its business operations and operating effectively and no material weakness exists. The Company has a process in place to continuously monitor the same and identify gaps, if any, and implement new and/or improved controls wherever the effect of such gaps would have a material effect on the Company’s operations.
Directors’ Responsibility Statement
Pursuant to clause (c) of sub section (3) of section 134 of the Companies Act, 2013, with respect to the Directors’ Responsibility Statement, it is hereby confirmed that
a. In the preparation of the annual accounts for the financial year ended March 31, 2017, the applicable accounting standards have been followed along with proper explanation relating to material departures;
b. The directors have selected such accounting policies and applied them consistently and made judgments and estimates that are reasonable and prudent so as to give a true and fair view of the state of affairs of the Company at the end of the financial year and of the profit and loss of the Company for that period;
c. The directors have taken proper and sufficient care for the maintenance of adequate accounting records in accordance with the provisions of this Act for
safeguarding the assets of the Company and for preventing and detecting fraud and other irregularities;
d. The directors have prepared the annual accounts on a going concern basis;
e. The directors, have laid down internal financial controls to be followed by the Company and that such internal financial controls are adequate and were operating effectively; and
f. The directors have devised proper systems to ensure compliance with the provisions of all applicable laws and that such systems were adequate and operating effectively.
Board of Directors’ & Key Managerial Personnel
Board of Directors (“The Board”)
As per the provisions of the Companies Act, 2013, Mr. Mohib N Khericha retires at the ensuing Annual General Meeting and being eligible seeks re-appointment. The Board recommends his re-appointment.
Mr. K G Prabhakar (DIN 07187463) who was appointed as whole time Director of the company for a term of three years up to June 28, 2018 is proposed to be reappointed for a further term of 3 years subject to approval of the shareholders of the Company at the ensuing AGM of the company.
A brief resume and other details of Mr. Mohib N Khericha and Mr. K G Prabhakar as required under the Listing Regulations, Companies Act, 2013 and Secretarial Standard are provided form part of Corporate Governance Report/ Notice of 18th AGM.
Key Managerial personnel
The services of Mr. N Srivatsa as Company Secretary and Compliance Officer has been extended for 4 years with effect from February 19, 2017. Consequent to the re appointment of Mr. N Srivatsa as Company Secretary and Compliance Officer, he has been appointed as Key Managerial Personnel (KMP) pursuant to the provisions of Section 203 of the Companies Act, 2013 and Rules thereunder, effective February 19, 2017 for 4 years.
Mr. Nikhil Kumar, Managing Director, Mr. K. G. Prabhakar, Chief Financial Officer and Mr. N. Srivatsa, Company Secretary are Key Managerial Personnel of the Company as per the provisions of the Companies Act, 2013 and Rules thereunder.
Risk Management Policy
Pursuant to Section 134 (n) of the Companies Act, 2013 and Regulation 21 of SEBI (Listing Obligations and Disclosure

TD Power Systems Limited
6
Directors’ Report (contd.)
Nature of Transaction
Date of Board Resolution/
Date of Transaction
Name of the person to whom it is made
Amount
Loan 06/08/2015/ 05/12/2016
TD Power Systems (USA) Inc.
USD 1,00, 000
Investment 03/02/2016 / 02/08/2016
TD Power Systems Europe GmbH
Euro 75,000
Investment 03/02/2016 / 03/02/2017
TD Power Systems Europe GmbH
Euro 100,000
Your Company has formulated a policy on related party transactions which is also available on Company’s website at www.tdps.co.in. Particulars of contracts or arrangements with related parties referred to in Section 188(1) of the Companies Act, 2013, in the prescribed Form AOC-2, is appended as Annexure 3 the Boards’ Report.
Particulars of employees
The ratio of the remuneration of each whole- time Director and Key Managerial Personnel (KMP) to the median of employees’ remuneration as per section in accordance with the provisions of Section 197(12) of the Companies
Requirements) Regulations, 2015, a Risk Management committee of the Board of directors of the Company has been constituted. The details of the committee and its terms of reference are set out in the corporate governance report forming part of this report. While the Company has identified certain major risks and initiated appropriate measures to mitigate the said risks, a process to enhance the risk management framework is underway.
Audit Report
• The Auditors’ report for the fiscal 2017 does not contain any qualification, reservation or adverse remark. The Auditors’ Report is enclosed with the financial statements in this Annual Report.
• The Secretarial Auditors’ report for the fiscal 2017 does not contain any qualification, reservation or adverse remark. The Secretarial Auditors’ Report is enclosed Annexure 8 to the Board Report in this Annual Report.
• As provided in the Listing Regulations/LODR the certificate on corporate governance is enclosed to the Board’s report. The said report does not contain any qualification, reservation or adverse remark.
Auditors
Statutory Auditors
The current statutory Auditors BK Ramadhyani & Co. LLP, Chartered Accountants retire at the ensuing AGM & are not eligible for reappointment due to mandatory rotation in terms of Section 139 of Companies Act 2013. Accordingly, the audit committee of the board has recommended the appointment of M/s. Varma & Varma, Chartered Accountants, Bangalore (Firm Registration No. 004532S) (Varma and Varma) as the statutory auditors of the company for a period of five consecutive years from the conclusion of the Eighteen Annual General Meeting of the company till the conclusion of 23rd Annual General Meeting subject to the approval of the shareholders of the company.
Secretarial Auditor
As required under Section 204 of the Companies Act, 2013 and Rules thereunder, the Board has appointed Mr. Sudhir V Hulyalkar, Practicing Company Secretary, Bangalore, as the Secretarial Auditor for the fiscal 2017.
Cost Auditor
In terms of Section 148 of the Companies Act, 2013 read with the Companies (Cost Records and Audit) Amendment Rules, 2014, M/s. Rao, Murthy & Associates, Cost Accountants, Bangalore have appointed as Cost Auditors of the Company for the Financial Year 2017-18.
Disclosure
Extract of the Annual Return
In accordance with Section 134(3) (a) of the Companies Act, 2013, an extract of the Annual Return in the prescribed format is appended as Annexure 1 to the Boards’ Report.
Number of Board Meetings
The Board met four times during the Fiscal 2016-17. The details of which are given in the Corporate Governance report that forms part of this Annual Report. The maximum gap between any two meetings did not exceed 120 days, as prescribed by the Companies Act, 2013.
Conservation of Energy, Research and Development, Technology Absorption, Foreign Exchange Earnings and Outgo
Information required under Section 134(3) (m) of the Companies Act, 2013 read with Rule 8 of the Companies (Accounts) Rules,2014 for the financial year ended 31st March 2017 in relation to the Conservation of Energy, Technology Absorption and Foreign Exchange Earnings and Outgo is given in the Annexure 4 forming an integral part of this Report.
Particulars of Loans, Guarantees or Investments
Loans, guarantees and investments covered under Section 186 of the Companies Act, 2013 also form part of the notes to the financial statements provided in this Annual Report:-

7
Directors’ Report (contd.)
Act, 2013, read with Rule 5 of the Companies (Appointment and Remuneration of Managerial Personnel) Rules, 2014, is appended as Annexure 5 to the Boards’ Report.
Additionally, the following details form part of Annexure 6 to the Boards’ report.
• Details of employees in receipt of a remuneration of Rs. 1.02 crore or more per year
• Statement containing the name of top 10 employees in terms of remuneration drawn
None of the employees is in receipt of a remuneration of Rs. 8.5 lakhs or more a month for part of the year.
None of the employees employed throughout the financial year or part thereof, was in receipt of remuneration in that year which, in the aggregate, or as the case may be, at a rate which, in the aggregate, is in excess of that drawn by the managing director or whole-time director or manager and holds by himself or along with his spouse and dependent children, not less than two percent of the equity shares of the company.
Committees of the Board
As on March 31, 2017, the Board had four Committees: the Audit committee, the Nomination and Remuneration committee, the Stakeholders Relationship committee and the Corporate Social Responsibility Committee. The detailed note on composition of the Board and its committees excluding Corporate Social Responsibility Committee is disclosed in the Report on Corporate Governance forming part of this report.
Corporate Social Responsibility Committee
In accordance with the requirements of Section 135 of Companies Act, 2013, your Company has a Corporate Social Responsibility Committee, which comprises Mr. Ravi Kanth Mantha, Chairman, Mr. Nitin Bagamane and Mr. Nikhil Kumar as members of the Committee. The terms of reference of the Corporate Social Responsibility Committee is provided in the Corporate Governance Report. Your Company’s Corporate Social Responsibility Policy (CSR Policy) is available on the website of the Company at www.tdps.co.in. Annual report on CSR activities as required under the Companies (Corporate Social Responsibility Policy) Rules, 2014 has been appended as Annexure 7 and forms an integral part of this Report.
General
Your Directors state as follows
1. No significant or material orders were passed by the Regulators or Courts or Tribunals impacting the going concern status and Company’s operations in future.
2. There was no issue of equity shares with differential rights, as to voting, dividend or otherwise.
3. There was no issue of shares including as sweat equity shares or employee stock options.
4. There were no deposits covered under Chapter V of the Companies Act, 2013.
5. No money has been provided by the company for purchase of its own shares by employees or by trustees for the benefit of employees.
6. No subsidiaries have paid remuneration to Managing Director
7. The Company has in place an Anti-Sexual Harassment Policy in line with the requirements of the Sexual Harassment of Women at the Workplace (Prevention, Prohibition & Redressal) Act, 2013. Internal Complaints Committee (ICC) has been set up to redress complaints received regarding sexual harassment. During the year under review there were no cases filed pursuant to the Sexual Harassment of Women at the Workplace (Prevention, Prohibition & Redressal) Act, 2013.
Green Initiative
Electronic copies of the Annual Report 2016-17 and the Notice of the 18th Annual General Meeting are sent to all members whose email addresses are registered with the Company/Depository Participants. For members who have not registered their email addresses, physical copies are sent in the permitted mode.
Acknowledgement
Your Directors place on record their appreciation of the contribution and support of the employees at all levels. They also place on record their appreciation of the continued support and faith extended during the year by the Company’s customers, suppliers, bankers and shareholders.
For and on behalf of the Board of Directors
Mohib N. KherichaChairman
Bangalore May 18, 2017

TD Power Systems Limited
8
Extract of Annual Return As on the Financial Year ended on 31.03.2017
[Pursuant to Section 92(3) of the Companies Act, 2013 and Rule 12(1) of the Companies Management and Administration) Rules, 2014].
II. PRINCIPAL BUSINESS ACTIVITIES OF THE COMPANY
i. CIN L31103KA1999PLC025071
ii. Registration Date 16/04/1999
iii. Name of the Company TD Power Systems Limited
iv. Category/ Sub Category of the Company Public Company (Limited by Shares)
v. Address of the Registered office and contact details # 27, 28 & 29, KIADB Industrial Area, Dabaspet Nelamangala Taluk, Bangalore - [email protected]: 080-2299 5700
vi. Whether listed Company Yes
vii. Name, Address and Contact details of Registrar and Transfer Agent
Link In time India Private LimitedC 101, 247 Park, L B S Marg, Vikhroli West, Mumbai 400 083 Tel No: +91 22 49186000
Sl. No.
Name and Description of main products / services NIC Code of theproduct / service
% to total turnover of the Company
1. Manufacture of AC Generators 31103 95
2. Manufacture of Electric Motors 31103 Nil
I. REGISTRATION AND OTHER DETAILS
Companies for which information is being filled - 4 (four)
III. PARTICULARS OF HOLDING, SUBSIDIARY AND ASSOCIATE COMPANIES
Sl. No.
Name of the Company CIN/GLN Holding/ Subsidiary/ Associate
% of shares held
ApplicableSection
1. DF Power Systems Private Limited U51505KA2007 PTC041717
Subsidiary-Indian 100% Section 2(87) (ii)
2. TD Power Systems (USA) Inc. NA Subsidiary-USA 100% Section 2(87) (ii)
3. TD Power Systems Japan Limited NA Subsidiary-Japan 100% Section 2(87) (ii)
4. TD Power Systems Europe GmbH NA Subsidiary-Germany 100% Section 2(87) (ii)
ANNEXURE - 1
FORM NO. MGT-9
ANNEXURE TO THE DIRECTORS’ REPORT

9
Annexure to the Directors’ Report (contd.)IV. SHAREHOLDING PATTERN (Equity Share Capital Breakup as percentage of Total Equity)
i. Category-wise Shareholding
Category of Shareholders Shareholding at the beginning of the
year (April 1, 2016)Shareholding at the end of the
year (March 31, 2017)
% Change during
year Demat Physical Total
% ofTotal
Shares Demat Physical Total
% ofTotal
SharesA. Shareholding of Promot-
er and Promoter Group
1. Indian
a. Individuals / HUF 6485524 0 6485524 19.5126 8369624 0 8369624 25.1812 5.6686
b. Central Government / State Government(s)
0
0
0
0.0000
0
0
0
0.0000
0.0000
c. Financial Institutions / Banks
0
0
0
0.0000
0
0
0
0.0000
0.0000
d. Any Other (Specify)
Persons Acting In Concert
3218352
0
3218352
9.6829
1334252
0
1334252
4.0143
-5.6686
Bodies Corporate 5026433 0 5026433 15.1227 5026433 0 5026433 15.1227 0.0000
Sub -Total (A) (1) 14730309 0 14730309 44.3182 14730309 0 14730309 44.3182 0.0000
2. Foreign
a.
Individuals (Non- Resident Individuals/Foreign Individuals)
3235254
0
3235254
9.7337
3235254
0
3235254
9.7337
0.0000
b. Government 0 0 0 0.0000 0 0 0 0.0000 0.0000
c. Institutions 0 0 0 0.0000 0 0 0 0.0000 0.0000
d. Foreign Portfolio Investor 0 0 0 0.0000 0 0 0 0.0000 0.0000
e. Any Other (Specify)
Sub -Total (A) (2) 3235254 0 3235254 9.7337 3235254 0 3235254 9.7337 0.0000
Total Shareholding of Promoter and Promoter Group (A) = (A)(1) + (A) (2)
17965563
0
17965563
54.0519
17965563
0
17965563
54.0519
0.0000
B. Public Shareholding
1. Institutions
a. Mutual Funds / UTI 6850257 0 6850257 20.6100 6737168 0 6737168 20.2697 -0.3403
b. Venture Capital Funds 0 0 0 0.0000 0 0 0 0.0000 0.0000
c. Alternate Investment Funds 0 0 0 0.0000 0 0 0 0.0000 0.0000
d. Foreign Venture Capital Investors 0 0 0 0.0000 0 0 0 0.0000 0.0000
e. Foreign Portfolio Investor 3733260 0 3733260 11.2320 1716795 0 1716795 5.1652 -6.0668
f. Financial Institutions / Banks 5612 0 5612 0.0169 10489 0 10489 0.0316 0.0147
g. Insurance Companies 0 0 0 0.0000 0 0 0 0.0000 0.0000
h. Provident Funds / Pension Funds 0 0 0 0.0000 0 0 0 0.0000 0.0000
i. Any Other (Specify)
Sub Total (B) (2) 10589129 0 10589129 31.8589 8464452 0 8464452 25.4665 -6.3924

TD Power Systems Limited
10
Annexure to the Directors’ Report (contd.)Shareholding Pattern (contd.)
Category of Shareholders Shareholding at the beginning of the year (April 1, 2016)
Shareholding at the end of the year (March 31, 2017)
% Change during
year Demat Physical Total
% ofTotal
Shares Demat Physical Total
% ofTotal
Shares2.
Central Government/ State Government(s)/ President of India
0
0
0
0
0
0
0
0
0
Sub Total (B)(2) 0 0 0 0 0 0 0 0 0
3. Non-Institutions
a. Individuals
i.
Individual share-holders holding nominal share capi-tal upto Rs. 1 lakh.
1190190
2
1190192
3.5809
2045705
2
2045707
6.1548
2.5739
Individual share-holders holding nominal share cap-ital in excess of Rs. 1 lakh
930012
0
930012
2.7981
1040469
0
1040469
3.1304
0.3323
b. NBFCs registered with RBI 0
0
0
0.0000
0
0
0
0.0000
0.0000
c. Employee Trusts 0 0 0 0.0000 0 0 0 0.0000 0.0000
d.
Overseas Depositories (holding DRs) (balancing figure)
0
0
0
0.0000
0
0
0
0.0000
0.0000
e. Any Other (Specify)
Hindu Undivided Family 58544 0 58544 0.1761 219633 0 219633 0.6608 0.4847
Foreign Companies 0 876270 876270 2.6364 876270 0 876270 2.6364 0.0000
Non Resident Indians (Non Repat) 17674 0 17674 0.0532 29706 0 29706 0.0894 0.0362
Non Resident Indians (Repat) 60288 0 60288 0.1814 270330 0 270330 0.8133 0.6319
Clearing Member 65426 0 65426 0.1968 518989 0 518989 1.5615 1.3647
Bodies Corporate 1484490 0 1484490 4.4663 1806469 0 1806469 5.4350 0.9687
Sub Total (B) (3) 3806624 876272 4682896 14.0892 6807571 2 6807573 20.4815 6.3924
Total Public Shareholding (B) = (B)(1) + (B)(2) + (B)(3) 14395753 876272 15272025 45.9481 15272023 2 15272025 45.9481 0.0000
Total (A)+(B) 32361316 876272 33237588 100.0000 33237586 2 33237588 100.0000 0.0000
c. Non Promoter -Non Public
1. Custodian/DR Holder 0 0 0 0.0000 0 0 0 0.0000 0.0000
2.
Employee Benefit Trust (under SEBI (Share based Employee Bene-fit) Regulations, 2014)
0
0
0
0.0000
0
0
0
0.0000
0.0000
Total (A) + (B) + (C) 32361316 876272 33237588 100.0000 33237586 2 33237588 100.0000

11
ii. Shareholding of Promoters
Sl.No.
Shareholder’s Name Shareholding at the beginningof the year (April 1, 2016)
Shareholding at the end of the year (March 31, 2017)
% change in the
shareholding during the
year
No of shares
held
% of the shares of the
company
% of shares pledged/
encumbered to total shares
No of shares
held
% of the shares of the
company
% of shares pledged/
encumbered to total shares
1. Saphire Finman Services LLP. 5026433 15.1227 0.0000 5026433 15.1227 0.0000 0.0000
2. Nikhil Kumar 4638664 13.9561 0.0000 4638664 13.9561 0.0000 0.0000
3. Hitoshi Matsuo 3235254 9.7337 0.0000 3235254 9.7337 0.0000 0.0000
4. Sofia M. Khericha 2084100 6.2703 0.0000 200000 0.6017 0.0000 -5.6686
5. Mohib N. Khericha 1846860 5.5565 0.0000 3730960 11.2251 0.0000 5.6686
6. Chartered Capital & Investment Ltd. 1134252 3.4126 0.0000 1134252 3.4126 0.0000 0.0000
Total 17965563 54.0519 0.0000 17965563 54.0519 0.0000 0.0000
iii. Change in Promoters’ Shareholding (please specify, if there is no change)
Sl.No.
Shareholder’s Name Shareholding at the beginningof the year (April 1, 2016)
Cumulative Shareholding during the year 2016-2017
1. Saphire Finman Services Private Limited
No. of shares % of total shares of the Company
No. of shares % of total shares of the Company
At the beginning ofthe year
5026433 15.12%
5026433
15.12%
Date wise Increase /Decrease in PromotersShareholding during the year specifying the reasons for increase/ decrease (e.g. allotment/transfer/bonus/sweat equity etc)
0
0
0
0
At the end of the year 5026433 15.12%
2. Nikhil Kumar
At the beginning ofthe year
4638664
13.96%
4638664
13.96%
Date wise Increase /Decrease in PromotersShareholding during the year specifying the reasons for increase / decrease (e.g. allotment / transfer / bonus/ sweat equity etc)
0
0
0
0
At the end of the year 4638664 13.96%
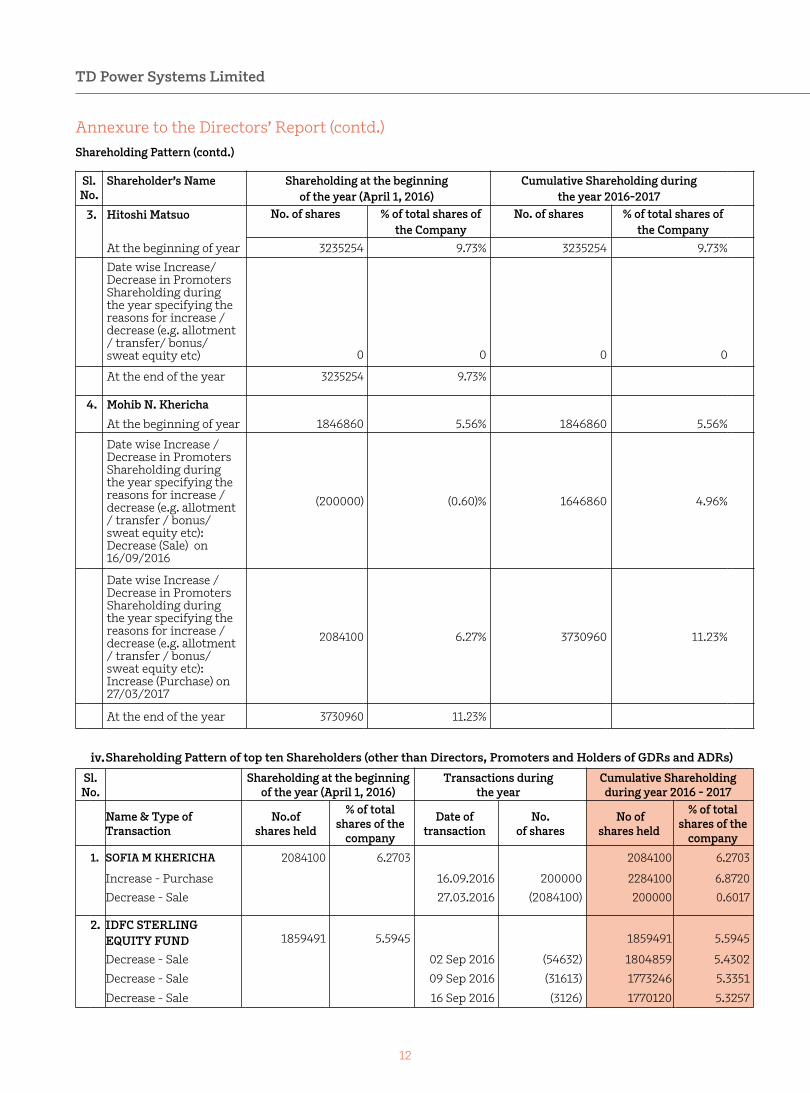
Annexure to the Directors’ Report (contd.)Shareholding Pattern (contd.)
TD Power Systems Limited
12
Sl.No.
Shareholder’s Name Shareholding at the beginningof the year (April 1, 2016)
Cumulative Shareholding during the year 2016-2017
3. Hitoshi Matsuo No. of shares % of total shares of the Company
No. of shares % of total shares of the Company
At the beginning of year 3235254 9.73% 3235254 9.73%
Date wise Increase/Decrease in PromotersShareholding during the year specifying the reasons for increase / decrease (e.g. allotment / transfer/ bonus/ sweat equity etc) 0 0 0 0
At the end of the year 3235254 9.73%
4. Mohib N. Khericha
At the beginning of year 1846860 5.56% 1846860 5.56%
Date wise Increase /Decrease in Promoters Shareholding during the year specifying the reasons for increase / decrease (e.g. allotment / transfer / bonus/ sweat equity etc): Decrease (Sale) on 16/09/2016
(200000) (0.60)% 1646860 4.96%
Date wise Increase /Decrease in Promoters Shareholding during the year specifying the reasons for increase / decrease (e.g. allotment / transfer / bonus/ sweat equity etc):Increase (Purchase) on 27/03/2017
2084100 6.27% 3730960 11.23%
At the end of the year 3730960 11.23%
iv.Shareholding Pattern of top ten Shareholders (other than Directors, Promoters and Holders of GDRs and ADRs)
Sl.No.
Shareholding at the beginning of the year (April 1, 2016)
Transactions during the year
Cumulative Shareholding during year 2016 - 2017
Name & Type of Transaction
No.of shares held
% of total shares of the
company
Date of transaction
No. of shares
No of shares held
% of total shares of the
company
1. SOFIA M KHERICHA 2084100 6.2703 2084100 6.2703
Increase - Purchase 16.09.2016 200000 2284100 6.8720
Decrease - Sale 27.03.2016 (2084100) 200000 0.6017
2. IDFC STERLING EQUITY FUND
1859491
5.5945
1859491
5.5945
Decrease - Sale 02 Sep 2016 (54632) 1804859 5.4302
Decrease - Sale 09 Sep 2016 (31613) 1773246 5.3351
Decrease - Sale 16 Sep 2016 (3126) 1770120 5.3257
Annexure to the Directors’ Report (contd.)Shareholding Pattern (contd.)

13
Sl.No.
Shareholding at the beginning of the year (April 1, 2016)
Transactions during the year
Cumulative Shareholding during year 2016 - 2017
Name & Type of Transaction
No.of shares held
% of total shares of the
company
Date of transaction
No. of shares
No of shares held
% of total shares of the
company
Decrease - Sale 23 Sep 2016 (19882) 1750238 5.2658
Decrease - Sale 30 Sep 2016 (499) 1749739 5.2643
Decrease - Sale 07 Oct 2016 (7754) 1741985 5.2410
Decrease - Sale 14 Oct 2016 (8566) 1733419 5.2152
Decrease - Sale 21 Oct 2016 (121767) 1611652 4.8489
Decrease - Sale 04 Nov 2016 (2415) 1609237 4.8416
Decrease - Sale 11 Nov 2016 (17889) 1591348 4.7878
Decrease - Sale 02 Dec 2016 (25089) 1566259 4.7123
Decrease - Sale 13 Jan 2017 (40347) 1525912 4.5909
Decrease - Sale 20 Jan 2017 (1474) 1524438 4.5865
Decrease - Sale 03 Feb 2017 (27876) 1496562 4.5026
Decrease - Sale 17 Feb 2017 (24766) 1471796 4.4281
Decrease - Sale 03 Mar 2017 (7861) 1463935 4.4045
Increase - Purchase 17 Mar 2017 33118 1497053 4.5041
Increase - Purchase 24 Mar 2017 24546 1521599 4.5779
Decrease - Sale 31 Mar 2017 (23579) 1498020 4.5070
At the end of the year 1498020 4.5070
3.
Sundaram Mutual Fund A/C Sundaram Smile Fund
1286426
3.8704
1286426
3.8704
Increase - Purchase 20 May 2016 1000 1287426 3.8734Increase - Purchase 24 Jun 2016 10000 1297426 3.9035Increase - Purchase 22 Jul 2016 6608 1304034 3.9234Increase - Purchase 29 Jul 2016 4270 1308304 3.9362Decrease - Sale 05 Aug 2016 (175000) 1133304 3.4097Increase - Purchase 17 Mar 2017 15436 1148740 3.4561
Increase - Purchase 24 Mar 2017 50369 1199109 3.6077
Increase - Purchase 31 Mar 2017 45000 1244109 3.7431
At the end of the year 1244109 3.7431Increase - Purchase
4. ICICI Prudential 1230266 3.7014 1230266 3.7014AT THE END OF THE YEAR
5. India Value Fund IV 1218971 3.6674 1218971 3.6674
6.
Reliance Capital Trustee Co. Ltd-A/C Reliancesmall Cap Fund
1140126
3.4302
1140126
3.4302Increase - Purchase 21 Oct 2016 686747 1826873 5.4964
Increase - Purchase 13 Jan 2017 50000 1876873 5.6468
At the end of the year 1876873 5.6468
Annexure to the Directors’ Report (contd.)Shareholding Pattern (contd.)

TD Power Systems Limited
14
Sl.No.
Shareholding at the beginning of the year (April 1, 2016)
Transactions during the year
Cumulative Shareholding during year 2016 - 2017
Name & Type of Transaction
No.of shares held
% of total shares of the
company
Date of transaction
No. of shares
No of shares held
% of total shares of the
company
7. Chartered Capital & Investments Ltd
1134252
3.4126
1134252
3.4126
At the end of the year 1134252 3.4126
8. Smallcap World Fund, Inc 1009087 3.0360 1009087 3.0360
Decrease - Sale 10 Feb 2017 (3578) 1005509 3.0252
Decrease - Sale 17 Feb 2017 (87951) 917558 2.7606
Decrease - Sale 24 Feb 2017 (24973) 892585 2.6855
Decrease - Sale 10 Mar 2017 (153450) 739135 2.2238
Decrease - Sale 17 Mar 2017 (349113) 390022 1.1734
Decrease - Sale 24 Mar 2017 (175130) 214892 0.6465
Decrease - Sale 31 Mar 2017 (214892) 0 0.0000
At the end of the year 0 0.0000
9.
L and T Mutual Fund Trustee Ltd- L and T Equity Fund
919568
2.7667
919568
2.7667Decrease - Sale 08 Apr 2016 (9026) 910542 2.7395
Decrease - Sale 15 Apr 2016 (34108) 876434 2.6369
Decrease - Sale 22 Apr 2016 (40908) 835526 2.5138
Decrease - Sale 29 Apr 2016 (27853) 807673 2.4300
Decrease - Sale 13 May 2016 (64252) 743421 2.2367
Decrease - Sale 20 May 2016 (16958) 726463 2.1857
Decrease - Sale 27 May 2016 (155850) 570613 1.7168
Decrease - Sale 03 Jun 2016 (55847) 514766 1.5487
Decrease - Sale 10 Jun 2016 (13313) 501453 1.5087
Decrease - Sale 17 Jun 2016 (24210) 477243 1.4359
Decrease - Sale 24 Jun 2016 (24808) 452435 1.3612
Decrease - Sale 05 Aug 2016 (14567) 437868 1.3174
Decrease - Sale 12 Aug 2016 (6232) 431636 1.2986
Decrease - Sale 26 Aug 2016 (507) 431129 1.2971
Decrease - Sale 02 Sep 2016 (120378) 310751 0.9349
Decrease - Sale 09 Sep 2016 (18781) 291970 0.8784
Decrease - Sale 16 Sep 2016 (22162) 269808 0.8118
Decrease - Sale 23 Sep 2016 (7483) 262325 0.7892
Decrease - Sale 09 Dec 2016 (18194) 244131 0.7345
Decrease - Sale 16 Dec 2016 (12093) 232038 0.6981
Decrease - Sale 23 Dec 2016 (30115) 201923 0.6075
Decrease - Sale 30 Dec 2016 (20) 201903 0.6075
Decrease - Sale 06 Jan 2017 (12708) 189195 0.5692
Decrease - Sale 13 Jan 2017 (40000) 149195 0.4489
Decrease - Sale 20 Jan 2017 (11976) 137219 0.4128
Annexure to the Directors’ Report (contd.)Shareholding Pattern (contd.)

15
Sl.No.
Shareholding at the beginning of the year - 2016
Transactions during the year
Cumulative Shareholding at the end of the year - 2017
Name & Type of Transaction
No.of shares held
% of total shares of the
company
Date of transaction
No. of shares
No of shares held
% of total shares of the
company
Decrease - Sale 03 Feb 2017 (37219) 100000 0.3009Decrease - Sale 10 Feb 2017 (100000) 0 0.0000At the end of the year 0 0.0000
10. Toyo Denki Seizo KK 876270 2.6364 876270 2.6364
At the end of the year 876270 2.6364
11.
Baring India Private Equity Fund III Listed Investments Limited
805778
2.4243
805778
2.4243
At the end of the year 773850 2.3282
12.
Ontario Teachers’ Pension Plan Board Managed by Arohi Asset Management Pte Ltd-Np9q
773850
2.3282
773850
2.3282
Decrease - Sale 21 Oct 2016 (348000) 425850 1.2812
Decrease - Sale 17 Mar 2017 (36893) 388957 1.1702
At the end of the year 388957 1.1702
Note: 1. Paid up Share Capital of the Company (Face Value Rs. 10.00) at the end of the year is 33237588 Shares. 2. The details of holding has been clubbed based on PAN. 3. % of total Shares of the Company is based on the paid up Capital of the Company at the end of the Year.
Annexure to the Directors’ Report (contd.)Shareholding Pattern (contd.)
v. Shareholding of Directors and Key Managerial Personnel:
Sl.No.
Shareholder’s Name Shareholding at the beginningof the year (April 1, 2016)
Cumulative Shareholding During year 2016-2017
1. Nikhil Kumar No. of shares % of total shares of the Company
No. of shares % of total shares of the
CompanyAt the beginning of year 4638664 13.96% 4638664 13.96%
Date wise Increase/Decrease in Sharehold-ing during the year specifying the reasons for increase/decrease (e.g. allotment/transfer/ bonus/sweat equity etc)
0
0
0
0
At the end of the year 4638664 13.96%

TD Power Systems Limited
16
Sl.No.
Shareholder’s Name Shareholding at the beginningof the year (April 1, 2016)
Cumulative Shareholding During year 2016-2017
2.
Mohib N. Khericha
No. of shares % of total shares of the Company
No. of shares % of total shares of the
Company
At the beginning of year 1846860 5.56% 1846860 5.56%
Date wise Increase /Decrease in Sharehold-ing during the year specifying the reasons for increase / decrease (e.g. allotment / transfer / bonus / sweat equity etc): Decrease – Sale 16.09.2016
(200000)
(0.60)%
1646860
4.96%
Date wise Increase /Decrease in Sharehold-ing during the year specifying the reasons for increase / decrease (e.g. allotment / transfer / bonus / sweat equity etc): Increase –Purchase March 27,2017
2084100
6.27%
3730960
11.23%
At the end of the year 3730960 11.23%
3. Nithin BagamaneAt the beginning of year 0 0 0 0
Date wise Increase /Decrease in Sharehold-ing during the year specifying the reasons for increase / decrease (e.g. allotment / transfer / bonus / sweat equity etc):
0
0
0
0
At the end of the year 0 0
4. Arjun Kalyanpur
At the beginning of year 0 0 0 0
Date wise Increase /Decrease in Sharehold-ing during the year specifying the reasons for increase/decrease (e.g. allotment/transfer / bonus/sweat equity etc):
0 0 0 0
At the end of the year 0 0
Annexure to the Directors’ Report (contd.)Shareholding Pattern (contd.)

17
Sl.No.
Shareholder’s Name Shareholding at the beginningof the year (April 1, 2016)
Cumulative Shareholding During year 2016-2017
5. Nandita Lakshmanan No. of shares % of total shares of the Company
No. of shares % of total shares of the
Company
At the beginning of year 0 0 0 0
Date wise Increase /Decrease in Sharehold-ing during the year specifying the reasons for increase/decrease (e.g. allotment/transfer / bonus/sweat equity etc):
0 0 0 0
At the end of the year 0 0
6. Ravi Kanth ManthaAt the beginning of year 0 0 0 0
Date wise Increase /Decrease in Sharehold-ing during the year specifying the reasons for increase/decrease (e.g. allotment/transfer / bonus/sweat equity etc):
0 0 0 0
At the end of the year 0 0
7. K G Prabhakar 4500 0.01% 4500 0.01%At the beginning of year 0 0 0 0
Date wise Increase /Decrease in Sharehold-ing during the year specifying the reasons for increase/decrease (e.g. allotment/transfer / bonus/sweat equity etc):
0 0 0 0
At the end of the year 4500 0.01%
6. N. SrivatsaAt the beginning of year 75 0.00% 75 0.00%
Date wise Increase /Decrease in Sharehold-ing during the year specifying the reasons for increase/decrease (e.g. allotment/transfer / bonus/sweat equity etc):
0 0 0 0
At the end of the year 75 0.00%
Annexure to the Directors’ Report (contd.)Shareholding Pattern (contd.)

TD Power Systems Limited
18
V. INDEBTEDNESS
Indebtedness of the Company including interest outstanding/accrued but not due for payment
Sl. No.
Particulars Secured Loansexcluding deposits (Rs.)
Unsecured Loans (Rs.)
Deposits (Rs.) Total Indebtedness (Rs.)
A.
Indebtedness at the beginning of the financial year (01.04.2016)i Principal Amount 276415453 - - 276415453ii Interest due but not paid** - - - -
iii Interest accrued but not due** - - - -
Total (i+ii+iii) 276415453 - - 276415453
B. Change in Indebtedness during the financial year
i Addition 177,012,549 - - 177,012,549
ii Reduction - - - -
Net Change 177,012,549 - - 177,012,549
C. Indebtedness at the endof the financial year (31.03.2017)
i Principal Amount 453,428,002 - - 453,428,002
ii Interest due but not paid** - - - -
iii Interest accrued but not due** - - - -
Total (i+ii+iii) 453,428,002 - - 453,428,002
** Since indebtedness is in respect of a working capital facility, Interest for the period is paid at the end of the period. Thus, neither “Interest due but not paid” nor “Interest accrued but not due” arise.
VI. REMUNERATION OF DIRECTORS AND KEY MANAGERIAL PERSONNEL
A. Remuneration to Managing Director, Whole-time Director and/or Manager:
Sl. No.
Particulars of Remuneration
Nikhil Kumar Managing Director
(Amount in Rs.)
K G Prabhakar Director & CFO (Amount in Rs.)
Total (Rs.)
1. Gross salary 25,20,000.00 55,85,103.00 81,05,103.00
a. Salary as per provisions contained in section 17(1) of the Income-tax Act, 1961
Nil Nil
b. Value of perquisites u/s 17(2) of the Income-tax Act, 1961
Nil
Nil
c. Profits in lieu of salary under section 17(3) Income-tax Act, 1961
Nil
Nil
2. Stock Option Nil Nil
3. Sweat Equity Nil Nil
4.
Commission - as % of profit - others, specify
Nil
Nil
5. Others, please specify Nil Nil
Total (A) 25,20,000.00 55,85,103.00 81,05,103.00
Ceiling as per the Act Inadequate profits
Annexure to the Directors’ Report (contd.)

19
B. Remuneration to other directorsSl. No.
Particulars of RemunerationName of Directors Total
(Rs.)Nitin
Bagamane (Rs.)
Arjun Kalyanpur
(Rs.)
Nandita Lakshmanan
(Rs.)
Ravi Kanth Mantha
(Rs.)1. Independent Directors Fee for
attending board /committee meetings Commission Others, please specify
1,80,000 - -
1,60,000 - -
1,20,000 - -
1,40,000 - -
6,00,000 - -
Mohib N. Khericha (Rs.)
2. Other Non-Executive Directors Fee for attending board / committee meetings Commission Others, please specify
200,000
--
200,000
--
Total (B) 8,00,000
Overall Ceiling as per the Act NA
Total Managerial Remuneration (A+B)
89,05,103.00
C. Remuneration to Key Managerial Personnel other than MD/Manager/WTD
Sl. No.
Particulars of Remuneration
Key Managerial PersonnelCompany Secretary
N. Srivatsa (Amount in Rs. p.a.)
Chief Finance Officer K. G. Prabhakar
(Amount in Rs. p.a.)1. Gross salary
a. Salary as per provisions contained in section 17(1) of the Income-tax Act, 1961
46,79,561.00
55,85,103.00
b. Value of perquisites u/s 17(2) Income-tax Act, 1961 - -
c. Profits in lieu of salary under section 17(3) Income-tax Act, 1961 - -
2. Stock Option - -
3. Sweat Equity - -
4. Commission - as % of profit - others, specify…
--
--
5. Others, please specify - -
Total 46,79,561.00 55,85,103.00
Annexure to the Directors’ Report (contd.)
VII. PENALTIES / PUNISHMENT/ COMPOUNDING OF OFFENCESCompany / Directors/ Other Officers in Default
Section of theCompanies Act
Brief Description
Details of Penalty/ Punishment/ Compounding
fees imposed
Authority [RD/NCLT /COURT]
Appeal made,if any (give
Details)Penalty, Punishment & Compounding
Nil
Nil
Nil
Nil
Nil
Bangalore May 18, 2017
For and on behalf of the Board of Directors
Mohib N. Khericha Chairman
K. G. Prabhakar Director & CFO
N. Srivatsa Company Secretary
Nikhil Kumar Managing Director

TD Power Systems Limited
20
Annexure to the Directors’ Report (contd.)ANNEXURE – 2
FORM AOC – I
Statement containing the salient features of the Financial Statements of Subsidiaries / Associate Companies / Joint Ventures
[Pursuant to first proviso to Sub-section (3) of Section 129 of the Companies Act, 2013 read with Rule 5 of the Companies (Accounts) Rules, 2014]
Part “A”: Subsidiaries
Note 1. Names of subsidiaries which are yet to commence operations & liquidated or sold during the year: Nil
Name of the Subsidiary DF Power Systems Pvt. Ltd.
TD Power Systems (USA) Inc.
TD Power Systems Japan Ltd.
TD Power Systems Europe GmbH
The date since when subsidiary was acquired
22/09/2008
20/02/2013
19/03/2013
13/01/2016
Reporting period for the subsidiary concerned, if different from the holding company’s reporting period
NA
NA
NA
NA
Reporting Currency and Exchange rate as on the last date of the relevant Financial year in the case of foreign subsidiaries
INR
USD
JPY
EURO
Share Capital 600 482 122 261Reserves and Surplus (73) (957) 247 (311)
Total Assets 5,280 1,933 518 80
Total Liabilities 5,280 1,933 518 80
Investments 0 0 0 0
Turnover 172 1,862 814 162
Profit/(Loss) before taxation (113) (71) 22 (283)
Provision for taxation (5) 0 18 0
Profit/(Loss) after taxation (108) (71) 4 (283)
Proposed Dividend Nil Nil Nil Nil
Extent of shareholding (in percentage)
100
100
100
100
Part “B”: Associates and Joint Ventures - The Company has no Associates and Joint Ventures and thus details related thereto do not arise.
Bangalore May 18, 2017
For and on behalf of the Board of Directors
Mohib N. Khericha Chairman
K. G. Prabhakar Director & CFO
Nikhil Kumar Managing Director
N. Srivatsa Company Secretary

21
ANNEXURE – 3
FORM AOC – II
(Pursuant to clause (h) of sub-section (3) of section 134 of the Companies Act, 2013 and Rule 8(2) of the Companies (Accounts) Rules, 2014).
Details of contracts or arrangements or transactions not at arm’s length basis:
Details of material contracts or arrangement or transactions at arm’s length basis for the year ended March 31, 2017 as follows:
Annexure to the Directors’ Report (contd.)
For and on behalf of the Board of Directors
Mohib N. Khericha Chairman
K. G. Prabhakar Director & CFO
Nikhil Kumar Managing Director
N. Srivatsa Company Secretary
Bangalore May 18, 2017
a.
Name(s) of the related party and nature of relationship
TD Power Systems (USA) Inc. TD Power Systems Japan Ltd. TD Power Systems Europe GmbH
b. Nature of contracts/arrangements/ transactions
Sale and purchase transactions Sale and purchase transactions Sale and purchase transactions
c. Duration of the con-tracts arrangements /transactions
February 02, 2017 to March 31, 2017
February 02, 2017 to March 31, 2017
February 02, 2017 to March 31, 2017
d. Salient terms of the contracts or arrangements or transactions includ-ing the value, if any:
Payment terms: not exceeding 180 days
Advance against PO-Back to back basis with subsidiary company terms.
Advance /Performance guarantee-Back to back with subsidiary company terms.
Rs.1827.61 lakhs
Payment terms: not exceeding 180 days
Advance against PO-Back to back basis with subsidiary company terms.
Advance/Performance guarantee -Back to back with subsidiary company terms.
Nil
Payment terms: not exceeding 180 days
Advance against PO-Back to back basis with subsidiary company terms.
Advance /Performance guarantee-Back to back with subsidiary company terms.
Rs. 136.62 Lakhs
e. Date(s) of approval by the Board, if any
February 02, 2017 February 02, 2017 February 02, 2017
f. Amount paid as advances, if any:
Nil
Nil
Nil
a. Name(s) of the related party and nature of relationship
Mr. Sagir Khericha Ravindu Moters Private Limited
b. Nature of contracts/arrangements/ transactions
Extension of service up to October 31, 2016,
Purchase, Sale and service of cars
c. Duration of the contracts arrange-ments/transactions
1 month February 02, 2017 to March 31, 2017
d. Salient terms of the contracts or ar-rangements or transactions including the value, if any:
Remuneration of / Leave and other terms as per company policy/Designation -Business manager in ACG Unit
Rs. 75,000 Per month
Pricing & commercial terms as may be charged generally to the customers.
Rs. 10.23 Lakhs
e. Date(s) of approval by the Board, if any August 03, 2016 February 02, 2017
f. Amount paid as advances, if any: Nil Nil
TD Power Systems Limited
22
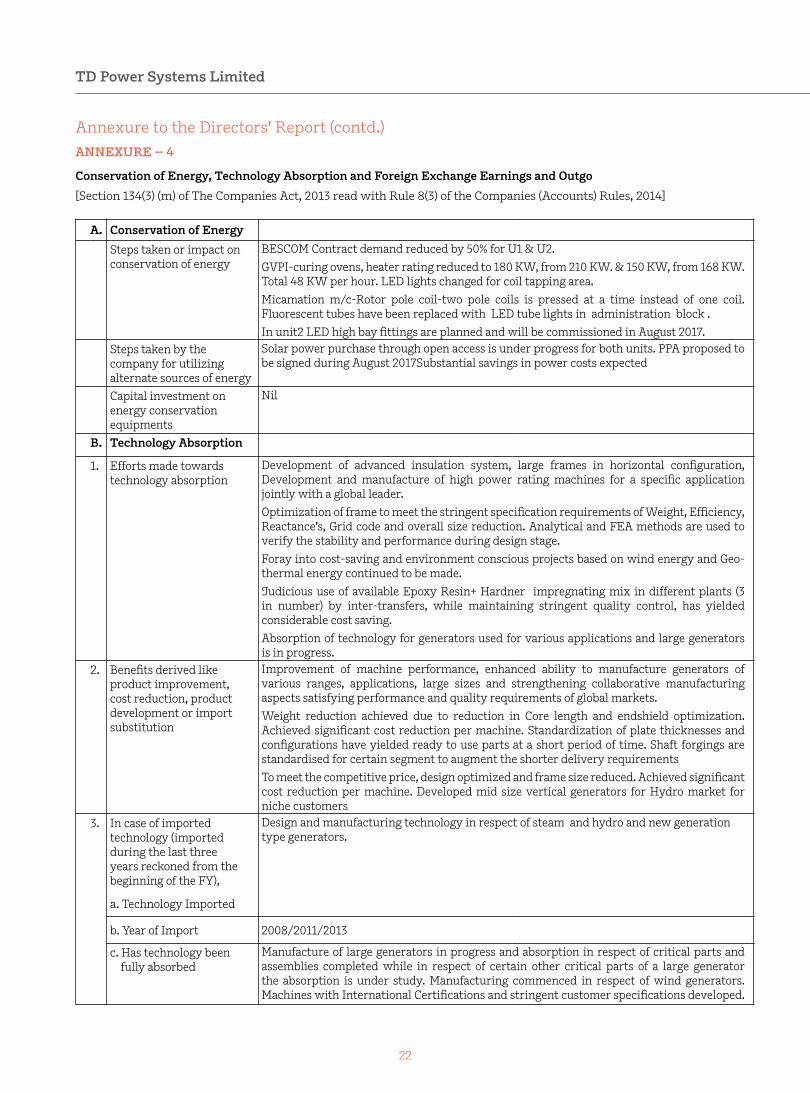
A. Conservation of Energy
Steps taken or impact on conservation of energy
BESCOM Contract demand reduced by 50% for U1 & U2.GVPI-curing ovens, heater rating reduced to 180 KW, from 210 KW. & 150 KW, from 168 KW. Total 48 KW per hour. LED lights changed for coil tapping area. Micamation m/c-Rotor pole coil-two pole coils is pressed at a time instead of one coil. Fluorescent tubes have been replaced with LED tube lights in administration block .In unit2 LED high bay fittings are planned and will be commissioned in August 2017.
Steps taken by the company for utilizing alternate sources of energy
Solar power purchase through open access is under progress for both units. PPA proposed to be signed during August 2017Substantial savings in power costs expected
Capital investment on energy conservation equipments
Nil
B. Technology Absorption
1. Efforts made towards technology absorption
Development of advanced insulation system, large frames in horizontal configuration, Development and manufacture of high power rating machines for a specific application jointly with a global leader. Optimization of frame to meet the stringent specification requirements of Weight, Efficiency, Reactance’s, Grid code and overall size reduction. Analytical and FEA methods are used to verify the stability and performance during design stage. Foray into cost-saving and environment conscious projects based on wind energy and Geo-thermal energy continued to be made.Judicious use of available Epoxy Resin+ Hardner impregnating mix in different plants (3 in number) by inter-transfers, while maintaining stringent quality control, has yielded considerable cost saving.Absorption of technology for generators used for various applications and large generators is in progress.
2. Benefits derived like product improvement, cost reduction, product development or import substitution
Improvement of machine performance, enhanced ability to manufacture generators of various ranges, applications, large sizes and strengthening collaborative manufacturing aspects satisfying performance and quality requirements of global markets.Weight reduction achieved due to reduction in Core length and endshield optimization. Achieved significant cost reduction per machine. Standardization of plate thicknesses and configurations have yielded ready to use parts at a short period of time. Shaft forgings are standardised for certain segment to augment the shorter delivery requirementsTo meet the competitive price, design optimized and frame size reduced. Achieved significant cost reduction per machine. Developed mid size vertical generators for Hydro market for niche customers
3.
In case of imported technology (imported during the last three years reckoned from the beginning of the FY),
Design and manufacturing technology in respect of steam and hydro and new generation type generators.
a. Technology Imported
b. Year of Import 2008/2011/2013
c. Has technology been fully absorbed
Manufacture of large generators in progress and absorption in respect of critical parts and assemblies completed while in respect of certain other critical parts of a large generator the absorption is under study. Manufacturing commenced in respect of wind generators. Machines with International Certifications and stringent customer specifications developed.
ANNEXURE – 4
Conservation of Energy, Technology Absorption and Foreign Exchange Earnings and Outgo
[Section 134(3) (m) of The Companies Act, 2013 read with Rule 8(3) of the Companies (Accounts) Rules, 2014]
Annexure to the Directors’ Report (contd.)

23
Annexure to the Directors’ Report (contd.)
d. If not fully absorbed, areas where this has not taken place, reasons thereof
The technology imported is being absorbed backed by training and development which is a gradual process due to high quality and precision requirements.
4. Expenditure incurred on Research and Development a. Capital b. Recurring c. Total d. Total R&D expenditure as a percentage of turnover
(Rs. in lakhs) - 624.84624.841.61%
c. Foreign Exchange Earnings and Outgo Rs. in LakhsEarnings in foreign Exchange [Value of Exports on FOB basis] 16,844.68Foreign Exchange outgo (Expenditure in foreign currency) 572.70
ANNEXURE - 5
Details of Ratio of Remuneration of Director [Section 197(12), of the Companies Act 2013, read with Rule 5 of Companies (Appointment and Remuneration of Managerial Personnel), Rules, 2014]
i.
The ratio of the remuneration of each director to the median remuneration of the employees of the Company for the financial year
Name of the Director Ratio to the Median
Mr. Nikhil Kumar - Managing Director
Mr. K. G. Prabhakar - Director & CFO
0.55
1.26
ii.
The percentage increase in remuneration of each director, Chief Financial Officer, Chief Executive Officer, Company Secretary or Manager, if any, in the financial year.
Name of the Director % Increase
Mr. Nikhil Kumar - Managing Director
Nil
Mr. K G Prabhakar - Director & CFO
8%
Mr. N Srivatsa -Company Secretary
8%
iii. The percentage increase in the median remuneration of employees in the financial year
33%
iv. The number of permanent employees on the rolls of Company
582
v.
Average percentile increase already made in the salaries of employees other than the managerial personnel in the last financial year and its comparison with the percentile increase in the managerial remuneration and justification thereof and point out if there are any exceptional circumstances for increase in the managerial remuneration
The Average percentile increase in the salaries of employees during 2016-17 was about 12%. The increase in managerial remuneration was lower than the said percentile increase.
vi. Affirmation that the remuneration is as per the remuneration policy of the company
Yes
Bangalore May 18, 2017
Bangalore May 18, 2017
For and on behalf of the Board of Directors
For and on behalf of the Board of Directors
Mohib N. Khericha Chairman
Mohib N. Khericha Chairman
K. G. Prabhakar Director & CFO
K. G. Prabhakar Director & CFO
N. Srivatsa Company Secretary
N. Srivatsa Company Secretary
Nikhil Kumar Managing Director
Nikhil Kumar Managing Director

TD Power Systems Limited
24
ANNEXURE – 6
Information in terms of Rule 5(2) of the Companies (Appointment and Remuneration of Managerial Personnel) Rules, 2014
A. There are no employees in receipt of a remuneration of Rs. 1.02 crore or more per annum.
B. The top 10 employees in terms of remuneration drawn are:
Annexure to the Directors’ Report (contd.)
Bangalore May 18, 2017
Sl. No
Name Designation Educational qualifications
Experience(in year)
Remuneration in fiscal 2017
(Rs. pa)
Previous employment and designating
1 K G Prabhakar Director & CFO FCA 35 yrs 55,85,103 Kirloskar Electric Company Limited
2 Manjunath S V COO MBA 35 Yrs 49,63,968 Kirloskar Electric Company Limited
3 Srivatsa N Co. Secretary FCS 35 Yrs 46,79,561 Kingfisher Airlines Limited
4 Prabhamani S Gen. Manager M. Tech 33 Yrs 37,74,968 Kirloskar Electric Company Limited
5 Vinay Hegde Sen. Manager BE 23 Yrs 36,49,239 Cummins Generator Technologies Limited
6 Ramakrishna Varna Head - SBU 2 BE, MBA 24 Yrs 34,10,586 Kirloskar Electric Company Limited
7 Udaya Kumar Head - SBU 1 BE, MBA 27 Yrs 32,45,546 DF Power Systems Private Limited
8 Ravishankar H R Sen. Manager BE 34 Yrs 32,42,213 Kirloskar Electric Company Limited
9 M N Varalakshmi Head - Corp. Finance
ICWA 24 Yrs 31,06,943 Kirloskar Electric Company Limited
10 Sridhar R P Head - Quality BE (Electrical) 20 Yrs 29,29,211 GE Global Sourcing India Pvt. Ltd.
For and on behalf of the Board of Directors
Mohib N. Khericha Chairman
K. G. Prabhakar Director & CFO
Nikhil Kumar Managing Director
N. Srivatsa Company Secretary
ANNEXURE – 7
Annual Report of Corporate Social Responsibility Activities (CSR) & CSR Policy[Pursuant to Section 135 of the Companies Act, 2013]
1. Composition of the CSR Committee In accordance with Section 135 of the Companies Act, 2013 and the Rules pertaining thereto, a committee of the Board known as ‘Corporate Social Responsibility Committee (CSR Committee)’ has been constituted comprising of the following members:
2. A brief outline of the company’s CSR policy, including overview of projects or programs proposed to be undertaken and a reference to the web-link to the CSR policy and projects or programme
The CSR Policy is to focus in areas such as Environment (Waste-to-energy processes, greening of the environment), Water (Revival of water bodies, groundwater recharge, storm water management, water supply) Sanitation (access to toilets for all, treatment of wastewater, reuse of treated water) and Solid Waste Management (Reduce, reuse, recycle) with a five year road map.
Name Category Description
Mr. Ravi Kanth Mantha Independent Director Chairman
Mr. Nitin Bagamane Independent Director Member
Mr. Nikhil Kumar Managing Director Member

25
Annexure to the Directors’ Report (contd.)
The CSR committee formulated this CSR policy and the proposed activities under the said policy are as specified by Schedule VII of the Companies Act, 2013. The Board of Directors of the Company, after taking into account the recommendations of the CSR Committee has approved this CSR Policy for the Company. As required under Section 135(4) of the Companies Act, 2013, this policy is uploaded on the Company’s website www.tdps.co.in
The CSR Policy believes that tangible and accelerated social benefit will be derived if the Company focuses its CSR activities in one geographical area / location and accordingly the CSR initiatives are being executed mostly in and around villages in Nelamangala taluk, Bangalore Rural District where the Company’s operations are situated currently.
In terms of the CSR policy, the CSR committee selected a project relating to integrated water & sanitation management in Tymagondalu Village, Nelamangala Tq, Bangalore Rural District as the CSR initiative of the Company.
A water body in a decrepit state has been restored during the year aiding augmentation of ground and surface water. Further, as a part of sanitation objectives activities such as garbage free village, decentralized STP and solid waste management programs has been initiated in two wards with related training and awareness campaign. A pilot project for the Solid Waste Management (SWM) program has been commenced with house to house
campaign. Micro level segregation of dry waste has also been commenced. Institutional Capacity Building, Solid waste management, Allocation of Land for Wet waste treatment, Recharge of Bore well, Construction of Community Toilet at Bus stand, development of Public Space etc., are the CSR activities undertaken for the financial year 2016-17.
Our CSR intervention engaged with key stakeholders of the village to get a buy-in on implementing a sustainable Integrated Water and Sanitation system for the village. A Project Support Unit (PSU) was created to interface with the institutions and citizens on the program.
3. Average net profit of the Company for last three financial years, as per Section 198 of Companies Act, 2013
The average net profit of the Company for the last three financial years is Rs. 7,329.59 lakhs.
4. Prescribed CSR expenditure (two per cent of the amount as in item 3 above)
Prescribed CSR expenditure is Rs. 146.59 lakhs (2% of Rs. 7,329.59 lakhs)
5. Details of CSR spent during the financial year
a. Total amount to be spent for the financial year: Rs. 146.59 lakhs
b. Amount unspent, if any: Rs. 29.32 lakhs
Sl.No.
CSR project or activity identified
Sector in which the project is covered
Projects orprograms1. Local area or other2. Specifythe state anddistrict whereprojects orprogramsundertaken
Amount outlay (budget) project or Programme wise
(Rs.)
Amount spent on the projects or programs 1. Direct expenditure 2. Overhead
(Rs.)
Cumulative expenditure up to the reporting period
(Rs.)
Amount spent direct or through implementing agency
1. Integrated water & Sanitation management
Health care,sanitation & safe drinking water (i) of Schedule VII
Local area of Tymagondalu in Nelamangala taluk, Bangalore Rural District
(Initialoutlay)146.59
114.27 114.27 Implementing agency
2. Akshaya Patra Eradicationof hunger andmalnutrition (i) of Schedule VII
Local area 3.00 3.00 Direct
(Rs. in lakhs) c. Manner in which the amount spent during the financial year

TD Power Systems Limited
26
Ravi Kanth Mantha Chairperson - CSR Committee
Nikhil Kumar Managing Director
Bangalore May 18, 2017
Annexure to the Directors’ Report (contd.)
ANNEXURE – 8
Form No. MR-3
SECRETARIAL AUDIT REPORT
FOR THE FINANCIAL YEAR ENDED ON MARCH 31, 2017 [Pursuant to Section 204(1) of the Companies Act, 2013 and Rule No. 9 of the Companies
(Appointment and Remuneration of Managerial Personnel) Rules, 2014]
The Members, TD Power Systems LimitedRegd. Office: # 27, 28 & 29, KIADB Industrial Area Dabaspet, Nelamangala Taluk, Bangalore-562111
I have conducted the secretarial audit of the compliance of applicable statutory provisions and the adherence to good corporate practices by TD POWER SYSTEMS LIMITED (hereinafter called the Company). Secretarial Audit was in a conducted manner that provided me a reasonable basis for evaluating the corporate conducts/ statutory compliances and expressing my opinion thereon.
Based on my verification of the Company‘s books, papers, minute books, forms and returns filed and other records maintained by the company and also the information provided by the Company, its officers, agents and authorized representatives during the conduct of secretarial audit, I hereby report that in my opinion, the company has, during the audit period covering the financial year ended on March 31, 2017, complied with the statutory provisions listed hereunder and also that the company has proper Board-processes and compliance-mechanism in place to the extent, in the manner and subject to the reporting made hereinafter:
I have examined the books, papers, minute books, forms and returns filed and other records maintained by TD Power Systems Limited (“the Company”) for the financial year ended on March 31, 2017 according to the provisions of:
i. The Companies Act, 2013 (the Act) and the rules made thereunder;
ii. The Securities Contracts (Regulation) Act, 1956 (‘SCRA’) and the rules made thereunder;
iii. The Depositories Act, 1996 and the Regulations and Bye-Laws framed thereunder;
iv. Foreign Exchange Management Act, 1999 and the rules and regulations made thereunder to the extent of Foreign Direct Investment and Overseas Direct Investment;
6. In case the Company has failed to spend the two per cent of the average net profit of the last three financial years or any part thereof, the Company shall provide the reasons for not spending the amount in its Board Report
A sum of Rs. 117.27 lakhs has been spent on the Integrated water & sanitation management (IWSM) Project as detailed above as of March 31, 2017. A sum of Rs. 29.32 lakhs relating to the allocation for the financial year 2016- 17 is yet to be spent. In a project of this nature, expenditure is incurred on achieving targeted milestones and related stakeholder initiative. Funds are released to implementing
agencies only when it is satisfied that the agreed target and the expected milestones will be met.
7. A responsibility statement of the CSR committee that the implementation and monitoring of CSR Policy, is in compliance with CSR objectives and policy of the Company.
The CSR committee confirms that the implementation and monitoring of the CSR policy, is in compliance with the CSR objectives and policy of the Company.

27
Annexure to the Directors’ Report (contd.)
v. The following Regulations and Guidelines prescribed under the Securities and Exchange Board of India Act, 1992 (‘SEBI’):
(a) The Securities and Exchange Board of India (Substantial Acquisition of Shares and Takeovers) Regulations, 2011; (b) The Securities and Exchange Board of India (Prohibition of Insider Trading) Regulations, 2015 (c) The Securities and Exchange Board of India (Issue of Capital and Disclosure Requirements) Regulations, 2009, (No instances for compliance requirements during the year); (d) The Securities and Exchange Board of India (Share Based Employee Benefits) Regulations, 2014, (No instances for compliance requirements during the year); (e) The Securities and Exchange Board of India (Issue and Listing of Debt Securities) Regulations, 2008, (No instances for compliance requirements during the year); (f) The Securities and Exchange Board of India (Registrars to an Issue and Share Transfer Agents) Regulations, 1993 regarding the Companies Act and dealing with client; (g) The Securities and Exchange Board of India (Delisting of Equity Shares) Regulations, 2009, (No instances for compliance requirements during the year); (h) The Securities and Exchange Board of India (Buyback of Securities) Regulations, 1998, (No instances for compliance requirements during the year); and (i) The Securities and Exchange Board of India (Listing Obligations and Disclosure Requirements) Regulations, 2015;vi. Legal Metrology Act, 2009;
vii. The Environment (Protection) Act, 1986;
viii. The Water (Prevention & Control o f Pollution) Act, 1974;
ix. The Air (Prevention & Control of Pollution) Act, 1981;
x. All other Labour, Employee and Industrial Laws to the extent applicable to the Company;
I have also examined compliance with the applicable clauses of Secretarial Standards issued by the Institute of Company Secretaries of India.
During the period under review the Company has complied with the provisions of the Act, Rules, Regulations, Guidelines, Standards, etc. mentioned above wherever applicable.
I further report that
The Board of Directors of the Company is duly constituted with proper balance of Executive Directors, Non-Executive Directors and Independent Directors. The changes in the composition of the Board of Directors that took place during the period under review were carried out in compliance with provisions of the Act.
Adequate notice is given to all Directors to schedule the Board meetings, agenda and detailed notes on agenda were sent at least seven days in advance, and a system exists for seeking and obtaining further information and clarifications on the agenda items before the meeting and for meaningful participation at the meeting.
The decisions carried through are recorded in the minutes. I did not find any dissenting views recorded in the minutes. It was informed to me that, in absence of any such dissenting views it was not required to record any such views in the minutes.
I further report that there are adequate systems and processes in the company commensurate with size and operations of the company to monitor and ensure compliance with applicable laws, rules, regulations and guidelines.
I further report that during the audit period there were no specific actions having major bearing on the Company’s affairs in pursuance of the above referred laws, rules, regulations, guidelines, standards, etc. referred to above.
Sudhir Vishnupant Hulyalkar Company Secretary in Practice
FCS No. 6040 C P No. : 6137
Bangalore May 18, 2017

TD Power Systems Limited
28
ANNEXURE – 9
Annexure to the Directors’ Report (contd.)
MANAGEMENT DISCUSSION AND ANALYSISIndia continued to be the fastest growing major economy in the world in fiscal 2017. However, Investments in the country’s core sectors continued to be depressed, as the private sector was constrained by debts and large non- performing assets (NPAs) continued to be a source of worry for the banks. Despite the best efforts by the government, both at central and state levels, demand remained tepid in the core sectors leading to lower capacity utilization in sectors like cement, steel, non-ferrous metal. Public sector capital expenditure was restricted to renewable energy, power transmission, highways and railways. Customers slowed down the speed of project execution as a result of demonetization impacting turnover and profitability.
The global scenario offered no cause for cheer as it continued to encounter challenges including volatility, Eurozone instability, depression in crude oil and commodity prices, currency depreciation/volatility in emerging markets and a continuing slowdown in China
Given the above scenario, the company continued to experience challenging circumstances in fiscal 2017 as the much awaited acceleration of investments & industrial growth did not gain the required speed. The capital goods industry continued to be rated as an underperformer due to lower capacity utilization and slowdown in user industries.
We continued to be one of the leading manufacturers of AC Generators for a diverse range of prime movers with output capacities ranging from 1 MW to 200 MW for steam and gas and up to 35 MW for hydro and up to 20 MW diesel and gas engines and customized rating for wind turbines, catering to both conventional and renewable fuel based power plants. As in the last two to three years the domestic market for generators continued to be sluggish in Fiscal 2017. Consistent compression in demand over the last three years intensified competition in the domestic markets consequently resulting in unrealistic pricing pressures. This led to large companies emerging as competitors, who used their deep pockets to start a price war in the market. The market was at best a “push market rather than a pull market” resulting in deferment of deliveries and an extended working capital cycle.
The manufacturing order inflow in Fiscal 2017 was Rs 35,518.36 lakhs as compared to Rs. 35,004.33 lakhs in Fiscal 2016. Domestic market contributed 27% in Fiscal 2017 & 43% in Fiscal 2016 and exports (including deemed exports) contributed 73% in Fiscal 2017 & 57% in Fiscal 2016 reflecting our continuing focus on overseas market. As of March 31, 2017 (Fiscal 2017) 3,342 generators with an aggregate output capacity of over 24,864 MW have been supplied to over 80 countries
Steam, Hydro& Gas application generators contributed 41%, 18% & 28% respectively of the revenue for Fiscal 2017. The contribution of Gas generators continued to increase in Fiscal 2017 over Fiscal 2016. As customary, a large part of generator sales take place through OEM’s, with top 10 customers contributing to 78% of Fiscal 2017 revenues. Our association with leading hydro & gas OEM’S is progressing well reflecting a good potential in these segment.
During Fiscal 2017, we added - new customers in steam, gas diesel and hydro segments. As a part of increasing our enlistment as preferred vendor, we have undergone audits by overseas OEMS for supply of wind, steam, gas & traction generators.
On standalone basis, Net sales from manufacturing business at Rs. 30,972.85 lakhs compared to Rs. 35,925.91 Lakhs in Fiscal 2016. Net sales of our manufacturing business contributed 79.80% and 75.74% of our Total Income in Fiscal 2017 and 2016.
Adverse domestic market conditions continue to be the constraining factor for growth in revenues in Fiscal 2017. However the company’s ability to diversify its product portfolio and its consistent focus on overseas markets has enabled the company to sustain revenues and partially offset the unprecedented fall in domestic market. Our overseas markets will continue to drive our exports both in the medium and long-term.
We also undertake overseas Turbine Generator island (TG Island) projects for steam turbine power plants with output capacity up to 55 MW using a Japanese turbine combined with our generator through our Japan branch. Net sales from our Project Business was Rs. 6,031.46 lakhs compared to Rs. 9,609.10 Lakhs in Fiscal 2016. This contributed 15.57% and 20.26% of our Total Income in Fiscal 2017 and 2016, respectively
The pending orders as of March 31, 2017 are Rs. 35,405.45 lakhs comprising of both manufacturing (Rs. 29,696.22 lakhs) and project business (Rs. 5,709.23 lakhs).
The performance of the EPC business and overseas subsidiaries is as stated in the Director’s Report.
On a standalone basis the Earnings Before interest, tax, depreciation & amortization (EBITDA) decreased by Rs. 1,764.27 lakhs or 35.20% to Rs. 3,247.46 Lakhs in Fiscal 2017 as compared to Rs. 5,011.73 Lakhs in Fiscal 2016. Profit before tax and extraordinary items decreased by Rs. 1,623.58 Lakhs or 95.92%, to Rs. 69.08 Lakhs in Fiscal 2017 from Rs. 1,692.66 Lakhs in Fiscal 2016. Profit after tax decreased by Rs. 1,488.98 Lakhs, or 99.41%, to Rs. 8.90 Lakhs in Fiscal 2017 from Rs. 1,497.88 Lakhs in Fiscal 2016.

29
Management Discussion and Analysis (contd.)
On a consolidated basis the, Net sales decreased by Rs. 12,684.22 Lakhs, or 25.03%, to Rs. 37,990.90 Lakhs in Fiscal 2017 from Rs. 50,675.12 Lakhs in Fiscal 2016, due to decrease in sales volume of Manufacturing, Projects & EPC Business. Loss before tax and extraordinary items decreased by Rs. 316.01 Lakhs, or 45.70%, to Rs. 375.54 Lakhs in Fiscal 2017 from Rs. 691.55 Lakhs in Fiscal 2016. Our Loss after tax decreased by Rs. 470.11 Lakhs, to Rs. 448.43 Lakhs in Fiscal 2017 from Rs. 918.54 Lakhs in Fiscal 2016.
Outlook
Steam, Hydro & Gas Engine generators will continue to drive revenues for Fiscal 2017. The pending orders for Fiscal 2018 is promising. The market for Steam generators is showing a gradual improvement with good pipeline of export orders. Orders from the US region, extension of an exclusivity arrangement with a MNC & a steady share of business from an Indian customer are expected to support the pipeline for steam generators. The company is working on supply of wind turbine generators to certain MNC turbine suppliers during the Fiscal 2018. The Company continues to pursue component business from the large generator segment.
The Company has received an order from a large European multinational company (MNC) in India for manufacture & supply of certain components (Product) of traction motors used in Electric Locomotives to be supplied to Indian Railways by the MNC. The total order value is about Rs 750 crores to be supplied over 10 years starting from 2018. The MNC will also provide the required technology for manufacture of the Product under License through its Affiliate Company. With this contract TDPS affirms its position as a growing market player in the traction equipment business.
Over the years, we have built a strong reference list of installations in Turkey. We are currently working on expanding this presence with a project to supply generators made in Turkey meeting certain local content requirements. This initiative has the potential to contribute significantly to both revenues and margins of the company during the next 3 years.
The domestic market conditions however, continue to be adverse with severe competition and pricing pressures. There has been no perceptible momentum in order conversions for supply of generators. We are approaching the domestic market cautiously and will pursue orders with sustainable prices. While we are well placed to capitalize on any upswing in domestic demand as well as overseas markets, Exports will continue to be our focus area in Fiscal 2017 given the tepid domestic market scenario.
While we hope that the domestic market recovers, we continue to focus on building our existing portfolio of generators for other applications. Though there is
uncertainty and continuing compression in the domestic market, we are hopeful of moderate growth in revenues and improvement in performance based on our export orders and other initiatives as stated above.
The Company continues to remain debt free & maintains a healthy cash position.
Risk Management and Mitigation
The Company’s business relates to manufacture and sale of generators falling under capital goods sector and is dependent on country’s economic growth, investment climate and business confidence as well as the sectors where in the Company’s products are used.
The focus on exports and ongoing association with leading global leaders has enabled the Company to reduce dependence on the domestic market and accordingly, percentage exports (including deemed exports) in turnover during the year stands at 73% of manufacturing revenues.
Some of the major risks being faced by the Company are described herein below
1. Economic slowdown and market concentration A conducive investment climate and interest rate regime, global economic and market conditions drive growth and performance of the industrial sector which forms the Company’s customer base. An economic slowdown directly impacts the demand for capital goods, including the products of the Company.
Further, over dependence on any market/s may adversely affect the performance of the Company, if the concerned market gets sluggish due to factors stated above. As stated earlier, in the last 3 years, due to the slow-down in the economic activities, the domestic market has declined/remained stagnant which had considerable effect on the demand of the Company’s products.
In order to reduce the over dependence on the domestic market, the Company focused on marketing its products in the global market and developed certain strategic partnerships and technology agreements. On the back of such initiatives, the contribution of exports to the total turnover has significantly grown. The Company is directing significant resources for extending its footprints in the global market to lessen the risk of over dependence on certain countries/ regions. We have consistently grown our export base, by adding new OEM’s within existing verticals, increase market share in existing verticals through better pricing, customization etc. and diversifying into/ introducing new product verticals.

TD Power Systems Limited
30
Management Discussion and Analysis (contd.)
2. Technology and Product concentration Steam turbine generators continue to be a major contributor of our standalone net sales year on year. Advanced technology relating to steam turbine generators or the development of steam turbine generators that prove superior in quality or effectiveness to our generator could affect our dominant market position in this segment.
The diverse product verticals catering to steam turbine generators, horizontal hydro generators, vertical hydro generators, diesel engine generators, wind turbine generators, gas engine generators, gas turbine generators, high voltage motors and generators for Geo Thermal and Solar thermal applications enables market presence across the spectrum of generator market in India and overseas and has reduced dependence on any particular industry or market segment. Even though Steam generators accounted for a significant portion of the revenues, the contribution of hydro, gas and other applications are consistently growing de risking the products mix
3. Technology Risk Response to and adoption of advanced technology and emerging power generation industry standards and practices on a cost-effective and timely basis is critical to sustaining and growing market reach of the Company.
The Company operates in the engineered-to-order capital goods industry where product efficiency, critical product features and overall life cycle costs play an important role.
The company design generators on the basis of customer requirements/specifications. The Company’s team is engaged continuously in design and development of generators meeting customer requirements from time to time. It is an ongoing activity of the design group to develop generators for special applications.
Technology absorption continues and orders are being received for large generators. As a part of the technology agreements, the Company receives updation of technology and processes continuously from licensors.
4. Competition Risk Many large corporations in Europe, America and in South East are competitors to the Company. These large corporations have access to advanced technologies, greater global reach, larger financial resources and may benefit from greater economies of scale and operating efficiencies. Competitors
may be able to sell their products at prices lower than the Company’s, which may have an adverse effect on the Company’s market share and results of operations. This may compel the Company to quote aggressively and impact its margins.
With a view to mitigate this risk, the Company provides value proposition to customer with products which meet the benchmark efficiencies at a competitive price and shorter delivery time, without compromising on margins. The Company continues to upgrade it’s engineered to order platform and design capabilities by incorporating latest technologies in its products and improvements in the design of generators enabling it to offer more efficient machines. Reduction in production, distribution costs and improvement in operating efficiencies are continuously pursued enabling it to offer competitive prices. The Company prioritizes its supply chain in sourcing good quality raw materials and other inputs at competitive prices with high reliability in meeting delivery timelines.
5. Risk arising from transnational sale of products In view of export of product to several countries in various continents, there is a risk of various types of claims from customers towards under performance of product and third party claims if the laws of that country are not fully conformed to.
The Company has strict quality control procedures which ensure that all the products supplied to the customers must meet the contractual parameters. It is ensured that the contracts with customers clearly specify the obligations of the Company. In addition, the Company takes appropriate contractually insurance policies to cover all such risks.
Manufacturing facilities, Design & Development
We have 2 manufacturing units, all located at Bangalore equipped with advanced automation/ machines which help in delivering quality products at competitive prices. One of the facilities is a dedicated large generator manufacturing unit with state of the art machines and equipment. All the manufacturing units are ISO 9001:2008 compliant.
The Company’s R&D facility which is approved by the Department of Scientific Industrial Research, GOI focuses on adoption of new technology and development of superior designs enhancing performance, quality and reducing costs. The Company’s team is engaged continuously in design and development of generators

31
meeting customer requirements from time to time. Projects to develop generators for Special application and for design modification and enhancement are ongoing. Our generators are approved by reputed and leading engineering consultants.
Internal Control Systems and their adequacy
The Company has established adequate internal control system, commensurate with the nature of its business and size of its operations in order to ensure quality and reliability of underlying processes focused towards achieving operational efficiency, supported by Management reviews. All audit observations and follow up actions thereon are initiated for resolution by the finance function and reported to the Audit Committee. Attention is also drawn to the statement on Internal financial control in the Directors report.
Environment, Health and Safety
As a leading Generator Manufacturer the Company conducts all its operations in a manner that is protective of the environment, health and safety of employees, customers, suppliers and the community in large and is a zero discharge facility. In fulfilling this commitment, we maintain and continually improve all our process and complying with legal and other requirements, in order to
• Ensure safety and Health of our employees, associated stakeholders and focus on how to make the world a better place to live.
• Comply with all applicable legal Safety and Health performance of individuals at different levels while considering their career advancement in the organization.
• Enhance Safety, Health & Environment (SHE) awareness amongst employees and associated stakeholders through effective communication and training.
• Ensure SHE responsibility amongst all the employees in their practices, promote and value their involvement in achieving the goals of this policy.
• Fix responsibility of SHE policy and procedures on the contractors, Sub-Contractors, Transporters and all other agencies operating with the Company.
• Integrate Health & Safety in all decision-making processes of the company including those dealings with purchase of plant equipment, machinery & materials as well as selection and placement of personnel.
• Adopt all the relevant techniques & methods such as risk assessment and safety audits at appropriate intervals of time to assess the status on Quality, Environment and Health & Safety and take relevant remedial measures to overcome problems encountered.
The Company’s environmental, occupational health and safety management systems fulfill ISO 14001-2004 and OSHAS 18001- 2007 requirements.
Human Resources
Continuous skill development and enhancement is important for the Company with its focus on export markets. The Company recognizes that its workforce is critical to the Company’s success and therefore, is committed to training, skilling and up skilling it/s work force on an ongoing basis which ensures that its work force is able to adopt evolving technologies, processes and techniques. The Company’s leadership engages affirmatively in employee development and engagement activities such as involvement in the ‘Corporate Responsibility’ initiatives, active participation of work force in safety initiatives, quality improvement programs, language skills, leadership development programs, training programs and training under license agreements, on an ongoing basis. During the year, about 47 man days per employee was dedicated for training. Employee relations continue to remain peaceful and cordial.
The Company believes in equal opportunity in recruitment and in the course of the employment among employees regardless of color, race, gender, social origin, caste or religion. Efforts are continuously made to create an inclusive working environment for women and to integrate them in organizational functions.
The Company firmly believes that every woman employee of the Company has a right to work in an environment free from sexual harassment, intimidation or offensive behavior and in which issues of harassment will be resolved without fear of reprisal. In this direction a Policy on prevention/ prohibition of sexual harassment of woman at Company’s workplace (“Policy”) is in place to take effective measures to avoid and to eliminate and if necessary to impose punishment for any sexual harassment in the Company’s work place integrated with the Sexual Harassment of Women at Workplace (Prevention, Prohibition and Redressal) Act, 2013.
The Company continues to reinforce the Code of Business Conduct across functions/workforce. In order to enhance communications and to create a congenial environment, the organizational leadership and the shop-floor employees of the company have invested significant amount of time and effort.
As on March 31, 2017, the total strength of employees stood at 582.
Management Discussion and Analysis (contd.)

TD Power Systems Limited
32
Financial Review
Consolidated basisThe results of operations as of and for the years ended March 31, 2017 and 2016 on a consolidated basis is as follows
Particulars Fiscal Year 2017 Fiscal Year 2016
(Rs. in Lakhs) % of Total Income (Rs. in Lakhs) % of Total Income
Income Net Sales 37,990.91 94.89 50,675.12 96.17
Other Income 2,045.13 5.11 2,018.84 3.83Total Income 40,036.04 100.00 52,693.96 100.00
Expenditure Consumption of Raw Material, Stores, Spare parts and Components
22,099.55
55.20
25,992.96
49.33
Purchases for Project Business 3,480.27 8.69 8,096.49 15.37Purchases for EPC 183.72 0.46 2,699.25 5.12Operating and Other Expenses 11,423.05 28.53 13,187.09 25.03Interest and Finance Charges On Fixed Loans - - - - On Other Accounts 414.29 1.03 498.15 0.95Loss on Sale of Fixed Assets 25.14 0.06 30.86 0.06Depreciation Amortization of Technical Know-how
2,785.55
6.96
2,880.71
5.47
Total Expenditure 40,411.57 100.94 53,385.51 101.31
Profit Before Tax and Extraordinary Items
(375.54)
(0.94)
(691.55)
(1.31)
Provision for Taxation 82.16 - 466.07Provision for Wealth Tax - - -Deferred Tax (9.27) - (239.08)Profit/(Loss) Before Extraordinary Items
(448.43)
-
(918.54)
(82.84)
Extraordinary Items - - -
Provision no longer required - - -
Adjustments Less: Provision no longer required with respect to earlier years adjusted to the respective year
- - -
Profit After Extraordinary Items (448.43) (918.54) (82.84) Profit/(Loss) After Tax (448.43) (918.54) (82.84)
Management Discussion and Analysis (contd.)
Fiscal 2017 compared to Fiscal 2016
Income Total income decreased by Rs. 12,657.93 Lakhs, or 24.02%, to Rs. 40,036.04 Lakhs in Fiscal 2017 from Rs. 52,693.96 Lakhs in Fiscal 2016, due to decrease in sales volume of Manufacturing, Projects & EPC Business.
-Net sales decreased by Rs. 12,684.22 Lakhs, or 25.03%, to Rs. 37,990.90 Lakhs in Fiscal 2017 from Rs. 50,675.12
Lakhs in Fiscal 2016, due to decrease in sales volume of Manufacturing, Projects & EPC Business.
-Net sales from our manufacturing business decreased by Rs. 4,914.63 Lakhs, or 13.69%, to Rs. 30,972.85 Lakhs in Fiscal 2017 from Rs. 35,887.48 Lakhs in Fiscal 2016. Net sales of our manufacturing business contributed 77.36 % and 68.11% of our Total Income in Fiscal 2017 and 2016, respectively.

33
Management Discussion and Analysis (contd.)
-Net sales from our Project Business including Japan Subsidiary decreased by Rs. 5,634.02 Lakhs, or 45.15%, to Rs. 6,845.59 Lakhs in Fiscal 2017 from Rs. 12,479.61 Lakhs in Fiscal 2016. Net sales of our Project Business contributed 17.10 % and 23.68% of our Total Income in Fiscal 2017 and 2016, respectively.
-Net Sales from EPC Business decreased by Rs. 2,135.57 Lakhs, or 92.53% to Rs. 172.46 Lakhs in Fiscal 2017 from Rs. 2,308.02 Lakhs in Fiscal 2016. Net sales of our EPC business contributed 0.43% and 4.38% of our Total Income in Fiscal 2017 and Fiscal 2016, respectively.
-Expressed as a percentage of total income, net sales decreased to 94.89% in Fiscal 2017 from 96.17% in Fiscal 2016.
-Other income contributed 5.11% and 3.83% of our total income in Fiscal 2017 and 2016, respectively. Other income increased by Rs. 26.29 Lakhs, or 1.30%, to Rs. 2,045.13 Lakhs in Fiscal 2017 from Rs. 2,018.84 Lakhs in Fiscal 2016. Interest from banks deposits increased by Rs. 16.68 Lakhs, or 1.29%, to Rs. 1,314.57 Lakhs in Fiscal 2017 from Rs. 1,297.89 Lakhs in Fiscal 2016.
Expenditure Total expenditure decreased by Rs. 12,973.94 Lakhs, or 24.30%, to Rs. 40,411.57 Lakhs in Fiscal 2017 from Rs. 53,385.51 Lakhs in Fiscal 2016
-Consumption of raw material, stores, spare parts and components expenses decreased by Rs. 3,893.41 Lakhs, or 14.98%, to Rs. 22,099.55 Lakhs in Fiscal 2017 from Rs. 25,992.96 Lakhs in Fiscal 2016, primarily due to reduced sale of manufactured goods. Expressed as a percentage of total income, raw material consumed expenses increased to 55.20% in Fiscal 2017 from 49.33% in Fiscal 2016 due to reduced sales volume of projects and EPC business.
- Purchases for Project Business including Japan Subsidiary decreased by Rs. 4,616.22 Lakhs, or 57.02%, to Rs. 3,480.27 Lakhs in Fiscal 2017 from Rs. 8,096.49 Lakhs in Fiscal 2016, due to reduced business volume. Expressed as a percentage of total income, purchases for Project Business decreased to 8.69% in Fiscal 2017 from 15.37% in Fiscal 2016 .
-Purchases for EPC decreased by Rs. 2,515.53 Lakhs, or 93.19%, to Rs. 183.72 Lakhs in Fiscal 2017 from Rs. 2,699.25 Lakhs in Fiscal 2016, due to reduced business volumes. Expressed as a percentage of total income, purchases for EPC expenses decreased to 0.46 % in Fiscal 2017 from 5.12% in Fiscal 2016 .
-Operating and other expenses decreased by Rs. 1,764.04 Lakhs, or 13.38%, to Rs. 11,423.04 Lakhs in Fiscal 2017 from
Rs. 13,187.08 Lakhs in Fiscal 2016. Expressed as a percentage of total income, operating and other expenses is 28.53% in Fiscal 2017 when compared to 25.03% in Fiscal 2016.
-Power and fuel expenses decreased by Rs. 64.41 Lakhs, or 11.48%, to Rs. 496.47 Lakhs in Fiscal 2017 from Rs. 560.88 Lakhs in Fiscal 2016 on account of reduced volumes.
-Personnel expenses through salaries, wages and bonuses increased by Rs. 518.29 Lakhs or 11.31%, to Rs. 5,099.75 Lakhs in Fiscal 2017 from Rs. 4,581.46 Lakhs in Fiscal 2016 due to increase salary of workmen & staff.
-Welfare expenses decreased by Rs. 586.04 Lakhs, or 32.83%, to Rs. 1,198.96 Lakhs in Fiscal 2017 from Rs. 1,785.00 Lakhs in Fiscal 2016.
-Rent charges decreased by Rs. 86.36 Lakhs, or 56.25%, to Rs. 67.17 Lakhs in Fiscal 2017 from Rs. 153.53 Lakhs in Fiscal 2016 primarily due to termination of lease of office premises.
-Repair expenses decreased by Rs. 159.62 Lakhs, or 37.31%, to Rs. 268.22 Lakhs in Fiscal 2017 from Rs. 427.84 Lakhs in Fiscal 2016.
-Selling expenses decreased by Rs. 390.64 Lakhs, or 35.15%, to Rs. 720.80 Lakhs in Fiscal 2017 from Rs. 1,111.45 Lakhs in Fiscal 2016, on account of reduced business volumes.
-Insurance expenses increased by Rs. 13.17 Lakhs, or 18.39%, to Rs. 84.81 Lakhs in Fiscal 2017 from Rs. 71.63 Lakhs in Fiscal 2016, on account of larger coverage in the sum insured.
-Travelling expenses increased by Rs. 98.06 Lakhs, or 8.50%, to Rs. 1,252.32 Lakhs in Fiscal 2017 from Rs. 1,154.26 Lakhs in Fiscal 2016.
-Audit Fee decreased by Rs. 2.21 Lakhs, or 5.75%, to Rs. 36.29 Lakhs in Fiscal 2017 from Rs. 38.50 Lakhs in Fiscal 2016 primarily due to reduction in certification charges.
-Consultancy & Professional charges decreased by Rs. 67.08 Lakhs, or 12.88%, to Rs. 453.78 Lakhs in Fiscal 2017 from Rs. 520.87 Lakhs in Fiscal 2016 due to reduced business volumes.
-Bank charges increased by Rs. 642.38 Lakhs, or 310.13% to Rs. 849.52 Lakhs in Fiscal 2017 from Rs. 207.14 Lakhs in Fiscal 2016 on account of forex / translation loss (Rs. 618.49 lakhs) due to volatility of currency market.
-Royalty charges decreased by Rs. 61.62 Lakhs, or 91.37%, to Rs. 5.82 Lakhs in Fiscal 2017 from Rs. 67.44 Lakhs in Fiscal 2016 due to lower sale of product under license agreement.
-Direction charges including other expenses decreased by Rs. 140.01 Lakhs, or 43.82%, to Rs. 179.53 Lakhs in Fiscal 2017

TD Power Systems Limited
34
Management Discussion and Analysis (contd.)
Standalone basisThe results of operations as of and for the years ended March 31, 2017 and 2016 on a stand-alone basis, comprising of manufacturing business and projects business is as follows:
Particulars Fiscal Year 2017 Fiscal Year 2016
(Rs. in Lakhs) % of Total Income (Rs. in Lakhs) % of Total Income
Income Net Sales 36,944.03 95.37 45,535.02 95.99Other Income 1,794.04 4.63 1,901.13 4.01Total Income 38,738.07 100.00 47,436.15 100.00 Expenditure Consumption of Raw Material, Stores, Spare parts and Components 22,098.48 57.05 25,761.06 54.31Purchases for Project Business 2,699.96 6.97 5,493.29 11.58Operating and Other Expenses 10,692.17 27.60 11,170.07 23.55Interest and Finance Charges On Fixed Loans On Other Accounts 406.17 1.05 481.45 1.01Loss on Sale of Fixed Assets - -
Depreciation Amortization of Technical Knowhow 2,772.21 7.16 2,837.62 5.98Total Expenditure 38,668.99 99.82 45,743.49 96.43Profit Before Tax and Extraordinary Items 69.08 0.18 1,692.66 3.57Provision for Taxation 64.00 - 465.00 -Provision for Wealth Tax - - - -Deferred Tax (3.82) - (270.22) -Fringe Benefit Tax - - - -Profit Before Extraordinary Items 8.90 - 1,497.88 -Extraordinary Items – Provision No longer required
- - - -
Adjustments Less: Provision no longer re-quired with respect to earlier years adjusted to the respective year
- -
- -
Profit After Extraordinary Items 8.90 - 1,497.88 -Profit/(Loss) After Tax 8.90 - 1,497.88 -
from Rs. 319.54 Lakhs in Fiscal 2016 due to lower payment of managerial remuneration.
-Interest and finance charges decreased by Rs. 83.86 Lakhs, or 16.83%, to Rs. 414.29 Lakhs in Fiscal 2017 from Rs. 498.15 Lakhs in Fiscal 2016, due to reduced interest rates.
-Depreciation and amortization of technical know-how expense decreased by Rs. 95.15 Lakhs, or 3.30%, to Rs. 2,785.55 Lakhs in Fiscal 2017 from Rs. 2,880.71 Lakhs in Fiscal 2016.
-Loss before tax and extraordinary items decreased by
Rs. 316.01 Lakhs, or 45.70%, to Rs. 375.54Lakhs in Fiscal 2017 from Rs. 691.55 Lakhs in Fiscal 2016.
-Tax expense decreased by Rs. 154.10 Lakhs, or 67.89%, to Rs. 72.89 Lakhs in Fiscal 2017 from Rs. 226.99 Lakhs in Fiscal 2016 due to lower profits.
- loss after tax decreased by Rs. 470.11 Lakhs, to Rs. 448.43 Lakhs in Fiscal 2017 from Rs. 918.54 Lakhs in Fiscal 2016.
The consolidated net worth stands at Rs 46879.70 decrease of Rs 447.75 lacs over Fiscal 2016.

35
Fiscal 2017 compared to Fiscal 2016
Income Total income decreased by Rs. 8,698.08 Lakhs, or 18.34%, to Rs. 38,738.07 Lakhs in Fiscal 2017 from Rs. 47,436.15 Lakhs in Fiscal 2016, due to decrease in sales volume of Manufacturing & Projects Business.
-Net sales decreased by Rs. 8,590.99 Lakhs, or 18.87%, to Rs. 36,944.03 Lakhs in Fiscal 2017 from Rs. 45,535.02 Lakhs in Fiscal 2016, due to decrease in sales volume of Manufacturing & Projects Business.
-Net sales from our manufacturing business decreased by Rs. 5,013.35 Lakhs, or 13.95%, to Rs. 30,912.57 Lakhs in Fiscal 2017 from Rs. 35,925.91 Lakhs in Fiscal 2016. Net sales of our manufacturing business contributed 79.80% and 75.74% of our Total Income in Fiscal 2017 and 2016, respectively.
-Net sales from our Project Business decreased by Rs. 3,577.64 Lakhs, or 37.23%, to Rs.6,031.46 Lakhs in Fiscal 2017 from Rs. 9,609.10 Lakhs in Fiscal 2016. Net sales of our Project Business contributed 15.57% and 20.26% of our Total Income in Fiscal 2017 and 2016, respectively.
-Expressed as a percentage of total income, net sales remained flat at 95.37% in Fiscal 2017 versus 95.99% in Fiscal 2016.
-Other income contributed 4.63% and 4.01% of our total income in Fiscal 2017 and 2016, respectively. Other income decreased by Rs. 107.09 Lakhs, or 5.63%, to Rs. 1,794.04 Lakhs in Fiscal 2017 from Rs. 1,901.13 Lakhs in Fiscal 2016 on account of currency volatility resulting in exchange / translation loss during current year. Interest from banks deposits increased by Rs. 144.21 Lakhs, or 13.61%, to Rs. 1,203.47 Lakhs in Fiscal 2017 from Rs. 1,059.26 Lakhs in Fiscal 2016.
Expenditure Total expenditure decreased by Rs. 7,074.50 Lakhs, or 15.47%, to Rs. 38,668.99 Lakhs in Fiscal 2017 from Rs. 45,743.49 Lakhs in Fiscal 2016.
-Consumption of raw material, stores, spare parts and components expenses decreased by Rs. 3,662.58 Lakhs, or 14.22%, to Rs. 22,098.48 Lakhs in Fiscal 2017 from Rs. 25,761.06 Lakhs in Fiscal 2016, primarily due to reduction in sales of manufactured goods. Closing stock (of work-in- progress and finished goods) decreased by Rs. 228.09 Lakhs, or 7.29%, to Rs. 2,901.87 Lakhs in Fiscal 2017 from Rs. 3,129.96 Lakhs in Fiscal 2016. Expressed as a percentage of total income, raw material consumed expenses increased to 57.05% in Fiscal 2017 from 54.31% in Fiscal 2016 due to increased volumes and change in product mix.
- Purchases for Project Business decreased by Rs. 2,793.32 Lakhs, or 50.85%, to Rs. 2,699.96 Lakhs in Fiscal 2017 from
Rs. 5,493.29 Lakhs in Fiscal 2016, due to reduced business volume. Expressed as a percentage of total income, purchases for Project Business decreased to 6.97% in Fiscal 2017 from 11.58% in Fiscal 2016 due to reduced business volumes.
-Operating and other expenses decreased by Rs. 477.98 Lakhs, or 4.28%, to Rs. 10,692.09 Lakhs in Fiscal 2017 from Rs. 11,170.07 Lakhs in Fiscal 2016.
-Power and fuel expenses decreased by Rs. 59.01 Lakhs, or 10.63%, to Rs. 496.24 Lakhs in Fiscal 2017 from Rs. 555.25 Lakhs in Fiscal 2016 on account of reduced volumes
-Personnel expenses through salaries, wages and bonuses increased by Rs. 600.55 Lakhs, or 14.72%, to Rs. 4,680.24 Lakhs in Fiscal 2017 from Rs. 4,079.69 Lakhs in Fiscal 2016 due to increase salary of workmen & staff.
-Welfare expenses decreased by Rs. 435.31 Lakhs, or 27.03%, to Rs. 1,175.10 Lakhs in Fiscal 2017 from Rs. 1,610.41 Lakhs in Fiscal 2016.
-Rent charges decreased by Rs. 60.42 Lakhs, or 55.55%, to Rs. 48.36 Lakhs in Fiscal 2017 from Rs. 108.78 Lakhs in Fiscal 2016 primarily due to termination of lease of office premises.
-Repair expenses decreased by Rs. 157.38 Lakhs, or 37.53%, to Rs. 261.95 Lakhs in Fiscal 2017 from Rs. 419.34 Lakhs in Fiscal 2016.
-Selling expenses decreased by Rs. 390.48 Lakhs, or 35.16%, to Rs. 720.09 Lakhs in Fiscal 2017 from Rs. 1,110.57 Lakhs in Fiscal 2016, on account of reduced business volumes.
-Vehicle Maintenance expenses increased by Rs. 8.69 Lakhs, or 18.28%, to Rs. 56.25 Lakhs in Fiscal 2017 from Rs. 47.55 Lakhs in Fiscal 2016.
-Insurance expenses increased by Rs. 7.37 Lakhs, or 10.63%, to Rs. 76.64 Lakhs in Fiscal 2017 from Rs. 69.27 Lakhs in Fiscal 2016, on account of larger coverage in the sum insured.
-Travelling expenses increased by Rs. 88.77 Lakhs, or 8.25%, to Rs. 1,164.30 Lakhs in Fiscal 2017 from Rs. 1,075.53 Lakhs in Fiscal 2016.
- Audit Fee decreased by Rs. 2.21 Lakhs, or 7.22%, to Rs. 28.44 Lakhs in Fiscal 2017 from Rs. 30.65 Lakhs in Fiscal 2016 primarily due to reduction in certification charges.
-Consultancy & Professional charges decreased by Rs. 66.59 Lakhs, or 15.82%, to Rs. 354.39 Lakhs in Fiscal 2017 from Rs. 420.99 Lakhs in Fiscal 2016 due to reduced business volumes.
-Bank charges increased by Rs. 669.42 Lakhs, or 420.12% to Rs. 828.75 Lakhs in Fiscal 2017 from Rs. 159.34 Lakhs in Fiscal 2016 on account of forex / translation loss (Rs. 618.49 lakhs) due to volatility of currency market.
Management Discussion and Analysis (contd.)

TD Power Systems Limited
36
-Royalty charges decreased by Rs. 61.62 Lakhs, or 91.37%, to Rs. 5.82 Lakhs in Fiscal 2017 from Rs. 67.44 Lakhs in Fiscal 2016 due to lower sale of product under license agreement.
-Direction charges including other expenses decreased by Rs. 138.68 Lakhs, or 44.42%, to Rs. 173.55 Lakhs in Fiscal 2017 from Rs. 312.24 Lakhs in Fiscal 2016 due to lower payment of managerial remuneration.
-Manufacturing expenses decreased by Rs. 68.14 Lakhs, or 36.62%, to Rs. 117.93 Lakhs in Fiscal 2017 from Rs. 186.07 Lakhs in Fiscal 2016.
-Expressed as a percentage of total income, operating and other expenses is 27.60 % in Fiscal 2017 when compared to 23.55% in Fiscal 2016.
-Interest and finance charges decreased by Rs. 75.28 Lakhs, or 15.64%, to Rs. 406.17 Lakhs in Fiscal 2017 from Rs. 481.45 Lakhs in Fiscal 2016, due to reduced interest rates.
-Depreciation and amortization of technical know-how expense decreased by Rs. 65.41 Lakhs, or 2.31%, to Rs. 2,772.21 Lakhs in Fiscal 2017 from Rs. 2,837.62 Lakhs in Fiscal 2016 on account of completion of useful life of asset.
Management Discussion and Analysis (contd.)
Bangalore May 18, 2017
INTENTIONALLY LEFT BLANK
For and on behalf of the Board of Directors
Mohib N. Khericha Chairman
K. G. Prabhakar Director & CFO
Nikhil Kumar Managing Director
N. Srivatsa Company Secretary
-Profit before tax and extraordinary items decreased by Rs. 1,623.58 Lakhs, or 95.92%, to Rs. 69.08 Lakhs in Fiscal 2017 from Rs. 1,692.66 Lakhs in Fiscal 2016 due to reduced sales volumes.
-Tax expense including deferred tax decreased by Rs. 134.60 Lakhs, or 69.10%, to Rs. 60.18 Lakhs in Fiscal 2017 from Rs. 194.78 Lakhs in Fiscal 2016 due to lower profits.
- Profit after tax decreased by Rs. 1,488.98 Lakhs, or 99.41%, to Rs. 8.90 Lakhs in Fiscal 2017 from Rs. 1,497.88 Lakhs in Fiscal 2016.
Forward-Looking Statement
Statements in the Management Discussion and Analysis describing the Company’s plans, estimates and projections may be ‘forward looking statements’ within the meaning of applicable securities laws and regulations. Actual results may materially differ from those expressed or implied in the report. The Company assumes no responsibility to publicly amend, modify or revise any such statements on the basis of subsequent developments, information or events.

37
ANNEXURE – 10
CORPORATE GOVERNANCE REPORT
Company’s Philosophy
Your Company i.e. TD Power Systems Limited (“we”)/(“The Company”)/(“TDPS”) is committed to ethical business practices and regulatory compliances and continues to practice good Corporate Governance. We have complied with the requirements of corporate governance contained in SEBI (Listing Obligations and Disclosure Requirements) Regulations, 2015 (Listing Regulations/LODR), particularly those relating to composition of Board of Directors (“The Board”), constitution of Committees such as an Audit Committee, Stakeholders Relationship Committee and Nomination and Remuneration Committe.
Our Corporate Governance Report for fiscal 2017 forms part of this Annual Report.
Note
1. *As required by clause 26 of the LODR, disclosures includes chairpersonship and membership of the Audit Committee and the Stakeholders’ Relationship Committee of Public Limited companies.
2. Number of Directorship held in other Companies includes Private Limited Companies and public (listed/unlisted) Limited Companies and excludes Foreign Companies and Companies under Section 8 of the Companies Act, 2013 (“The Act”) in which he/she is a Director.
3. The necessary disclosures regarding change in Committee positions, if any, have been made by all the
Name Category Boardmeetings
during theyear
Boardmeetingsattended
Attendanceat Last AGM
Directorshipin other companies
Chairmanship / Committeemembership of other
Companies*
Chairman Memder
Mr. Mohib N. Khericha
Non-Executive Chairman
4
4
Yes
15
3
1
Mr. Nikhil Kumar
Managing Director
4
4
Yes
3
Nil
Nil
Ms. Nandita Lakshmanan
Independent Director
4 2 Yes 2 Nil Nil
Dr. Arjun Kalyanpur
Independent Director
4
3
No
5
Nil
Nil
Mr. Nitin Bagamane
Independent Director 4 4 Yes 8 Nil Nil
Mr. Ravi Kanth Mantha
Independent Director
4
3
Yes
7
Nil
Nil
Mr.K G Prabhakar Executive Director 4 4 Yes 1 Nil Nil
Annexure to the Directors’ Report (contd.)
I. Board of Directors and Procedures
The composition of the Board of Directors as on March 31, 2017 comprised of seven Directors consisting of a Non-Executive Chairman, a Managing Director (“MD”), Whole time Director and four Independent Directors including a Women Director. The positions of the Chairman of the Board and the Managing Director (Chief Executive Officer) of the Company are held by separate individuals. The Chairman of the Board is a Non-Executive Non-Independent Director and one of the Promoters.
A. Composition & Category of Directors, Attendance at Board Meetings & Annual General Meeting, Membership of other Boards/Committees as on March 31, 2017
Directors, during the year under review. None of the Director is a Member of more than 10 Committees or Chairman of more than 5 Committees across all Indian public limited Companies in which he/she is a Director.
4. None of the Directors had any relationship inter-se.
5. Excepting Mr. Mohib N. Khericha who holds 37,30,960 Equity Shares, no other Non-Executive Director holds shares of the Company.
6. The Company has proper systems to enable the Board to periodically review compliance reports of all laws applicable to the Company, as prepared by the Company.
TD Power Systems Limited
38
Corporate Governance Report (contd.)
7. None of the Non-executive Directors held convertible instruments of the Company during the financial year ended 31st March 2017.
B. Board Meetings
The Board meets at least once in a quarter to review the quarterly results and other items on the agenda. During the year, the Board met four times on May 11, 2016, August 03, 2016, November 03, 2016 and February 02, 2017. The maximum gap between any two Board Meetings was less than one hundred and twenty days. Agenda papers including draft minutes are circulated well in advance of Board meetings to the members. It contains vital and adequate information facilitating deliberations at the meeting.
All material information was circulated to the directors before the meeting or placed at the meeting, including the following minimum information as mentioned in the Part B of Schedule II of LODR, as and when occasion arises:
-Annual Business Plan which includes capital expenditure and manpower budget. The capital expenditure proposals sanctioned and actual amounts incurred are reported on a quarterly basis. Reasons for variance between the budget and actuals are also explained.
-Information on recruitment of senior officers just below the Board level, including appointment or removal of Chief Financial Officer and Company Secretary.
-Report on statutory compliance, show cause notices, penalties, suits filed by/against the company and shareholders grievances, etc.
-Quarterly financial results for the Company and for the group companies with analysis of performance.
-Minutes of the meetings of Board appointed committees.
-Significant labor problems, if any, and their proposed solutions, wage agreements etc.
-Safety issues - fatal or serious accidents in the plants, dangerous occurrences, any material effluent or pollution problems.
-Any material default in financial obligations to and by the Company.
-Any issue, which involves possible public or product liability claims of substantial nature, including any judgment or order which may have passed
strictures on the conduct of the Company or taken an adverse view regarding another enterprise that can have negative implications on the Company.
-Matters relating to related party transactions & statutory compliance.
-Minutes of meeting of the Board of Directors, financial statements, related party transactions and significant transactions relating to wholly owned subsidiaries.
C. Code of Conduct
The Company has in place a comprehensive Code of Conduct (“the Code”) applicable to all the employees and Nonexecutive Directors including Independent Directors. The Code gives guidance and support needed for ethical conduct of business and compliance of law. A copy of the Code has been placed on the Company’s website (www.tdps.co.in). The Code has been circulated to Directors and Management Personnel and its compliance is affirmed by them annually. A declaration signed by the Managing Director forms part of this Report. The code of conduct has incorporated the duties of independent directors as laid down in the Companies Act, 2013.
D. Disclosure regarding Appointment or Reappointment of a Director
At the ensuing Annual General Meeting of the Company Mr. Mohib N. Khericha retires by rotation and being eligible offers himself for reappointment.
Mr. Mohib N. Khericha – aged 64 years, Non-Executive Chairman of the Company since July 5, 2001. He is a Chartered Accountant with over four decades experience in capital structuring, restructuring, financial management and loan syndication. He ventured into merchant banking in the year 1994.
Mr. Mohib N. Khericha holds 37,30,960 equity shares of the Company being 11.23% of paid up capital. He has attended all four board meetings of the Company during 2016 -17.
He is also a Non-Executive Chairman of the Company’s wholly owned subsidiary DF Power Systems Private Limited.
He does not have any relationship inter-se between other directors.
E. Independent Directors: 1. Independent Director means a Non-Executive Director, who fulfills the criteria as laid down in Regulation 25 of the LODR.
2. None of the Independent Directors of the Company

39
Corporate Governance Report (contd.)
serve as an Independent Director in more than seven listed companies and where any Independent Director is serving as whole-time director in any listed company, such director is not serving as Independent Director in more than three listed companies.
3. The maximum tenure of Independent Directors is in accordance with the Companies Act, 2013 and rules made thereunder, in this regard, from time to time.
4. During the year, separate meeting of the Independent Directors was held o n February 02, 2017 without th attendance of non-independent directors and members of the management. All Independent Directors attended the said meeting.
5. The Company has issued formal letter of appointment to its Independent Directors appointed at the Annual General Meeting (“AGM”) held on August 12, 2014, and the terms and conditions of said Letter are published on the website of the Company www.tdps.co.in.
6. None of the Independent Directors are due for re-appointment.
F. Familiarisation Programme for Non Executive/ Independent Directors of the Company In terms of LODR, the Company adopted a Familiarization Programme for its Non-Executive Directors including Independent Directors comprising two segments:-
1. Familiarization upon induction of new Directors - Inductee shall be provided with a copy of all the applicable codes and policies formulated and adopted by the Company.
- An orientation on the Company’s, products, markets, customers and functions shall be provided.
- Introduction to & interaction with certain key members of the senior management of the Company.
- A detailed briefing to the inductee on the roles and responsibilities as Director/Independent Director.
2. Annual Familiarization Programme The Company shall on an annual basis brief its Directors inter alia about the Company’s business model, shareholder profile, financial details, their roles, rights and responsibilities in the Company. The Board shall also be periodically briefed on the various changes in the regulations governing the conduct of Independent Directors. The above
familiarization program is placed on our website www.tdps.co.in.
G. Performance Evaluation The criteria for performance evaluation cover areas relevant to the functioning as Independent Directors such as preparation, participation, conduct and effectiveness. The performance evaluation of Independent Directors was done by the entire Board of Directors and in the evaluation the Directors who are subject to evaluation had not participated.
H. Board Evaluation SEBI (Listing Obligations and Disclosure Requirements) Regulations, 2015 mandates that the board shall monitor and review the Board evaluation framework. The framework includes the evaluation of Directors on various parameters such as:
- Board dynamics parameters
- Information flow
- Decision - making
- Relationship with stakeholders
- Company performance and strategy
The Companies Act, 2013 states that a formal annual evaluation needs to be made by the board of its own performance and that of its committees and individual directors. Schedule IV of the Companies Act, 2013 states that the performance evaluation of Independent Directors shall be done by the entire Board of Directors, excluding the Director being evaluated.
The evaluation of the directors and the Board as a whole was conducted based on the criteria and framework formulated by the Nomination and Remuneration Committee.
One of the key functions of the Board is to monitor and review the Board evaluation framework. The board works with the Nomination & Remuneration Committee to lay down the evaluation criteria for the performance of executive/nonexecutive/independent directors through a peer evaluation. The questionnaire of the survey is a key part of the process of reviewing the functions and effectiveness of the board and identifying possible path for improvement. Each Board members is requested to evaluate the effectiveness of the board dynamics and relationship, information flow, decisions making of the directors, relationship with the stakeholders, company performance and strategy, and the effectiveness of the whole board and its various committee. Feedback on each director is encouraged. The evaluation process for fiscal 2017 has been completed.

TD Power Systems Limited
40
Corporate Governance Report (contd.)
An independent directors’ meeting was held to review the following
- Review the performance of non-independent directors and the Board as a whole.
- Review the performance of the Chairperson of the company, taking into account the views of executive directors and non-executive directors.
- Assess the quality, quantity and timeliness of flow of information between the company management and the Board that is necessary for the Board to effectively and reasonably perform their duties.
I. Remuneration of Directors
There is no pecuniary relationship or transactions with the non -executive directors excepting payment of sitting fees which is paid for attending Board/ Committee Meetings. The sitting fees shall not exceed Rupees One Lakh per meeting of the Board or Committee or such amount as may be prescribed by the Central Government from time to time. No commission/ share of profit is payable to them.
Disclosures with respect to remuneration paid to individual directors.
1. Details are provided in Annexure 1- the extract of the Annual Return, annexed to the Directors Report in Form MGT-9 as required under the provisions of Section 92 of the Companies Act, 2013.
2. Fixed component Details of remuneration paid to the Managing Director and Whole Time Director for the Fiscal 2017 are provided in Annexure 1 of the extract of the Annual Return, annexed to the Directors Report in Form MGT-9 as required under the provisions of Section 92 of the Companies Act, 2013.
3. Service contract, notice period, severance fees – Executive directors The Company’s Board comprises two executive directors, namely, Mr. Nikhil Kumar, Managing Director and Mr. K. G. Prabhakar, Whole Time Director & CFO. The remuneration of the Managing Director and Whole Time Director is governed by the agreement between the Company and Executive Directors which has been approved by the Board of Directors and the shareholders. The appointment of Mr. Nikhil Kumar, Managing Director is for a period of five years commencing from January 17, 2016 as provided in the service agreement with the Managing Director and appointment of Mr. K. G. Prabhakar, Whole Time Director is for period of three years up to June 2018. The remuneration broadly comprises fixed
component i.e. salary, allowances, perquisites and other benefits and a variable component in the form of commission on the profits of the Company.
4. Stock options- Nil The Nomination & Remuneration Committee (NRC) of the Board has framed a policy on selection and appointment of Directors and their remuneration including criteria for determining qualifications, positive attributes, independence of a Director and other matters provided under Section 178 of the Companies Act, 2013 and SEBI (Listing Obligations and Disclosure Requirements)Regulations 2015 (LODR). We affirm that the remuneration paid to the Directors is as per the terms laid out in the Nomination and Remuneration Policy of the Company. Based on the recommendation of the NRC, the Board has approved the policy
J. Remuneration Policy Policy relating to the Remuneration for the Whole- time Director, KMP and Senior Management Personnel ●• The remuneration / compensation / commission etc. to the Whole-time Director, Key Managerial Personnel (KMP) and Senior Management Personnel will be determined by the Committee and recommended to the Board for approval. The r emuneration/compensation/commission etc. shall be subject to the prior/post approval of the Shareholders of the Company and Central Government, wherever required.
●• The remuneration and commission to be paid to the Whole-time Director shall be in accordance with the provisions of the Act.
● • Increments to the existing remuneration/ compensation structure may be recommended by the Committee to the Board which should be within the slabs approved by the Shareholders in the case of Whole-time Director.
●• Where any insurance is taken by the Company on behalf of its Whole-time Director, Chief Financial Officer (“CFO”), the Company Secretary (“CS”) and any other employees for indemnifying them against any liability, the premium paid on such insurance shall not be treated as part of the remuneration payable to any such personnel. Provided that if such person is proved to be guilty, the premium paid on such insurance shall be treated as part of the remuneration.

41
Corporate Governance Report (contd.)
Remuneration to Whole-time Director, KMP and Senior Management Personnel
• ●Fixed Pay The Whole-time Director/ KMP and Senior Management Personnel shall be eligible for a monthly remuneration as may be approved by the Board on the recommendation of the NRC. The breakup of the pay scale and quantum of perquisites including, employer’s contribution to P.F, medical expenses etc. shall be decided and approved by the Board/the person authorized by the Board on the recommendation of the Committee and approved by the shareholders and Central Government, wherever required.
●• Minimum Remuneration If, in any financial year, the Company has no profits or its profits are inadequate, the Company shall pay remuneration to its Whole-time Director in accordance with the provisions of Schedule V of the Act and if it is not able to comply with such provisions, with the previous approval of the Central Government.
• Provisions for excess Remuneration If any Whole-time Director draws or receives, directly or indirectly by way of remuneration any such sums in excess of the limits prescribed under the Act or without the prior sanction of the Central Government, where required, he /she shall refund such sums to the Company and until such sum is refunded, hold it in trust for the Company. The Company shall not waive recovery of such sum refundable to it unless permitted by the Central Government.
Criteria of making payments to non-executive directors
Non-Executive Directors are paid sitting fees for attending Board/Committee Meetings. Provided that, the amount of such fees shall not exceed Rupees One Lakh per meeting of the Board or Committee or such amount as may be prescribed by the Central Government from time to time and no commission/share of profit is payable to them.
Profit-linked Commission
The profit-linked Commission may be paid within the monetary limit approved by shareholders, subject to the limit not exceeding 1% of the profits of the Company computed as per the applicable provisions of the Act.
Stock Options
Pursuant to the provisions of the Act, an Independent Director shall not be entitled to stock options of the Company.
II Board CommitteesA. Audit committee: The Audit Committee (“Committee”) consists of four Independent Directors and a non-Independent Director. Mr. Nitin Bagamane, Independent Director is the chairman and Dr. Arjun Kalyanpur, Ms. Nandita Lakshmanan, Mr. Ravi Kanth Mantha (all Independent Directors) and Mr. Mohib N. Khericha are the other members of the Committee. The constitution of the committee meets with the requirements of section 177 of the Companies Act, 2013.
All the current members of the Committee have relevant experience in financial matters and Mr. Mohib N. Khericha is a Chartered Accountant.
The Chairman of the Audit Committee Mr. Nitin Bagamane attended the 17th Annual General Meeting held on Thursday, September 22, 2016.
The Audit Committee met four (4) times during the financial year ended March 31, 2017 on May 11, 2016, August 03, 2016, November 03, 2016 and February 02, 2017. Particulars of attendance by the members of the Committee during the year ended March 31, 2017 are as follows:
Date of meeting Members Present
May 11, 2016 Mr. Nitin Bagamane, Mr. Mohib N. Khericha & Mr.Ravi Kanth Mantha
August 03, 2016 Mr. Nitin Bagamane, Mr. Mohib N. Khericha, Dr. Arjun Kalyanpur and Ms. Nandita Lakshmanan
November 03, 2016
Mr. Nitin Bagamane, Mr. Mohib N. Khericha, Mr. Ravi Kanth Mantha and Dr. Arjun Kalyanpur
February 02, 2017
Mr. Nitin Bagamane, Mr. Mohib N. Khericha, Mr. Ravi Kanth, Dr. Arjun Kalyanpur and Ms. Nandita Lakshmanan
The Company Secretary Mr. N Srivatsa is the Secretary of the Audit Committee.
The Managing Director and the Chief Financial Officer attend the Audit committee meetings by invitation. The Statutory Auditors attended Audit committee meetings as special invitees to provide comments and share concerns, if any, with the Audit committee.
All the recommendations made by the audit committee during the year were accepted by the board.

TD Power Systems Limited
42
The powers, role and terms of reference of the Audit Committee covers the areas as contemplated under Regulation 18 and Part C of Schedule II of SEBI (Listing Obligations and Disclosure Requirements) Regulations 2015 and Section 177 of the Companies Act, 2013, as applicable, besides other terms may be referred by the Board of Directors including the following.
• Review of Management Discussion and Analysis of financial condition and results of operations, statements of significant related party transactions submitted by management, management letters / letters of internal control weaknesses issued by the statutory auditors, Internal Audit Reports relating to internal control weaknesses and the appointment, removal and terms of remuneration of the internal auditor.
• Review inter alia related party transactions and the financial statements, minutes of Board meeting and audit committee meetings of the Company’s unlisted Wholly Owned Subsidiaries (“WOS”) and all significant transactions and arrangements entered into by the said Subsidiary.
B. Nomination and Remuneration Committee:
The Nomination and Remuneration Committee (“Committee”) consists of Dr. Arjun Kalyanpur Independent Director is the Chairman of the Committee and Ms. Nandita Lakshmanan and Mr. Mohib N. Khericha are the members of the Committee.
The Company Secretary is the Secretary of the Nomination and Remuneration Committee.
During the financial year 2016-2017, two meetings were held on August 03, 2016 and February 02, 2017. Particulars of attendance by the members of the Committee during the year ended March 31, 2017 are as follows.
The powers, role and terms of reference of the Nomination and Remuneration Committee covers the areas as contemplated under Regulation 19 and Part D of the Schedule II of the SEBI ( Listing Obligations and Disclosure Requirements) Regulations
Corporate Governance Report (contd.)
Date of meeting Members present
August 03, 2016Dr. Arjun Kalyanpur, Mr. Mohib N. Khericha and Ms. Nandita Lakshmanan
February 02, 2017 Dr. Arjun Kalyanpur, Mr. Mohib N. Khericha and Ms. Nandita Lakshmanan
Particular Number of Complaints
Shareholders Complaints received so far 3
Not resolved to the Satisfaction to the shareholders
Nil
Pending complaints Nil
2015 and Section 178 of the Companies Act, 2013 and includes the following
• Formulation of the criteria for determining qualifications, positive attributes and independence of a director and recommend to the Board a policy, relating to the remuneration of the Directors, Key Managerial Personnel and other employees.
• Formulation of criteria for evaluation of Independent Directors and the Board.
• Devising a policy on Board diversity.
• Identifying persons who are qualified to become Directors and who may be appointed in senior management in accordance with the criteria laid down, and recommend to the Board their appointment and removal.
Performance evaluation criteria for independent directors
The criteria for performance evaluation cover the areas relevant to the functioning as Independent Directors such as preparation, participation, conduct and effectiveness. The performance evaluation of Independent Directors was done by the entire Board of Directors and in the evaluation the Directors who are subject to evaluation did not participate.
C. Stakeholders’ Relationship Committee
Stakeholders’ Relationship Committee (“The Committee”) consists of Mr. Mohib N. Khericha, Non- Executive Director - the Chairman, Dr. Arjun Kalyanpur and Ms. Nandita Lakshmanan - Independent Directors are the members of the committee.
The Company Secretary Mr. N Srivatsa is the Secretary of the Stakeholders’ Relationship Committee.
During the financial year ended March 31, 2017, three complaints have been received from the shareholders and no complaint is pending for resolution. The Committee has not met during financial year ended March 31, 2017.

43
Role of the Stakeholders’ Relationship Committee covers the areas as contemplated under Regulation 20 and Part D of the Schedule II of the SEBI (Listing Obligations and Disclosure Requirements)Regulations 2015.
D. Risk Management Committee and policy
A Risk Management Committee (“The Committee”) comprising of Mr. Nitin Bagamane and Mr. Ravi Kanth Mantha, Independent Directors of the Company, Mr. Nikhil Kumar - Managing Director and Mr. K.G Prabhakar, Director and CFO as members was constituted to assist the Board in identifying existential risks, reviewing mitigation and elimination plans for those risks.
The Company has identified potential risks and required mitigation measures. In the opinion of the Board no risks are identifiable threaten the existence of the company in the near future.
III. Subsidiaries
As per provision of Regulation 24 of the SEBI (Listing Obligations and Disclosure Requirements) Regulations, 2015, details of the subsidiaries are as follows:
The Company has four Wholly Owned Subsidiaries (WOS) one Indian and three overseas as detailed below:
Indian Subsidiary
DF Power Systems Private Limited (DFPS) is a material non-Listed Indian Subsidiary. Mr. Nitin Bagamane and Mr. Ravi Kanth Mantha, Independent Directors of the Company have been appointed as Directors of DFPS.
The Board monitors performance of DFPS, inter alia, as follows:
- The Audit Committee of the Company reviews the financial statements of DFPS. - All minutes of Board meetings of DFPS are placed before the Company’s Board meetings and taken on record. - A statement containing all significant transactions and arrangements entered into by DFPS is placed before the Company’s Board.
Overseas Subsidiaries
USA Subsidiary
TD Power Systems (USA) Inc. (TDPS USA) was incorporated on February 20, 2013 as a Delaware Corporation and the principal place of business of the Company located in Ohio, USA. Two Directors of the Company Mr. Mohib N. Khericha and Mr. Nikhil Kumar are Directors of TDPS USA.
Corporate Governance Report (contd.)
The financial statements of TDPS USA are reviewed by the Audit Committee and overall operational performance is reviewed by the Board.
Japan Subsidiary
TD Power Systems Japan Limited (TDPS Japan) was incorporated on March 19, 2013 and principal place of business of the company is located in Tokyo, Japan. Mr. Mohib N. Khericha, Mr. Nikhil Kumar and Ms. Nandita Lakshmanan, Directors of the company and Mr. T Hosoya are Directors of TDPS Japan. The financial statements of TDPS Japan are reviewed by the Audit Committee and overall operational performance is reviewed by the Board.
German Subsidiary
Company acquired Platin1255. GmbH, a German company on January 13, 2016. Subsequently the name of Platin 1255. GmbH has been changed to TD Power Systems Europe GmbH. (TDPS Europe) Office of the company is located at Paul - Ehrlich - Strasse 1a, 63225 Langen. Mr. Nikhil Kumar, Managing Director of TD power Systems Limited and Mr. Roeland Nollen are the Managing Directors of TDPS Europe.
The financial statements of the TDPS Europe are reviewed by the Audit Committee and overall operational performance is reviewed by the Board.
None of these subsidiaries are a ‘material non-listed Indian subsidiary’, whose income or net worth exceeds 20% of the consolidated income or net worth respectively, of the holding company and its subsidiaries, in the immediately preceding accounting year.
The Company has formulated a policy on determining material subsidiaries which is available on our website www.tdps.co.in.
IV. Related party transaction
During the year 2016-17, the Company had no materially significant related party transaction, which is considered to have potential conflict with the interests of the Company at large.
The Company has formulated a policy on materiality of Related Party Transactions and also on dealing with Related Party Transactions. The said policy is also available on the website of the Company - web link: www.tdps.co.in
Details of transactions with related parties are provided in Annexure 3 of the Directors Report in Form AOC II as required under the provisions of Section 188 of the Companies Act, 2013 and note No. 31 to the Annual Accounts.

TD Power Systems Limited
44
VII. General Shareholder Information a. Annual General Meeting Day, Date and Time : Wednesday, 27th September 2017 at 10.30 AM Venue : Hotel Le Meridien, 28, Sankey Road, P B No. 174 Opp. to Bangalore Golf Club, Bangalore 560 052, India
b. Financial Year A twelve-month period starting from April 1, 2016 to March 31, 2017.
c. Dividend Payment Date The dividend, as recommended by the Board of Directors, if declared at the ensuing Annual General Meeting will be paid within the statutory period of 30 days.
d. Date of Book closure The Company’s Register of Members and Share Transfer Book’s will remain closed from September 21, 2017 to September 27, 2017 (both days inclusive) for the purpose of Annual General Meeting.
e. Listing on Stock Exchanges and Stock Code The Equity Shares of the Company are listed on BSE Limited (BSE) and National Stock Exchange of India Ltd (NSE).
Stock codes are as follows:
Corporate Governance Report (contd.)
V. General Body Meetings
Details of last 3 Annual General Meetings and summary of Special Resolutions passed therein
Financial Year Ended Date & Time Venue Special Resolutions passed
March 31, 2014 August 12, 201410.30 AM
The Chancery Pavilion, 135, Residency Road, Bangalore - 560 025
Increase the FII Limits.Borrowing Powers to the Board of Directors
March 31, 2015 September 23, 201510.30 AM
Hotel Le Meridien, No. 28, Sankey Road (Opp Bangalore Golf Course), Bangalore 560052
Nil
March 31, 2016 September 22, 201610.30 AM
Hotel Le Meridien,No. 28, Sankey Road (Opp Bangalore Golf Course),Bangalore 560 052
Nil
During the year, no special resolution was passed through postal ballot. None of the businesses proposed to be transacted in the ensuing Annual General Meeting require special resolution through postal ballot.
VI. Means of Communication Quarterly/Half Yearly/Yearly Results
Pursuant to provisions of the Listing Agreements / SEBI (Listing Obligations and Disclosure Requirements) Regulations, 2015, periodical financial results of the Company are being published in widely circulated English newspaper (Business Standard - All India editions) and vernacular Kannada newspaper (Kannnada Prabha - Bangalore edition).
Financial results, duly approved by the Board, are forwarded to the Stock Exchanges (BSE & NSE) and also displayed on Company’s Website www.tdps.co.in. Along with the financial results, other information as per the Listing Agreement/ SEBI (Listing Obligations and Disclosure Requirements) Regulations, 2015 such as Annual Report, Shareholding Pattern and official news/press releases are filed with BSE on http://listing.bseindia.com and with NSE through https://www.connect2nse.com /LISTING/ (NSE Electronic Application Processing System (NEAPS)) and also on companies website www.tdps.co.in. The Company conducts earnings calls after the board meeting to discuss financial results of the Company for the quarter, half year and year ended. The presentations made to the institutional investors or analysts, if any, are sent to Stock Exchanges and uploading the same on the website of the Company www.tdps.co.in.
BSE Limited, P J Towers, Dalal Street, Mumbai 400 001
533553
National Stock Exchange of India Limited, Bandra-Kurla Complex, Bandra (East), Mumbai 400 051
TDPOWERSYS
ISIN No. INE419M01019
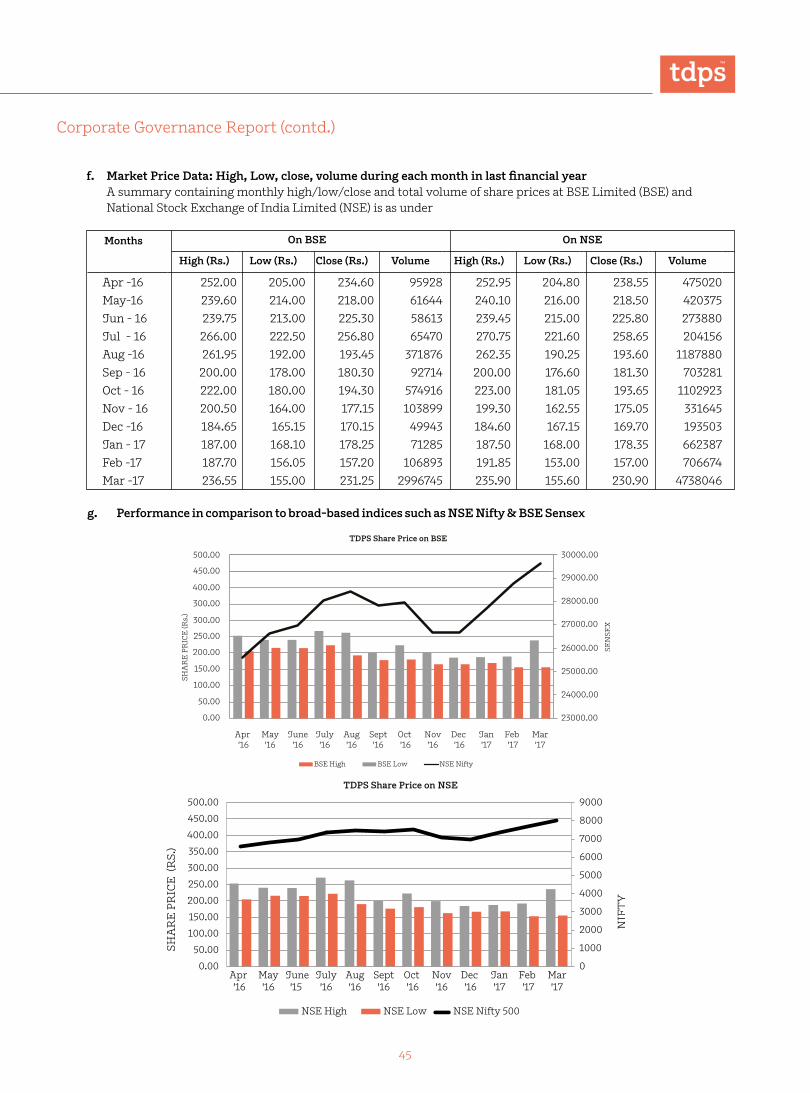
45
Corporate Governance Report (contd.)
f. Market Price Data: High, Low, close, volume during each month in last financial year A summary containing monthly high/low/close and total volume of share prices at BSE Limited (BSE) and National Stock Exchange of India Limited (NSE) is as under
Months On BSE On NSE
High (Rs.) Low (Rs.) Close (Rs.) Volume High (Rs.) Low (Rs.) Close (Rs.) Volume
Apr -16 252.00 205.00 234.60 95928 252.95 204.80 238.55 475020May-16 239.60 214.00 218.00 61644 240.10 216.00 218.50 420375Jun - 16 239.75 213.00 225.30 58613 239.45 215.00 225.80 273880Jul - 16 266.00 222.50 256.80 65470 270.75 221.60 258.65 204156Aug -16 261.95 192.00 193.45 371876 262.35 190.25 193.60 1187880Sep - 16 200.00 178.00 180.30 92714 200.00 176.60 181.30 703281Oct - 16 222.00 180.00 194.30 574916 223.00 181.05 193.65 1102923Nov - 16 200.50 164.00 177.15 103899 199.30 162.55 175.05 331645Dec -16 184.65 165.15 170.15 49943 184.60 167.15 169.70 193503Jan - 17 187.00 168.10 178.25 71285 187.50 168.00 178.35 662387Feb -17 187.70 156.05 157.20 106893 191.85 153.00 157.00 706674Mar -17 236.55 155.00 231.25 2996745 235.90 155.60 230.90 4738046
g. Performance in comparison to broad-based indices such as NSE Nifty & BSE Sensex

TD Power Systems Limited
46
Corporate Governance Report (contd.)
h. Registrar and Transfer Agents (RTA)
Link Intime India Private Limited C 101, 247 Park, L B S Marg, Vikhroli West, Mumbai 400 083 Tel No: +91 22 49186000
i. Share Transfer System Share transfers are registered and returned in the normal course within a period of 15 days from the
date of receipt. Requests for dematerialization of shares are processed and confirmation thereof is given to the respective depositories i.e. National Securities Depository Ltd. (NSDL) and Central Depository Services India Limited (CDSL) within the statutory time limit from the date of receipt of share certificates provided the documents are complete in all respects.
Note: The above statement of distribution of shareholding as on 31.03.2017 is as provided by the Registrar & Share Transfer Agents, Link Intime India Private Limited.
Shareholding of Nominal Shares
Shareholders % to Total Shareholders
Total Shares % of Paid up Capital
1 to 500 5669 81.3110 621087 1.87501 to 1000 629 9.0218 505127 1.521001 to 2000 298 4.2742 455634 1.372001 to 3000 97 1.3913 242291 0.733001 to 4000 55 0.7889 196530 0.594001 to 5000 36 0.5164 169010 0.515001 to 10000 84 1.2048 624762 1.88Above 10000 104 1.4917 30423147 91.53Total 6972 100.00 33237588 100.00
k . Dematerialisation of Shares and Liquidity as on March 31, 2017
Description No. of Holder No. of Shares % of Equity
Physical 1 2 0.00
NSDL 3942 22340552 67.21CDSL 3029 10897034 32.79Total 6972 33237588 100.00
l . Shareholding pattern as on March 31, 2017
Sl. No. Category Number of Shares % of Holding
(A) Promoters & Promoters Group 1 Promoters(1a) Individual (Indian Nationals) 8369624 25.18(1b) Individual (Foreign National) 3235254 9.73(1c) Body Corporate 5026433 15.122 Promoters Group 1334252 4.02
Total (A1 + A2) 17965563 54.05(B) Public Shareholding1 Mutual Funds 6737168 20.272 Foreign portfolio Investors 1716795 5.173 Financial Institutions / Banks 10489 0.034 Individuals 3086176 9.285 Others 3721397 11.20
Total B 15272025 45.95Grand Total (A + B) 33237588 100.00
j. Distribution of shareholding as on March 31, 2017

47
Corporate Governance Report (contd.)
m. Outstanding GDRs/ADRs/Warrants or any Convertible instruments, conversion date and likely impact on equity
No outstanding GDRs/ADRs/Warrants or any Convertible instruments
n. Commodity price risk or Foreign exchange risk and hedging activities - Nil
o. Registered Office & Factory Unit I: # 27, 28 & 29 KIADB Industrial Area, Dabaspet, Nelamangala Taluk, Bangalore, Karnataka - 562 111
Unit II: Sy. No. 59/2, Yedehalli Village Nelamangala Taluk, Sompura Hobli Dabaspet, Bangalore, Karnataka - 562 111
p. Compliance Officer
N. Srivatsa Company Secretary & Compliance Officer
q. Address for correspondence Shareholders/Beneficial owners are requested to correspond with the Company’s RTA (Registrar & Share Transfer Agents) with respect to any query, request, information or clarification pertaining to shares and are further advised to quote their folio number, DP & Client ID number as the case may be, in all correspondence with it. In addition to the RTA, the shareholders may correspond at the following addresses.
Registered Office & Factory TD POWER SYSTEMS LIMITED # 27, 28 & 29 KIADB Industrial Area Dabaspet, Nelamangala Taluk Bangalore, Karnataka - 562 111 Ph.: + 091-080-2299 5700 Fax: 091-080-2299 5718
VIII. Other Disclosure1. Details of non-compliance by the Company, penalties, strictures imposed on the Company by the Stock Exchange(s) The equity shares of the Company are listed on BSE Limited, Mumbai and National Stock Exchange of India Limited, Mumbai, and the Company has complied with all the applicable requirements of capital markets and no penalties or strictures have been imposed on the Company by Stock Exchanges, SEBI or any other statutory authority, on any matter relating to the capital markets, during the last three years.
2. CEO / CFO Certification As required by SEBI (Listing Obligations and Disclosure Requirements) Regulations, 2015 the Managing Director and Chief Financial Officer of the Company have certified to the Board of Directors, inter alia, the accuracy of financial statements and adequacy of internal controls for the financial reporting purpose as required under the Listing Agreement / LODR, for the year ended March 31, 2017 The said certificate forms part of this report
3. Compliance certificate from Practicing Company Secretary As required by schedule V of the SEBI (Listing Obligations & Disclosure Requirements) Regulations, 2015 (LODR), the certificate from Mr. Sudhir V. Hulyalkar, Practicing Company Secretary, Bangalore, confirming compliance of conditions on Corporate Governance as per LODR is form part of this report.
4. Accounting treatment in preparation of Financial Statements The guidelines / Accounting Standards (AS) laid down by the Institute of Chartered Accountants of India (ICAI) and prescribed under Section 133 of the Companies Act, 2013 have been followed in preparation of the financial statements of the Company in all material respects.
5. Code for prevention of Insider Trading/Fair Disclosure Pursuant to the SEBI (Prohibition of Insider Trading) Regulations, 2015 (“SEBI PIT Regulations”), the Company has adopted a Code for Prevention of Insider Trading. The objective of the code is to restrict an insider from dealing in the shares of the Company either directly or indirectly when in possession of unpublished price sensitive information (UPSI) and also to restrict communication of such UPSI. The code is applicable to the directors and designated employees. The code enumerates the procedure to be followed for dealing in the shares of the Company and periodic disclosures to be made. It also restricts the insiders from dealing in the company’s shares during the period when the ‘Trading Window’ is announced closed. The Company Secretary has been designated as the Compliance Officer.
In terms of the SEBI PIT Regulations a Code of practices and procedures for fair disclosure of Unpublished Price Sensitive Information has been formulated by the Company and available on company’s website www.tdps.co.in.

TD Power Systems Limited
48
Corporate Governance Report (contd.)
6. Management Discussion and Analysis Report The Management Discussion and Analysis report forms part of Directors’ Report as Annexure 9.
7. Whistle Blower Policy / Vigil Mechanism The Company is committed to ethical and lawful business conduct which is not only critical to the Company’s success, but also a fundamental shared value of its Board of Directors (the “Board”), senior management personnel and employees. Consistent with these principles, the Board has adopted a Code of Business conduct and Ethics (the “Code”) as a guide to the principles and standards that should govern the actions of its Board and senior management personnel.
Any actual or potential violation of the Code or any deviation from the key company policies howsoever insignificant or perceived as such, is a matter of serious concern for the Company and should be reported appropriately for remedial / penal action.
To enable reporting (Whistle blowing) of actual or potential violation of the Code or any deviation from the key company policies, a fair and proactive mechanism is imperative fortified by an appropriate protection policy.
This Whistle Blower Policy & Vigil Mechanism (“the Policy” or “this Policy”) has been formulated with a view to provide a mechanism for Directors/ Employees of the Company to approach the Chairperson of the Audit Committee of the Company or Chairman of the Company. Vigil Mechanism as envisaged in the Companies Act, 2013 and the Rules prescribed is implemented through this Whistle Blower Policy to provide for adequate safeguards to the whistle blowers against victimization of persons who use such mechanism and make provision for direct access to the Chairperson of the Audit Committee in terms of Regulation 22 of SEBI (Listing Obligations and Disclosure Requirements), Regulations 2015 and Section 177 of the Companies Act, 2013.
The above policy is available on our website www. tdps.co.in.
8. Board Diversity
The Company recognises the benefits of a Board that possesses a balance of skills, experience, expertise and diversity of perspectives appropriate to the requirements of the business of the Company.
The Company maintains that Board appointment should be based on merit that complements and expands the skills, experience and expertise of
the Board as a whole, taking into account gender, age, professional experience and qualifications, cultural and educational background, and any other factors that the Board might consider relevant and applicable from time to time towards achieving a diverse Board.
The Nomination and Remuneration Committee (the “Committee”) is responsible for reviewing and assessing the composition and performance of the Board, as well as identifying appropriately qualified persons to occupy Board positions.
The Board of Directors of the Company have an optimum combination of Executive and Non-Executive Directors with at least one Woman Director and the composition of the Board shall be in accordance with requirements of the Articles of Association of the Company, the Companies Act, 2013, Listing Regulation and the statutory, regulatory obligations of the Company. The Board Diversity Policy is available on our website www.tdps.co.in
9. E-Voting In compliance of the Companies Act, 2013 and Regulation 44 of SEBI (Listing Obligations and Disclosure Requirements), Regulations 2015 the Company provides e-voting facility to its shareholders, in respect of all shareholders’ resolutions, to be passed at General Meeting. The procedure / instructions for e-voting are included in the Notice of the ensuing Annual General Meeting of the Company.
10. Mandatory Requirements The Company has complied with all the mandatory requirements specified in Regulations 17 to 27 and clauses (b) to (m) and (o) of sub regulation (2) of Regulation 46 of the Listing Regulations. The company has complied compliance requirement of corporate governance under Sub para 2 to 10 of corporate governance report in respect of schedule V of LODR.
11. Discretionary Requirements The status of adoption of the discretionary requirements as specified in sub regulation 1 of Regulation 27 of the Listing Regulations are as follows: • Separate posts of Chairman and CEO - The Chairman and Managing Director/ CEO are two separate persons.
• Reporting of Internal Auditor - The Internal Auditor reports directly to the Audit Committee.
• Audit Qualifications - The Company has unqualified financial statements during the financial year 2016-17.

49
Corporate Governance Report (contd.)
12. Information through Company’s Website The disclosures as stipulated under Clause (b) to (i) of Sub regulation 2 of regulation 46 of the SEBI LODR has been disseminated on the company’s website.
For and on behalf of the Board of Directors
Mohib N. Khericha Chairman
K. G. Prabhakar Director & CFO
Nikhil Kumar Managing Director
N. Srivatsa Company Secretary
Bangalore May 18, 2017
Compliance certificate by Chief Executive Officer and Chief Financial Officer as per Regulation 17(8) of the SEBI (Listing Obligations and Disclosure Requirements) Regulations, 2015
K. G. PrabhakarDirector & CFO
Nikhil Kumar Managing Director
BangaloreMay 18, 2017
The Board of Directors TD Power Systems Limited (Company) # 27, 28 & 29, KIADB Industrial Area Dabaspet, Nelamangala Taluk Bangalore 562 111
This is to certify that:
A. We have reviewed financial statements and the cash flow statement for the year ended March 31, 2017 and that to the best of our knowledge and belief:
1. These statements do not contain any materially untrue statement or omit any material fact or contain statements that might be misleading;
2. These statements together present a true and fair view of the listed entity’s affairs and are in compliance with existing accounting standards, applicable laws and regulations.
B. There are, to the best of our knowledge and belief, no transactions entered into by the company during the year which are fraudulent, illegal or violative of the company’s code of conduct.
C. We accept responsibility for establishing and maintaining internal controls for financial reporting and that we have evaluated the effectiveness of internal control systems of the company pertaining to financial reporting and we have disclosed to the auditors and the audit committee, deficiencies in the design or operation of such internal controls, if any, of which we are aware and the steps we have taken or propose to take to rectify these deficiencies.
D. We have indicated to the auditors and the Audit committee
1. That there have been no significant changes in internal control over financial reporting during the year;
2. That there have been no significant changes in accounting policies during the year needing specific disclosure in the notes to the financial statements; and
3. The instances of significant fraud of which we have become aware and confirmed that no member of the management or an employee having a significant role in the listed entity’s internal control system over financial reporting is involved therein.

TD Power Systems Limited
50
Corporate Governance Report (contd.)
Declaration pursuant to SEBI (Listing Obligations and Disclosure Requirements) Regulations, 2015, regarding adherence to the Code of Business Conduct and Ethics
The Board of Directors TD Power Systems Limited (Company) # 27, 28 & 29 KIADB Industrial Area Dabaspet, Nelamangala Taluk Bangalore 562 111
On the basis of the written declarations received from members of the board and senior management personnel in terms of the relevant provisions of SEBI (Listing Obligations and Disclosure Requirements) Regulations, 2015, it is hereby certified that, for the year ended March 31, 2017, both the members of the board and the senior management personnel of the company have affirmed compliance with the respective provisions of the Code of Business Conduct and Ethics of the Company, as laid down by the board.
Nikhil Kumar Managing Director
BangaloreMay 18, 2017
Certificate on Corporate Governance
To The Members, TD Power Systems LimitedBangalore
I have examined the compliance of conditions of corporate governance, as stipulated in Securities and Exchange Board India (Listing Obligations and Disclosure Requirements) Regulations, 2015 by TD Power Systems Limited (the Company) for the year ended on March 31, 2017.
The compliance of conditions of corporate governance is the responsibility of the management. My examination was limited to procedures and implementation thereof, adopted by the company for ensuring the compliance of the conditions of the Corporate Governance. It is neither an audit nor an expression of opinion on the financial statements of the Company.
In my opinion and to the best of my information and according to the explanations given to me, I certify that the company has complied with all the applicable conditions of Corporate Governance as stipulated in the Securities and Exchange Board India (Listing Obligations and Disclosure Requirements) Regulations, 2015.
I further state that such compliance is neither an assurance as to future viability of the Company nor the efficiency or effectiveness with which the management has conducted the affairs of the company.
Sudhir Vishnupant Hulyalkar Company Secretary in PracticeFCS No: 6040. CP No. 6137
BangaloreMay 18, 2017

51
STANDALONE FINANCIAL STATEMENTS

TD Power Systems Limited
52
Report on the Standalone Financial StatementsWe have audited the accompanying standalone financial statements of TD Power Systems Limited (“the Company”) which comprise the Balance Sheet as at March 31, 2017, the Statement of Profit and Loss and the Cash Flow Statement for the year then ended and a summary of significant accounting policies and other explanatory information, in which are incorporated the Returns for the year ended on that date audited by the branch auditors of the Company’s branch at Japan.
Management’s Responsibility for the Standalone Financial Statements The Company’s Board of Directors is responsible for the matters stated in Section 134(5) of the Companies Act, 2013 (“the Act”) with respect to the preparation of these standalone financial statements that give a true and fair view of the financial position, financial performance and cash flows of the Company in accordance with the accounting principles generally accepted in India, including the Accounting Standards specified under Section 133 of the Act, read with Rule 7 of the Companies (Accounts) Rules, 2014. This responsibility also includes maintenance of adequate accounting records in accordance with the provisions of the Act for safeguarding the assets of the company and for preventing and detecting frauds and other irregularities; selection and application of appropriate accounting policies; making judgements and estimates that are reasonable and prudent; and design, implementation and maintenance of adequate internal financial controls, that were operating effectively for ensuring the accuracy and completeness of the accounting records, relevant to the preparation and presentation of the financial statements that give a true and fair view and are free from material misstatement, whether due to fraud or error.
Auditor’s ResponsibilityOur responsibility is to express an opinion on these standalone financial statements based on our audit.
We have taken into account the provisions of the Act, the accounting and auditing standards and matters which are required to be included in the audit report under the provisions of the Act and the Rules made thereunder.
We conducted our audit in accordance with the Standards on Auditing specified under Section 143(10) of the Act. Those Standards require that we comply with ethical requirements and plan and perform the audit to obtain reasonable assurance about whether the financial statements are free from material misstatement.
An audit involves performing procedures to obtain audit evidence about the amounts and the disclosures in the
INDEPENDENT AUDITORS’ REPORT TO THE MEMBERS OF TD POWER SYSTEMS LIMITED
financial statements. The procedures selected depend on the auditor’s judgment, including the assessment of the risks of material misstatement of the financial statements, whether due to fraud or error. In making those risk assessments, the auditor considers internal financial control relevant to the Company’s preparation of the financial statements that give a true and fair view in order to design audit procedures that are appropriate in the circumstances. An audit also includes evaluating the appropriateness of the accounting policies used and the reasonableness of the accounting estimates made by the Company’s Directors, as well as evaluating the overall presentation of the financial statements.
We believe that the audit evidence we have obtained is sufficient and appropriate to provide a basis for our audit opinion on the standalone financial statements.
OpinionIn our opinion and to the best of our information and according to the explanations given to us, the aforesaid standalone financial statements give the information required by the Act in the manner so required and give a true and fair view in conformity with the accounting principles generally accepted in India of the state of affairs of the Company as at March 31, 2017, and its profit and its cash flows for the year ended on that date.
Other MatterWe did not audit the financial statements of Japan branch included in the standalone financial statements of the Company whose financial statements reflect total assets of Rs.20,92,21,734/- as at 31st March , 2017 and total revenues of Rs.52,73,67,661/- for the year ended on that date, as considered in the standalone financial statements. The financial statements of the branch has been audited by the branch auditors whose report has been furnished to us, and our opinion in so far as it relates to the amounts and disclosures included in respect of the branch, is based solely on the report of such branch auditors.
Our opinion is not modified in respect of this matter. The company has provided requisite disclosures in the financial statements as to holdings as well as dealings in Specified Bank Notes during the period from 8th November, 2016 to 30th December, 2016. Based on audit procedures and relying on the management representation we report that the disclosures are in accordance with books of accounts maintained by the company and produced as to us by the management – Refer note 37
Report on Other Legal and Regulatory Requirements 1. As required by the Companies (Auditor’s Report) Order, 2016 (“the Order”) issued by the Central Government of India in terms of Sub-Section (11) of Section 143 of the

53
Independent Auditors’ Report (contd.)
For B. K. RAMADHYANI & CO. LLP. Chartered Accountants
Firm Registration No. 002878S/S200021
R. SATYANARAYANA MURTHI Partner
Membership No. 024248Bangalore May 18, 2017
Act, we give in the annexure A a statement on the matters specified in paragraphs 3 and 4 of the Order.
2. As required by the Section 143(3) of the Act, we report that: a. We have sought and obtained all the information and explanations which to the best of our knowledge and belief were necessary for the purpose of our audit.
b. In our opinion, proper books of account as required by law have been kept by the Company so far as it appears from our examination of those books and proper returns adequate for the purposes of our audit have been received from the branches not visited by us.
c. The reports on the accounts of the branch offices of the Company audited under Section 143(8) of the Act by branch auditors have been sent to us and have been properly dealt with by us in preparing this report.
d. The Balance Sheet, the Statement of Profit and Loss, and the Cash Flow Statement dealt with by this Report are in agreement with the books of account and with the returns received from the branch not visited by us.
e. In our opinion, the aforesaid standalone financial statements comply with the Accounting Standards specified under Section 133 of the Act, read with Rule 7 of the Companies (Accounts) Rules, 2014.
f. On the basis of the written representations received from the directors as on March 31, 2017 taken on the
record by the Board of Directors, none of the directors is disqualified as on that date from being appointed as a director in terms of Section 164(2) of the Act.
g. With respect to the adequacy of the internal financial controls over financial reporting of the Company and the operating effectiveness of such controls, refer to our separate report in annexure B. Our report expresses an unmodified opinion on the adequacy and operating effectiveness of the Company’s internal financial controls over financial reporting.
h. With respect to other matters to be included in the Auditors report in accordance with Rule 11 of the Companies (Audit and Auditors) Rules, 2014, in our opinion and to the best of our information and according to the explanations given to us,
i. The Company does not have any pending litigations which would impact its financial position; - Refer Note 37(a) to the financial statements.
ii. The Company did not have any long-term contracts including derivative contracts for which there were any material foreseeable losses – Refer Note 37(b) to the financial statements.
iii. There were no amounts outstanding as on March 31, 2017 which were required to be transferred to the Investor Education and Protection Fund by the Company. - Refer Note 37(c) to the financial statements.
INTENTIONALLY LEFT BLANK

TD Power Systems Limited
54
i a. The Company has maintained proper records showing full particulars, including quantitative details and situation of fixed assets. b. The management during the year has physically verified all the fixed assets. We have been informed by the management that no material discrepancies were observed. c. According to the information and explanations given to us, the title deeds of immovable properties are held in the name of the Company.
ii. Inventories have been physically verified during the year by the management. We have been informed by the management that no material discrepancies were observed.
iii. According to the information and explanations given to us, the Company has granted unsecured loans to its foreign subsidiaries. a. According to the information and explanations given to us, the terms and conditions of the above loans are not prejudicial to the interests of the Company. b. We have been informed that the schedule of repayment of principal and payment of interest has been stipulated and the same are being followed regularly. c. According to the information and explanations given to us, no amount is overdue to be received from the subsidiary.
iv. The Company has not given any loans, guarantees or securities to directors during the year and accordingly the provisions of sections 185 of the Act are not applicable. In respect of loans given to foreign subsidiary, the provisions of section 186 of the Act have been complied with.
v. In our opinion, and according to the information and explanations given to us, the Company has not accepted any deposits from the public. Accordingly, the provisions of paragraph 3(v) of the Order is not applicable.
vi. To the best of our knowledge and explanations given to us, the Central Government has not prescribed the maintenance of cost records under clause (d) of Sub- Section (1) of Section 148 of the Act for the products of the company. Accordingly, the provisions of clause 3(vi) of the said Order are not applicable.
vii. According to the information and explanations given to us and the records of the Company examined by us, the Company is generally regular in depositing undisputed statutory dues applicable to it with the appropriate authorities. In terms of its books of account, no undisputed statutory dues payable in respect of provident fund, employees’ state insurance, income tax, sales tax, service tax, customs duty, excise duty, value added tax, cess and any other statutory dues were outstanding, as at March 31, 2017 for a period of more than six months from the date they became payable.
Annexure A referred to in Paragraph 1 under the heading “Report on other legal and regulatory requirements” of our report to the members of TD Power Systems Limited.
According to the records of the Company and according to the information and explanations given to us, there were no dues outstanding on account of income tax, service tax, sales tax, customs duty, excise duty on account of dispute.
viii. According to the information and explanations given to us, the Company has not taken any term loans from financial institution, banks, Government or issued debentures, hence provisions of clause 3 (viii) of the Order is not applicable.
ix. The Company has not raised any money during the year by way of initial public offer or further public offer or by way of term loans. Accordingly, the provisions of paragraph 3(ix) of the Order is not applicable.
x. According to the information and explanations given to us, no fraud by/on the Company by its officers and employees has been noticed or reported during the year.
xi. According to the information and explanations given to us, managerial remuneration has been provided in accordance with the approvals mandated by the provisions of section 197 read with Schedule V to the Act.
xii. The Company is not a Nidhi company and accordingly, provisions of paragraph 3(xii) of the Order is not applicable.
xiii. According to the information and explanations given to us, transactions during the year with related parties are in compliance with sections 188 of Act. Details of transactions with related parties have been disclosed in the financial statements as required by the applicable accounting standards.
xiv. According to the information and explanations given to us, the Company has not made any preferential allotment or private placement of shares or fully or partly convertible debentures during the year under review. Accordingly, the provisions of the paragraph 3(xiv) of the Order is not applicable.
xv. According to the information and explanations given to us, the Company has not entered into any non-cash transactions with directors or persons connected with him/her. Accordingly, the provisions of the paragraph 3(xiv) of the Order is not applicable.
xvi. According to the information and explanations given to us, the Company is not required to be registered under section 45-IA of the Reserve Bank of India Act, 1934.
For B. K. RAMADHYANI & CO. LLP. Chartered Accountants
Firm Registration No. 002878S/S200021
R. SATYANARAYANA MURTHI Partner
Membership No. 024248Bangalore May 18 , 2017

55
For B. K. RAMADHYANI & CO. LLP. Chartered Accountants
Firm Registration No. 002878S/S200021
R. SATYANARAYANA MURTHI Partner
Membership No. 024248
Report on the Internal Financial Controls under Clause (i) of Sub-section 3 of Section 143 of the Companies Act, 2013 (“the Act”)
We have audited the internal financial controls over financial reporting of TD Power Systems Limited (“the Company”) as of March 31, 2017 in conjunction with our audit of the financial statements of the Company for the year ended on that date.
Management’s Responsibility for Internal Financial ControlsThe Company’s management is responsible for establishing and maintaining internal financial controls based on the internal control over financial reporting criteria established by the Company considering the essential components of internal control stated in the Guidance Note on Audit of Internal Financial Controls Over Financial Reporting (the “Guidance Note”) issued by the Institute of Chartered Accountants of India (ICAI). These responsibilities include the design, implementation and maintenance of adequate internal financial controls that were operating effectively for ensuring the orderly and efficient conduct of its business, including adherence to company’s policies, the safeguarding of its assets, the prevention and detection of frauds and errors, the accuracy and completeness of the accounting records, and the timely preparation of reliable financial information, as required under the Act.
Auditors’ ResponsibilityOur responsibility is to express an opinion on the Company’s internal financial controls over financial reporting based on our audit. We conducted our audit in accordance with the Guidance Note and the Standards on Auditing, issued by ICAI and deemed to be prescribed under section 143(10) of the Act, to the extent applicable to an audit of internal financial controls, both applicable to an audit of internal financial controls and, both issued by the ICAI. Those Standards and the Guidance Note require that we comply with ethical requirements and plan and perform the audit to obtain reasonable assurance about whether adequate internal financial controls over financial reporting was established and maintained and if such controls operated effectively in all material respects.
Our audit involves performing procedures to obtain audit evidence about the adequacy of the internal financial controls system over financial reporting and their operating effectiveness. Our audit of internal financial controls over financial reporting included obtaining an understanding of internal financial controls over financial reporting, assessing the risk that a material weakness exists, and testing and evaluating the design and operating effectiveness of internal control based on the assessed risk. The procedures selected depend on the auditor’s judgement, including the assessment of the risks of material misstatement of the financial statements, whether due to fraud or error.
Annexure B referred to in Paragraph 2 (g) under the heading “Report on other legal and regulatory requirements” of our report to the members of TD Power Systems Limited
We believe that the audit evidence we have obtained is sufficient and appropriate to provide a basis for our audit opinion on the Company’s internal financial controls system over financial reporting.
Meaning of Internal Financial Controls over Financial ReportingA company’s internal financial control over financial reporting is a process designed to provide reasonable assurance regarding the reliability of financial reporting and the preparation of financial statements for external purposes in accordance with generally accepted accounting principles. A company’s internal financial control over financial reporting includes those policies and procedures that (1) pertain to the maintenance of records that, in reasonable detail, accurately and fairly reflect the transactions and dispositions of the assets of the company; (2) provide reasonable assurance that transactions are recorded as necessary to permit preparation of financial statements in accordance with generally accepted accounting principles, and that receipts and expenditures of the company are being made only in accordance with authorisations of management and directors of the company; and (3) provide reasonable assurance regarding prevention or timely detection of unauthorised acquisition, use, or disposition of the company’s assets that could have a material effect on the financial statements.
Inherent Limitations of Internal Financial Controls over Financial Reporting
Because of the inherent limitations of internal financial controls over financial reporting, including the possibility of collusion or improper management override of controls, material misstatements due to error or fraud may occur and not be detected. Also, projections of any evaluation of the internal financial controls over financial reporting to future periods are subject to the risk that the internal financial control over financial reporting may become inadequate because of changes in conditions, or that the degree of compliance with the policies or procedures may deteriorate.
OpinionIn our opinion, the Company has, in all material respects, an adequate internal financial controls system over financial reporting and such internal financial controls over financial reporting were operating effectively as at March 31, 2017, based on the internal control over financial reporting criteria established by the Company considering the essential components of internal control stated in the Guidance Note issued by ICAI.
Bangalore May 18, 2017

TD Power Systems Limited
56
BALANCE SHEET AS AT MARCH 31, 2017
As at 31.03.2017 As at 31.03.2016
Note Rs. Rs. Rs. Rs.
EQUITY AND LIABILITIES
Shareholders' Funds
Share Capital 2 332,375,880 332,375,880
Reserves and Surplus 3 4,609,103,219 4,608,213,607
4,941,479,099 4,940,589,487
Non-current liabilities
Deferred tax liabilities (Net) 4 154,031,072 154,413,036
Long term provisions 5 37,909,182 37,524,421
191,940,254 191,937,457
Current Liabilities
Short term borrowings 6 453,428,002 276,415,453
Trade payables
- Total outstanding due of MSME 7 6,471,920 7,367,652
- Total outstanding due of Creditors other than MSME
1,028,223,633
1,095,736,044
Other current liabilities 8 657,099,989 896,502,619
Short term provisions 9 26,857,719 151,472,149
2,172,081,263 2,427,493,917
Total 7,305,500,616 7,560,020,861
ASSETSNon-current assets
Propety, plant and equipment
Tangible assets 10 2,304,823,427 2,535,953,143
Intangible assets 10 24,631,136 36,946,713
Capital work in progress 11 6,865,500 6,625,500
2,336,320,063 2,579,525,356
Non-current investments 12 290,611,820 277,630,320
Long term loans and advances 13 201,509,120 238,753,353
2,828,441,003 3,095,909,029
Current Assets
Inventories 14 799,822,954 803,304,237
Trade receivables 15 1,402,788,948 1,337,476,664
Cash and Bank Balance 16 1,903,089,916 1,921,932,833
Short term loans and advances 17 371,357,795 401,398,098
4,477,059,613 4,464,111,832
Total 7,305,500,616 7,560,020,861
Summary of Accounting Policies, other explanatory information & Notes attached form an integral part of the Balance Sheet
1-39
In Accordance with our Report attached
For B. K. RAMADHYANI & CO LLP. Chartered Accountants Firm Registration No. 002878S/S200021
R. Satyanarayana Murthi Partner - M. No. 024248
BangaloreMay 18, 2017
For and on behalf of Board of Directors
Mohib N. Khericha Chairman
Nikhil Kumar Managing Director
K. G. Prabhakar Director & Chief Financial Officer
N. Srivatsa Company Secretary

57
In Accordance with our Report attached
For B. K. RAMADHYANI & CO LLP. Chartered Accountants Firm Registration No. 002878S/S200021
R. Satyanarayana Murthi Partner - M. No. 024248
BangaloreMay 18, 2017
For and on behalf of Board of DirectorsMohib N. Khericha
ChairmanNikhil Kumar
Managing DirectorK. G. Prabhakar
Director & Chief Financial OfficerN. Srivatsa
Company Secretary
STATEMENT OF PROFIT AND LOSS FOR THE YEAR ENDED MARCH 31, 2017
Year Ended 31.03.2017
Year Ended 31.03.2016
Note Rs. Rs. Rs. Rs.
INCOMERevenue from Operations 19 3,694,402,616 4,553,501,729
Other Income 20 179,404,036 190,113,403
Total Revenue 3,873,806,652 4,743,615,132
EXPENSES Cost of materials consumed 21 2,187,038,376 2,485,097,267 Purchases for Project Business 269,996,445 549,328,726 Changes in inventories of finished goods, work in progress and stock in trade
22
22,809,370
91,008,926 2,479,844,191 3,125,434,919
Employee benefits expense 23 593,639,162 592,880,425 Finance costs 24 40,617,373 48,145,022 Depreciation and amortization expense
25
277,220,609
283,761,878
Other expenses 26 475,577,669 524,126,758 Total Expenses 3,866,899,004 4,574,349,002
Profit before tax 6,907,648 169,266,130
Tax expense Current tax ( MAT) 6,400,000 66,500,000 Less: MAT Credit Entitlement - 20,000,000
Net Current Tax 6,400,000 46,500,000 Deferred tax (381,964) (27,022,089)
6,018,036 19,477,911
Profit/(Loss) for the Year 889,612 149,788,219
Earning per equity share 28 Basic & Diluted 0.03 4.51
Summary of Accounting Policies, other explanatory information & Notes attached form an integral part of the Statement of Profit & Loss
1-39

TD Power Systems Limited
58
CASH FLOW STATEMENT FOR THE YEAR ENDED 31ST MARCH 2017
Rs.Current Year
Rs.Rs.
Previous Year Rs.
A Cash flow from operating activities
Net Profit before tax and extraordinary items 6,907,648 169,266,130
Adjustments forDepreciationAmortisation(Profit) / Loss on sale of Property, plant & equipmentDividend IncomeInterest IncomeInterest PaymentsProvision for Warranty ClaimsProvision for Doubtful DebtsProvision for Gratuity & Leave Encashment
264,905,032 12,315,577
7,759
(6,000) (120,347,335)
40,617,373 22,615,498
- 10,117,642
230,225,546
271,446,302 12,315,576 (1,416,635)
(6,000)
(105,926,005) 48,145,022
3,094,316 51,121,835 32,758,139
311,532,550 Operating profit before Working Capital Changes 237,133,194 480,798,680
Adjustments for Trade ReceivablesOther ReceivablesInventoriesTrade PayablesCash generated from Operations Refund of Income TaxDirect Taxes PaidNet Cash Flow from Operating Activities
(65,312,283) (23,898,190)
3,481,283 (271,891,808)
- 3,130,136
(357,620,998) (120,487,804)
3,130,136
(123,617,940)
(247,678,355)
145,997,308 (43,095,493)
91,559,165
(100,359,854) 26,011,414
(53,217,375) 427,581,305
(74,348,440) 501,929,745
B Cash flow from Investing Activities
Purchase of Property, plant and equipmentPurchase of InvestmentsSale of property, plant and equipmentDividend ReceivedInterest ReceivedNet Cash used in investing activities
(34,998,605) (12,981,500)
9,915,919 6,000
128,450,168
90,391,982
(171,160,280) (13,082,825)
10,836,033 6,000
123,751,708
(49,649,364)
C Cash flow from financing activities
Working Capital borrowingsInterest PaidDividend and Tax on Dividend paidNet Cash flow from financing activities
Net increase/decrease in cash & cash equivalentsCash and cash equivalents at the beginningCash and cash equivalents at close
177,012,549 (40,617,373)
(122,012,135)
14,383,041 (18,842,917)
1,921,932,832 1,903,089,916
(297,098,430) (48,145,022)
(105,913,403)
(451,156,855)
1,123,526 1,920,809,307 1,921,932,833
Note Cashflows are reported using the indirect method. Cash and cash equivalents is after adjusting translation gain/loss.
For and on behalf of Board of DirectorsMohib N. Khericha
ChairmanNikhil Kumar
Managing Director
K. G. Prabhakar Director & Chief Financial Officer
N. Srivatsa Company Secretary
As per our report of even date
For B. K. RAMADHYANI & CO. LLP. Chartered Accountants Firm Registration No. 002878S/S200021
R. Satyanarayana Murthi Partner - M. No. 024248
BangaloreMay 18, 2017

59
SUMMARY OF ACCOUNTING POLICIES AND OTHER EXPLANATORY INFORMATION FOR THE YEAR ENDED MARCH 31, 2017
1 Significant Accounting Policies Consequent to a Special Resolution of the Members, passed at the Company’s Extra Ordinary General Meeting held on 17th January 2011, the Company is converted to a Public Limited Company by altering its Articles of Association in terms of Section 31 read with Section 44 of the Companies Act 1956, and a fresh Certificate of Incorporation dated 04th February 2011 is issued by the Registrar of Companies, Karnataka.
The company’s subscription to the Share Capital of its Wholly Owned Subsidiaries reflected as trade investments as on 31st March 2017 are as follows: a. 80,100 Equity Shares of USD 10- each - TD Power Systems (USA) Inc. b. 2000 Equity Share of JPY 10,000 each - TD Power Systems Japan Limited c. 350,000 * Equity Share of Euro 1 each - TD Power Systems Europe GmbH (* erstwhile Platin 1255 GmbH acquired by the company in January 2016)
1.1 Basis of Preparation of Financial Statements The financial statements of the Company have been prepared under historical cost convention method, in accordance with the Generally Accepted Accounting Principles (GAAP) applicable in India and the provisions of the Companies Act, 2013. The preparation of financial statements in conformity with GAAP requires management to make estimates and assumptions that affect the reported amounts of assets and liabilities, disclosures of contingent liabilities as at the date of the financial statements, and the reported amounts of revenue and expenses during the reported period.
1.2 A. Property, plant and equipment
All items of Property, Plant and Equipment’s are carried at cost less accumulated depreciation / amortization and impairment losses, if any. The cost of Property, Plant and Equipment’s are stated at cost of acquisition excluding vatable duties, inclusive of freight, taxes and incidental expenses relating to the acquisition and finance cost on borrowings utilized for acquisition of qualifying Property, Plant and Equipment’s.
Property, Plant and Equipment’s manufactured internally are capitalized at Factory Cost.
Capital work in progress:
Property, Plant and Equipment’s which are not yet ready for their intended use are carried at cost, comprising direct cost and related incidental expenses
B. Depreciation Depreciation on tangible assets is provided using straight line method (SLM) with reference to the estimated useful life of the Property, Plant and Equipment’s less its residual value as prescribed under Schedule II of The Companies Act 2013, or actual useful life of the asset, whichever is lower. Property, plant and equipment’s costing below Rs. 5,000/- are depreciated fully. Depreciation is charged for complete quarter on addition / deletion.
C. Amortisation of Technical Know-how Fee /Licence Fee. Technical Know-how Fees is amortised over a period of 60 months1.3 Inventories Inventories are valued at cost or net realizable value, which ever is lower. Raw materials and bought out items are valued on first in first out basis as per Accounting Standard - 2 and includes material cost, carriage inward, insurance and purchase related expenses. Cost in respect of work in progress and finished goods are based on works cost.
1.4 Revenue Recognition a). Sale of manufactured goods is recognized on shipment to customers, and exclusive of excise duty and sales tax. b). Sale of goods in case of project business is recognised on shipment to customers. c). Erection and commissioning income is recognised as and when the services are performed/ completed. d). Interest income is recognised based on time proportion basis. e). Dividend income is recognised when the right to receive the dividend is established.
1.5 Foreign currency transactions a). Foreign currency transactions are translated into Indian rupees at the exchange rate prevailing on the date of the transaction. b). Monetary foreign currency assets and liabilities outstanding at the end of the year are restated at the exchange rates prevailing on the reporting date. All exchange differences are accounted for in the Statement of Profit and Loss. c). Non monetary items denominated in foreign currency, are valued at the exchange rate prevailing on the date of transaction. d). In respect of overseas branches, which are integral foreign operations, financial statements are translated as if the transactions are those of the Company itself.

TD Power Systems Limited
60
Summary of Accounting Policies and Other Explanatory Information (contd.)
1.6 Taxes on Income Provision for tax is made in terms of Accounting Standard 22 for both current and deferred tax. Provision for current income tax if arises is made at the current tax rates based on assessable income. Deferred tax is recognised on timing difference between the accounting income and the taxable income for the year and quantified using the tax rates and laws enacted or substantively enacted as on the Balance sheet date. Deferred tax assets are recognized and carried forward to the extent that there is a reasonable/virtual certainty that sufficient future taxable income will be available against which such deferred tax asset can be realized.
Minimum Alternate Tax (MAT) under the provisions of Income Tax Act, 1961, is recognised as current tax in the statement of Profit & Loss. The credit available under the Act in respect of MAT paid is recognised as an asset only when and to the extent there is convincing evidence that the compnay will pay normal Income Tax during the year for which MAT Credit can be carried forward for set-off against the normal tax liability. MAT Credit recognised as an asset is reviewed at each Balance Sheet date and written down to the extent the aforesaid convicing evidence no longer exists.
1.7 Borrowing Cost Interest and other borrowing cost on borrowings relatable to qualifying assets are capitalized up to the date such assets are ready for use. Other interest and borrowing cost are charged to Statement of Profit & Loss.
1.8 Contingent Liabilities Financial effects of contingent liabilities are disclosed based on information available up to the date on which financial statements are approved. However, where a reasonable estimate of financial effect cannot be made, suitable disclosures are made with regard to this fact and the existence and nature of the contingent liability.
1.9 Employees Benefits Long Term Employee Benefits a. Defined Contribution Plans The Company has contributed to provident fund, which is defined contribution plan. The contribution paid/payable under the scheme is recognised during the year in which an employee renders the related service. b. Defined Benefit Plans Employees gratuity and leave encashment are defined benefit plans. The present value of the obligations under such plan is determined based on
actuarial valuation using the Projected Unit Credit Method which considers each year of service as giving rise to an additional unit of benefit entitlement and measures each unit separately to build up the final obligation. Actuarial gain and losses are recognised immediately in the Statement of Profit & Loss as income or expense. Obligation is measured at present value of estimated future cash flows using a discounted rate that is determined by reference to market yields available on government bonds at the Balance Sheet date with the term that matches to the liabilities.
1.10 Impairment of Assets At each balance sheet date, the management reviews the carrying amount of its assets to determine whether there is any indication that those assets are impaired. If any such indication exists, the recoverable amount of the asset is estimated in order to determine the extent of impairment loss. Reversal of impairment loss, if any, is recognised immediately in the Statement of profit and loss.
1.11 Accounting for Lease i. Operating Lease Lease of assets under which all the risks and rewards of ownership are effectively retained by the lessor are classified as operating leases. Lease payments under operating leases are recognized as an expense on a straight-line basis over the lease term. ii. Finance Lease and Hire purchase transactions Lease rentals are charged to Statement of Profit and Loss over the period of Lease. Depreciation is provided on the primary period of the lease.
1.12 Investment Non-current investments are stated at cost. Provision for diminution if any, in the value of investments is made, to recognise a decline, other than temporary. Current investments are valued at lower of cost or market value.
1.13 Research & Development Expenditure on Research & Development activity undertaken is charged to the Statement of Profit & Loss as and when incurred during the year, to their natural head of accounts. The expenditure incurred includes cost of materials, salaries & wages and other revenue expenditure.
Capital Expenditure is categorised and disclosed separately as Research & Development, Property, Plant and Equipment and depreciation is charged as prescribed under Companies Act, 2013 discussed in para 1.2 above.

61
Other Information
I The Company has only one class of equity shares having par value of Rs. 10/- each. Each holder of equity shares is entitled to one vote per share. The Company declares and pays dividends in Indian rupees. The dividend proposed by the Board of Directors is subject to the approval of the shareholders in the ensuing Annual General Meeting.
II Equity shares include
a Shares allotted pursuant to a contract without consideration being received in cash. Issued to the shareholder of subsidiary company, DF Power Systems Private Limited, in exchange of 1,700,000 fully paid up equity shares of Rs. 10/- each on 19th October 2010
b Shares allotted by way of bonus shares. On Capitalisation out of Reserves to an extent of 16,246,934 Equity Shares of Rs. 10/- each on 11th January 2011.
As at 31.03.2017 As at 31.03.2016
Number Rs. Number Rs.
2. SHARE CAPITAL
AuthorizedEquity shares of Rs. 10/- each 35,000,000 350,000,000 35,000,000 350,000,000
350,000,000 350,000,000
Issued, subscribed and fully paid up Equity shares of Rs. 10/- each At the beginning of the year 33,237,588 332,375,880 33,237,588 332,375,880
Issued during the year - - - -
At the close of the year 33,237,588 332,375,880 33,237,588 332,375,880
Total 332,375,880 332,375,880
III
Particulars of equity share holders holding more than 5% of the total paid-up equity share capital
As at 31.03.2017 As at 31.03.2016
Percentage No. of shares
Percentage No. of shares
Saphire Finman Services LLP (Saphire Finman Services Private Limited)
15.12%
5,026,433
15.12%
5,026,433
Nikhil Kumar 13.96% 4,638,664 13.96% 4,638,664
Hitoshi Matsuo 9.73% 3,235,254 9. 3,235,254
Mohib N Khericha 11.23% 3,730,960 5.56% 1,846,860
Notes on Financial Statement for the year ended March 31, 2017
INTENTIONALLY LEFT BLANK

TD Power Systems Limited
62
As at 31.03.2017 As at 31.03.2016
Rs. Rs.
3. RESERVES AND SURPLUS
Securities PremiumAs at the beginning of the year 2,207,588,239 2,207,588,239 As at the end of the year 2,207,588,239 2,207,588,239
General ReserveAs at the beginning of the year 293,963,171 281,686,558 Add:Transferred from Statement of Profit and Loss - 12,276,613 As at the end of the year 293,963,171 293,963,171
Surplus i.e. balance in Statement of Profit & Loss As at the beginning of the year 2,106,662,197 2,091,162,729 Add:Transferred from Statement of Profit and Loss 889,612 149,788,216 Less:Transferred to General Reserve - 12,276,613 Proposed dividend - 101,374,643 Provision towards dividend distribution tax - 20,637,492
As at the end of the year 2,107,551,809 2,106,662,197
Total 4,609,103,219 4,608,213,607
4. DEFERRED TAX LIABILITY
Deferred tax liability On account of depreciation on property, plant & equipment 188,598,378 187,262,069 Total 188,598,378 187,262,069
Deferred tax asset
On account of timing differences in recognition of expenditure 34,567,306 32,849,033
Total 34,567,306 32,849,033
Net Deferred tax liability/(asset) 154,031,072 154,413,036
5. LONG TERM PROVISIONSProvisions for employee benefits - Leave Encashment 37,909,182 37,524,421
Total 37,909,182 37,524,421
6. SHORT TERM BORROWINGS
Secured Loans Loans repayable on demand - from banks 453,428,002 276,415,453
Total 453,428,002 276,415,453
Notes on Financial Statement for the year ended March 31, 2017 (contd.)

63
8. OTHER CURRENT LIABILITIES Provision for taxation 1,985,742 37,904,705 Unclaimed Dividends 129,025 86,004 Outstanding Liabilities 211,691,953 362,435,781 Duties and taxes payable 17,708,019 13,092,460 Trade advance received from customers 242,929,545 292,762,911 Earnest Money Deposit 215,000 215,000 Other liabilities 182,440,705 190,005,758
Total 657,099,989 896,502,619
As at 31.03.2017 As at 31.03.2016
Rs. Rs.
Short Term Borrowings (contd.)
Additional Information
Details of security for secured loans - Balance of Working Capital Loan from M/s Bank of Baroda as on reporting date - Secured by Hypothecation of Raw Materials, Goods-in-process, Finished Goods and Book Debts and a charge on property, plant and equipments of the company located at Unit I and Select Assets located on 4.33 acres of land on survey no. 59/2 at Unit II.
453,428,002
276,415,453 Loans repayable on demand Terms of repayment of secured loans - from banks 453,428,002 276,415,453 Interest at 2% over base rate (floating)
7. TRADE PAYABLESTo Micro, Small and Medium Enterprises 6,471,920 7,367,652 Others 1,028,223,633 1,095,736,044
Total 1,034,695,553 1,103,103,696
Additional InformationThe details of amounts outstanding to Micro, Small and Medium Enterprises under Micro Small and Medium Enterprises Development Act, 2006 (MSMED Act), based on the available information with the Company are as under:
1. Principal amount due and remaining unpaid 6,471,920 7,367,652
2. Interest due on (1) above and the unpaid interest - -
3. Interest paid on all delayed payments under the MSMED Act - -
4. Payment made beyond the appointed day during during the period/year 198,071 312,300
5. Interest due and payable for the period of delay other than (3) above 1,241 3,105
6. Interest accrued and remaining unpaid 1,241 3,105 7. Amount of further interest remaining due and payable in succeeding
years 22,197,772 22,196,531
Notes on Financial Statement for the year ended March 31, 2017 (contd.)

TD Power Systems Limited
64
PROPERTY, PLANT AND EQUIPMENTS - RESEARCH & DEVELOPMENT (Amt in Rs.)
Particulars Gross Block (At Cost) Depreciation Net Block
As at 01.04.2016
Additions during the
year
Deductions during the
year
As at 31.03.2017
As at 01.04.2016
Additions Withdrawals As at 31.03.2017
As at 31.03.2017
As at 31.03.2016
Tangible Assets
Plant & Machinery 160,091,717 - - 160,091,717 52,819,886 11,944,062 - 64,763,948 95,327,769 107,271,831
Total 160,091,717 - - 160,091,717 52,819,886 11,944,062 - 64,763,948 95,327,769 107,271,831
Previous Year 160,091,717 - - 160,091,717 36,894,502 15,925,384 - 52,819,886 107,271,831
As at 31.03.2017 As at 31.03.2016
Rs. Rs.
9. SHORT TERM PROVISIONS
Provision for warranties 18,611,949 23,188,814
Provisions for employee benefits - Leave Encashment 8,245,770 6,271,200
Proposed dividend (including dividend distribution tax) - 122,012,135
Total 26,857,719 151,472,149
PROPERTY, PLANT AND EQUIPMENTS - TECHNICAL KNOW HOW (Amt in Rs.)
Particulars
Gross Block (At Cost) Amortisation Net Block
As at 01.04.2016
Additions during the
year
Deductions during the
year
As at 31.03.2017
As at 01.04.2016
Additions Withdrawals As at 31.03.2017
As at 31.03.2017
As at 31.03.2016
Intangible Assets
Technical Know-how 61,577,865 - - 61,577,865 24,631,152 12,315,577 - 36,946,729 24,631,136 36,946,713
Total 61,577,865 - - 61,577,865 24,631,152 12,315,577 - 36,946,729 24,631,136 36,946,713
Previous Year - 61,577,865 - 61,577,865 12,315,576 12,315,576 - 24,631,152 36,946,713
10. PROPERTY, PLANT AND EQUIPMENTS (In Rs.) Particulars
Gross Block (At Cost) DEPRECIATION Net Block
As at 01.04.2016
Additions Deletions As at 31.03.2017
As at 01.04.2016
Additions With- drawals
As at 31.03.2017
As at 31.03.2017
As at 31.03.2016
Tangible Assets
Free Hold Land 264,449,392 10,858,052 - 275,307,444 - - - - 275,307,444 264,449,392
Lease Hold Land - - - - - - - - - -
Buildings 1,112,933,765 - - 1,112,933,765 162,478,099 37,250,460 - 199,728,559 913,205,206 950,455,666
Plant & Machinery (*) 1,968,069,925 16,880,639 - 1,984,950,564 807,709,195 200,371,023 - 1,008,080,218 976,870,346 1,160,360,730
Office Equipments 29,602,817 1,014,476 1,103,440 29,513,853 17,585,280 3,321,329 1,048,268 19,858,341 9,655,512 12,017,537
Furniture & Fixtures 35,132,383 - - 35,132,383 16,794,979 3,076,053 (0) 19,871,032 15,261,351 18,337,404
Computers 49,447,332 3,581,338 3,132,907 49,895,764 40,999,905 4,110,208 3,067,330 42,042,783 7,852,980 8,447,427
Communication Equipments
1,691,409
5,000
-
1,696,409
1,501,637
51,053
-
1,552,690
143,719
189,772
Motor Vehicles 37,650,876 2,419,100 5,687,332 34,382,644 23,227,493 4,780,842 4,824,791 23,183,544 11,199,100 14,423,383
Total 3,498,977,900 34,758,605 9,923,679 3,523,812,827 1,070,296,588 252,960,969 8,940,388 1,314,317,169 2,209,495,658 2,428,681,312
Previous Year 3,343,766,765 164,630,534 9,419,398 3,498,977,900 822,074,106 255,520,920 7,298,437 1,070,296,589 2,428,681,312
Addition information:
(*) Accumulated depreciation as on 01st April 2004 under Owned Assets includes accumulated depreciation of leased asset also.
Notes on Financial Statement for the year ended March 31, 2017 (contd.)

65
12. NON CURRENT INVESTMENTS Details of Investments
Name of the Company No. of Shares
Face Value
Curre-ncy
As at 31.03.2017 Rs.
As at 31.03.2016 Rs.
Trade Investments (Unquoted) Investments in Equity Instruments
Subsidiaries
Fully paid up DF Power Systems Private Limited
5,999,998 10 INR
204,075,000
204,075,000
Fully Paid up TD Power Systems (USA) Inc. 80,100 10 USD 48,178,495 48,178,495
Fully Paid up TD Power Systems Japan Limited 2,000 10,000 JPY 12,244,000 12,244,000
Fully Paid up TD Power Systems Europe GMBH 350,000 1 Euro 26,064,325 13,082,825
Non - Trade Investments (Unquoted) Investments in Equity Instruments
Others
Fully paid up M/s. The Shamrao Vithal Co-operative Bank Limited
2,000
25
INR
50,000
50,000
Total 290,611,820 277,630,320 Additional InformationAggregate value of unquoted investments:
Cost 290,611,820 277,630,320
Non-current investments are stated at cost. Provision for diminution if any, in the value of investments is made, to recognise a decline, other than temporary. Current investments are valued at lower of cost or market value
As at 31.03.2017 As at 31.03.2016
Rs. Rs.
11. CAPITAL WORK-IN-PROGRESS Building under Construction - - Land 303,000 63,000 Total 303,000 63,000 Intangible assets under development Technical Know-how 6,562,500 6,562,500
Total 6,865,500 6,625,500
Notes on Financial Statement for the year ended March 31, 2017 (contd.)
Note: Depreciation is calculated on the basis of the estimated useful life of the asset as prescribed in Schedule II or actual useful life of the asset whichever is lower. The Life of assets followed by company is as follows:
Asset Useful life (in Years)
Factory building 30 and 5
Non factory building 60 and 5
Plant and Machinery - (Double shift basis) 10
Office equipment 5
Furniture and fittings 10
Computers 3 and 6
Communication equipments 5

TD Power Systems Limited
66
Notes on Financial Statement for the year ended March 31, 2017 (contd.)
As at 31.03.2017 As at 31.03.2016
Rs. Rs.
13. LONG TERM LOANS AND ADVANCES Capital advances 132,429,900 135,138,133
Security Deposit 17,527,220 17,527,220
Loans and advances to related parties * 51,552,000 46,088,000
MAT Credit Entiltement 40,000,000
Advance payment of Tax (net of Provisions) - -
Total 201,509,120 238,753,353 Additional information Breakup of above
Unsecured, considered good 201,509,120 238,753,353
Total 201,509,120 238,753,353
Terms of Unsecured loan to related parties:
The holding company has lent funds to its wholly owned subsidiaries repayable in 24 months or such other period as mutually agreed upon. Interest at libor + 3% is charged on outstanding amounts annually.
14. INVENTORIES Raw materials 356,201,546 320,532,696
Work in progress 260,640,983 312,996,102
Finished goods 29,545,749 -
Stock in trade 146,319,393 139,785,432
Goods in transit:
Raw materials pending at port 7,115,283 29,990,007
Total 799,822,954 803,304,237
15. TRADE RECEIVABLES Trade receivables exceeding six months 212,702,763 147,377,534 Others 1,241,208,020 1,241,220,965
1,453,910,783 1,388,598,499 Less: Allowance for bad and doubtful debts 51,121,835 51,121,835 Total 1,402,788,948 1,337,476,664 Additional information Breakup of above Secured, considered good 52,472,744 63,081,449 Unsecured, considered good 1,350,316,204 1,274,395,215
Total 1,402,788,948 1,337,476,664
16. CASH AND BANK BALANCES Cash and cash equivalents Balances with banks on current accounts 279,724,870 461,393,661

67
As at 31.03.2017 As at 31.03.2016
Rs. Rs.
CASH AND BANK BALANCES (Contd.) in deposit accounts less than 3 months maturity - -
Cash on hand 365,046 164,672
Other bank balances Balances with banks in margin money 71,500,000 71,500,000 in deposit accounts exceeding 12 months maturity 993,000,000 801,500,000 in deposit accounts exceeding 3 months but not exceeding 12 months 558,500,000 587,374,500
Total 1,903,089,916 1,921,932,833
17. SHORT TERM LOANS AND ADVANCES Rent Deposit 1,918,441 3,678,614 Balance with Statutory/ Govt authorities 242,590,072 202,364,756 Prepaid Expenses 9,407,640 9,069,362 Trade Advance 82,858,503 166,339,729 Interest accrued on term deposits 21,287,182 15,889,097 Others 13,295,957 4,056,540 Total 371,357,795 401,398,098 Additional information Breakup of above -Unsecured, considered good
371,357,795
401,398,098
18.CONTINGENT LIABILITIES AND COMMITMENTS(to the extent not provided for)
Contingent Liabilities Claims against the Company not acknowledged as debts - - Guarantees 536,709,548 557,806,461 Letters of credit 382,216,114 353,772,096 The management believes, based on internal assessment and/or legal advice, that the probability of an ultimate adverse decision and outflow of resources of the Company is not probable and accordingly, no provision for the same is considered necessary.
CommitmentsEstimated amount of contracts remaining to be executed on capital account and not provided for (net of advances)
14,792,344
9,639,203
Corporate Guarantee issued to the bankers of the subsidiary company (DFPS)
430,000,000 430,000,000
Corporate Guarantee issued on behalf of subsidiary company. (Japan WOS)
- -
Outstanding Bills discounted under Letter of Credit - - Department of Income Tax (TDS Circle) have issued demand notice under section 201(1)/201(1a) of the Income Tax act, based on tax payer’s data reflected in the computer system of the department for Short deduction / Short payments and interest thereon, for the previous financial years amounting to Rs. 7,20,817/- including Rs. 2,20,930/- towards interest on such short deduction/payment under Forms 27EQ, 26Q & 24Q. The company has pursued the matter with the department and the same is under appeal for such short deduction/late payment.The company has submitted necessary documents for the EPCG licence No. 073001256 dt.10.07.2013 to the extent of Rs. 6.95 crores and has completed the export obligation of Rs. 41.71 cores along with annual average of Rs. 71.84 crores against the licence, awaiting discharge certificate from JDGFT.
Notes on Financial Statement for the year ended March 31, 2017 (contd.)
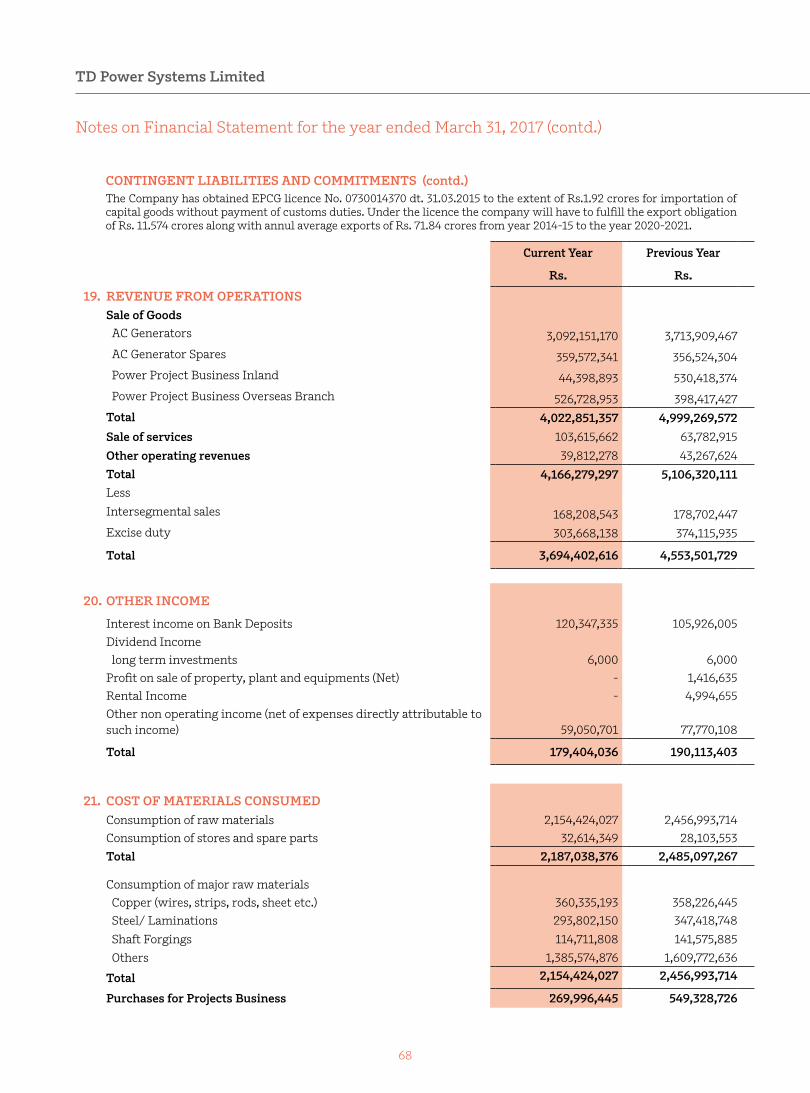
TD Power Systems Limited
68
Current Year Previous Year
Rs. Rs.
19. REVENUE FROM OPERATIONSSale of Goods AC Generators 3,092,151,170 3,713,909,467 AC Generator Spares 359,572,341 356,524,304 Power Project Business Inland 44,398,893 530,418,374 Power Project Business Overseas Branch 526,728,953 398,417,427 Total 4,022,851,357 4,999,269,572 Sale of services 103,615,662 63,782,915
Other operating revenues 39,812,278 43,267,624 Total 4,166,279,297 5,106,320,111 Less
Intersegmental sales 168,208,543 178,702,447 Excise duty 303,668,138 374,115,935
Total 3,694,402,616 4,553,501,729
20. OTHER INCOME
Interest income on Bank Deposits 120,347,335 105,926,005 Dividend Income long term investments 6,000 6,000 Profit on sale of property, plant and equipments (Net) - 1,416,635 Rental Income - 4,994,655 Other non operating income (net of expenses directly attributable to such income)
59,050,701
77,770,108
Total 179,404,036 190,113,403
21. COST OF MATERIALS CONSUMEDConsumption of raw materials 2,154,424,027 2,456,993,714 Consumption of stores and spare parts 32,614,349 28,103,553 Total 2,187,038,376 2,485,097,267
Consumption of major raw materials Copper (wires, strips, rods, sheet etc.) 360,335,193 358,226,445 Steel/ Laminations 293,802,150 347,418,748
Shaft Forgings 114,711,808 141,575,885 Others 1,385,574,876 1,609,772,636
Total 2,154,424,027 2,456,993,714
Purchases for Projects Business 269,996,445 549,328,726
Notes on Financial Statement for the year ended March 31, 2017 (contd.)
CONTINGENT LIABILITIES AND COMMITMENTS (contd.)The Company has obtained EPCG licence No. 0730014370 dt. 31.03.2015 to the extent of Rs.1.92 crores for importation of capital goods without payment of customs duties. Under the licence the company will have to fulfill the export obligation of Rs. 11.574 crores along with annul average exports of Rs. 71.84 crores from year 2014-15 to the year 2020-2021.

69
Current Year Previous Year
Rs. Rs. 22. CHANGE IN INVENTORIES OF FINISHED GOODS,
WORK-IN-PROGRESS
Stocks at the end of the year
Work in progress: -A C Generators 260,640,983 312,996,102 Finished goods: -A C Generators 29,545,749 -
290,186,732 312,996,102 Less: Stocks at the beginning of the year Work in progress: -A C Generators 312,996,102 368,985,660 Finished goods: -A C Generators - 35,019,368
312,996,102 404,005,028
Net (Increase) / Decrease in Stock 22,809,370 91,008,926
23. EMPLOYEE BENEFIT EXPENSESSalaries and wages 437,757,863 407,968,985 Contribution to provident and other funds 30,266,310 51,212,735 Remuneration to whole time directors including contribution 8,105,103 23,870,864 Staff welfare expenses 117,509,886 109,827,841
Total 593,639,162 592,880,425
24. FINANCE COSTSInterest expense 40,617,373 48,145,022
Total 40,617,373 48,145,022
25. DEPRECIATION AND AMORTIZATIONDepreciation 264,905,032 271,446,302 Amortization of intangible assets 12,315,577 12,315,576
Total 277,220,609 283,761,878
26. OTHER EXPENSESPower and fuel 49,624,071 55,525,419 Rent 4,835,821 10,878,320 Repairs and maintenance Buildings 1,501,449 5,196,718 Machinery 15,426,348 26,597,972 Others 9,267,564 10,138,814 Insurance 7,663,619 6,926,954 Rates and taxes 5,828,880 2,569,098 Payment to the auditors as auditor 1,627,935 1,651,000 for taxation matters 650,000 461,250
Notes on Financial Statement for the year ended March 31, 2017 (contd.)

TD Power Systems Limited
70
Details of non-resident shareholdings Number of non-resident shareholders 153 109 Number of shares held by non-resident shareholders 6,128,355 7,922,746
Earnings in foreign exchange Export of goods calculated on FOB basis 1,684,468,797 1,764,215,818
Royalty, Knowhow, professional and consultancy fees 42,984,013 11,607,061 Other Income 2,039,754 2,076,051
Amount (Rs.) % to total Amount (Rs.) % to total
Value of imported raw materials, spare parts and components consumed 444,350,364 20.11 469,760,968 18.90 Value of indigenous raw materials, spare parts and components consumed 1,765,497,382 79.89 2,015,336,299 81.10
Total 2,209,847,746 100.00 2,485,097,267 100.00
27. ADDITIONAL INFORMATIONValue of Imports calculated on CIF basis Raw Materials 391,928,004 580,542,320 Capital goods 1,644,062 67,285,616 Expenditure in foreign currency excluding expenditure at branch office: (net of withholding tax) Others 55,887,472 84,621,596 Capital Equipment Purchased 1,382,985 41,622,232
Notes on Financial Statement for the year ended March 31, 2017 (contd.)
Current Year Previous Year Rs. Rs.
OTHER EXPENSES (Contd.) for other services 565,979 952,961 Selling expenses 72,008,781 111,056,534 Provision for doubtful trade receivables - 51,121,835Loss on sale of property, plant and equipments (net) 7,759 - Donations 1,191,875 1,590,458 Legal and professional charges 35,439,161 42,098,587 Directors sitting fees 817,024 1,101,700 Travelling and Conveyance 124,863,322 113,804,232 Bank Charges 21,026,299 15,933,782 Foreign Exchange Fluctuation 61,849,064 - Postage, Telegrams and Telephones 8,957,751 9,426,319 Royalty 582,200 6,744,279 Software Expenses on ERP 22,170,473 13,960,170 Manufacturing Expenses 11,793,079 18,606,830 Vehicle Maintenance 5,624,580 4,755,302 Advertisement 4,928,776 4,220,835 Printing & Stationary 5,821,609 6,805,911 Subscription to Technical Associations, Journals & Magazines 1,504,250 2,001,479
Total 475,577,669 524,126,759

71
29. DISCLOSURES AS PER ACCOUNTING STANDARD 15 “EMPLOYEE BENEFITS”
Defined Contribution PlanEmployer’s Contribution to Provident Fund & Pension Scheme
20,805,740
19,833,276
Defined Benefit Plan
The employees’ gratuity fund scheme managed by a trust is a defined benefit plan. The Present value of obligation is determined based on actuarial valuation using the projected unit credit method.
Gratuity (Funded)
Leave (Unfunded)
Gratuity (Funded)
Leave (Unfunded)
Defined Benefit obligation at beginning of the reporting period
49,686,221
40,370,110
40,369,832
33,302,500
Current Service Cost 5,170,435 4,482,700 4,576,396 8,810,710Interest Cost 3,974,897 3,002,140 3,229,587 2,597,600 Acqusition adjustment - - - - Actuarial (gain)/ loss 2,944,783 (2,913,110) 4,675,962 (4,340,700)
- -
Benefits Paid (3,726,387) - (3,165,556) - Defined Benefit obligation at end of the reporting period
58,049,949
44,941,840
49,686,221
40,370,110
Obligations at end of the period - Current 5,170,435 8,245,770 4,576,396 6,271,200 Obligations at end of the period - Non -Current 52,879,514 36,696,070 45,109,825 34,098,910
Reconciliation of opening and closing balance of fair value of plan assets Fair value of plan assets at beginning of the reporting period
63,812,624
-
47,220,869
-
Acqusition adjustment - - - - Expected return on plan assets 5,409,511 - 4,513,112 - Employer Contribution 11,392,455 - 15,244,199 - Benefits paid (3,726,387) - (3,165,556) - Actuarial gain/(loss) Fair value of plan assets at reporting period 76,888,203 - 63,812,624 -
Reconciliation of fair value of assets and obligations Fair value of plan assets 76,888,203 - 63,812,624 -
Notes on Financial Statement for the year ended March 31, 2017 (contd.)
Current Year Previous Year
Rs. Rs.
28. EARNINGS PER SHAREProfit for the year after tax expense 889,612 149,788,219
Weighted average number of equity shares 33,237,588 33,237,588
Earning per share 0.03 4.51

TD Power Systems Limited
72
Current Year(Rs.)
Previous Year (Rs.)
DISCLOSURES AS PER ACCOUNTING STANDARD 15 “EMPLOYEE BENEFITS” (contd.)
Gratuity (Funded)
Leave (Unfunded)
Gratuity (Funded)
Leave (Unfunded)
Present value of obligation (58,049,949) - (49,686,221) -Funded assets in excess of obligation of prior years (18,838,254) - (14,126,403) -Amount recognised in Balance Sheet under liabilities
- -
- -
Expense recognised during the yearCurrent Service Cost 5,170,435 4,482,700 4,576,396 8,810,710 Interest Cost 3,974,897 3,002,140 2,597,600 2,597,600 Expected return on plan assets (5,409,511) - (4,513,112) - Actuarial (gain)/ loss 2,944,783 (2,913,110) 4,675,962 (4,340,700)Net Cost 6,680,604 4,571,730 7,336,846 7,067,610
Actuarial assumptionsMortality Table
1994 – 96 (Ultimate)
Indian Assured Lives Mortality (2006-08)
(modified) ULT
1994 – 96 (Ultimate)
Indian Assured Lives Mortality
(2006-08) (modified) ULT
Discount rate (per annum) 8.00% 7.30% 8.00% 7.90%Expected rate of return on plan assets (per annum) 8.00% NA 8.00% NARate of escalation in salary (per annum) 7.00% 7.00% 7.00% 7.00%The estimates of rate of escalation in salary considered in actuarial valuation, take into account inflation, seniority, promotion and other relevant factors including supply and demand in the employment market. The above information is as certified by the actuary.
30. SEGMENT REPORTING
Notes on Financial Statement for the year ended March 31, 2017 (contd.)
The company’s operation comprises of Manufacturing business & Project Business. Primary segmental reporting comprises of Manufacturing Business & Project Business Segments. Secondary Segmental reporting is based on geographical location of Activities. Under primary segment revenue and direct expenses, which relate to a particular segment and which are identifiable, are reported under that segment
Certain expenses, which are not allocable to any specific segment, are separately disclosed at the enterprise level. Cash and bank balances in India are reported at the enterprise level as the company operates common bank accounts. Property, plant and equipments, Liabilities,
Current assets and Current liabilities relating to specific business segments are identified and reported. Those that are not identifiable are reported as common items.
Secondary segment is reported based on the geographical location of the company, viz., India and Japan. Revenues in the secondary segment are based on the sales made by the branch office. Inter-segmental purchases and sales are separately identified and reported. Property, plant and equipments, Current Assets including Cash and Bank accounts, and Current Liabilities are identified based on the branch office to which they relate and are reported accordingly.

73
Segment Assets - Current Year/Period 4,770,407,876 583,493,430 1,951,599,310 7,305,500,616 Previous Year (2015-2016) 4,801,160,943 801,105,485 1,957,754,433 7,560,020,861
Segment Liabilities - Current Year 1,486,733,373 269,829,073 - 1,756,562,445 Previous Year (2015-2016) 1,588,201,113 600,401,772 - 2,188,602,887
Capital Expenditure (Net of disposal) - Current Year/Period
22,415,826
2,419,100
-
24,834,926
Previous Year (2015-2016) 155,211,136 - - 155,211,136
Particulars Manufacturing Project Business Common Total
Segment Revenues
External Revenues 3,259,465,188 603,145,971 - 3,862,611,159
Intersegment Revenues (168,208,543) - - (168,208,543)
Total Revenues 3,091,256,645 603,145,971 - 3,694,402,616
Segment ResultsProfit Before Taxation, Interest & Depreciation 228,331,034 (43,129,453) (39,859,986) 145,341,594
Less: Interest 40,617,373 - - 40,617,373
Less: Depreciation & Amortizations 276,670,345 257,937 292,327 277,220,609
Total (88,956,685) (43,387,391) (40,152,313) (172,496,388)Unallocable & Other Income (including Extraordinary items)
51,930,284
69,009,518
58,464,234
179,404,036
Less: Tax 0 6,018,036 6,018,036
Total Profit (37,026,401) 19,604,092 18,311,921 889,612
Previous Year (Amt in Rs.)
Manufacturing Project Business Common Total
Segment RevenuesExternal Revenues 3,771,293,773 960,910,403 - 4,732,204,176 Intersegment Revenues (178,702,447) - (178,702,447)Total Revenues 3,592,591,326 960,910,403 - 4,553,501,729
Segment ResultsProfit Before Taxation, Interest & Depreciation 312,721,171 37,065,969 (38,727,513) 311,059,627
Less: Interest 48,144,944 78 - 48,145,022
Less: Depreciation & Amortizations 283,211,614 257,937 292,327 283,761,878
Total (18,635,387) 36,807,955 (39,019,840) (20,847,272)
Unallocable & Other Income (including Extraordinary items) 75,649,069 62,972,289 51,492,045 190,113,403 Less: Tax 7,504,282 11,973,629 19,477,911
Total Profit 49,509,400 87,806,614 12,472,205 149,788,219
Current Year (Amt in Rs.)PRIMARY SEGMENT
Notes on Financial Statement for the year ended March 31, 2017 (contd.)Segment Reporting (contd.)

TD Power Systems Limited
74
(Amt in Rs.)
Nature of transactions Subsidiary Key management personnel
and their RelativesEnterprises over which
key Managerial Personnel and their
relative are able to exercise significant
influence2017 2016 2017 2016
Directors Remuneration & Commission Nikhil Kumar - - 2,520,000 19,528,828 - K. G. Prabhakar - - 5,585,103 4,812,980 -
Key Managerial Personnel N. Srivatsa - - 4,679,561 4,030,193 -
Directors Sitting Fees Mohib Khericha - - 204,232 240,300 -
Relative of Director Sagir M. Khericha 525,000 809,066
31. RELATED PARTIES DISCLOSURE
Name of the Related Party Relationship
DF Power Systems Private Limited Subsidiary
TD Power Systems (USA) Inc Subsidiary
TD Power Systems Japan Limited Subsidiary
TD Power Systems Europe GmbH Subsidiary
Nikhil Kumar Key managerial personnel and their Relatives.
Mohib Khericha Key managerial personnel and their Relatives.
K G Prabhakar Key managerial personnel and their Relatives.
N Srivatsa Key managerial personnel and their Relatives.
Sagir M Khericha Key managerial personnel and their Relatives.
GEOGRAPHICAL SEGMENT Segment revenue by Geographical Market
Current Year 31.03.2017 (Rs.)
Previous Year 31.03.2016 (Rs.)
Sales of India 3,335,882,206 4,333,786,748 Sales of overseas 526,728,953 398,417,427 Less: Inter-segmental sales (168,208,543) (178,702,447)Total 3,694,402,616 4,553,501,729
Carrying amounts of geographical assets & additions to tangible & intangible property, plant & equipment
Carrying amounts of segment assets (Amt in Rupees)
Additions to property, plant and equipments (Net) (Amt. in Rupees)
As at 31.03.2017 As at 31.03.2016 As at 31.03.2017 As at 31.03.2016
Located in India 6,898,939,515 7,023,303,929 22,415,826 155,211,136 Located outside India 406,561,101 536,716,932 2,419,100 -
Total 7,305,500,616 7,560,020,861 24,834,926 155,211,136
Notes on Financial Statement for the year ended March 31, 2017 (contd.)Segment Reporting (contd.)

75
RELATED PARTIES DISCLOSURE (contd.) Nature of transactions Subsidiary Key management personnel
and their RelativesEnterprises over which
key Managerial Personnel and their
relative are able to exercise significant
influence2017 2016 2017 2016
Lease Rent Paid Mohib N. Khericha - - - 1,350,000 -
DF Power Systems Private Limited Rent received (including service tax) - 5,897,065 - - -
Management Services from - 5,512,403
Guarantee Margin from - 150,000,000 Amount due from Company to 6,818,288 6,966,056 - - -
Purchases of Materials (including taxes & duties) - 10,053,638 -
- -
TD Power Systems (USA) Inc.
Sale of Generators & Spares to (including taxes & duties)
182,761,375 33,423,828 -
--
Purchases from (including taxes & duties) - 19,319 - - - Amount due to Company from 156,651,815 25,172,655 - - -
Inter-Corporate Loan given to 51,552,000 46,088,000 Interest on Inter-Corporate Loan charged to 2,039,754 1,515,150
Amount due from Company to 349,881 357,464
TD Power Systems Japan Limited Sale of Generators & Services to (including taxes & duties) - 5,459,885 - - - Interest on Inter-Corporate Loan charged to
-
560,899 -
-
-
Amount due to Company from - 772,200TD Power Systems Europe GMBH - - - Sale of Generators & Services to (including taxes & duties)
13,661,830 - - - -
Purchases from (including taxes & duties)
67,079
-
-
-
-
Amount due to Company from 654,740 - Amount due from Company to 67,079 -
Notes on Financial Statement for the year ended March 31, 2017 (contd.)

TD Power Systems Limited
76
Nature 2016 - 2017 (Rs.) 2015-2016 (Rs.)
Capital Expenditure - - Revenue Expenditure (excluding depreciation) 62,484,336 66,665,929
34. Foreign currency exposures which have been hedged/unhedged by any derivative Instruments or otherwise as at end of the reporting period is as follows:Unhedged As at 31.03.2017 (Rs.) As at 31.03.2016 (Rs.)Assets (Receivables) 779,121,769 637,545,123 Liabilities (payables) 190,910,307 186,364,759
33.WARRANTY CLAIMSProvision for warranties are made on an estimated basis. During the reporting period, the Company has made provisions towards Warranty claims, the details of the same are as under:
35.RESEARCH & DEVELOPMENT Following expenses have been incurred by the company towards Research & Development activities
(Rs.)Warranty claims
Balance outstanding at the beginning of the reporting period 23,188,814 Provision for the reporting period - Utilized during the reporting period 4,576,865 Withdrawn and credited to Statement of Profit and Loss - Balance outstanding at the end of the reporting period 18,611,949
32. OPERATING LEASEThe Company has various operating leases for office facilities, guesthouse and residential premises of employees that are renewable on a periodic basis, and cancelable at its option. Rental expenses for operating leases included in the financial statements for the year are Rs. 4,835,821/- (Previous year Rs. 10,878,320/-).
Notes on Financial Statement for the year ended March 31, 2017 (contd.)
36. CORPORATE SOCIAL RESPONSIBILITY 1. Gross amount required to be spent by the company during the year - Rs. 14,659,196/- 2. Amount spent including service tax during the year on
37. DISCLOSURE OF SPECIFIED BANK NOTES HELD AND TRANSACTED DURING PERIOD FROM 8TH NOVEMBER 2016 TO 30TH DECEMBER 2016
Sl. No.
Towards Spent To be spent
Total
1. Construction/acquisition of any asset - - - 2. On purposes other than (1) above 11,727,260 2,931,936 14,659,196
Particulars Specified Bank Notes Other denomination notes TotalClosing cash in hand as on 08.11.2016 258,500 36,419 294,919
ADD: Permitted receipts - 1,468,000 1,468,000 LESS: Permitted payments - 1,140,154 1,140,154 LESS: Amount deposited in Banks 258,500 - 258,500
Closing cash in hand as on 30.12.2016 - 364,265 364,265
Amount in Rs.
Amount in Rs.

77
Notes on Financial Statement for the year ended March 31, 2017 (contd.)
38. NOTE ON MANAGERIAL REMUNERATION:- In view of inadequate profits for the current financial year, the remuneration paid to Managing Director (part of the
year) & Whole Time Director (full year) of Rs. 2,520,000/- & Rs. 5,585,103/- respectively, is subject to approval of the shareholders.
39. a) The company does not have any pending litigations which would impact its financial positon as on the reporting date. b) The company does not have any long term contracts including derivative contracts for which there were any material foreseeable losses.c) There are no amounts required to be transferred to the Investor Education and Protection Fund by the Company as on the reporting date.e) Previous reporting year figures have been regrouped wherever required in conformity with the presentation for the current reporting year.
INTENTIONALLY LEFT BLANK
79
CONSOLIDATED FINANCIAL STATEMENTS

TD Power Systems Limited
80
Report on the Consolidated Financial Statements:We have audited the accompanying consolidated financial statements of TD Power Systems Limited (hereinafter referred to as “the Holding Company”) and its India subsidiary DF Power Systems Private Limited. We have reviewed the financial statements of TD Power Systems USA Inc, TD Power Systems Japan Ltd, TD Power Systems Europe GmbH (“foreign subsidiaries”) for the limited purpose of verifying the compliance with Schedule III required for consolidation (the Holding Company and its subsidiaries together referred to as “the Group”) comprising of the Consolidated Balance Sheet as at March 31, 2017, the Consolidated Statement of Profit and Loss and the Consolidated Cash Flow Statement for the year then ended and a summary of significant accounting policies and other explanatory information (hereinafter referred to as “the consolidated financial statements”).
Management’s Responsibility for the Consolidated Financial StatementsThe Holding Company’s Board of Directors is responsible for the preparation of these consolidated financial statements in terms of the requirements of the Companies Act, 2013 (herein after referred to as “the Act”) that give a true and fair view of the consolidated financial position, consolidated financial performance and consolidated cash flows of the Group in accordance with the accounting principles generally accepted in India, including the accounting standards specified under Section 133 of the Act, read with Rule 7 of the Companies (Accounts) Rules, 2014. The respective Board of Directors of the companies included in the Group are responsible for maintenance of adequate accounting records in accordance with the provisions of the Act for safeguarding the assets of the Group and for preventing and detecting frauds and other irregularities; selection and application of appropriate accounting policies; making judgements and estimates that are reasonable and prudent; and design, implementation and maintenance of adequate internal financial controls, that were operating effectively for ensuring the accuracy and completeness of the accounting records, relevant to the preparation and presentation of the financial statements that give a true and fair view and are free from material misstatement, whether due to fraud or error, which have been used for the purpose of preparation of the consolidated financial statements by the Directors of the Holding Company, as aforesaid.
Auditor’s ResponsibilityOur responsibility is to express an opinion on these consolidated financial statements based on our audit.
While conducting the audit, we have taken into account the provisions of the Act, the accounting and auditing standards and matters which are required to be included in the audit report under the provisions of the Act and the Rules made
INDEPENDENT AUDITORS’ REPORT TO THE MEMBERS OF TD POWER SYSTEMS LIMITED
thereunder.
We conducted our audit in accordance with the Standards on Auditing specified under Section 143(10) of the Act. Those Standards require that we comply with the ethical requirements and plan and perform the audit to obtain reasonable assurance about whether the consolidated financial statements are free from material misstatement.
An audit involves performing procedures to obtain audit evidence about the amounts and the disclosures in the consolidated financial statements. The procedures selected depend on the auditor’s judgment, including the assessment of the risks of material misstatement of the consolidated financial statements, whether due to fraud or error. In making those risk assessments, the auditor considers internal financial control relevant to the Holding Company’s preparation of the consolidated financial statements that give a true and fair view in order to design audit procedures that are appropriate in the circumstances. An audit also includes evaluating the appropriateness of the accounting policies used and the reasonableness of the accounting estimates made by the Holding Company’s Directors, as well as evaluating the overall presentation of the consolidated financial statements.
We believe that the audit evidence obtained by us and the audit evidence obtained by the other auditors in terms of their reports referred to in sub paragraph (a) of the Other Matters paragraph below, is sufficient and appropriate to provide a basis for our audit opinion on the consolidated financial statements.
OpinionIn our opinion and to the best of our information and according to the explanations given to us, the aforesaid consolidated financial statements give the information required by the Act in the manner so required and give a true and fair view in conformity with the accounting principles generally accepted in India of the consolidated state of affairs of the Group as at March 31, 2017, and their consolidated loss and their consolidated cash flows for the year ended on that date.
Other Mattersa) We did not audit the financial statements of the following entities which included
Entity Total assets as on March 31, 2017
Total operating revenues for the year 2016 – 17
Japan Branch (part of Holding Company) Rs. 20,92,21,734 Rs. 52,73,67,661
Hong Kong Branch (part of Indian Subsidiary)
Rs. 27,53,81,380 NIL
TD Power Systems Japan Limited Rs. 5,18,30,687 Rs. 8,14,13,284
TD Power Systems USA Inc Rs. 19,33,02,570 Rs. 18,62,48,302
TD Power Systems Europe GmbH Rs. 79,77,631 Rs. 1,62,03,586

81
These financial statements of the branches have been audited by the branch auditors whose reports have been furnished to us. Our opinion in so far as it relates to the amounts and disclosures included in respect of the branches, is based solely on the reports of such branch auditors. We have been furnished with financial statements of the foreign subsidiaries as per Schedule III to the Companies Act, 2013. We have reviewed the same for the limited purpose of verifying the compliance with Schedule III required for consolidation.
Our opinion is not modified in respect of this matter.
Report on Other Legal and Regulatory Requirements:
1. As required by the Section 143(3) of the Act, we report to the extent applicable that:
a) We have sought and obtained all the information and explanations which to the best of our knowledge and belief were necessary for the purpose of our audit of the above said consolidated financial statements.
b) In our opinion, proper books of account as required by law relating to preparation of the aforesaid consolidated financial statements have been kept in so far as it appears from our examination of those books and the reports of the other auditors and proper returns adequate for the purposes of our audit have been received from the branches not visited by us.
c) The reports on the accounts of the branch offices of the Group audited under Section 143(8) of the Act by branch auditors have been sent to us and have been properly dealt with by us in preparing this report.
d) The Consolidated Balance Sheet, the Consolidated Statement of Profit and Loss, and the Consolidated Cash Flow Statement dealt with by this Report are in agreement with the relevant books of account maintained for the purpose of preparation of the consolidated financial statements.
e) In our opinion, the aforesaid consolidated financial statements comply with the Accounting Standards specified under Section 133 of the Act, read with Rule 7 of the Companies (Accounts) Rules, 2014.
f) On the basis of the written representations received from the directors of the Holding Company as on March 31, 2017 taken on the record by the Board of Directors of the Holding Company, none of the directors of the Group companies incorporated in India is disqualified as on that date from being appointed as a director in terms of Section 164(2) of the Act.
g) With respect to the adequacy of the internal financial controls over financial reporting of the Company and
the operating effectiveness of such controls, refer to our separate report in annexure A. Our report expresses an unmodified opinion on the adequacy and operating effectiveness of the Company’s internal financial controls over financial reporting.
h) With respect to other matters to be included in the Auditors report in accordance with Rule 11 of the Companies (Audit and Auditors) Rules, 2014, in our opinion and to the best of our information and according to the explanations given to us,
i. There were no pending litigations which would impact the consolidated financial position of the Group. - Refer Note 37(a) to the financial statements.
ii. The Group has made provision, as required under the accounting standards, for material foreseeable losses, on long term contracts in respect of its wholly owned Indian subsidiary. The Group did not have any derivative contracts for which there were any material foreseeable losses – Refer Note 37(b) to the financial statements.
iii. There were no amounts which were required to be transferred to the Investor Education and Protection Fund by the Group. - Refer Note 37(c ) to the financial statements.
Independent Auditors’ Report (contd.)
For B. K. RAMADHYANI & CO LLP Chartered Accountants
Firm Registration No. 002878S/S200021
R. SATYANARAYANA MURTHI Partner
Membership No. 024248Bangalore May 18, 2017
INTENTIONALLY LEFT BLANK

TD Power Systems Limited
82
Report on the Internal Financial Controls under Clause (i) of Sub-section 3 of Section 143 of the Companies Act, 2013 (“the Act”)
We have audited the internal financial controls over financial reporting of TD Power Systems Limited (“the Holding Company”) and DF Power Systems Private Limited (“Indian Subsidiary”) as of March 31, 2017 in conjunction with our audit of the consolidated financial statements of the Holding Company for the year ended on that date.
Management’s Responsibility for Internal Financial Controls
The respective Board of Directors of the Holding Company and its Indian Subsidiary are responsible for establishing and maintaining internal financial controls based on the internal control over financial reporting criteria established by the Company considering the essential components of internal control stated in the Guidance Note on Audit of Internal Financial Controls Over Financial Reporting (the “Guidance Note”) issued by the Institute of Chartered Accountants of India (ICAI). These responsibilities include the design, implementation and maintenance of adequate internal financial controls that were operating effectively for ensuring the orderly and efficient conduct of its business, including adherence to company’s policies, the safeguarding of its assets, the prevention and detection of frauds and errors, the accuracy and completeness of the accounting records, and the timely preparation of reliable financial information, as required under the Act.
Auditors’ Responsibility
Our responsibility is to express an opinion on the Company’s internal financial controls over financial reporting based on our audit. We conducted our audit in accordance with the Guidance Note and the Standards on Auditing, issued by ICAI and deemed to be prescribed under section 143(10) of the Act, to the extent applicable to an audit of internal financial controls, both applicable to an audit of internal financial controls and, both issued by the ICAI. Those Standards and the Guidance Note require that we comply with ethical requirements and plan and perform the audit to obtain reasonable assurance about whether adequate internal financial controls over financial reporting was established and maintained and if such controls operated effectively in all material respects.
Our audit involves performing procedures to obtain audit evidence about the adequacy of the internal financial controls system over financial reporting and their operating effectiveness. Our audit of internal financial controls over
Annexure A referred to in Paragraph 1 (g) under the heading “Report on other legal and regulatory requirements” of our report to the members of TD Power Systems Limited
financial reporting included obtaining an understanding of internal financial controls over financial reporting, assessing the risk that a material weakness exists, and testing and evaluating the design and operating effectiveness of internal control based on the assessed risk. The procedures selected depend on the auditor’s judgement, including the assessment of the risks of material misstatement of the financial statements, whether due to fraud or error.
We believe that the audit evidence we have obtained is sufficient and appropriate to provide a basis for our audit opinion on the Company’s internal financial controls system over financial reporting.
Meaning of Internal Financial Controls over Financial Reporting
A company’s internal financial control over financial reporting is a process designed to provide reasonable assurance regarding the reliability of financial reporting and the preparation of financial statements for external purposes in accordance with generally accepted accounting principles. A company’s internal financial control over financial reporting includes those policies and procedures that (1) pertain to the maintenance of records that, in reasonable detail, accurately and fairly reflect the transactions and dispositions of the assets of the company; (2) provide reasonable assurance that transactions are recorded as necessary to permit preparation of financial statements in accordance with generally accepted accounting principles, and that receipts and expenditures of the company are being made only in accordance with authorisations of management and directors of the company; and (3) provide reasonable assurance regarding prevention or timely detection of unauthorised acquisition, use, or disposition of the company’s assets that could have a material effect on the financial statements.
Inherent Limitations of Internal Financial Controls over Financial Reporting
Because of the inherent limitations of internal financial controls over financial reporting, including the possibility of collusion or improper management override of controls, material misstatements due to error or fraud may occur and not be detected. Also, projections of any evaluation of the internal financial controls over financial reporting to future periods are subject to the risk that the internal financial control over financial reporting may become inadequate because of changes in conditions, or that the degree of compliance with the policies or procedures may deteriorate.

83
Bangalore May 18, 2017
For B. K. RAMADHYANI & CO LLP Chartered Accountants
Firm Registration No. 002878S/S200021
R. SATYANARAYANA MURTHI Partner
Membership No. 024248
INTENTIONALLY LEFT BLANK
Opinion
In our opinion, the Holding Company and its Indian subsidiary have, in all material respects, an adequate internal financial controls system over financial reporting and such internal financial controls over financial reporting were operating effectively as at March 31, 2017, based on the internal control over financial reporting criteria established by the Company considering the essential components of internal control stated in the Guidance Note issued by ICAI.
Independent Auditors’ Report (contd.)
Other Matters
Our aforesaid reports under section 143(3)(i) of the Act on the adequacy and operating effectiveness of internal financial control over financial reporting in so far does not relates to 3 subsidiaries, which are companies incorporated outside India.

TD Power Systems Limited
84
As at 31.03.2017 As at 31.03.2016
Note Rs. Rs. Rs. Rs.
EQUITY AND LIABILITIES Shareholders' FundsShare Capital 2 332,375,880 332,375,880 Reserves and Surplus 3 4,355,593,876 4,400,368,874
4,687,969,756 4,732,744,754 Non-current liabilitiesDeferred tax liabilities (Net) 4 152,352,706 153,279,808
Long term provisions 5 37,909,182 39,159,030
190,261,888 192,438,838
Current Liabilities Short term borrowings 6 453,428,002 276,415,453 Trade payables 7
Total outstanding due of MSME 8,876,193 9,572,649
Total outstanding due of Creditors other than MSME
1,292,607,679
1,436,678,910
Other current liabilities 8 661,328,829 1,016,379,410 Short term provisions 9 129,982,956 264,810,198
2,546,223,659 3,003,856,620 Total 7,424,455,303 7,929,040,212
ASSETSNon-current assetsProperty, Plant and Equipment
Tangible assets 10 2,308,856,079 2,545,290,401 Intangible assets 10 24,631,136 36,946,713 Capital work in progress 11 6,865,500 6,625,500
2,340,352,715 2,588,862,614
Non-current investments 12 50,000 50,000 Long term loans and advances 13 154,025,246 192,665,353
2,494,427,961 2,781,577,967 Current AssetsInventories 14 799,822,954 881,265,213 Trade receivables 15 1,549,142,832 1,552,442,274 Cash and Bank Balance 16 2,146,190,637 2,258,144,277 Short term loans and advances 17 434,870,919 455,610,481
4,930,027,342 5,147,462,245
Total 7,424,455,303 7,929,040,212 Summary of Accounting Policies, other explanatory information & Notes attached form an integral part of the Balance Sheet
1-39
CONSOLIDATED BALANCE SHEET AS AT 31ST MARCH 2017
For and on behalf of Board of DirectorsMohib N. Khericha
ChairmanNikhil Kumar
Managing DirectorK. G. Prabhakar
Director & Chief Financial OfficerN. Srivatsa
Company Secretary
In Accordance with our Report attached
For B. K. RAMADHYANI & CO. LLP. Chartered Accountants Firm Registration No. 002878S/S200021
R. Satyanarayana Murthi Partner - M. No. 024248BangaloreMay 18, 2017

85
For and on behalf of Board of DirectorsMohib N. Khericha
ChairmanNikhil Kumar
Managing Director
K. G. Prabhakar Director & Chief Financial Officer
N. Srivatsa Company Secretary
Current Year Previous Year
Note Rs. Rs. Rs. Rs.
INCOMERevenue from Operations 19 3,799,090,132 5,067,512,155 Other Income 20 204,513,438 201,884,046
Total Revenue 4,003,603,570 5,269,396,201
EXPENSES Cost of materials consumed 21 2,200,807,437 2,508,287,455 Purchases for Project Business 352,737,932 1,079,574,976 Changes in inventories of finished goods, work in progress and stock in trade 22
22,809,370
91,008,926
2,576,354,739 3,678,871,357 Employee benefits expense 23 637,976,841 660,517,130 Finance costs 24 41,428,844 49,815,031 Depreciation and amortization expense 25 278,555,386 288,070,699 Other expenses 26 506,841,652 661,276,889
Total Expenses 4,041,157,462 5,338,551,106
Profit before tax (37,553,892) (69,154,905)
Tax expense Current tax ( MAT) 8,216,464 66,606,758 Less: MAT Credit Entitlement - 20,000,000
Net Current Tax 8,216,464 46,606,758 Deferred Tax (927,103) (23,907,697)
7,289,361 22,699,061
Profit/(Loss) for the Year (44,843,253) (91,853,966)Less : Prior Period Adjustment - -
Profit/(Loss) for the Year (44,843,253) (91,853,966)
Earning per equity share 28Basic & Diluted (1.35) (2.76)Summary of Accounting Policies, other explanatory information & Notes attached form an integral part of the Statement of Profit & Loss
1-39
CONSOLIDATED STATEMENT OF PROFIT & LOSS FOR THE YEAR ENDED 31ST MARCH 2017
In Accordance with our Report attached
For B. K. RAMADHYANI & CO. LLP. Chartered Accountants Firm Registration No. 002878S/S200021
R. Satyanarayana Murthi Partner - M. No. 024248
BangaloreMay 18, 2017

TD Power Systems Limited
86
For and on behalf of Board of Directors
Mohib N. Khericha Chairman
Nikhil Kumar Managing Director
K. G. Prabhakar Director & Chief Financial Officer
N. Srivatsa Company Secretary
As per our report of even date
For B. K. RAMADHYANI & CO LLP. Chartered Accountants Firm Registration No. 002878S/S200021
R. Satyanarayana Murthi Partner - M.No. 024248
BangaloreMay 18, 2017
Rs.Current Year
Rs.
Rs.Previous Year
Rs.A Cash flow from operating activities
Net Profit before tax and extraordinary items (37,553,892) (69,154,905)
Adjustments forDepreciationAmortisation(Profit) / Loss on sale of property, plant and equipmentDividend IncomeInterest IncomeInterest PaymentsProvision for Warranty ClaimsProvision for Gratuity & Leave Encashment
266,239,809
12,315,577 2,514,082
(6,000) (131,457,029)
41,428,844 (4,576,865) 10,430,597
196,889,015
275,755,123 12,315,576 3,086,036
(6,000) (129,789,051)
49,815,031 3,094,316
41,530,563
255,801,594
Operating profit before Working Capital Changes 159,335,123 186,646,689
Adjustments for Trade ReceivablesOther ReceivablesInventoriesFuture ContractsTrade PayablesCash generated from Operations
Direct Taxes PaidNet Cash Flow from Operating Activities
3,299,443 8,162,352
81,442,259 -
(490,653,847)
3,130,136
(397,749,793) (238,414,670)
3,130,136
(241,544,806)
(951,392)
365,748,065 (121,056,469) (116,226,390) (416,608,813)
26,011,414
(289,094,999) (102,448,310)
26,011,414
(128,459,724)
B Cash flow from Investing Activities
Purchase of Property, Plant and Equipment Sale of Property, Plant and Equipment Dividend ReceivedInterest ReceivedNet Cash used in investing activities
(37,039,168) 26,981,258
6,000 126,071,506
116,019,596
(171,160,281) 25,973,561
6,000 163,118,042
17,937,322
C Cash flow from financing activities
Refund on Income TaxWorking Capital borrowingsInterest PaidDividend and Tax on Dividend paidNet Cash flow from financing activitiesNet increase/decrease in cash and cash equivalentsCash and cash equivalents at the beginningCash and cash equivalents at close
- 177,012,549
(41,428,844) (122,012,135)
13,571,570 (111,953,640)
2,258,144,277 2,146,190,637
100,359,854 (297,098,430)
(49,815,031) (105,913,403)
(352,467,010) (462,989,412) 2,721,133,689 2,258,144,277
Notes : Cashflows are reported using the indirect method. Cash and cash equivalents is after adjusting translation gain/loss.
CONSOLIDATED CASH FLOW STATEMENT FOR THE YEAR ENDED 31ST MARCH 2017

87
SUMMARY OF ACCOUNTING POLICIES AND OTHER EXPLANATORY INFORMATION FOR THE YEAR ENDED MARCH 31, 2017
1 Significant Accounting Policies Consequent to a Special Resolution of the Members, passed at the Company’s Extra Ordinary General Meeting held on 17th January 2011, the Company is converted to a Public Limited Company by altering its Articles of Association in terms of Section 31 read with Section 44 of the Companies Act 1956, and a fresh Certificate of Incorporation dated 04th February 2011 is issued by the Registrar of Companies, Karnataka.
DF Power Systems Private Limited (Subsidiary Company), a company incorporated under Companies Act, 1956, is the wholly owned subsidiary of the company, w.e.f. October 1, 2010.
The company’s subscription to the Share Capital of its Wholly Owned Subsidiaries reflected as trade investments as on 31st March 2017 are as follows:-
a. 80,100 Equity Shares of USD 10- each - TD Power Systems (USA) Inc.
b. 2000 Equity Share of JPY 10,000 each - TD Power Systems Japan Limited
c. 350,000 * Equity Share of Euro 1 each - TD Power Systems Europe GmbH (* erstwhile Platin 1255 GmbH acquired by the company in January 2016)
1.1 Basis of Preparation of Financial Statements The financial statements of the Company have been prepared under historical cost convention, in accordance with the Generally Accepted Accounting Principles (GAAP) applicable in India and the provisions of the Companies Act, 2013. The preparation of financial statements in conformity with GAAP requires management to make estimates and assumptions that affect the reported amounts of assets and liabilities, disclosures of contingent liabilities as at the date of the financial statements, and the reported amounts of revenue and expenses during the reported period.
1.2 Principles of Consolidation The financial statements of the subsidiary company used in the consolidation are drawn up to the same reporting date as of the Company a) The financial statement of the Company and its subsidiary company has been combined on a line by line basis by adding together like items of assets, liabilities, income and expenses. Inter- company balances and transactions and unrealized profits or losses have been fully eliminated.
b) The share of equity in the subsidiary company as on the date of investment is in excess of cost of
investment of the Group it is recognized as ‘Capital Reserve’ and shown under the head ‘Reserves and Surplus’, in the consolidated financial statements.
1.3 A) Property, plant and equipment: All items of Property, Plant and Equipment’s are carried at cost less accumulated depreciation / amortization and impairment losses, if any. The cost of Property, Plant and Equipment’s are stated at cost of acquisition excluding vatable duties, inclusive of freight, taxes and incidental expenses relating to the acquisition and finance cost on borrowings utilized for acquisition of qualifying Property, Plant and Equipment’s. Property, Plant and Equipment’s manufactured internally are capitalized at Factory Cost.
Capital work in progress: Property, Plant and Equipment’s which are not yet ready for their intended use are carried at cost, comprising direct cost and related incidental expenses.
B) Depreciation: Depreciation on tangible assets is provided using straight line method (SLM) with reference to the estimated useful life of the Property, Plant and Equipment’s less its residual value as prescribed under Schedule II of The Companies Act 2013, or actual useful life of the asset, whichever is lower. Property, plant and equipment’s costing below Rs. 5,000/- are depreciated fully. Depreciation is charged for complete quarter on addition/deletion
C) Amortization of Technical Know-how Fee / License Fee: Technical Know-how Fees is amortized over a period of 60 months
1.4 Inventories Inventories are valued at cost or net realizable value, which ever is lower. Raw materials and bought out items are valued on first in first out basis as per Accounting Standard - 2 and includes material cost, carriage inward, insurance and purchase related expenses. Cost in respect of work in progress and finished goods are based on works cost.
1.5 Revenue Recognition Company a. Sale of manufactured goods is recognized on shipment to customers, and exclusive of excise duty and sales tax.
b. Sale of goods in case of project business is recognised on shipment to customers.

TD Power Systems Limited
88
Summary of Accounting Policies and Other Explanatory Information (contd.)
c. Erection and commissioning income is recognised as and when the services are performed/ completed.
d. Interest income is recognised based on time proportion basis.
e. Dividend income is recognised when the right to receive the dividend is established.
Subsidiaries
a. Sales are recorded based on significant risks and rewards of ownership being transferred in favour of the customer. Sales include goods dispatched to customers by partial shipment.
b. Income from erection and project management services is recognized on work done based on percentage completion or the intrinsic value, reckoned at 97.5% of contract value, the balance 2.5% is recognized as income when the contract is completed.
c. Income from engineering services rendered is recognized at realizable value based on percentage of work completed.
d. Liquidated damages in terms of the contract is recognised on crystalization.
1.6 Foreign Currency Transactions a. Foreign currency transactions are translated into Indian rupees at the exchange rate prevailing on the date of the transaction.
b. Monetary foreign currency assets and liabilities outstanding at the end of the year are restated at the exchange rates prevailing on the reporting date. All exchange differences are accounted for in the statement of profit and loss.
c. Non monetary items denominated in foreign currency, are valued at the exchange rate prevailing on the date of transaction.
d. In respect of overseas branches, which are integral foreign operations, financial statements are translated as if the transactions are those of the Company itself.
e. In respect of integral foreign operations, being the wholly owned subsidiary at United States of America, financial statements are translated as if the transactions are those of the Company itself.
f. In respect of non-integral foreign operations, being the wholly owned subsidiary at Japan, financial statements are translated as under assets and liabilites, both monetary and non-monetary at the closing rate, income and expenses at the transaction exchange rate and resulting exchange
differences, accumlated in foreign currency translation reserves.
1.7 Taxes on Income Provision for tax is made in terms of AS 22 for both current and deferred tax. Provision for current income tax if arises is made at the current tax rates based on assessable income. Deferred tax is recognised on timing difference between the accounting income and the taxable income for the year and quantified using the tax rates and laws enacted or substantively enacted as on the Balance sheet date. Deferred tax assets are recognized and carried forward to the extent that there is a reasonable/virtual certainty that sufficient future taxable income will be available against which such deferred tax asset can be realized.
Minimum Alternate Tax (MAT) under the provisions of Income Tax Act, 1961, is recognised as current tax in the statement of Profit & Loss. The credit available under the Act in respect of MAT paid is recognised as an asset only when and to the extent there is convincing evidence that the compnay will pay normal Income Tax during the year for which MAT Credit can be carried forward for set-off against the normal tax liability. MAT Credit recognised as an asset is reviewed at each Balance Sheet date and written down to the extent the aforesaid convincing evidence no longer exists.
1.8 Borrowing Cost Interest and other borrowing cost on borrowings relatable to qualifying assets are capitalized up to the date such assets are ready for use. Other interest and borrowing cost are charged to statement of Profit & Loss.
1.9 Contingent Liabilities Financial effects of contingent liabilities are disclosed based on information available up to the date on which financial statements are approved. However, where a reasonable estimate of financial effect cannot be made, suitable disclosures are made with regard to this fact and the existence and nature of the contingent liability.
1.10 Employees Benefits Long Term Employee Benefits
a. Defined Contribution Plans
The Company has contributed to provident funds, which is defined contribution plan. The contribution paid/payable under the scheme is recognised during the year in which an employee renders the related service.

89
Summary of Accounting Policies and Other Explanatory Information (contd.)
b. Defined Benefit Plans Employees gratuity and leave encashment are defined benefit plans. The present value of the obligations under such plan is determined based on actuarial valuation using the Projected Unit Credit Method which considers each year of service as giving rise to an additional unit of benefit entitlement and measures each unit separately to build up the final obligation. Actuarial gain and losses are recognised immediately in the Statement of Profit & Loss as income or expense. Obligation is measured at present value of estimated future cash flows using a discounted rate that is determined by reference to market yields available on government bonds at the balance sheet date with the term that matches to the liabilities.
1.11 Impairment of Assets At each balance sheet date, the management reviews the carrying amount of its asset to determine whether there is any indication that those assets are impaired. If any such indication exists, the recoverable amount of the asset is estimated in order to determine the extent of impairment loss. Reversal of impairment loss, if any, is recognised immediately in the Statement of Profit and Loss.
1.12 Accounting for lease i. Operating Lease Lease of assets under which all the risks and rewards of ownership are effectively retained by the
lessor are classified as operating leases. Lease payments under operating leases are recognized as an expense on a straight-line basis over the lease term.
ii. Finance Lease and Hire purchase transactions Lease rentals are charged to statement of Profit and Loss over the period of Lease. Depreciation is provided on the primary period of the lease.
1.13 Investment Non-current investments are stated at cost. Provision for diminution if any, in the value of investments is made, to recognise a decline, other than temporary. Current investments are valued at lower of cost or market value.
1.14 Research & Development Expenditure on Research & Development activity undertaken is charged to the Statement of Profit & Loss as and when incurred during the year to their natural head of accounts. The expenditure incurred includes cost of materials, salaries & wages and other revenue expenditure.
Capital Expenditure is categorized and disclosed separately as Research & Development Property, plant and equipment’s and depreciation is charged as prescribed under Companies Act 2013 discussed in para 1.3 above.
As at 31.03.2017 As at 31.03.2016
Number Rs. Number Rs.
2. SHARE CAPITAL
Authorized Equity shares of Rs.10/- each 35,000,000 350,000,000 35,000,000 350,000,000
350,000,000 350,000,000
Issued, subscribed and fully paid up Equity shares of Rs.10/- each
At the beginning of the year 33,237,588 332,375,880 33,237,588 332,375,880
Issued during the year - - - -
At the close of the year 33,237,588 332,375,880 33,237,588 332,375,880
Total 332,375,880 332,375,880

TD Power Systems Limited
90
Other Information
I The Company has only one class of equity shares having par value of Rs.10/- each. Each holder of equity shares is entitled to one vote per share. The Company declares and pays dividends in Indian rupees. The dividend proposed by the Board of Directors is subject to the approval of the shareholders in the ensuing Annual General Meeting.
In the event of liquidation of the Company, the holders of equity shares will be entitled to receive remaining assets of the Company, after distribution of all preferential amounts. The distribution will be in proportion to the number of equity shares held by the shareholders.
III
Particulars of equity share holders holding more than 5% of the total paid-up equity share capital
As at 31.03.2017 As at 31.03.2016
Percentage No. of shares Percentage No. of shares
Saphire Finman Services Private Limited 15.12% 5,026,433 15.12% 5,026,433
Nikhil Kumar 13.96% 4,638,664 13.96% 4,638,664
Hitoshi Matsuo 9.73% 3,235,254 9.73% 3,235,254
Mohib N Khericha 11.23% 3,730,960 5.56% 1,846,860
Notes on Consolidated Financial Statement for the year ended March 31, 2017
As at 31.03.2017 Rs.
As at 31.03.2016 Rs.
3. RESERVES AND SURPLUS
Capital ReserveAs at the beginning of the year 71,829,215 71,829,215 As at the end of the year 71,829,215 71,829,215
Securities PremiumAs at the beginning of the year 2,050,763,239 2,050,763,239 As at the end of the year 2,050,763,239 2,050,763,239
General ReserveAs at the beginning of the year 336,991,473 324,714,860Add: Transferred from Statement of Profit and Loss - 12,276,613 As at the end of the year 336,991,473 336,991,473
Foreign Currency Translation ReservesAs at the beginning of the year 1,626,103 (4,586,346)Add:During the period (Refer Note 1.7 f) 68,255 6,212,449 As at the end of the year 1,694,358 1,626,103
II Equity shares include a Shares allotted pursuant to a contract without consideration being received in cash.
Issued to the shareholder of subsidiary company in exchange of 1,700,000 fully paid up equity shares of Rs. 10/- each on 19th October 2010.
b Shares allotted by way of bonus shares. On Capitalisation out of Reserves to an extent of 16,246,934 Equity Shares of Rs. 10/- each on 11th January 2011.
SHARE CAPITAL (contd.)

91
Notes on Consolidated Financial Statement for the year ended March 31, 2017 (contd.)
4. DEFERRED TAX LIABILITY
i. Deferred tax liability:
On account of depreciation on property, plant and equipment 187,143,516 187,262,068
Total 187,143,516 187,262,068
ii. Deferred tax asset: On account of timing differences in recognition of expenditure 34,790,810 33,354,128 On account of depreciation on property, plant and equipment - 628,132 Total 34,790,810 33,982,260
Net Deferred tax liability/(asset) 152,352,706 153,279,808
5. LONG TERM PROVISIONS Provisions for employee benefits - Leave Encashment 37,909,182 39,159,030
Total 37,909,182 39,159,030
As at 31.03.2017 As at 31.03.2016
RESERVES AND SURPLUS (contd.) Rs. Rs.
Surplus i.e. balance in Statement of Profit & Loss As at the beginning of the year 1,939,158,844 2,165,301,562 Add :Transferred from Statement of Profit and Loss (44,843,253) (91,853,970)Less:Depreciation on OB - - Transferred to General Reserve - 12,276,613 Proposed Dividend - 101,374,643 Provision towards dividend distribution tax - 20,637,492 As at the end of the year 1,894,315,591 1,939,158,844
Total 4,355,593,876 4,400,368,874
6. SHORT TERM BORROWINGS
Secured Loans Loans repayable on demand- from banks 453,428,002 276,415,453
Total 453,428,002 276,415,453
Additional Information Details of security for secured loans
- Balance of Working Capital Loan from M/s Bank of Baroda as on reporting date - Secured by Hypothecation of Raw Materials, Goods-in-process, Finished Goods and Book Debts and a charge on property, plant and equipments of the company located at Unit I and Select Assets located on 4.33 acres of land on survey no. 59/2 at Unit II.
453,428,002
276,415,453
Loans repayable on demand Terms of repayment of secured loans - from banks 453,428,002 276,415,453 Interest at 2% over base rate (floating)

TD Power Systems Limited
92
As at 31.03.2017 As at 31.03.2016
Rs. Rs.
7. TRADE PAYABLES
To Micro, Small and Medium Enterprises 8,876,193 9,572,649 Others 1,292,607,679 1,436,678,910
Total 1,301,483,871 1,446,251,559 Additional Information The details of amounts outstanding to Micro, Small and Medium Enterprises under Micro Small and Medium Enterprises Development Act, 2006 (MSMED Act), based on the available information with the Company are as under:
Notes on Consolidated Financial Statement for the year ended March 31, 2017 (contd.)
1. Principal amount due and remaining unpaid 8,876,193 9,572,649
2. Interest due on (1) above and the unpaid interest 811,471 198,929
3. Interest paid on all delayed payments under the MSMED Act - -
4. Payment made beyond the appointed day during the year 198,071 312,300
5. Interest due and payable for the period of delay other than (3) above
1,241 2,528,449
6. Interest accrued and remaining unpaid 812,712 2,727,378
7. Amount of further interest remaining due and payable in succeeding years
26,441,652
26,683,204
8. OTHER CURRENT LIABILITIES
Provision for taxation - 9,164,419 Unclaimed dividends 129,025 86,004 Outstanding Liabilities 273,106,843 529,285,380 Duties and taxes payable 17,974,000 13,505,279 Trade advance received from customers 305,874,994 403,288,414 Earnest Money Deposit 215,000 215,000 Other liabilities 64,028,967 60,834,914
Total 661,328,829 1,016,379,410
9. SHORT TERM PROVISIONS
Reserve for Future Contract 102,401,919 113,338,049 Provision for warranties 18,611,949 23,188,814 Provisions for employee benefits - Leave Encashment 8,969,088 6,271,200 Proposed dividend (including dividend distribution tax) - 122,012,135
Total 129,982,956 264,810,198

93
Asset Life (in Years)
Factory building 30 and 5Non factory building 60 and 5Plant and Machinery - (Double shift basis) 10
Office equipment 5
Furniture and fittings 10
Computers 3 and 6
Communication equipments 5
Particulars
Gross Block (At Cost) Depreciation Net Block
As at 01.04.2016
Additions during the
year
Deductionsduring the
year
As at 31.03.2017
As at 01.04.2016
For the year
Deductions
As at 31.03.2017
As at 31.03.2017
As at 31.03.2016
Tangible Assets
Free Hold Land 264,449,392 10,858,052 - 275,307,444 - - - - 275,307,444 264,449,392
Buildings 1,112,933,765 - - 1,112,933,765 162,478,099 37,250,460 - 199,728,559 913,205,206 950,455,666
Plant & Machinery (*) 1,977,895,677 16,880,643 6,616,948 1,988,159,372 826,016,722 196,803,265 1,694,024 1,021,125,963 967,033,410 1,151,878,956
Office Equipments 32,774,187 1,262,357 4,257,479 29,779,065 20,478,179 3,402,096 3,992,828 19,887,448 9,891,617 12,296,008
Furniture & Fixtures 36,192,336 883,801 682,876 36,393,261 17,479,778 3,157,129 378,071 20,258,836 16,134,425 18,712,558
Computers 55,274,234 3,965,493 8,650,833 50,588,894 46,406,928 4,544,309 8,322,877 42,628,360 7,960,534 8,867,305
Communication Equipments
1,691,409
529,724
-
2,221,133
1,501,637
75,434
-
1,577,071
644,063
189,772
Motor Vehicles * 39,819,522 2,419,100 6,773,122 35,465,500 24,575,993 5,081,732 5,599,774 24,057,951 11,407,549 15,243,529
Total 3,521,030,522 36,799,170 26,981,258 3,530,848,434 1,098,937,336 250,314,425 19,987,574 1,329,264,188 2,201,584,248 2,422,093,186
Previous Year 3,382,373,547 164,630,534 25,973,561 3,521,030,519 838,653,261 259,829,742 15,471,054 1,083,011,950 2,438,018,569
10. PROPERTY, PLANT AND EQUIPMENT
Addition information - (*) Accumulated depreciation as on 1st April 2004 under Owned Assets includes accumulated depreciation of leased asset also.
PROPERTY, PLANT & EQUIPMENT - RESEARCH & DEVELOPMENT
Particulars
Gross Block (At Cost) Depreciation Net Block As at
01.04.2016Additions during the
year
Deductionsduring the
year
As at 31.03.2017
As at 01.04.2016
For the year
Deductions As at 31.03.2017
As at 31.03.2017
As at 31.03.2016
Tangible Assets
Plant & Machinery 160,091,717 - - 160,091,717 36,894,502 15,925,384 - 52,819,886 107,271,831 123,197,215
Total 160,091,717 - - 160,091,717 36,894,502 15,925,384 - 52,819,886 107,271,831 123,197,215
Previous Year 160,091,717 - - 160,091,717 36,894,502 15,925,384 - 52,819,886 107,271,831
Notes on Consolidated Financial Statement for the year ended March 31, 2017 (contd.)
(Amount in Rs.)
(Amount in Rs.)
PROPERTY, PLANT AND EQUIPMENT
Particulars
Gross Block (At Cost) Amortisation Net Block
As at 01.04.2016
Additions during the
year
Deductionsduring the year
As at 31.03.2017
As at 01.04.2016
For the year
Deductions As at 31.03.2017
As at 31.03.2017
As at 31.03.2016
Intangible Assets
Technical Know-how 61,577,865 - - 61,577,865 24,631,152 12,315,577 - 36,946,729 24,631,136 36,946,713
Total 61,577,865 - - 61,577,865 24,631,152 12,315,577 - 36,946,729 24,631,136 36,946,713
Previous Year 61,577,865 - - 61,577,865 12,315,576 12,315,576 - 24,631,152 36,946,713 -
(Amount in Rs.)
Note: Depreciation is calculated on the basis of the estimated useful life of the asset as prescribed in Schedule II or actual useful life of the asset whichever is lower. The Life of assets followed by company is as follows:

TD Power Systems Limited
94
Notes on Consolidated Financial Statement for the year ended March 31, 2017 (contd.)
As at 31.03.2017 As at 31.03.2016
Rs. Rs.
11. CAPITAL WORK-IN-PROGRESS Land 303,000 63,000
Total 303,000 63,000 Intangible assets under development Technical Know-how 6,562,500 6,562,500
Total 6,865,500 6,625,500
12. NON CURRENT INVESTMENTS
Details of Investments Name of the Company
No. of Shares
Face Value
As at 31.03.2017 Rs.
As at 31.03.2016 Rs.
Non - Trade Investments (Unquoted) Investments in Equity InstrumentsOthers
Fully paid up M/s. The Shamrao Vithal Co-operative Bank Ltd.
2,000
25
50,000
50,000
Total 50,000 50,000 Additional Information Aggregate value of unquoted investments: Cost 50,000 50,000
13. LONG TERM LOANS AND ADVANCES
Capital advances 132,429,900 135,138,133 Security Deposit 17,527,220 17,527,220 MAT Credit Entiltement - 40,000,000 Advance payment of Tax (net of Provisions) 4,068,126 - Total 154,025,246 192,665,353 Additional Information Breakup of above
Unsecured, considered good 154,025,246 192,665,353
14. INVENTORIES
Raw materials 356,201,546 320,532,696 Work in progress 260,640,983 312,996,102 Finished goods 29,545,749 - Stock in trade 146,319,393 217,746,408 Goods in transit:
Raw materials - At port 7,115,283 29,990,007 Total 799,822,954 881,265,213

95
Notes on Consolidated Financial Statement for the year ended March 31, 2017 (contd.)
As at 31.03.2017 As at 31.03.2016
Rs. Rs.
15. TRADE RECEIVABLES
Trade receivables exceeding six months 601,200,720 590,024,860 Others 1,251,950,189 1,266,425,491 Total 1,853,150,909 1,856,450,351 Less: Provision for bad and doubtful debts 304,008,077 304,008,077 Total 1,549,142,832 1,552,442,274 Additional informationBreakup of above
Secured, considered good 52,472,744 63,081,449 Unsecured, considered good 1,496,670,088 1,489,360,825
Total 1,549,142,832 1,552,442,274
16. CASH AND BANK BALANCESCash and cash equivalents Balances with banks
on current accounts 453,396,182 548,087,805 Cash on hand 386,806 252,367 Other bank balances Balances with banks
in margin money 71,500,000 71,600,000 in deposit accounts exceeding 12 months maturity 993,000,000 837,217,695 in deposit accounts exceeding 3 months but not exceeding 12 months 627,907,649 800,986,410
Total 2,146,190,637 2,258,144,277
17. SHORT TERM LOANS AND ADVANCESRent Deposit 20,164,030 4,867,421 Balance with Statutory/ Govt authorities 277,270,840 239,223,357 Prepaid Expenses 9,407,640 9,096,862 Trade Advance 91,889,412 180,614,800 Interest accrued on term deposits 22,686,449 17,300,926 Others 13,452,548 4,507,115
Total 434,870,919 455,610,481
Less: Provision for doubtful advances - -Additional informationBreakup of above
Secured, considered goodUnsecured, considered good 434,870,919 455,610,481

TD Power Systems Limited
96
Notes on Consolidated Financial Statement for the year ended March 31, 2017 (contd.)
As at 31.03.2017 As at 31.03.2016
Rs. Rs.
18. CONTINGENT LIABILITIES AND COMMITMENTS(to the extent not provided for)
a) Contingent Liabilities - Guarantees 805,479,396 827,075,951 - Letters of credit 382,216,114 353,772,096 The management believes, based on internal assessment and / or legal advice, that the probability of an ultimate adverse decision and outflow of resources of the Company is not probable and accordingly, no provision for the same is considered necessary.
b) Commitments - Estimated amount of contracts remaining to be executed on capital account and not provided for (net of advances)
14,792,344
9,639,203
- Corporate Guarantee issued to the bankers of the subsidiary company
430,000,000 430,000,000
- Corporate Guarantee issued on behalf of subsidiary company. (Japan WOS)
- -
Department of Income Tax (TDS Circle) have issued demand notice under section 201(1)/201(1a) of the Income Tax act, based on tax payer’s data reflected in the computer system of the department for Short deduction/Short payments and interest thereon, for the previous financial years amounting to Rs. 7,20,817/- including Rs. 2,20,930/- towards interest on such short deduction/payment under Forms 27EQ, 26Q & 24Q. The company has pursued the matter with the department and the same is under appeal for such short deduction/late payment.
The company has submitted necessary documents for the EPCG licence No. 073001256 dt.10.07.2013 to the extent of Rs. 6.95 Crores and has completed the export obligation of Rs. 41.71 Crores along with annual average of Rs. 71.84 Crores against the licence, awaiting discharge certificate from JDGFT.
The Company has obtained EPCG licence No. 0730014370 dt. 31.03.2015 to the extent of Rs.1.92 Crores for importation of capital goods without payment of customs duties. Under the licence the company will have to fulfill the export obligation of Rs.11.574 Crores along with annul average exports of Rs. 71.84 Crores from year 2014-15 to the year 2020-2021.
Current Year Previous Year
Rs. Rs.
19. REVENUE FROM OPERATIONS
Sale of Goods - AC Generators 3,092,151,170 3,713,909,467 - AC Generator Spares 359,572,341 356,524,304 - Power Business Inland 44,398,893 530,418,374 - Power Business Overseas Japan Branch 526,728,953 398,417,427 - Power Business Overseas Japan WOS 97,616,870 287,050,973 - Power Business Inland - EPC 17,245,549 119,107,718 - Reserve for Future Contract - ADD / ( Less ) - 111,694,563
Total 4,137,713,776 5,517,122,826

97
Notes on Consolidated Financial Statement for the year ended March 31, 2017 (contd.)
Current Year Previous Year
REVENUE FROM OPERATIONS (Contd.) Rs. Rs. Sale of services 289,863,964 108,896,757 Other operating revenues 39,812,278 43,267,624 Total 4,467,390,018 5,669,287,207 Less Intersegmental sales 168,208,543 178,702,447 Intercompany 196,423,205 48,956,670 Excise duty 303,668,138 374,115,935
Total 3,799,090,132 5,067,512,155
20. OTHER INCOME
Interest income on Bank Deposits 131,457,029 129,789,051 Dividend Income
- long term investments 6,000 6,000 Other non operating income (net of expenses directly attributable to such income)
73,050,409
72,088,995
Total 204,513,438 201,884,046
21. COST OF MATERIALS CONSUMED
Consumption of raw materials 2,168,193,088 2,480,183,902 Consumption of stores and spare parts 32,614,349 28,103,553
Total 2,200,807,437 2,508,287,455
Consumption of major raw materials Copper (wires, strips, rods, sheet etc.) 360,335,193 358,226,445 Steel/ Laminations 293,802,150 347,418,748 Shaft Forgings 114,711,808 141,575,885 Others 1,399,343,937 1,632,962,824
Total 2,168,193,088 2,480,183,902
Purchases for Projects & EPC Business 352,737,932 1,079,574,976
22. CHANGES IN INVENTORIES OF FINISHED GOODS, WORK IN PROGRESS
Stocks at the end of the year Work in progress: A C Generators 260,640,983 312,996,102 Finished goods: A C Generators 29,545,749 -Total 290,186,732 312,996,102 Less: Stocks at the beginning of the year Work in progress: A C Generators 312,996,102 368,985,660 Finished goods: A C Generators - 35,019,368
Total 312,996,102 404,005,028
Net (Increase) / Decrease in Stock 22,809,370 91,008,926

TD Power Systems Limited
98
Notes on Consolidated Financial Statement for the year ended March 31, 2017 (contd.)
Current Year Previous Year
Rs. Rs. 23. EMPLOYEE BENEFIT EXPENSES
Salaries and wages 478,864,449 458,146,138 Contribution to provident and other funds 30,527,277 61,856,580 Remuneration to whole time directors including contributions 8,105,103 23,870,864 Staff welfare expenses 120,480,012 116,643,548
Total 637,976,841 660,517,130
24. FINANCE COSTS Interest expense 41,428,844 49,815,031
Total 41,428,844 49,815,031
25. DEPRECIATION AND AMORTIZATION Depreciation 266,239,809 275,755,123 Amortization of intangible assets 12,315,577 12,315,576
Total 278,555,386 288,070,699
26. OTHER EXPENSESPower and fuel 49,647,337 56,087,994 Rent 6,716,690 15,352,766
Repairs and Maintenance
Buildings 1,501,449 5,196,718 Machinery 15,757,284 27,448,332 Others 9,563,022 10,138,814 Insurance 8,480,858 7,163,369 Rates and taxes 5,898,577 2,693,146
Payment to the auditors
as auditor 1,952,935 1,976,000
for taxation matters 810,000 621,250
for other services 865,979 1,252,961 Selling expenses 72,080,430 111,144,767 Provision for doubtful trade receivables - 151,121,835 Loss on sale of property, plant and equipment 2,514,082 3,086,036 Donations 1,191,875 1,590,458 Legal and professional charges 45,378,288 52,086,769 Directors sitting fees 1,414,324 1,831,950 Travelling and Conveyance 133,665,071 121,677,053 Bank Charges 23,102,977 20,713,647 Foreign Exchange Fluctuation 61,849,064 - Postage, Telegrams and Telephones 9,778,616 11,651,170 Royalty 582,200 6,744,279 Software Expenses on ERP 22,170,473 13,960,170 Manufacturing Expenses 11,919,418 18,653,114

99
Current Year Previous Year
OTHER EXPENSES (Contd.) Rs. Rs. Vehicle Maintenance 7,166,015 5,703,911 Advertisement 5,065,761 4,259,123 Printing & Stationary 6,127,883 7,077,729 Subscription to Technical Associations, Journals & Magazines 1,641,044 2,043,528
Total 506,841,652 661,276,889
27. ADDITIONAL INFORMATION
Value of Imports calculated on CIF basis Raw Materials 391,928,004 580,542,320 Capital goods 1,644,062 67,285,616 Expenditure in foreign currency: (net of withholding tax) Others - On Payment Basis 55,887,472 84,811,482 Capital Equipment Purchased 1,382,985 41,622,232
Notes on Consolidated Financial Statement for the year ended March 31, 2017 (contd.)
Particulars Amount (Rs.) % to total Amount (Rs.) % to total
Value of imported raw materials, spare parts and components consumed
444,350,364
20.11%
469,760,968
18.24%
Value of indigenous raw materials, spare parts and components consumed
1,765,497,382
79.89%
2,106,345,225
81.76%
Total 2,209,847,746 100.00% 2,576,106,193 100.00%
Details of non-resident shareholdings Number of non-resident shareholders 153 109 Number of shares held by non-resident shareholders 6,128,355 7,922,746
Earnings in foreign exchange Export of goods calculated on FOB basis 1,684,468,797 1,764,215,818 Royalty, Know-how, professional and consultancy fees 42,984,013 11,607,061 Other Income 2,039,754 2,076,051
28. EARNINGS PER SHAREAfter extraordinary item: Profit / Loss for the year after tax expense (44,843,253) (91,853,966)
Weighted average number of equity shares 33,237,588 33,237,588
Earning per share (1.35) (2.76)
29. DISCLOSURES AS PER ACCOUNTING STANDARD 15 “EMPLOYEE BENEFITS”
Defined Contribution PlanEmployer’s Contribution to Provident Fund & Pension Scheme 21,066,707 21,704,697 Employer’s Contribution to Superannuation Fund - -Defined Benefit Plan The employees’ gratuity fund scheme managed by a trust is a defined benefit plan. The Present value of obligation is determined based on actuarial valuation using the projected unit credit method.

TD Power Systems Limited
100
Notes on Consolidated Financial Statement for the year ended March 31, 2017 (contd.)
Current Year(Rs.)
Previous Year(Rs.)
Disclosures as per Accounting Standard 15 “Employee Benefits” (contd.)
Gratuity (Funded)
Leave (Unfunded)
Gratuity (Funded)
Leave (Unfunded)
Defined Benefit obligation at beginning of the reporting period
50,712,240
41,700,710
50,038,740
47,690,902
Current Service Cost 5,287,290 4,482,700 5,024,068 9,918,485 Interest Cost 4,056,979 3,002,140 3,378,482 2,883,471 Acqusition adjustment - (607,282) (6,195,926) (6,337,171)Actuarial (gain)/ loss 5,453,830 (2,913,110) 4,760,585 (3,682,553)Benefits Paid (6,952,887) - (6,293,709) (8,772,424)Defined Benefit obligation at end of the reporting period 58,557,452 45,665,158 50,712,240 41,700,710 Obligations at end of the period -Current 5,677,938 8,969,088 4,999,471 6,833,421 Obligations at end of the period -Non -Current 52,879,514 36,696,070 45,712,769 34,867,289 Reconciliation of opening and closing balance of fair value of plan assets Fair value of plan assets at beginning of the reporting period *
67,732,657 -
59,913,270
-
Acqusition adjustment - - (6,195,926) -Expected return on plan assets 5,613,284 - 4,932,366 -Employer Contribution 11,392,455 - 15,244,199 -Benefits paid (6,952,887) - (6,293,709) -Actuarial gain/(loss) - - 132,457 -Fair value of plan assets at reporting period 77,785,509 - 67,732,657 - Reconciliation of fair value of assets & obligationsFair value of plan assets 77,785,509 - 67,732,657 -Present value of obligation (58,557,452) - (50,712,240) -
Funded assets in excess of obligation of prior years (19,228,057) - (17,020,417) -Amount recognised in B/S under liabilities - - Expense recognised during the year
Current Service Cost 5,287,290 4,482,700 5,024,068 9,918,485 Interest Cost 4,056,979 3,002,140 3,378,482 2,883,471 Expected return on plan assets (5,613,284) - (4,932,366) - Actuarial (gain)/ loss 5,453,830 (2,913,110) 4,893,042 (3,682,553)Net Cost 9,184,815 4,571,730 8,363,226 9,119,403
Actuarial assumptions Mortality Table
1994 –96 (Ultimate)
Indian Assured Lives
Mortality (2006-08) (modified)
ULT
1994 – 96 (Ultimate)
Indian Assured Lives Mortality
(2006-08) (modified) ULT
Discount rate (per annum) 8.00% 7.30% 8.00% 7.90%Expected rate of return on plan assets (per annum)
8.00%
NA
8.00%
NA
Rate of escalation in salary (per annum) 7.00% 7.00% 7.00% 7.00%The estimates of rate of escalation in salary considered in actuarial valuation, take into account inflation, seniority, promotion and other relevant factors including supply and demand in the employment market. The above information is as certified by the actuary.

101
Notes on Consolidated Financial Statement for the year ended March 31, 2017 (contd.)
30.SEGMENT REPORTINGThe company’s operation comprises of Manufacturing business & Project Business. Primary segmental reporting comprises of Manufacturing Business, Project Business & EPC Segments. Secondary Segmental reporting is based on geographical location of Activities. Under primary segment revenue and direct expenses, which relate to a particular segment and which are identifiable, are reported under that segment
Certain expenses, which are not allocable to any specific segment, are separately disclosed at the enterprise level. Cash and bank balances in India are reported at the enterprise level as the company operates common bank accounts. Property, plant and equipment, Liabilities, Current assets and Current liabilities relating to specific business segments are identified and reported. Those that are not identifiable are reported as common items.
Secondary segment is reported based on the geographical location of the company, viz., India, Japan, USA, Europe and Hongkong. Revenues in the secondary segment are based on the sales made by the branch office and subsidiaries. Inter-segmental purchases & sales are separately identified and reported. Property, plant and Equipments, Current Assets including Cash and Bank accounts, and Current Liabilities are identified based on the branch office to which they relate and are reported accordingly.
Particulars Manufacturing Project Business EPC Common Total
Segment RevenuesExternal Revenues 3,461,917,077 684,559,255 17,245,548 - 4,163,721,880 Intersegment/Company revenues (168,208,543) - - - (168,208,543)Intercompany (196,423,205) - - - (196,423,205)Total Revenues 3,097,285,329 684,559,255 17,245,548 - 3,799,090,132
Segment ResultsProfit Before Taxation and Interest 192,530,240 (52,738,936) (22,014,418) (39,859,993) 77,916,892 Less: Interest 40,617,373 - 811,471 - 41,428,844 Less: Depreciation & Amortization 277,014,184 257,937 990,936 292,327 278,555,384 Total (125,101,318) (52,996,873) (23,816,825) (40,152,320) (242,067,336)
Unallocable & Other Income (including Extraordinary items) 52,733,297 80,824,679 - 70,955,469 204,513,445 Less: Tax 0 7,834,500 - (545,139) 7,289,361
Total Profit (72,368,021) 19,993,307 (23,816,825) 31,348,288 (44,843,253)
Current Year (Amt in Rs.)PRIMARY SEGMENT
Previous Year (Amt in Rs.)
Segment RevenuesExternal Revenues 3,816,407,615 1,247,961,376 230,802,281 - 5,295,171,272 Intersegment revenues (178,702,447) - - - (178,702,447)Intercompany (38,903,032) - (10,053,638) - (48,956,670)
Total Revenues 3,598,802,136 1,247,961,376 220,748,643 - 5,067,512,155
Segment ResultsProfit Before Taxation and Interest 287,884,259 35,599,765 (217,909,724) (38,727,520) 66,846,779
Less: Interest 48,144,944 78 1,670,009 - 49,815,031
Less: Depreciation & Amortization 283,450,362 257,937 4,070,071 292,327 288,070,697
Total (43,711,047) 35,341,750 (223,649,804) (39,019,847) (271,038,948)

TD Power Systems Limited
102
Notes on Consolidated Financial Statement for the year ended March 31, 2017 (contd.)
(Amt in Rs.)
Manufacturing Project Business EPC Common Total
Segment Assets -Current Year 4,751,842,069 635,324,123 143,032,619 1,894,256,491 7,424,455,303 Previous Year (2015-2016) 4,752,837,495 927,859,211 220,763,253 2,027,580,253 7,929,040,212 Segment Liabilities - Current Year 1,539,023,680 116,365,277 474,592,566 723,315 2,130,704,839 Previous Year (2015-2016) 1,482,091,700 657,394,115 625,479,773 1,634,609 2,766,600,197 Capital Expenditure (Net of disposal) - Current Period 24,456,388 2,419,100 (17,057,579) - 9,817,909 Previous Year (2015-2016) 149,557,098 - (10,900,125) - 138,656,973
GEOGRAPHICAL SEGMENT Segment revenue by Geographical Market Current Year
Rs. Previous Year
Rs.
Sales of India 3,353,127,755 4,564,589,030 Sales of overseas 810,594,125 730,582,242 Less: Inter-segmental sales (168,208,543) (178,702,447)Less: Inter-company (196,423,205) (48,956,670)
Total 3,799,090,132 5,067,512,155
Carrying amounts of geographical assets & additions to tangible & intangible property, plant & equipment
Carrying amounts of segment assets (Amt in Rs.)
Additions to property, plant and equipments & Intangible assets
(Amt in Rs.)As at 31.03.2017 As at 31.03.2016 As at 31.03.2017 As at 31.03.2016
Located in India 6,524,598,806 6,988,945,076 5,358,248 138,656,973 Located outside India 899,856,497 940,095,136 4,459,662 -
Total 7,424,455,303 7,929,040,212 9,817,909 138,656,973
31. RELATED PARTIES DISCLOSURE
Name of the Related Party Relationship Nikhil Kumar Key Managerial Personnel and their Relatives.
Mohib Khericha Key Managerial Personnel and their Relatives.
K G Prabhakar Key Managerial Personnel and their Relatives.
N Srivatsa Key Managerial Personnel and their Relatives.
Sagir Khericha Key Managerial Personnel and their Relatives.
B C Harish Key Managerial Personnel and their Relatives.
PRIMARY SEGMENT (Contd.) Manufacturing Project Business EPC Common Total
Unallocable & Other Income (including Extraordinary items) 64,117,562 62,515,846 - 75,250,635 201,884,043 Less: Tax 7,504,282 12,080,387 - 3,114,392 22,699,061
Total Profit 12,902,233 85,777,209 (223,649,804) 33,116,396 (91,853,966)

103
32. OPERATING LEASESThe Company has various operating leases for office facilities, guesthouse and residential premises of employees that are renewable on a periodic basis, and cancelable at its option. Rental expenses for operating leases included in the financial statements for the year are Rs. 2,436,544/- (Previous year Rs.15,352,766/-).
Related Parties Disclosure (contd.) (Amt in Rs.)
Nature of transactions
Key management personnel and
their Relatives
Enterprises over which Key
Managerial Personnel and their Relatives are able to exercise
significant influence2017 2016
Directors Remuneration and Commission
Nikhil Kumar 2,520,000 19,528,828 -
K. G. Prabhakar 5,585,103 4,812,980 -
Key Managerial Personnel
N. Srivatsa 4,679,561 4,030,193 -
Relative of Director
Sagir M Khericha 525,000 809,066 -
Remuneration Paid
B. C. Harish - 7,078,161 -
Directors Sitting fees
Mohib Khericha 364,232 400,300 -
Lease Rent Paid
Mohib Khericha - 1,350,000 -
33. During the year the Company has made provisions towards warranty claims and Compensated Leave/Sick leave encashment the details of the same are as under
Warranty claims Compensated leave /Sick Leave
Balance outstanding at the beginning of the year 23,188,814 1,634,609 Provision for the year - 723,315
Utilized during the year 4,576,865 1,634,609 Withdrawn and credited to Statement of Profit and Loss - -
Balance outstanding at the end of the year 18,611,949 723,315
34. Foreign currency exposures which have not been hedged by any derivative Instruments or otherwise as at end of the reporting period is as follows:
Unhedged As at the end of Current Year (Rs.)
As at the end of Previous Year (Rs.)
Assets (Receivables) 779,121,769 637,545,123
Liabilities (payables) 321,837,051 320,128,987
(Amt in Rs.)
Notes on Consolidated Financial Statement for the year ended March 31, 2017 (contd.)

TD Power Systems Limited
104
35. The disclosure as per revised AS-7 in respect of contract in progress at the end of yearAs at the end of
Current Year (Rs.)As at the end of
Previous Year (Rs.)Contract revenue 3,080,044,372 3,080,044,372 Cost incurred 3,635,364,100 3,581,911,742 Recognised profit (Less recognized losses) 555,319,728 (501,867,370)Amount of advance received 18,994,427 23,805,584 Amount of retentions (Deferred debts) 388,497,957 341,276,551 In respect of dues from customer after appropriate netting off - - Gross amount due from customer for contract work as an asset - 110,670,182
Gross amount due to customer for contract work as liability - - Contingencies Nil Nil
36. CORPORATE SOCIAL RESPONSIBILITY i a. Gross amount required to be spent by the company during the year - Rs. 14,659,196/-
b. Amount spent including service tax during the year on
37. DISCLOSURE OF SPECIFIED BANK NOTES HELD AND TRANSACTED DURING PERIOD FROM 8TH NOVEMBER 2016 TO 30TH DECEMBER 2016
Sl. No. Towards Spent To be spent Total
1. Construction/acquisition of any asset - - - 2. On purposes other than (1) above 11,727,260 2,931,936 14, 659,196
Sl. No. Towards Spent To be spent Total
1. Construction/acquisition of any asset - - - 2. On purposes other than (1) above - 87,241 87,241
Particulars Specified Bank
Notes
Other denomination
notesTotal
Closing cash in hand as on 08.11.2016 320,500 36,992 357,492
ADD: Permitted receipts - 1,722,220 1,722,220
LESS: Permitted payments - 1,281,859 1,281,859
LESS: Amount deposited in Banks 320,500 - 320,500
Closing cash in hand as on 30.12.2016 - 477,353 477,353
ii a. Gross amount required to be spent by DF Power Systems Private Limited during the year: Rs. 87,241/- b. Amount spent during the year on
(Amt in Rs.)
(Amt in Rs.)
(Amt in Rs.)
Notes on Consolidated Financial Statement for the year ended March 31, 2017 (contd.)
38. NOTE ON MANAGERIAL REMUNERATION:-In view of inadequate profits for the current financial year, the remuneration paid to Managing Director (part of the year) & Whole Time Director (full year) of Rs. 25,20,000/- & Rs. 55,85,103/- respectively, is subject to approval of the shareholders.

105
e. Previous Year figures have been regrouped wherever required in conformity with the presentation for the current reporting period.
Name of the Entity in CFS Net Assets i.e., total assets minus total liabilities
Share in profit or loss
As % of Consolidated net
assets
Amount (Thousand)
As % of Consolidated profit
or loss
Amount (Thousand)
Parent TD Power Systems Limited 100.22% 4,698,314.97 1.98% 889.61 Subsidiaries Indian DF Power Systems Private Limited 0.11% 5,266.41 24.04% (10,780.46)Foreign TD Power Systems USA Inc -1.01% (47,511.33) 15.74% (7,058.93)
TD Power Systems Japan Limited 0.79% 36,950.48 0.87% 389.21
TD Power Systems Europe GmbH -0.11% (5,050.77) 63.07% (28,282.69)
Total 100.00% 4,687,969.76 100.00% -44,843.25
Notes on Consolidated Financial Statement for the year ended March 31, 2017 (contd.)
39 . a. The Group does not have any pending litigations which would impact its financial positon as on the reporting date.
b.
The Group has made provision, as required under the accounting standards, for material foreseeable losses, on long term contracts in respect of its wholly owned Indian subsidiary. The Company did not have any derivative contracts for which there were any material foreseeable losses.
c. There are no amounts required to be transferred to the Investor Education and Protection Fund by the Group as on the reporting date.
d. Additional Information, as required under Schedule III to the Companies Act, 2013, of enterprises consolidated as Subsidiary / Associates / Joint Ventures.
INTENTIONALLY LEFT BLANK

TD Power Systems Limited
Installations
Service Centers
AfghanistanArgentina Albania AlgeriaAustraliaAustriaBangladeshBelize BelarusBorundiBrazilBurkina Faso
CanadaChinaCosta RicaColombiaCongoCzech RepublicEgyptEthiopiaFijiFrance Faroe IslandsGhana
GeorgiaGermanyGuatemalaGuinea BissauHondurasIndiaIndonesiaIrelandIranIraqItalyJapan
JordanKenyaKoreaLaosLebanonLatviaMalaysiaMauritiusMexico, LapazMoroccoMozambiqueMyanmar
NepalNetherlands NicaraguaNigerNigeriaNorwayOmanPakistanPanamaPhilippinesPolandRussia
SalvadorSaudi Arabia Sierra SingaporeSouth AfricaSouth KoreaSpainSri LankaSwedenSwitzerlandTaiwanTanzania
ThailandTunisia TurkeyUAEUgandaUKUkraineUSAVietnamYemenZambia
ArgentinaAustralia Brazil Bangladesh Canada Costa Rica Germany Italy India
Subsidiary CompaniesIndonesia Japan NetherlandsNorway Nigeria Russia Singapore South Africa Thailand
USA Japan GermanyTurkey
Turkey UKUAE USA
is global

TD Power Systems LimitedREGISTERED OFFICE & FACTORY: 27, 28 and 29, KIADB Industrial Area Dabaspet, Nelamangala Taluk Bengaluru Rural DistrictBengaluru – 562 111 India
www.tdps.co.in