
Is Congo red an amyloid specific dye? - The Journal of ... · Is Congo red an amyloid specific dye?...
35
1 Is Congo red an amyloid specific dye? Ritu Khurana, Vladimir N. Uversky, Liza Nielsen, and Anthony L. Fink Department of Chemistry and Biochemistry, University of California at Santa Cruz, Santa Cruz, CA, 95064 Keywords: Induced circular dichroism, crosslinking, small angle X-ray scattering, amyloid fibrils Running title: Congo red binding Correspondence should be addressed to: Prof. Anthony L. Fink, Department of Chemistry & Biochemistry, University of California, Santa Cruz, CA 95064. Phone: 831 459-2744, FAX: 831 459-2935 Email: [email protected] Copyright 2001 by The American Society for Biochemistry and Molecular Biology, Inc. JBC Papers in Press. Published on February 28, 2001 as Manuscript M011499200 by guest on July 20, 2018 http://www.jbc.org/ Downloaded from
Transcript of Is Congo red an amyloid specific dye? - The Journal of ... · Is Congo red an amyloid specific dye?...
1
Is Congo red an amyloid specific dye?
Ritu Khurana, Vladimir N. Uversky, Liza Nielsen, and Anthony L. Fink
Department of Chemistry and Biochemistry, University of California at Santa Cruz, Santa Cruz,
CA, 95064
Keywords: Induced circular dichroism, crosslinking, small angle X-ray scattering, amyloid
fibrils
Running title: Congo red binding
Correspondence should be addressed to:
Prof. Anthony L. Fink, Department of Chemistry & Biochemistry, University of California, Santa Cruz, CA 95064.
Phone: 831 459-2744, FAX: 831 459-2935
Email: [email protected]
Copyright 2001 by The American Society for Biochemistry and Molecular Biology, Inc.
JBC Papers in Press. Published on February 28, 2001 as Manuscript M011499200 by guest on July 20, 2018
http://ww
w.jbc.org/
Dow
nloaded from
2
Abstract
Congo red (CR) binding, monitored by characteristic yellow-green birefringence under crossed
polarization has been used as a diagnostic test for the presence of amyloid in tissue sections for
several decades. This assay is also widely used for the characterization of in vitro amyloid fibrils.
In order to probe the structural specificity of Congo red binding to amyloid fibrils we have used
an induced circular dichroism (CD) assay. Amyloid fibrils from insulin and the variable domain
of Ig light chain demonstrate induced CD spectra upon binding to Congo red. Surprisingly, the
native conformations of insulin and Ig light chain also induced Congo red circular dichroism, but
with different spectral shapes than those from fibrils. In fact, a wide variety of native proteins
exhibited induced CR circular dichroism indicating that CR bound to representative proteins
from different classes of secondary structure such as α (citrate synthase), α+β (lysozyme), β
(Concavalin A) and parallel β-helical proteins (pectate lyase). Partially-folded intermediates of
apomyoglobin induced different Congo red CD bands than the corresponding native
conformation, however, no induced CD bands were observed with unfolded protein. Congo red
was also found to induce oligomerization of native proteins, as demonstrated by covalent
crosslinking and small angle X-ray scattering. Our data suggest that Congo red is sandwiched
between two protein molecules causing protein oligomerization. The fact that Congo red binds to
native, partially folded conformations and amyloid fibrils of several proteins shows that it must
be used with caution as a diagnostic test for the presence of amyloid fibrils in vitro.
by guest on July 20, 2018http://w
ww
.jbc.org/D
ownloaded from
3
Abbreviations:
CR – Congo red; CD - Circular Dichroism; ORD - optical rotary dispersion; DTSSP - [3,3`-
Dithiobis (sulfosuccinimidylpropionate)]; DSP [Dithiobis(succinimidylpropionate)]; SMA
initials of the patient with light chain amyloidosis whose sequence information was used to
generate synthetic recombinant proteins by Stevens et al (1995); ATR- Attenuated total
reflectance; FTIR - Fourier transform infrared spectroscopy; SDS – sodium dodecyl sulfate;
PAGE – polyacrylamide gel electrophoresis SAXS - Small angle X-ray scattering; ANS - 1, 8,-
anilino-naphthalene sulfonate
by guest on July 20, 2018http://w
ww
.jbc.org/D
ownloaded from
4
Introduction
In the 1920’s Benhold 1 and Divry 2 established that Congo red bound to amyloid in tissue
sections and demonstrated its characteristic yellow-green birefringence under crossed polarizers.
Since then this birefringence has been used as a diagnostic for amyloid fibrils. The birefringence
assay is not a simple one, for example, the tissue sections need to be of a required thickness to
show birefringence, reviewed by Elghetany and Saleem 3 and Westermark 4. Congo red binding
is not specific for amyloid in the tissue sections, but the assays are performed under extreme
conditions with 50 – 80 % ethanol, high salt and alkaline pH conditions to yield binding to
amyloid 5. Despite these extreme conditions, binding to collagen fibers and cytoskeletal proteins
results in false positive results 4. Due to the difficulties with the birefringence assay for in vitro
amyloid fibrils, Klunk and coworkers 6;7 have developed simpler filtration-based assays followed
by measuring the concentration of free Congo Red to quantify dye binding. The filtration assays
would not detect CR bound to soluble monomers or oligomers as they are not large enough to be
trapped by 0.2 µm filters. Large particles, such as amyloid fibrils, are retained on the filters
accounting for the loss of free dye molecules, whereas any native protein molecules bound to CR
would pass through the filter pores. Thus the filtration assay is not affected by possible binding
of CR to native soluble conformations of protein.
Benditt and coworkers 8 analyzed spectral probes such as absorbance red shift, optical rotatory
dispersion (ORD) and circular dichroism (CD) to describe the Cotton effect 9 responsible for
birefringence. They used human albumin, poly-L-lysine with different conformations and
amyloid fibrils as substrates for binding of Congo red. The random coil conformation of poly-L-
by guest on July 20, 2018http://w
ww
.jbc.org/D
ownloaded from

5
lysine did not show spectral changes, but both helical and β conformations induced Congo red
CD bands as well as ORD spectra similar to those observed with the amyloid fibril samples.
Edwards and Woody 10;11 demonstrated that induced circular dichroism can be used as a probe
for Cibacron blue and Congo red bound to dehydrogenases such as liver alcohol dehydrogenase,
yeast alcohol dehydrogenase , lactic dehydrogenase, and kinases including phosphoglycerate
kinase and porcine adenylate kinase. Edwards and Woody 11 believed that Congo red bound to
the coenzyme binding sites of the enzymes based on the similarities between dye and coenzyme
structures. Congo red has also been shown to bind other native proteins including cellular prion
protein 12, elastin 13, RNA polymerase 14 and human prostatic phosphatase 15.
The structure of Congo red,
SO3Na
NH2
N N NN
NH2
SO3Na
suggests that binding to protein could occur through a combination of both hydrophobic and
electrostatic interactions. An additional complication is that CR has been reported to form linear
ribbon-like micelles. 16;17 In an attempt to understand the binding specificity of Congo red we
have used induced circular dichroism as an assay for binding of CR to native proteins, partially
folded protein conformations and amyloid fibrils, using native proteins from a variety of
different secondary structure classes. The results suggest a mechanism of binding of Congo red
by guest on July 20, 2018http://w
ww
.jbc.org/D
ownloaded from

6
to native proteins involving the intercalation of Congo red between protein molecules leading to
oligomerization of the protein.
Materials and Methods
Fibril formation
Fibril were grown in vitro with a 0.5 mg/ml SMA (a recombinant amyloidogenic variable
domain of Ig light chain made by Stevens and coworkers 18) and 1 mg/ml bovine insulin solution
at pH 2 in 20 to 50 mM HCl and 100 mM NaCl, that were agitated using a magnetic stirrer in a
37 oC incubator for a day.
CD measurements
CD spectra were collected between 650 nm and 300 nm, with 1 nm step size, 10 s averaging
time, in an Aviv 62 DS spectropolarimeter. Induced CD spectra were obtained using a split
quartz cell with each compartment having a path length of 5 mm and total path length of 10 mm.
The protein and Congo red solutions of twice the final concentration were added in each
compartment to obtain a control spectrum. Induced circular dichroism was only observed upon
mixing the Congo red and the protein solutions before collecting the spectrum again. The
induced CD assay was performed at pH 7.5 using a 1 cm path length rectangular cell with final
Congo red concentration of 30 to 40 µM with protein concentration of 0.1 to 0.2 mg/ml. At pH
2.0 the induced CD assay was performed using a 10 cm path length circular CD cell with final
Congo red concentrations of 3 - 4 µM as the solubility of Congo red was much lower at pH 2.
Induced CD measurements for fibril samples were obtained with a 10 cm pathlength circular cell
using very dilute samples (80 to 400 nM), as at higher concentrations the fibril samples
precipitated as red particles.
by guest on July 20, 2018http://w
ww
.jbc.org/D
ownloaded from
7
Attenuated total reflectance-Fourier transform infrared spectroscopy (ATR-FTIR)
Hydrated (H2O) thin film spectra were collected using a Nicolet 800 FTIR spectrometer
equipped with a liquid nitrogen cooled MCT detector and purged with dry air. All samples were
scanned in an out-of-compartment horizontal ATR accessory (SPECAC) with a high throughput
73 x 10 x 6 mm, 45° trapezoidal germanium crystal (the internal reflectance element). To collect
spectra protein samples with and without Congo red were applied (40 µl of 1mg/mL protein
solution and 500 µM Congo red) and dried while being spread constantly with a spatula. Data
processing was done with GRAMS32 (Galactic Industries) and SAFAIR software as previously
described 19. Water vapor components were subtracted until the region between 1800 to 1700
wavenumbers was featureless.
Analysis of binding constants and number of binding sites
Equation 1 was used to fit the data obtained at 40 µM Congo red and varying the protein
concentration from 0 to 20 µM and measuring the CD spectra of protein bound dye molecules.
dm KL
LCnC
+=
][
][ (1)
where C is the change in circular dichroism signal at a particular wavelength measured upon
addition of protein ([L]) in varying concentration, Cm is the maximal CD change obtained by
varying the protein concentration at a constant Congo red concentration, n is the number of
binding sites for Congo red on the protein and Kd is the dissociation constant for binding of
Congo red to protein.
by guest on July 20, 2018http://w
ww
.jbc.org/D
ownloaded from
8
Crosslinking and SDS-PAGE analysis
10 µM DTSSP [3,3`-Dithiobis(sulfosuccinimidylpropionate)], a bifunctional, cleavable
crosslinking reagent, was added to the protein solution in the absence and presence of Congo red
and incubated for 1 hour. DTSSP (Pierce) is a sulfonated derivative of DSP
[Dithiobis(succinimidylpropionate)] that is water soluble, unlike DSP, and, like DSP, can be
cleaved under reducing conditions (the presence of DTT or β-mercaptoethanol). The crosslinked
protein was then precipitated using 10 % acetic acid, and spun in a centrifuge. The pellet was
resuspended in SDS loading buffer and separated on either a non-reducing or a reducing 8-25 %
SDS-PAGE gel.
Small-angle X-ray scattering experiments
Small angle X-ray scattering (SAXS) measurements were done using Beam Line 4-2 at Stanford
Synchrotron Radiation Laboratory (Wakatsuki et al., 1992). X-ray energy was selected at 8980
eV (Cu edge) by a pair of Mo/B4C multilayer monochromator crystals (Tsuruta et al., 1998).
Scattering patterns were recorded by a linear position-sensitive proportional counter, which was
filled with an 80% Xe / 20% CO2 gas mixture. Scattering patterns were normalized by incident
X-ray fluctuations, which were measured with a short length ion chamber before the sample. The
sample-to-detector distance was calibrated to be 230 cm, using a cholesterol myristate sample.
The measurements were performed in a 1.3 mm path length observation static cell with 25 µm
mica windows. To avoid radiation damage of the protein samples during the SAXS
measurements, the scavenger N-tert-butyl-α-(4-pyridyl)-nitrone-N’-oxide was added to a final
concentration of 10 mM. Background measurements were performed before and after each
by guest on July 20, 2018http://w
ww
.jbc.org/D
ownloaded from
9
protein measurement and then averaged for background subtraction. All SAXS measurements
were performed at 23±1 oC.
The radius of gyration (Rg) was calculated according to the Guinier approximation (Glatter &
Kratky, 1982):
ln I (Q) = ln I (0) – Rg2 Q2/3 (2)
where Q is the scattering vector given by Q=(4π sinθ)/λ (2θ is the scattering angle, and λ is the
wavelength of X-ray). I(0), the forward scattering amplitude, is proportional to n⋅ρc2⋅V2 where n
is the number of scatters (protein molecules) in solution; ρc is the electron density difference
between the scatter and the solvent; and V is the volume of the scatter. This means that the value
of forward-scattered intensity, I(0), is proportional to the square of the molecular weight of the
molecule (Glatter & Kratky, 1982). Thus, I(0) for a pure N-mer sample will therefore be N-fold
that for a sample with the same number of monomers since each N-mer will scatter N2 times as
strongly as monomer, but in this case the number of scattering particles (N-mers) will be N times
less than that in the pure monomer sample.
Estimation of the shape of particles using SAXS data
The relationship between RS (Stokes radius) and Rg (radius of gyration) is quite sensitive to the
shape and compactness of protein, as Rs/Rg=P1/3[5/(P2+2)]1/2, where P=a/b, and a and b are the
semiaxis of the revolution of the ellipsoid and the equatorial radius of the ellipsoid, respectively
20-22. In order to estimate the RS value for the oligomeric form of β-lactoglobulin the following
approach was used. SAXS data show that in the presence of 1 mM Congo red β-lactoglobulin
forms 28-mers, which corresponds to the particles with the molecular mass of 515,200 Da (= 28
by guest on July 20, 2018http://w
ww
.jbc.org/D
ownloaded from
10
x 18,400 Da). The value of RS of a globular protein with the molecular mass of 515,200 Da is
71.4 Å. This was calculated from an empirical equation 254.0)log(369.0)log( −⋅= MR NS 23
based on the intrinsic viscosity data 24. Here RSN is the Stokes radius of native (N) protein. It is
known that for an ideal spherical particle a=b, P=a/b=1.00 and RS/Rg=1.29, whereas for
globular proteins the average value of this ratio is about 1.25 25.
Results and Discussion
Amyloid Fibrils and native conformations show different induced Congo red CD bands
Amyloid fibrils made in vitro from purified proteins such as bovine insulin and Ig light chain
(SMA), were tested for binding to Congo red using the apple-green birefringence under crossed-
polarization (data not shown) and induced CD signal (Figure 1A). Low concentrations of fibril
solutions were used for induced CD measurements, as higher concentrations yielded red
precipitates. Both fibril samples showed major induced CD bands with positive maxima in the
vicinity of 570 nm and negative maxima in the vicinity of 500-525 nm. The spectrum for the
induced CD of insulin fibrils was red-shifted relative to that for the light chain fibrils. The shape
of the induced CD bands for Congo red bound to fibrils is different from that described by
Benditt et al 8 for tissue extracted amyloid. The differences are most likely due to “contaminants”
such as glycosaminoglycans, serum amyloid protein etc. present in the ex-vivo extracts. Native
insulin and native SMA show induced Congo red CD bands that differ in shape and intensities
from the CD bands induced upon binding to the fibrils (Fig 1B). Instead of a positive and a
negative peak observed for the corresponding amyloid fibrils the native proteins show a broad
positive band between 500 and 600 nm, that possibly has several components. The peculiar CD
band shape with a maxima and a minima is related to the special nature of birefringence 26
by guest on July 20, 2018http://w
ww
.jbc.org/D
ownloaded from

11
observed for amyloid fibrils upon binding to Congo red. The positive peaks induced by the
native proteins were 10-fold smaller in intensity compared to their corresponding amyloid fibrils.
A probable explanation is that amyloid fibrils have more binding sites for Congo red than the
native protein. The intensity of the induced Congo red CD bands upon binding to native SMA
was much smaller than that for native insulin. It is possible that the hexameric insulin (under
native conditions) has more Congo red binding sites, leading to a larger induced CD signal,
compared to native SMA.
Congo red binds to native proteins from different secondary structure classes
Native proteins such as lysozyme (α+β), concavalin A (β) and citrate synthase (all α), (Figure 2)
showed induced Congo red CD signals, thus revealing binding of Congo red. A number of other
native proteins from different structural classes, interleukin-2 (all α), malate dehydrogenase
(α/β), β-lactoglobulin, and apomyoglobin (α) also showed induced Congo red CD signals (data
not shown). Other than the observation that the major induced CD bands were in the vicinity of
525 nm, and quite broad, no consistent patterns were apparent. Circular dichroism bands in the
visible region were not observed for protein alone, or Congo red alone. This was demonstrated
by using split cells where one side of the cell contains the protein solution and the other side of
the cell contains Congo red solution, no CD bands were observed until the protein and Congo red
solutions were mixed together. Interestingly, no Congo red CD bands were induced in the
presence of unfolded protein (e. g. acid unfolded apomyoglobin; Figure 5), amorphous
aggregates of P22 tail spike protein, or Ig light chain variable domain, or inclusion bodies. These
results are supported by a report that there are no Congo red CD or ORD signals with the random
coil conformation of poly-L-lysine 8. Whereas the induced CD bands indicate a specific
orientation of Congo red, which is assumed to be due to binding of the dye to the protein, the
by guest on July 20, 2018http://w
ww
.jbc.org/D
ownloaded from

12
absence of an induced CD band does not necessarily mean the absence of dye binding, but rather
the lack of specific orientation responsible for the induced CD bands.
Given that unfolded protein did not induce Congo red CD bands, we conclude that significant
secondary structure, and probably a collapsed conformation is required to induce a specific
orientation of Congo red molecules responsible for CD bands. Indeed Turnell and Finch 27
observed a Congo red molecule intercalated between the antiparallel β-strands of two insulin
molecules, using X–ray diffraction of a crystalline complex. However, our results suggest that
Congo red binding is not limited to β-sheet proteins; rather, all classes of proteins, α-helical,
β and α+β, also bind Congo red resulting in the observed induced CD bands. Congo red binding
to dehydrogenases of the α/β class has been reported previously, and is thought to reflect
specific interactions with coenzyme binding sites, due to structural similarities between CR and
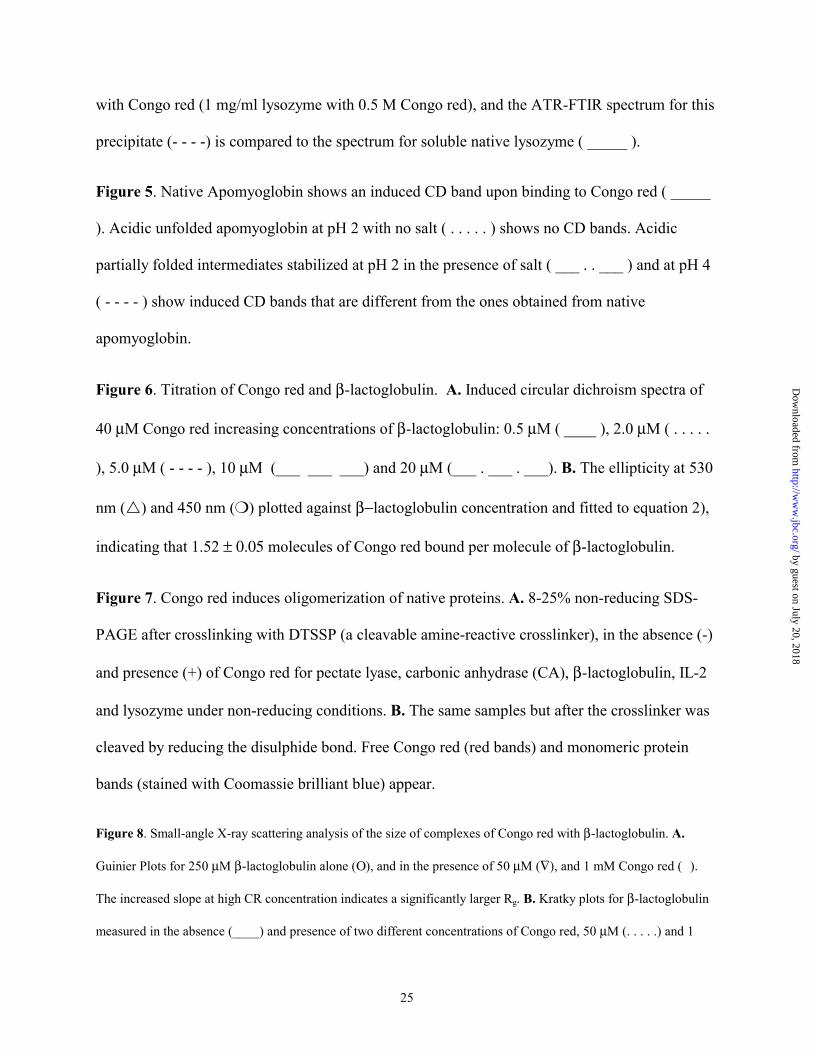
the coenzyme. 10 β-Helical proteins also induced Congo red CD bands (Figure 3). Interestingly,
the right-handed β-helical proteins including pectate lyase,28 and p22 tailspike protein29 induced
different Congo red CD bands, with positive ellipticity, compared to the left-handed β-helical
protein LpxA,30 which induced two negative Congo red CD bands. This suggests that the
positive or negative CD bands may reflect the underlying chirality of the CR binding site.
In view of the fact that the induced CD spectra demonstrate that proteins from all classes of
secondary structures bind Congo red, Congo red binding is clearly not restricted to the crossed-β
structures present in amyloid fibrils. Benditt and coworkers 8 have also shown binding of Congo
red to both α and β conformations of poly-L-lysine. It is possible that the shape of the induced
Congo red CD bands has specific clues as to which secondary structures in the proteins Congo
red dye is bound, but more work is needed to understand these distinctions. The lack of
by guest on July 20, 2018http://w
ww
.jbc.org/D
ownloaded from
13
correlation between the shape of the induced CD band and the protein secondary structure
suggests that binding sites for CR in individual proteins are more related to their specific
environment rather than to a particular type of secondary structure.
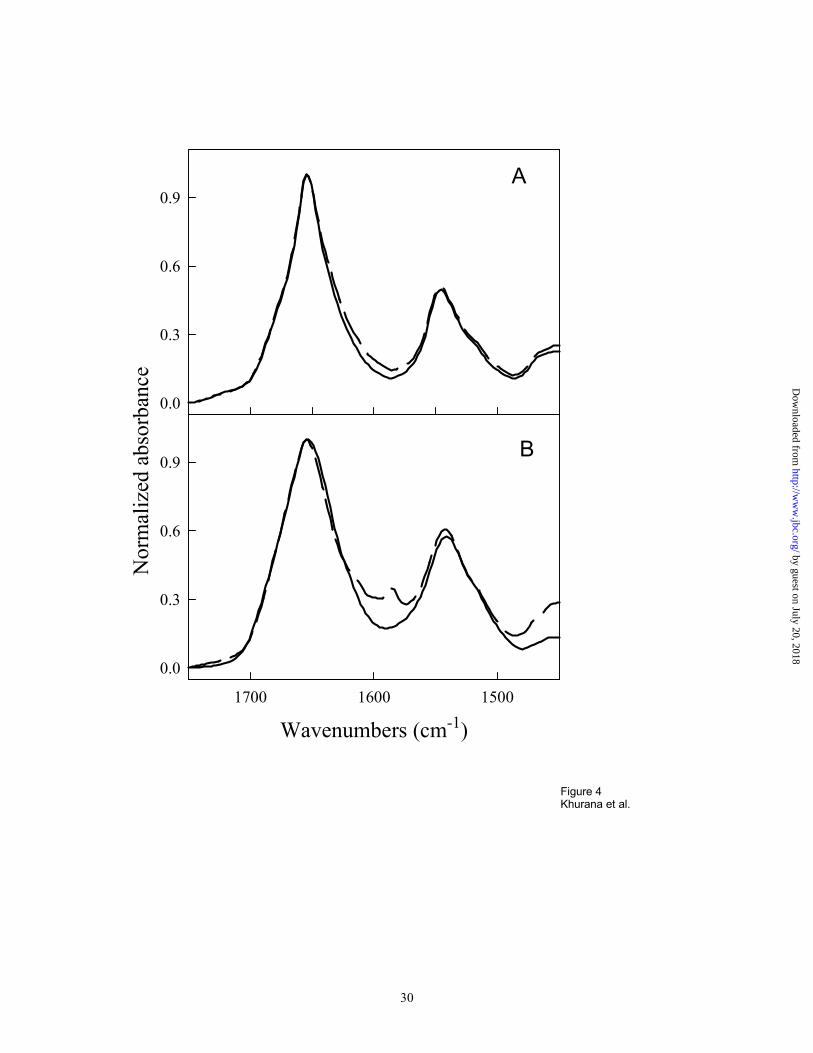
No secondary structure changes observed in proteins upon binding of Congo red
Since it has been suggested that Congo red bound specifically to crossed-β structures present in
amyloid fibrils 31, or to β-sheets in native proteins 32, and our results indicated that all-α proteins
also bind Congo red, we sought to confirm that Congo red binding does not induce changes in
secondary structure, e. g. from α to β. To test this we collected infrared spectra of interleukin-2
(IL-2) (a four-helix bundle protein) in the absence and presence of Congo red (Figure 4A). The
spectrum of Congo red alone was featureless in the amide I and II regions where proteins show
specific conformational-sensitive bands, and no secondary structure changes were observed in
the IL-2 FTIR spectrum upon binding to Congo red (Figure 4A). Lysozyme, an α+β protein,
forms a red precipitate upon binding to Congo red. To test if this precipitate involves formation
of new β-structure with low wavenumber amide I peaks, as observed for many protein
aggregates (Khurana, Oberg, Sheshadri, Li and Fink manuscript submitted), we examined it with
ATR FTIR. The FTIR spectra of soluble free lysozyme and precipitated Congo red-bound
lysozyme are compared in Figure 4B. No significant increase in β-structure was observed in the
precipitated Congo red-bound lysozyme compared to native lysozyme. The minor differences
observed between 1610 and 1580 cm-1 are probably due to interaction of Congo red with specific
side chains, as these bands have significant contributions from side chains and are not indicative
of protein secondary structure changes. Thus it is clear that binding of CR does not result in
induction of β-structure.
by guest on July 20, 2018http://w
ww
.jbc.org/D
ownloaded from
14
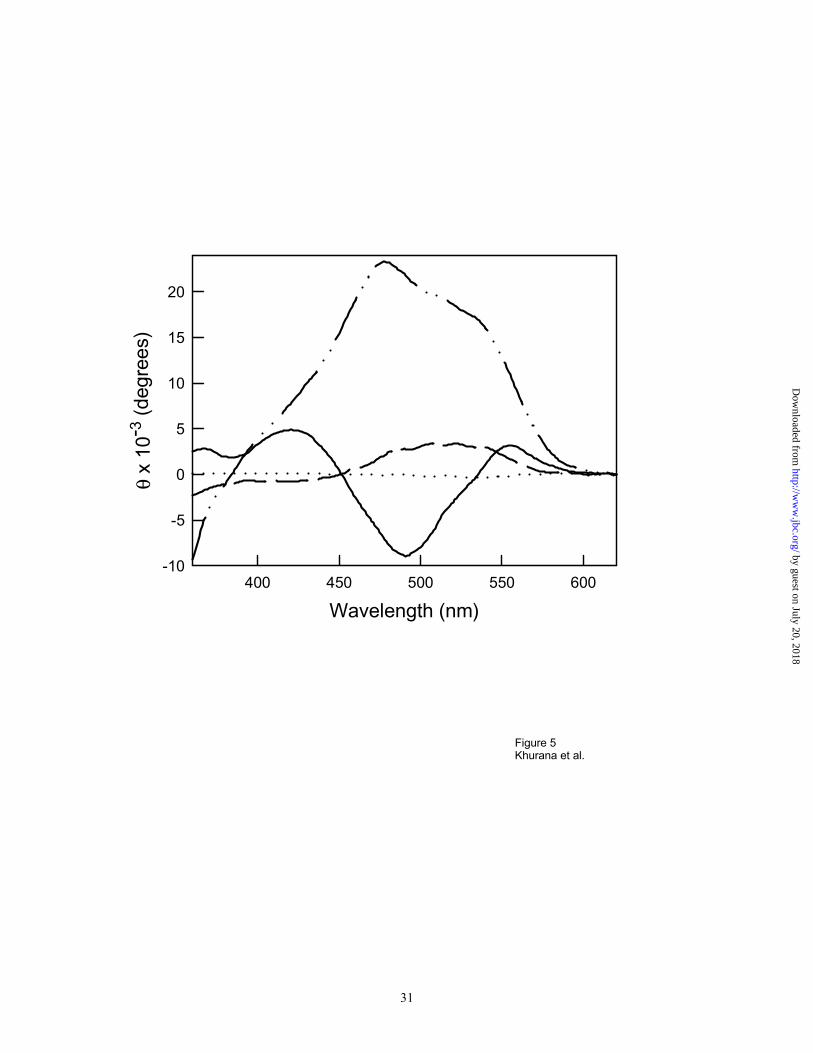
Native and partially folded conformations induce different Congo red CD bands
1, 8, anilino-naphthalene sulfonate (ANS) 33 and its dimer bis-ANS 34 are commonly used as
probes of hydrophobic regions in native and partially folded proteins. Due to the similarity of the
structures of Congo red and bis-ANS we decided to also test differential binding of Congo red to
native and partially folded conformations. Apomyoglobin exists in its native conformation at pH
7, the acid unfolded state at pH 2 in the absence of salts and as a partially folded intermediate at
pH 4 35;36 and at pH 2 in the presence of salt 37. No induced Congo red CD bands were observed
for the acid unfolded form, but the native (pH 7) and partially folded conformations at pH 4 and
pH 2 with 500 mM KCl showed different induced spectra (Figure 5). Binding of the dye to the
native conformation of apomyoglobin is not surprising, since the protein is known to bind a
variety of hydrophobic molecules in the vacant heme-binding site. Increased binding of Congo
red has been observed for the molten globule intermediate compared to the native conformation
for human prostatic phosphatase (7 to 8 molecules of Congo red bind to the intermediate
conformation as opposed to 1.6 dye molecules to the native protein).15 Consequently it appears
that CR binding sites are present in partially-folded intermediates. This is not surprising since
such intermediates are known to have exposed hydrophobic patches and bind hydrophobic
molecules. Thus it is likely that different binding sites for CR may exist in native and partially-
folded intermediate states.
Probing the mechanism of Congo red binding
The number of molecules of Congo red bound per molecule of native β-lactoglobulin was
estimated from an analysis of the data obtained by varying the concentration of protein from 0 to
20 µM while keeping the concentration of Congo red constant at 40 µM (Figure 6A). The
by guest on July 20, 2018http://w
ww
.jbc.org/D
ownloaded from
15
ellipticity at 530 nm and 450 nm were plotted against β-lactoglobulin concentration (Figure 6B)
and the data were fitted to equation 1. The analysis showed that 1.52 ± 0.05 molecules of Congo
red bound per molecule of β-lactoglobulin, similar to the value obtained by Kuciel and
Mazurkiewicz 15 for human prostatic phosphatase. Since we could not measure the concentration
of unbound protein for technical reasons, a more accurate analysis involving Scatchard plots was
not possible. A likely mechanism would involve three protein molecules with two Congo red
molecules intercalated between them. The interaction of Congo red with protein molecules may
involve a complex of multiple protein molecules with intercalated Congo red molecules.
Intercalation as a mechanism of binding of Congo red molecules between peptide chains has also
been suggested by Stopa and coworkers38.
Oligomerization of proteins upon Congo red binding
To test if Congo red binding involved oligomerization of protein molecules we added DTSSP a
cleavable crosslinker to the protein solution in the absence and presence of Congo red. Analysis
by crosslinking and non-reducing SDS-PAGE further confirmed the binding of Congo red to
many proteins (Figure 7A). The control experiment in which the protein was crosslinked in the
absence of Congo red revealed mostly monomeric species. The Congo red-bound protein bands
showed up as red bands in the non-reducing gels until the gel was stained with Coomassie
brilliant blue dye. This was due to the acidic conditions since Congo red is a pH indicator and
turns blue at low pH. Upon drying and removal of acetic acid, the Congo red bands turned red
again. The slower migration of the crosslinked Congo red-bound protein suggests that the
proteins oligomerized during or after binding Congo red. Cleavage of the crosslinker under
reducing conditions revealed only monomeric protein bands and free Congo red (Figure 7B).
Free Congo red runs as a red band approximately the size of a 50 kD protein. Congo red has been
by guest on July 20, 2018http://w
ww
.jbc.org/D
ownloaded from
16
reported to self-associate and form ribbon-like micelles 39;40. It is possible that in the presence of
sodium dodecyl sulfate, Congo red is a self-associated oligomer that runs as a high molecular
weight species.
The results show that CR causes association of a variety of native proteins with different classes
of secondary structure. The most reasonable explanation is that CR bridges two molecules by
intercalating between hydrophobic surface patches with appropriate electrostatic regions for the
sulfonate groups.
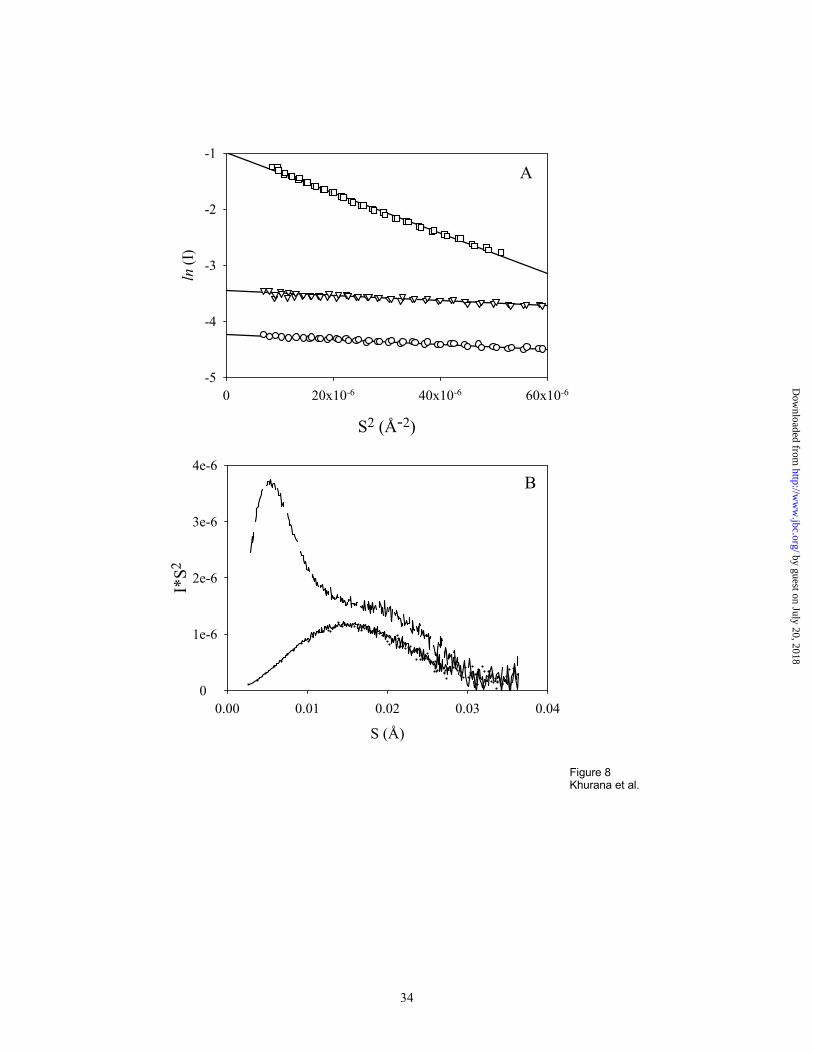
Size and Shape of Congo red bound Oligomers
Small angle scattering of X-rays by protein molecules can provide information about their size,
shape and globularity 41. One of the most commonly used applications of SAXS is measurement
of the size of a scattering molecule using Guinier analysis, which is based on the Gaussian shape
of the scattering curve near zero angles. The Guinier plot for a homogeneous system is generally
linear at small angles, allowing estimation of the radius of gyration of the particle, Rg 41. Figure
8A represents the Guinier plots for bovine β-lactoglobulin (250 µM) measured in the absence
and presence of different Congo red concentrations (50 µM and 1 mM). All plots are linear
functions, reflecting the fact that all three systems are essentially homogeneous, i. e.
monodisperse. Dimensions of the protein are unaffected by the addition of small amounts of
Congo red (Rg=18.7 ± 0.3 and 18.7 ± 0.3 Å in the presence and the absence of 50 µM Congo red,
respectively). However, in the presence of 4-fold excess of the dye over the protein, the Rg value
increases about three-fold (Rg = 56.5 ± 0.9 Å), reflecting the Congo red-induced association of β-
lactoglobulin. Additional information on the degree of protein association could be extracted
from the analysis of the forward-scattered intensity values. The addition of 1 mM Congo red to
by guest on July 20, 2018http://w
ww
.jbc.org/D
ownloaded from

17
250 µM β-lactoglobulin results in a 28-fold increase in the I(0) value, indicating Congo red
bound β-lactoglobulin forms large oligomers (i. e. ∼28mers).
The Kratky plot, I(S)x S2 versus S, is a useful expression to describe the structural characteristics
of a polymer 41. It has been shown that the shape of the Kratky plot is sensitive to protein
conformation 42-45. In particular, for native globular proteins the Kratky plot has a characteristic
position for the maximum that depends on the dimensions of the scattering particle, and shifts to
smaller angles with increase in Rg 41. Figure 8 B represents Kratky plots for β-lactoglobulin in
the absence and presence of two different concentrations of Congo red. Curves for β-
lactoglobulin in the absence or the presence of 50 µM Congo red are superimposable and show
the characteristic symmetric maximum of a native globular protein. However, the scattering
profile for the protein in the presence of 1 mM Congo red (4-fold excess of protein) shows two
very distinct maxima. The position of one of these maxima is comparable to that of the curves in
the absence of Congo red, representing monomers. The very intense second maximum is
observed at smaller angles, representing a specific large oligomer.
The hydrodynamic data allow us to estimate the shape of the β-lactoglobulin oligomer formed in
the presence of 1 mM Congo red. The relationship between RS (Stokes radius) and Rg (radius of
gyration) is quite sensitive to the shape and compactness of a protein (see Materials and
Methods). For an ideal spherical particle RS/Rg=1.29, whereas for globular proteins the average
value of this ratio is about 1.25 25. The Congo red-bound oligomeric form of β-lactoglobulin has
RS/Rg = 1.26, consistent with a spherical shape, rather than a linear polymer.
by guest on July 20, 2018http://w
ww
.jbc.org/D
ownloaded from
18
Birefringence assay in ex-vivo tissue sections
Congo red staining is a standard method used to examine ex-vivo tissue sections for amyloid
fibril deposits. The ex-vivo tissue sections are tested for the presence of amyloid by first
denaturing native proteins in the tissue sections followed by staining the fibrils with Congo red.
These sections are then tested for birefringence under crossed polarization using light
microscopy5. The results described here show that Congo red binds to many native proteins and
lacks secondary structure specificity. This would explain the false positive results obtained in
tissue sections with cytoskeletal proteins that are stable under the conditions used for Congo red
staining in tissue sections. This further confirms that specific crossed-β structure is not a
requirement for Congo red binding, since cytoskeletal proteins have α, β, or coiled-coil
structures. Our data showing Congo red binding to proteins from different secondary structure
classes helps explain the false positive results obtained due to Congo red binding to cytoskeletal
proteins. We suggest that caution is necessary when using Congo red as a method for testing for
fibrils formed in vitro. Other dyes, such as thioflavin T, that are more specific to amyloid fibrils
and do not bind native proteins, are better alternatives 46 to Congo red for in vitro detection of
fibrils 47.
Model of Congo red binding
Although Congo red is well established as an inhibitor of fibril formation for several proteins (e.
g. Aβ7, amylin48, prions49 and insulin), there is considerable uncertainty as to the mechanism in
which CR interacts with fibrils. In several cases evidence in support of an electrostatic
interaction has been reported 50-52, however, in other cases it appears that specific interactions,
and not simple electrostatic interactions are involved 27;53;54. The necessity for planarity has been
by guest on July 20, 2018http://w
ww
.jbc.org/D
ownloaded from
19
shown for the interaction with prion fibrils 53. Since our results show that Congo red binds to
native and partially-folded conformations of proteins, a likely mechanism of inhibition of
amyloid fibril formation is that Congo red preferentially binds to the native or partially-folded
states and stabilizes them (possibly as oligomers), thereby preventing formation of fibrils.
It has been reported that Congo red forms long rod-like “micelles” due to parallel stacking of the
aromatics groups 17, and that these supramolecular forms of the dye specifically interact with β-
sheets, due to the regular spacing of both assemblies. However, our results clearly show that this
cannot be correct, since binding of CR to non-β-sheet proteins occurs, and, in fact, Congo red
binds to native proteins from a wide variety of secondary structure classes. This suggests that
specific secondary structural elements are not a requirement for binding of Congo red to proteins
and amyloid fibrils. We have demonstrated, for the first time, oligomerization of proteins upon
binding to Congo red, indicating that intercalation of dye molecules between multiple protein
molecules leading to large oligomers is a probable mechanism of binding of Congo red to most
native proteins. The shape of these oligomers was determined to be relatively spherical,
indicating that the oligomerization does not lead to linear complexes. It is likely that Congo red,
an elongated sulfonated hydrophobic molecule, binds to an exposed hydrophobic surface of the
native or partially folded conformations, probably with specific complementary electrostatic
interactions between charged side-chains and the sulfonate and amino groups of the dye, and
induces association without concomitant structural changes. The complex of several protein
molecules linked by intercalated Congo red molecules may remain as a soluble oligomer, as for
IL-2 and β-lactoglobulin, or may become so large that it precipitates out of solution, as observed
for lysozyme. It is most likely that both the hydrophobic and the electrostatic components of the
structure of CR are critical for its binding to proteins.
by guest on July 20, 2018http://w
ww
.jbc.org/D
ownloaded from
20
Acknowledgements
We are thankful to Jim Lewis, Keith A. Oberg, and Pierre Souillac for helpful discussions. The
SMA plasmid was a gift from Fred Stevens, and insulin was provided by Novo Nordisk. The β-
helical proteins were generous gifts from Drs. Jonathan King, Fran Jurnak, and Steve Roderick.
We thank Sangita Seshadri for preparing the apomyoglobin.
by guest on July 20, 2018http://w
ww
.jbc.org/D
ownloaded from
21
References
1 Benhold, H. (1922) Muenchen.Med.Wochenschr. 69, 1537
2 Divry P. (1927) J.Neurol.Psychiatr. 27, 643
3 Elghetany, M. T. and Saleem, A. (1988) Stain Technol. 63, 201-212
4 Westermark, G. T., Johnson, K. H., and Westermark, P. (1999) Methods Enzymol. 309, 3-25
5 Puchtler, H., Sweat, F., and Levine, M. (1962) J.Histochem.Cytochem. 10, 355
6 Klunk, W. E., Pettegrew, J. W., and Abraham, D. J. (1989) J.Histochem.Cytochem. 37, 1293-1297
7 Klunk, W. E., Pettegrew, J. W., and Abraham, D. J. (1989) J.Histochem.Cytochem. 37, 1273-1281
8 Benditt, E. P., Eriksen, N., and Berglund, C. (1970) Proc.Natl.Acad.Sci.U.S.A 66, 1044-1051
9 Cotton, A. (1896) Ann.Chim.Phys. 8, 347
10 Edwards, R. A. and Woody, R. W. (1977) Biochem.Biophys.Res.Commun. 79, 470-476
11 Edwards, R. A. and Woody, R. W. (1979) Biochemistry 18, 5197-5204
12 Caughey, B., Brown, K., Raymond, G. J., Katzenstein, G. E., and Thresher, W. (1994) J.Virol. 68, 2135-2141
13 Kagan, H. M., Hewitt, N. A., and Franzblau, C. (1973) Biochim.Biophys.Acta 322, 258-268
14 Woody, A. Y., Reisbig, R. R., and Woody, R. W. (1981) Biochim.Biophys.Acta 655, 82-88
15 Kuciel, R. and Mazurkiewicz, A. (1997) Acta Biochim.Pol. 44, 645-657
16 Attwood, T. K., Lydon, J. E., Hall, C., and Tiddy, G. J. T. Liquid Crystals 7, 657-668. 1990.
17 Skowronek, M., Stopa, B., Koniczny, L., Rybarska, J., Piekarska, B., Szneler, E., Bakaalarski, G., and Roterman, I. Biopolymers 46, 267-281. 1998.
18 Stevens, P. W., Raffen, R., Hanson, D. K., Deng, Y. L., Berrios-Hammond, M., Westholm, F. A., Murphy, C., Eulitz, M., Wetzel, R., and Solomon, A. (1995) Protein Sci. 4, 421-432
19 Khurana, R. and Fink, A. L. (2000) Biophys.J. 78, 994-1000
by guest on July 20, 2018http://w
ww
.jbc.org/D
ownloaded from

22
20 Luzatti, V., Witz, J., and Nikolaieff, A. (1961) J.Mol.Biol. 3, 367-372
21 Kumosinski, T. F. and Pessen, H. (1985) Methods Enzymol. 117, 154-182
22 Shi, L., Kataoka, M., and Fink, A. L. (1996) Biochemistry 35, 3297-3308
23 Uversky, V. N. (1993) Biochemistry 32, 13288-13298
24 Tanford, C. (1968) Adv.Protein Chem. 23, 121-282
25 Gast, K., Damaschun, H., Misselwitz, R., Muller-Frohne, M., Zirwer, D., and Damaschun, G. (1994) Eur.Biophys.J. 23, 297-305
26 Taylor, D. L., Allen, R. D., and Benditt, E. P. (1974) J.Histochem.Cytochem. 22, 1105-1112
27 Turnell, W. G. and Finch, J. T. (1992) J.Mol.Biol. 227, 1205-1223
28 Yoder, M. D., Keen, N. T., and Jurnak, F. (1993) Science 260, 1503-1507
29 Steinbacher, S., Seckler, R., Miller, S., Steipe, B., Huber, R., and Reinemer, P. (1994) Science 265, 383-386
30 Raetz, C. R. and Roderick, S. L. (1995) Science 270, 997-1000
31 Glenner, G. G., Eanes, E. D., and Page, D. L. (1972) J.Histochem.Cytochem. 20, 821-826
32 Roterman, I., Rybarska, J., Koniczny, L., Skowronek, M., Stopa, B., Piekarska, B., and Belarski, G.. Comput.Chem. 22, 61-70. 1998.
33 Stryer, L. (1965) J.Mol.Biol. 13, 482-495
34 Takashi, R., Tonomura, Y., and Morales, M. F. (1977) Proc.Natl.Acad.Sci.U.S.A 74, 2334-2338
35 Barrick, D. and Baldwin, R. L. (1993) Biochemistry 32, 3790-6
36 Griko, Y. V., Privalov, P. L., Venyaminov, S. Y., and Kutyshenko, V. P. (1988) J.Mol.Biol. 202, 127-138
37 Goto, Y. and Fink, A. L. (1990) J.Mol.Biol. 214, 803-805
38 Stopa, B., Gorny, M., Konieczny, L., Piekarska, B., Rybarska, J., Skowronek, M., and Roterman, I. (1998) Biochimie 80, 963-968
39 Stopa, B., Konieczny, L., Piekarska, B., Roterman, I., Rybarska, J., and Skowronek, M. (1997) Biochimie 79, 23-26
by guest on July 20, 2018http://w
ww
.jbc.org/D
ownloaded from
23
40 Piekarska, B., Rybarska, J., Stopa, B., Zemanek, G., Krol, M., Roterman, I., and Konieczny, L. (1999) Acta Biochim.Pol. 46, 841-851
41 Glatter, O. and Kratky, O. (1982) Small angle X-ray scattering, Academic Press, New York,
42 Eliezer, D., Chiba, K., Tsuruta, H., Doniach, S., Hodgson, K. O., and Kihara, H. (1993) Biophys.J. 65, 912-917
43 Kataoka, M., Hagihara, Y., Mihara, K., and Goto, Y. (1993) J.Mol.Biol. 229, 591-596
44 Doniach, S., Bascle, J., Garel, T., and Orland, H. (1995) J.Mol.Biol. 254, 960-967
45 Semisotnov, G. V., Kihara, H., Kotova, N. V., Kimura, K., Amemiya, Y., Wakabayashi, K., Serdyuk, I. N., Timchenko, A. A., Chiba, K., Nikaido, K., Ikura, T., and Kuwajima, K. (1996) J.Mol.Biol. 262, 559-574
46 LeVine, H., III (1993) Protein Sci. 2, 404-410
47 Naiki, H., Higuchi, K., Hosokawa, M., and Takeda, T. (1989) Anal.Biochem. 177, 244-249
48 Lorenzo, A. and Yankner, B. A. (1994) Proc.Natl.Acad.Sci.U.S.A 91, 12243-12247
49 Caughey, B., Ernst, D., and Race, R. E. (1993) J.Virol. 67, 6270-6272
50 Klunk, W. E., Pettegrew, J. W., and Abraham, D. J. (1989) J Histochem Cytochem 37, 1273-81
51 Heegaar, N. H., Sen, J. W., and Nissen, M. H. (2000) J.Chromatogr.A 894, 319-327
52 Inouye, H., Nguyen, J. T., Fraser, P. E., Shinchuk, L. M., Packard, A. B., and Kirschner, D. A. (2000) Amyloid. 7, 179-188
53 Demaimay, R., Harper, J., Gordon, H., Weaver, D., Chesebro, B., and Caughey, B. (1998) J.Neurochem. 71, 2534-2541
54 Ashburn, T. T., Han, H., Mcguinness, B. F., and Lansbury, P. T. (1996) Chemistry & Biology 3, 351-358
by guest on July 20, 2018http://w
ww
.jbc.org/D
ownloaded from
24
Figure Legends
Figure 1. Induced circular dichroism spectra of Congo red on binding to native or fibrillar
proteins. A. Induced CD spectra on binding of 40 µM Congo red to 80 nM insulin fibrils ( _____
) and 400 nM Ig light chain fibrils ( - - - - ), and Congo red alone ( . . . . . ), in a 10 cm pathlength
circular cell. Amyloid fibrils were made in vitro by stirring solutions of insulin and Ig light
chain: the presence of fibrils was confirmed with EM or atomic force microscopy. B Induced CD
spectra of 40 µM Congo red with 10 µM native insulin ( _____ ) or native Ig light chain ( - - - -
). Lower concentrations of fibrils were used to prevent formation of red precipitates.
Figure 2. Induced CD spectra of Congo red (40 µM) with citrate synthase (an all-α protein,
_____ ), lysozyme (an α+β protein, __ ..__ ) and concavalin A (an all-β protein, - - - -) under
native conditions, 2 µM protein, 20 mM phosphate pH 7.5 and 150 mM NaCl, after 30 minutes
incubation. The dotted line represents the spectra of unmixed solutions of 80 µM Congo red and
4 µM protein in a split cuvette.
Figure 3. Induced CD spectra for two right-handed β-helical proteins, pectate lyase ( __ .. __ )
and P22 tailspike protein ( - - - -), and a left handed β-helical protein LpxA ( _____ ).
Aggregated P22 tailspike protein ( . . . . . ) does not bind Congo red, and the resulting spectrum
corresponds to that of Congo-red alone in the absence of protein.
Figure 4. FTIR spectra reveal that Congo red does not induce β-structure on binding to protein.
A. ATR-FTIR spectra of IL-2 (an all-α-protein) showing the amide I and amide II regions with (-
- - -) and without Congo red ( _____ ). B. Lysozyme forms a red precipitate upon incubation
by guest on July 20, 2018http://w
ww
.jbc.org/D
ownloaded from
25
with Congo red (1 mg/ml lysozyme with 0.5 M Congo red), and the ATR-FTIR spectrum for this
precipitate (- - - -) is compared to the spectrum for soluble native lysozyme ( _____ ).
Figure 5. Native Apomyoglobin shows an induced CD band upon binding to Congo red ( _____
). Acidic unfolded apomyoglobin at pH 2 with no salt ( . . . . . ) shows no CD bands. Acidic
partially folded intermediates stabilized at pH 2 in the presence of salt ( ___ . . ___ ) and at pH 4
( - - - - ) show induced CD bands that are different from the ones obtained from native
apomyoglobin.
Figure 6. Titration of Congo red and β-lactoglobulin. A. Induced circular dichroism spectra of
40 µM Congo red increasing concentrations of β-lactoglobulin: 0.5 µM ( ____ ), 2.0 µM ( . . . . .
), 5.0 µM ( - - - - ), 10 µM (___ ___ ___) and 20 µM (___ . ___ . ___). B. The ellipticity at 530
nm ( ) and 450 nm (❍) plotted against β−lactoglobulin concentration and fitted to equation 2),
indicating that 1.52 ± 0.05 molecules of Congo red bound per molecule of β-lactoglobulin.
Figure 7. Congo red induces oligomerization of native proteins. A. 8-25% non-reducing SDS-
PAGE after crosslinking with DTSSP (a cleavable amine-reactive crosslinker), in the absence (-)
and presence (+) of Congo red for pectate lyase, carbonic anhydrase (CA), β-lactoglobulin, IL-2
and lysozyme under non-reducing conditions. B. The same samples but after the crosslinker was
cleaved by reducing the disulphide bond. Free Congo red (red bands) and monomeric protein
bands (stained with Coomassie brilliant blue) appear.
Figure 8. Small-angle X-ray scattering analysis of the size of complexes of Congo red with β-lactoglobulin. A.
Guinier Plots for 250 µM β-lactoglobulin alone (Ο), and in the presence of 50 µM (∇), and 1 mM Congo red ( ).
The increased slope at high CR concentration indicates a significantly larger Rg. B. Kratky plots for β-lactoglobulin
measured in the absence (____) and presence of two different concentrations of Congo red, 50 µM (. . . . .) and 1
by guest on July 20, 2018http://w
ww
.jbc.org/D
ownloaded from

26
mM (__ __ __). Both the plots demonstrate that the presence of Congo red (4 fold higher concentration than the
protein) induces oligomerization of the β-lactoglobulin.
by guest on July 20, 2018http://w
ww
.jbc.org/D
ownloaded from

27
Figure 1Khurana et al.
θ x
10-
3 (d
egr
ees
)
-20
-10
0
10
20
Wavelength (nm)
350 400 450 500 550 600
-20
0
20
40
-2
0
2
4
___
__ θ
x 1
0-3
(de
gre
es)
__ _
_ __
θ x
10-
3 (d
egr
ees
)
A
B
by guest on July 20, 2018http://w
ww
.jbc.org/D
ownloaded from

28
Wavelength (nm)
400 450 500 550 600
θ x
10-3
(deg
rees)
-6
-3
0
3
6
9
Figure 2Khurana et al.
by guest on July 20, 2018http://w
ww
.jbc.org/D
ownloaded from
29
Wavelength (nm)
400 450 500 550
θ x
10-3
(deg
rees)
-2
-1
0
1
2
Figure 3Khurana et al.
by guest on July 20, 2018http://w
ww
.jbc.org/D
ownloaded from
30
Figure 4Khurana et al.
0.0
0.3
0.6
0.9
Wavenumbers (cm-1)
150016001700
Nor
mal
ized
abs
orba
nce
0.0
0.3
0.6
0.9
A
B
by guest on July 20, 2018http://w
ww
.jbc.org/D
ownloaded from
31
Wavelength (nm)
400 450 500 550 600
θ x
10-3
(deg
rees)
-10
-5
0
5
10
15
20
Figure 5Khurana et al.
by guest on July 20, 2018http://w
ww
.jbc.org/D
ownloaded from

32
Figure 6Khurana et al.
Wavelength (nm)
350 400 450 500 550 600
θ x1
0-3
(d
egre
es)
-3
0
3
6
9
12
[β-lactoglobulin] µM0 5 10 15 20
θ 53
0
0
3
6
9
12
θ 45
0
-3
-2
-1
0
A
B
by guest on July 20, 2018http://w
ww
.jbc.org/D
ownloaded from

33
M PelC CarbAnh ββββ -lactogl IL-2 Lysozyme M
- + - + - + - + - +
906640302014
A
PelC CA ββββ -lact M IL-2 Lys
906640302014
B
M PelC CarbAnh ββββ -lactogl IL-2 Lysozyme M
- + - + - + - + - +
906640302014
A
PelC CA ββββ -lact M IL-2 Lys
906640302014
B
PelC CA ββββ -lact M IL-2 Lys
906640302014
B
Figure 7Khurana et al.
by guest on July 20, 2018http://w
ww
.jbc.org/D
ownloaded from
34
Figure 8Khurana et al.
S2 (Å-2)
0 20x10-6 40x10-6 60x10-6
ln (
I)
-5
-4
-3
-2
-1
S (Å)
0.00 0.01 0.02 0.03 0.04
I*S2
0
1e-6
2e-6
3e-6
4e-6
A
B
by guest on July 20, 2018http://w
ww
.jbc.org/D
ownloaded from

Ritu Khurana, Vladimir N. Uversky, Liza Nielsen and Anthony L. FinkIs Congo red an amyloid specific dye
published online February 28, 2001J. Biol. Chem.
10.1074/jbc.M011499200Access the most updated version of this article at doi:
Alerts:
When a correction for this article is posted•
When this article is cited•
to choose from all of JBC's e-mail alertsClick here
by guest on July 20, 2018http://w
ww
.jbc.org/D
ownloaded from
![Optimising The Parameters For The Congo Red Dye …ijiset.com/vol4/v4s1/IJISET_V4_I01_01.pdf · 2017-01-09 · found [14] suitable for the removal of congo red from dye waste water](https://static.fdocuments.net/doc/165x107/5f427cd47965bc770d0f9e86/optimising-the-parameters-for-the-congo-red-dye-2017-01-09-found-14-suitable.jpg)


