IS 465 Decision Support System First Tutorial Data Warehousing Second Semester 1427-1428H.
30
IS 465 Decision Support System First Tutorial Data Warehousing Second Semester 1427-1428H
-
date post
22-Dec-2015 -
Category
Documents
-
view
220 -
download
0
Transcript of IS 465 Decision Support System First Tutorial Data Warehousing Second Semester 1427-1428H.
IS 465Decision Support System
First Tutorial
Data Warehousing
Second Semester 1427-1428H
First Example
Enrollment Data
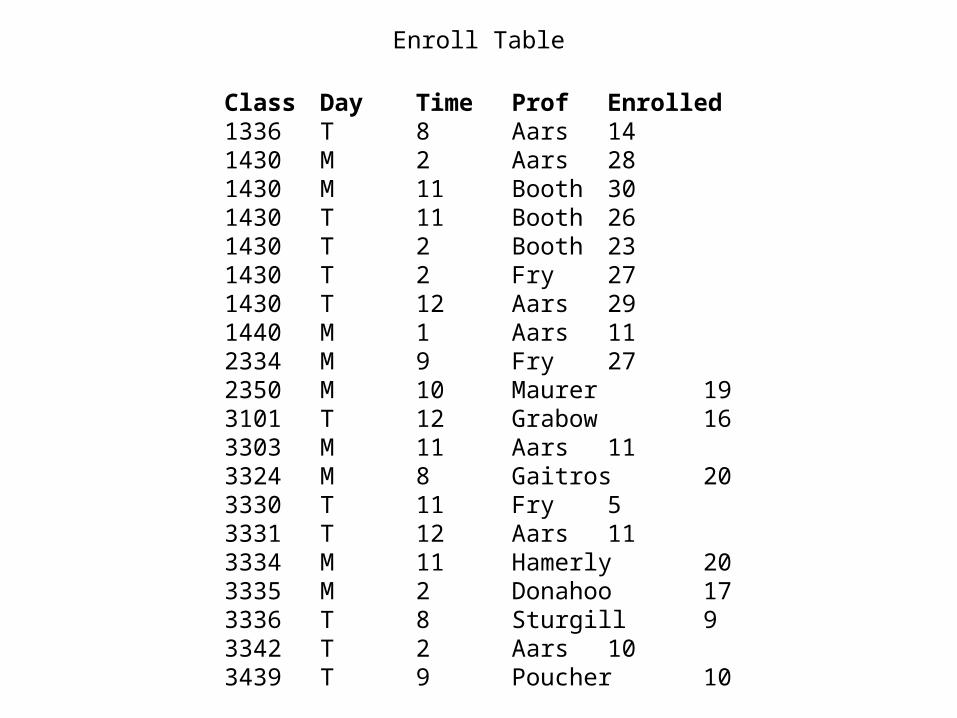
Class Day Time Prof Enrolled 1336 T 8 Aars 14 1430 M 2 Aars 28 1430 M 11 Booth 30 1430 T 11 Booth 26 1430 T 2 Booth 23 1430 T 2 Fry 27 1430 T 12 Aars 29 1440 M 1 Aars 11 2334 M 9 Fry 27 2350 M 10 Maurer 19 3101 T 12 Grabow 16 3303 M 11 Aars 11 3324 M 8 Gaitros 20 3330 T 11 Fry 5 3331 T 12 Aars 11 3334 M 11 Hamerly 20 3335 M 2 Donahoo 17 3336 T 8 Sturgill 9 3342 T 2 Aars 10 3439 T 9 Poucher 10
Enroll Table
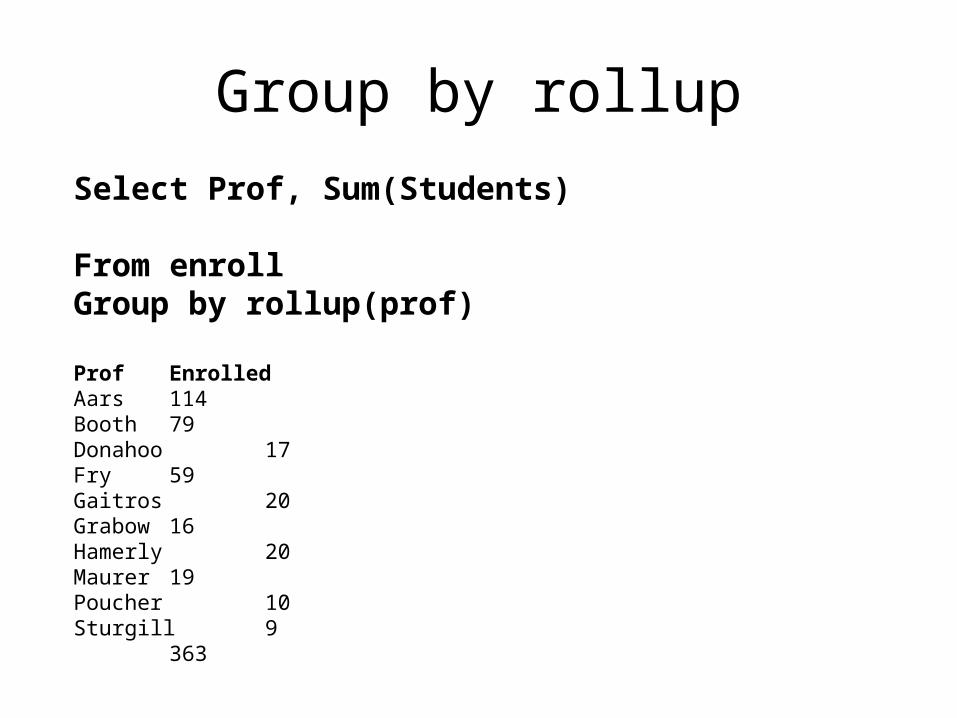
Group by rollup
Select Prof, Sum(Students) From enroll Group by rollup(prof)
Prof Enrolled Aars 114 Booth 79 Donahoo 17 Fry 59 Gaitros 20 Grabow 16 Hamerly 20 Maurer 19 Poucher 10 Sturgill 9
363
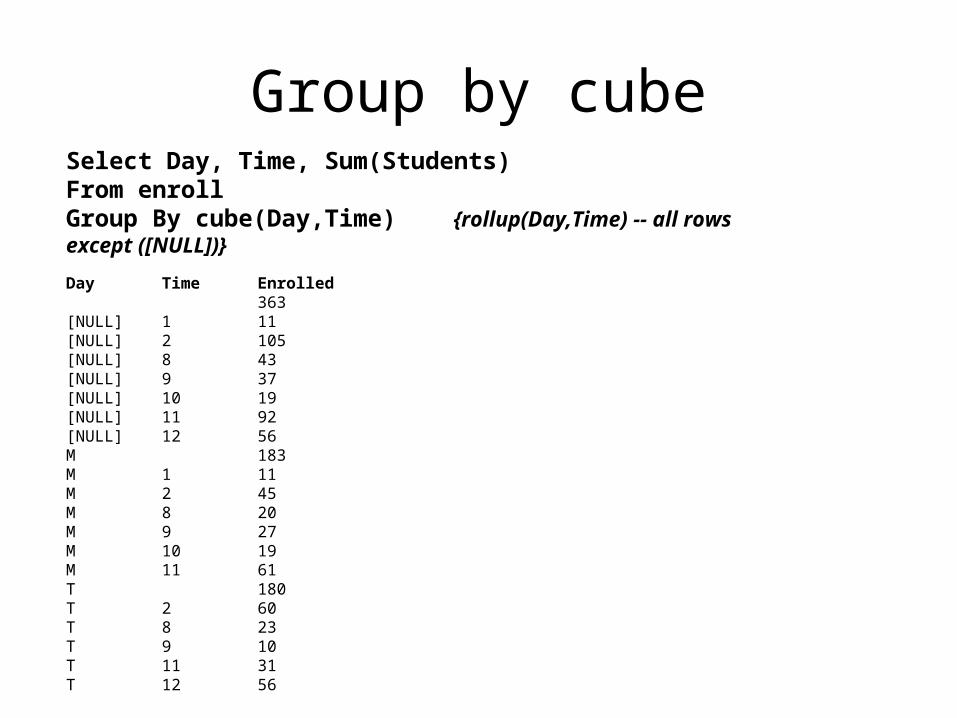
Group by cubeSelect Day, Time, Sum(Students)From enrollGroup By cube(Day,Time) {rollup(Day,Time) -- all rows except ([NULL])}
Day Time Enrolled363
[NULL] 1 11 [NULL] 2 105 [NULL] 8 43 [NULL] 9 37 [NULL] 10 19 [NULL] 11 92 [NULL] 12 56 M 183 M 1 11 M 2 45 M 8 20 M 9 27 M 10 19 M 11 61 T 180 T 2 60 T 8 23 T 9 10 T 11 31 T 12 56
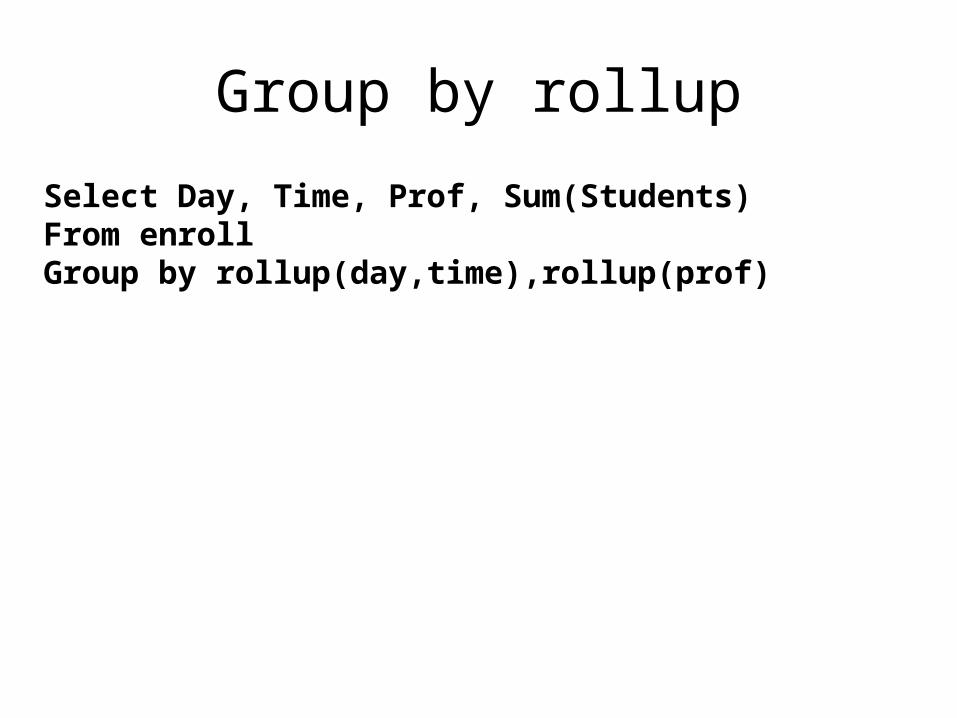
Group by rollup
Select Day, Time, Prof, Sum(Students) From enroll Group by rollup(day,time),rollup(prof)
Second Example
Sales Data
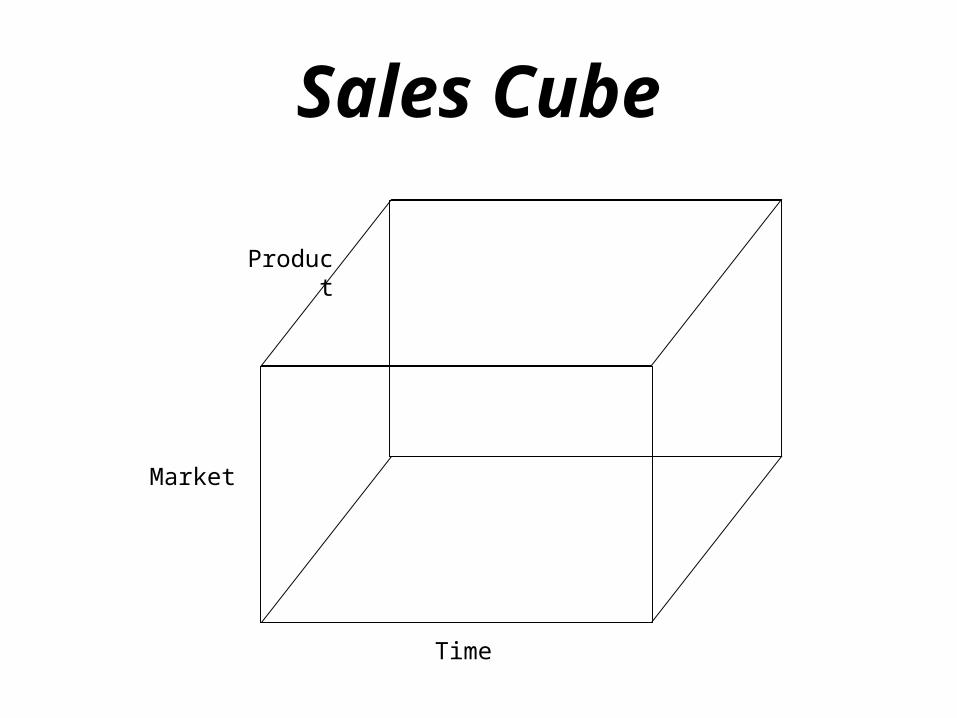
Sales Cube
Market
Time
Product
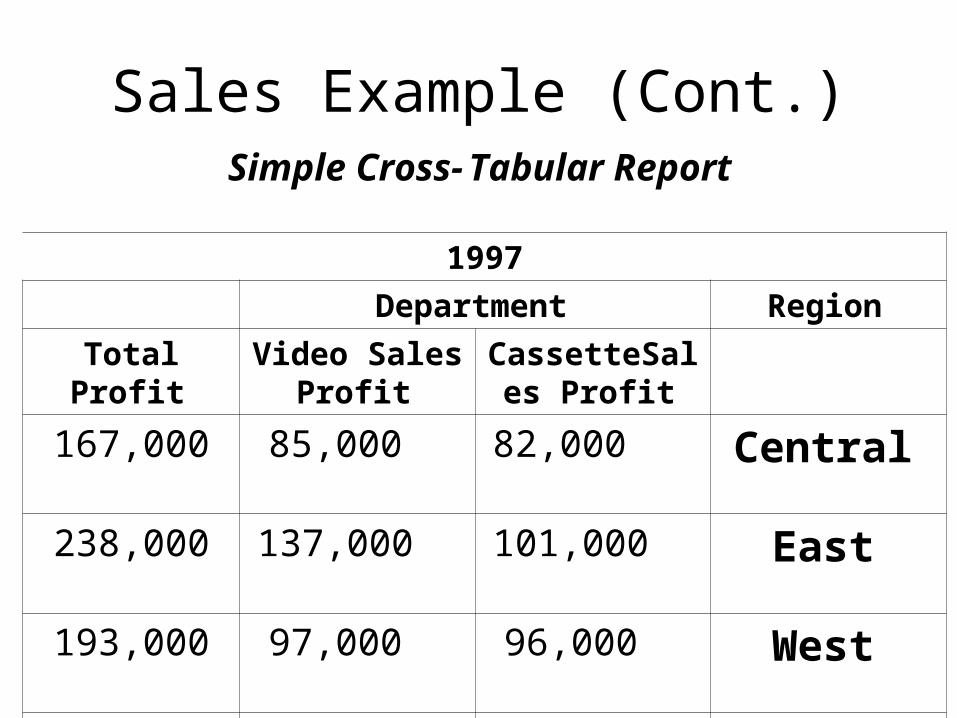
Sales Example (Cont.)Simple Cross-Tabular Report
1997
Region Department
CassetteSales Profit
Video Sales Profit
Total Profit
Central 82,000 85,000 167,000
East 101,000 137,000 238,000
West 96,000 97,000 193,000
Total 279,000 319,000 598,000
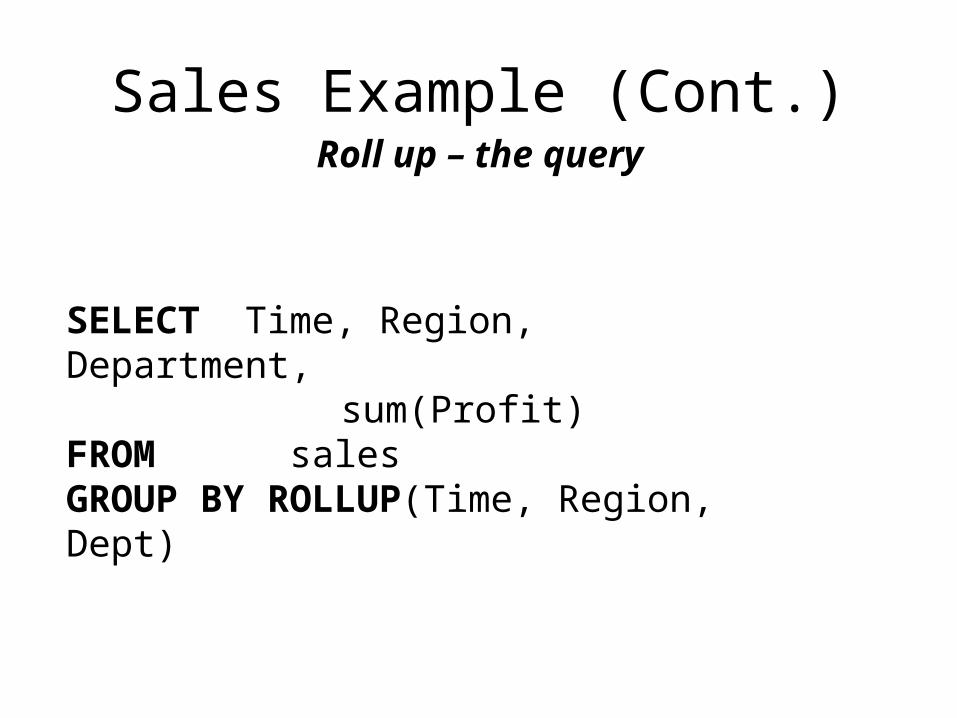
Sales Example (Cont.)Roll up – the query
SELECT Time, Region, Department, sum(Profit)
FROM salesGROUP BY ROLLUP(Time, Region, Dept)
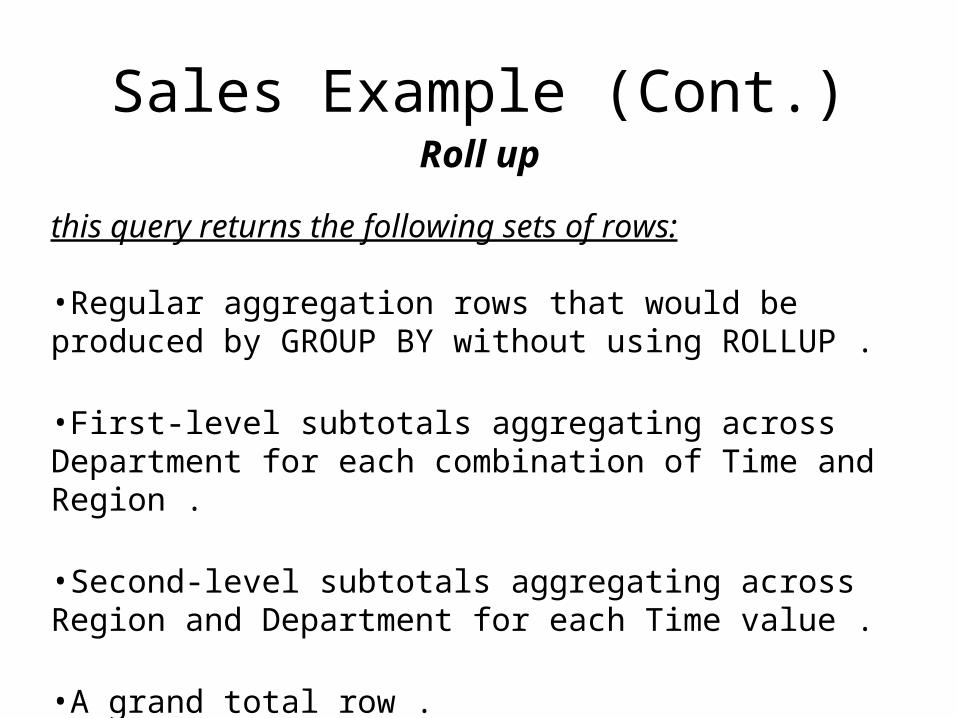
Sales Example (Cont.)Roll up
this query returns the following sets of rows: •Regular aggregation rows that would be produced by GROUP BY without using ROLLUP .
•First-level subtotals aggregating across Department for each combination of Time and Region .
•Second-level subtotals aggregating across Region and Department for each Time value .
•A grand total row .
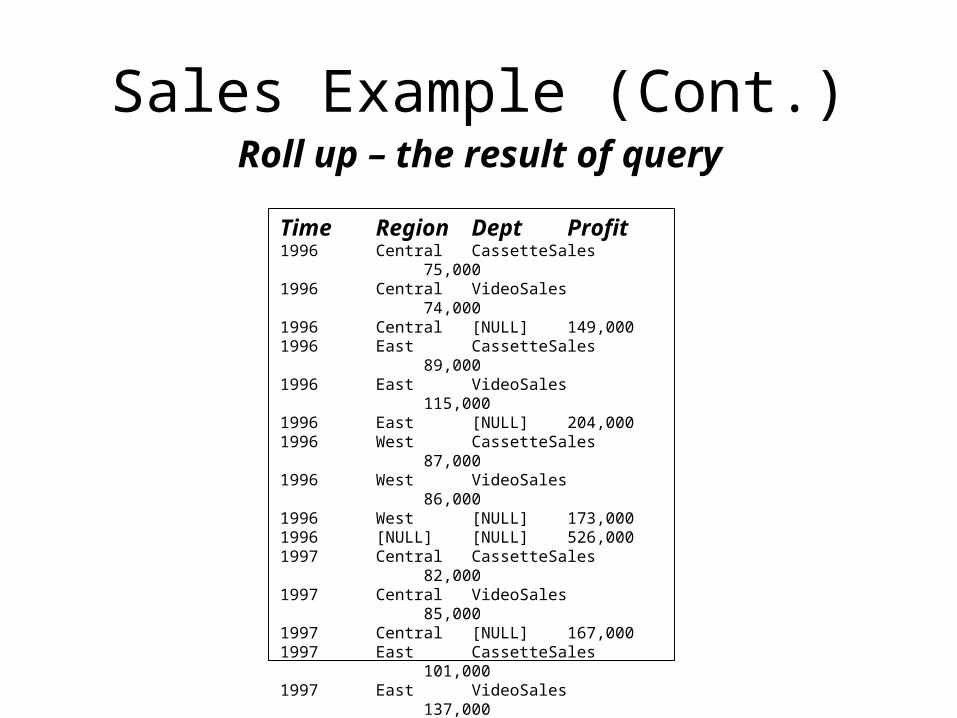
Sales Example (Cont.)Roll up – the result of query
Time Region Dept Profit1996 Central CassetteSales 75,0001996 Central VideoSales 74,0001996 Central [NULL] 149,0001996 East CassetteSales 89,0001996 East VideoSales 115,0001996 East [NULL] 204,0001996 West CassetteSales 87,0001996 West VideoSales 86,0001996 West [NULL] 173,0001996 [NULL] [NULL] 526,0001997 Central CassetteSales 82,0001997 Central VideoSales 85,0001997 Central [NULL] 167,0001997 East CassetteSales 101,0001997 East VideoSales 137,0001997 East [NULL] 238,0001997 West CassetteSales 96,0001997 West VideoSales 97,0001997 West [NULL] 193,0001997 [NULL] [NULL] 598,000[NULL] [NULL] [NULL] 1,124,000
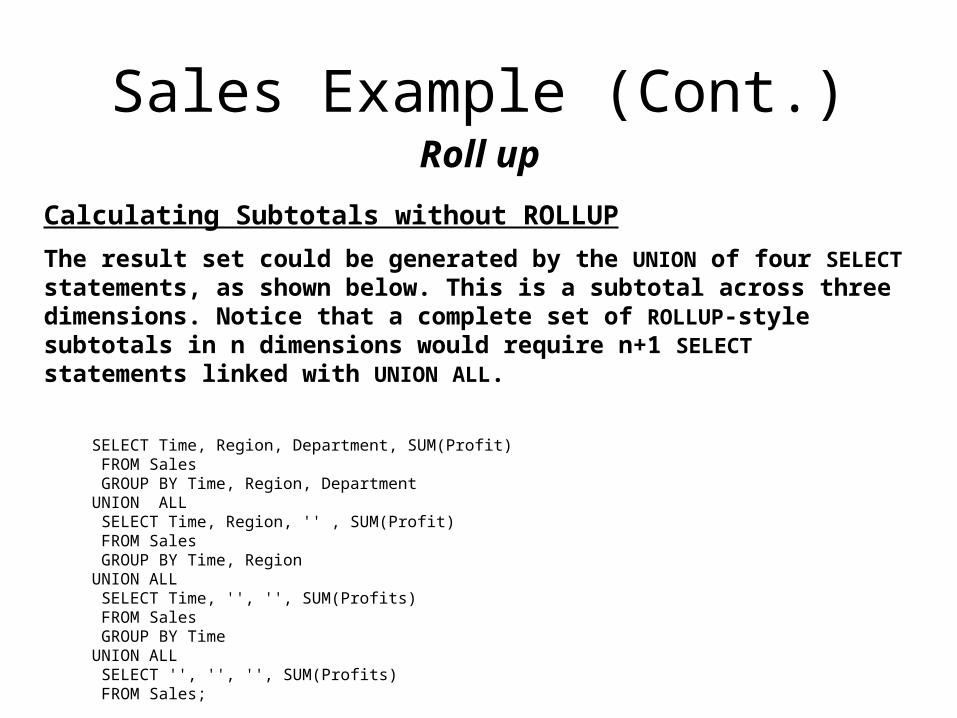
Calculating Subtotals without ROLLUP
The result set could be generated by the UNION of four SELECT statements, as shown below. This is a subtotal across three dimensions. Notice that a complete set of ROLLUP-style subtotals in n dimensions would require n+1 SELECT statements linked with UNION ALL.
SELECT Time, Region, Department, SUM(Profit) FROM Sales GROUP BY Time, Region, DepartmentUNION ALL SELECT Time, Region, '' , SUM(Profit) FROM Sales GROUP BY Time, RegionUNION ALL SELECT Time, '', '', SUM(Profits) FROM Sales GROUP BY TimeUNION ALL SELECT '', '', '', SUM(Profits) FROM Sales;
Sales Example (Cont.)Roll up
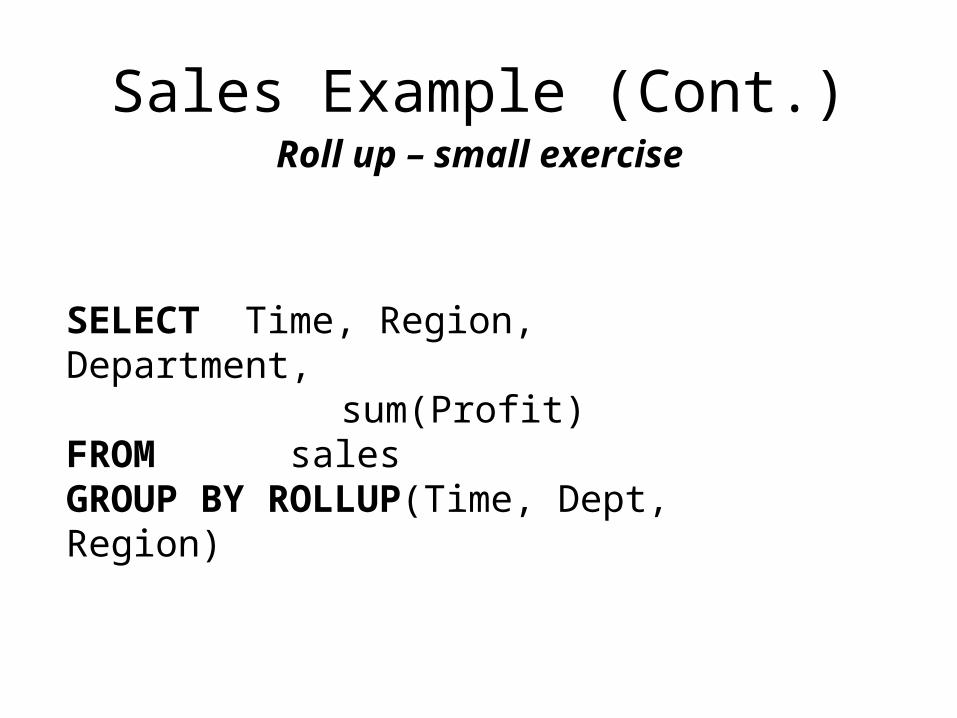
Sales Example (Cont.)Roll up – small exercise
SELECT Time, Region, Department, sum(Profit)
FROM salesGROUP BY ROLLUP(Time, Dept, Region)
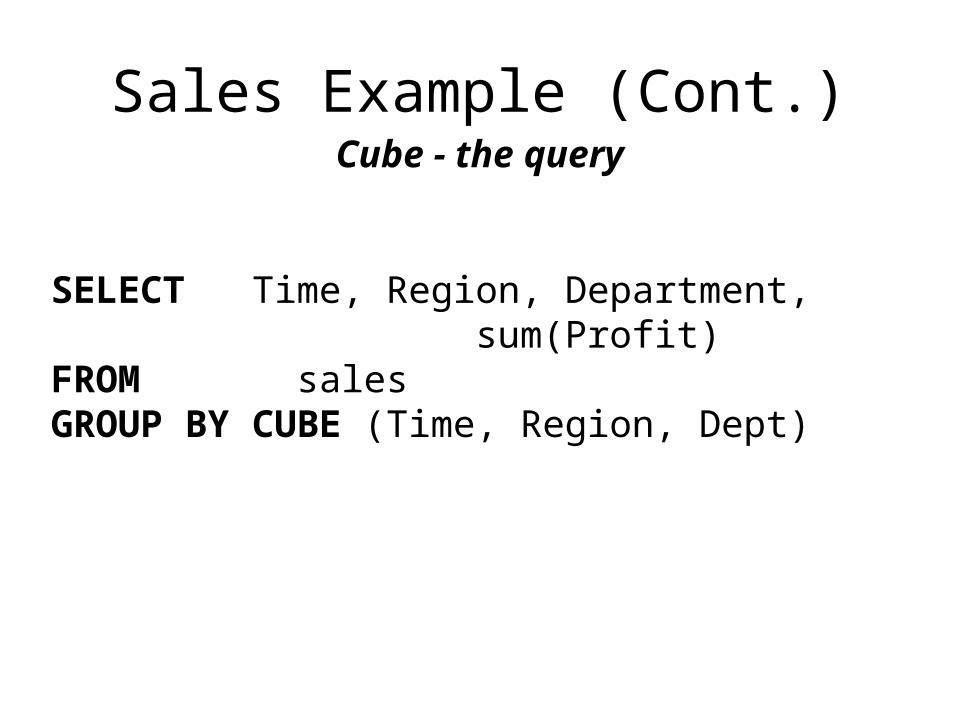
Sales Example (Cont.)Cube - the query
SELECT Time, Region, Department, sum(Profit)FROM salesGROUP BY CUBE (Time, Region, Dept)
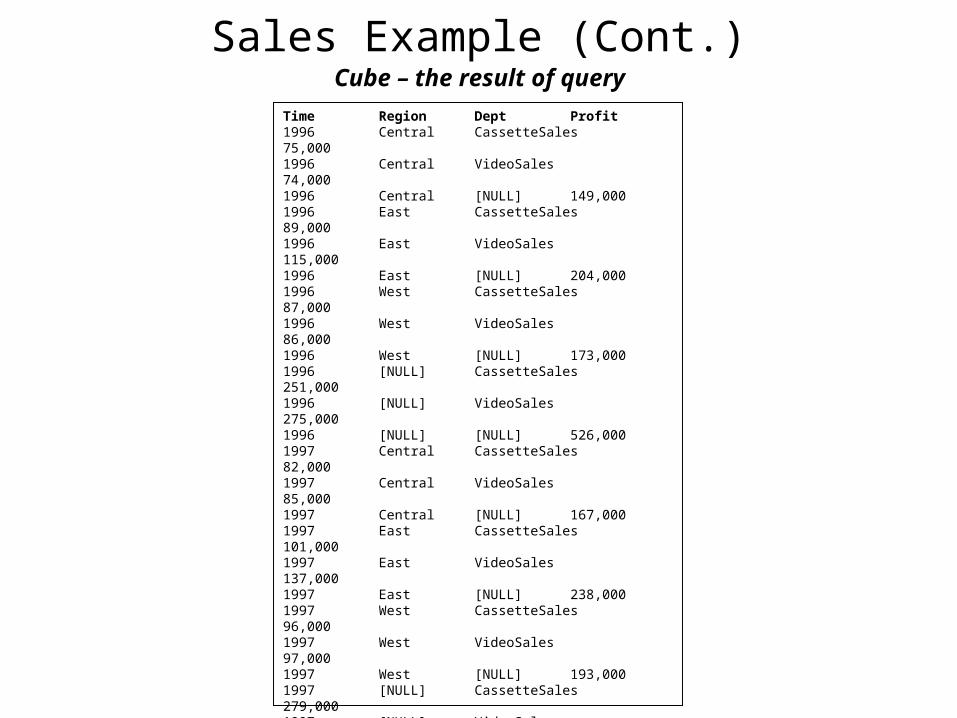
Time Region Dept Profit 1996 Central CassetteSales 75,000 1996 Central VideoSales 74,000 1996 Central [NULL] 149,000 1996 East CassetteSales 89,000 1996 East VideoSales 115,000 1996 East [NULL] 204,000 1996 West CassetteSales 87,000 1996 West VideoSales 86,000 1996 West [NULL] 173,000 1996 [NULL] CassetteSales 251,000 1996 [NULL] VideoSales 275,000 1996 [NULL] [NULL] 526,000 1997 Central CassetteSales 82,000 1997 Central VideoSales 85,000 1997 Central [NULL] 167,000 1997 East CassetteSales 101,000 1997 East VideoSales 137,000 1997 East [NULL] 238,000 1997 West CassetteSales 96,000 1997 West VideoSales 97,000 1997 West [NULL] 193,000 1997 [NULL] CassetteSales 279,000 1997 [NULL] VideoSales 319,000 1997 [NULL] [NULL] 598,000 [NULL] Central CassetteSales 157,000 [NULL] Central VideoSales 159,000 [NULL] Central [NULL] 316,000 [NULL] East CassetteSales 190,000 [NULL] East VideoSales 252,000 [NULL] East [NULL] 442,000 [NULL] West CassetteSales 183,000 [NULL] West VideoSales 183,000 [NULL] West [NULL] 366,000 [NULL] [NULL] CassetteSales 530,000 [NULL] [NULL] VideoSales 594,000 [NULL] [NULL] [NULL] 1,124,000
Sales Example (Cont.)Cube – the result of query
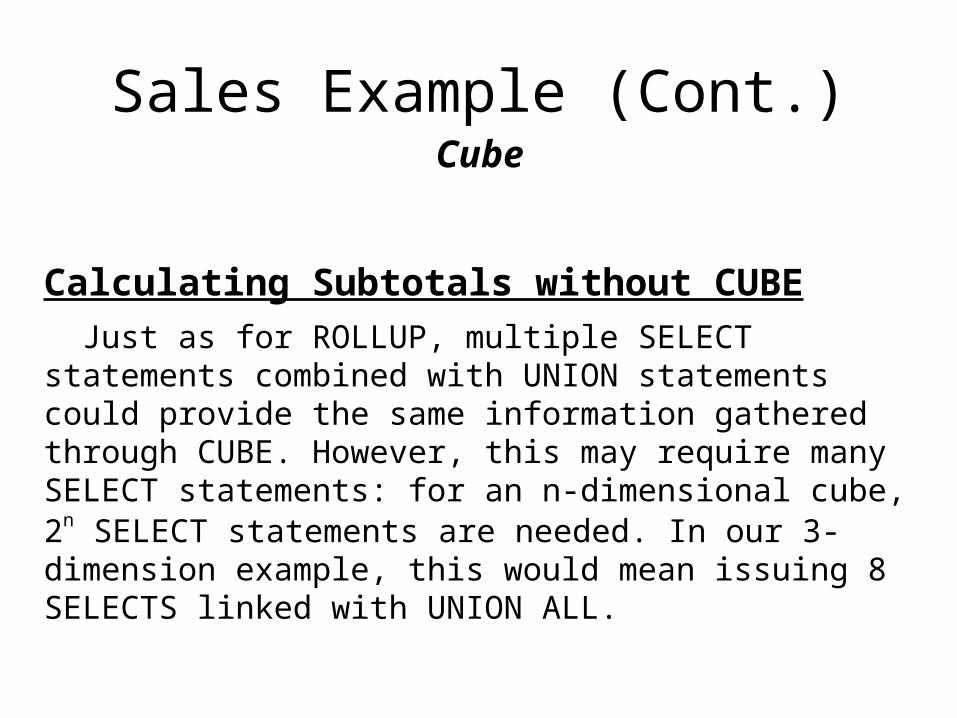
Calculating Subtotals without CUBE
Just as for ROLLUP, multiple SELECT statements combined with UNION statements could provide the same information gathered through CUBE. However, this may require many SELECT statements: for an n-dimensional cube, 2n SELECT statements are needed. In our 3-dimension example, this would mean issuing 8 SELECTS linked with UNION ALL.
Sales Example (Cont.)Cube
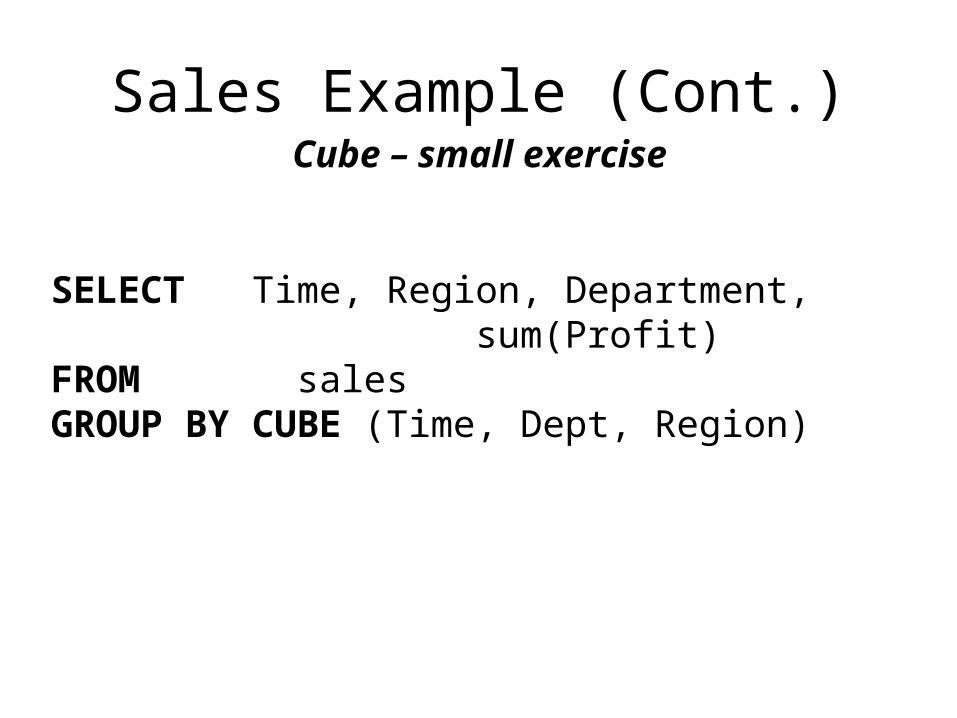
Sales Example (Cont.)Cube – small exercise
SELECT Time, Region, Department, sum(Profit)FROM salesGROUP BY CUBE (Time, Dept, Region)
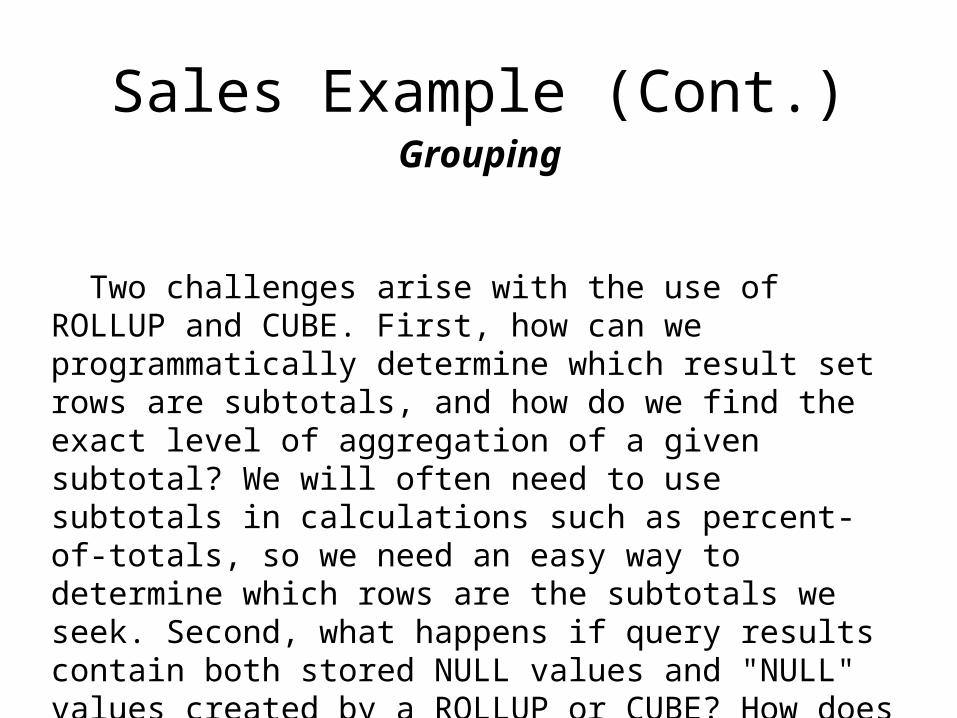
Sales Example (Cont.)Grouping
Two challenges arise with the use of ROLLUP and CUBE. First, how can we programmatically determine which result set rows are subtotals, and how do we find the exact level of aggregation of a given subtotal? We will often need to use subtotals in calculations such as percent-of-totals, so we need an easy way to determine which rows are the subtotals we seek. Second, what happens if query results contain both stored NULL values and "NULL" values created by a ROLLUP or CUBE? How does an application or developer differentiate between the two?
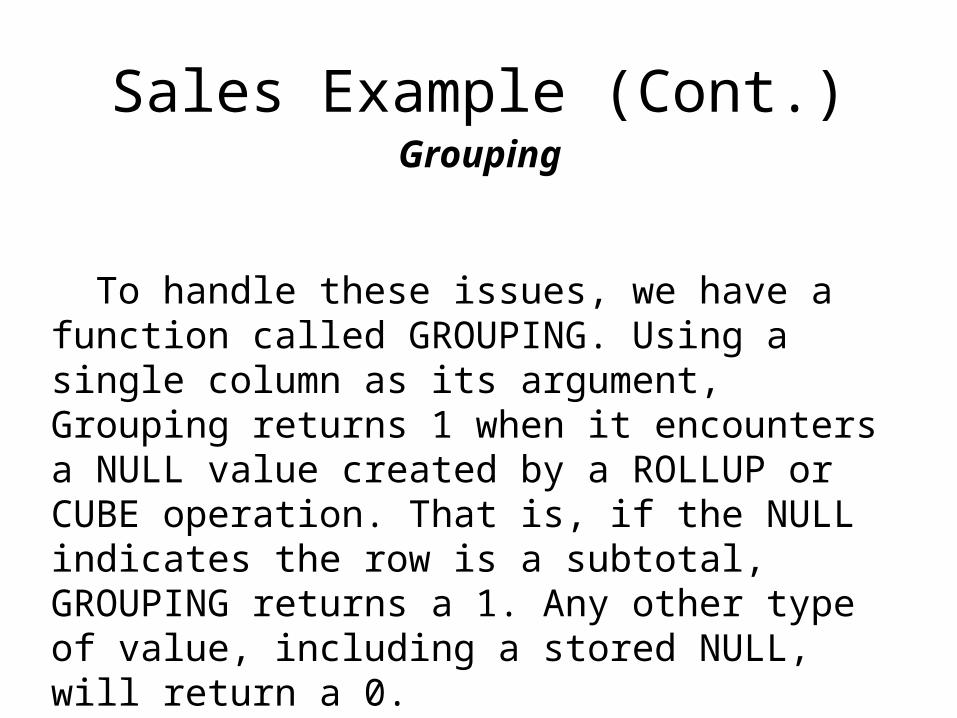
Sales Example (Cont.)Grouping
To handle these issues, we have a function called GROUPING. Using a single column as its argument, Grouping returns 1 when it encounters a NULL value created by a ROLLUP or CUBE operation. That is, if the NULL indicates the row is a subtotal, GROUPING returns a 1. Any other type of value, including a stored NULL, will return a 0.
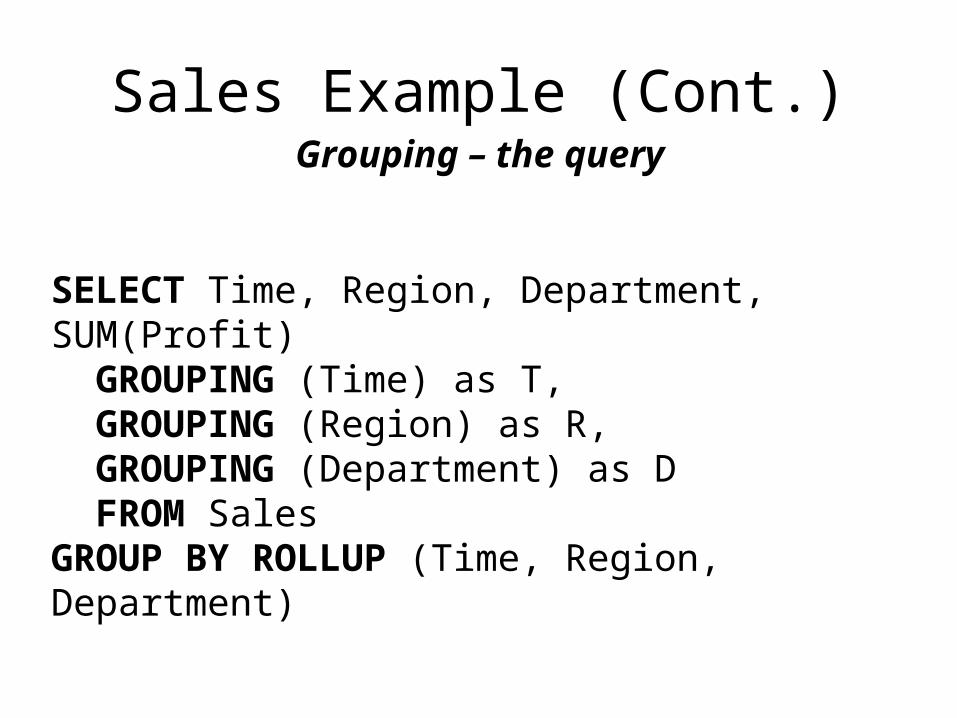
Sales Example (Cont.)Grouping – the query
SELECT Time, Region, Department, SUM(Profit) GROUPING (Time) as T, GROUPING (Region) as R, GROUPING (Department) as D FROM SalesGROUP BY ROLLUP (Time, Region, Department)
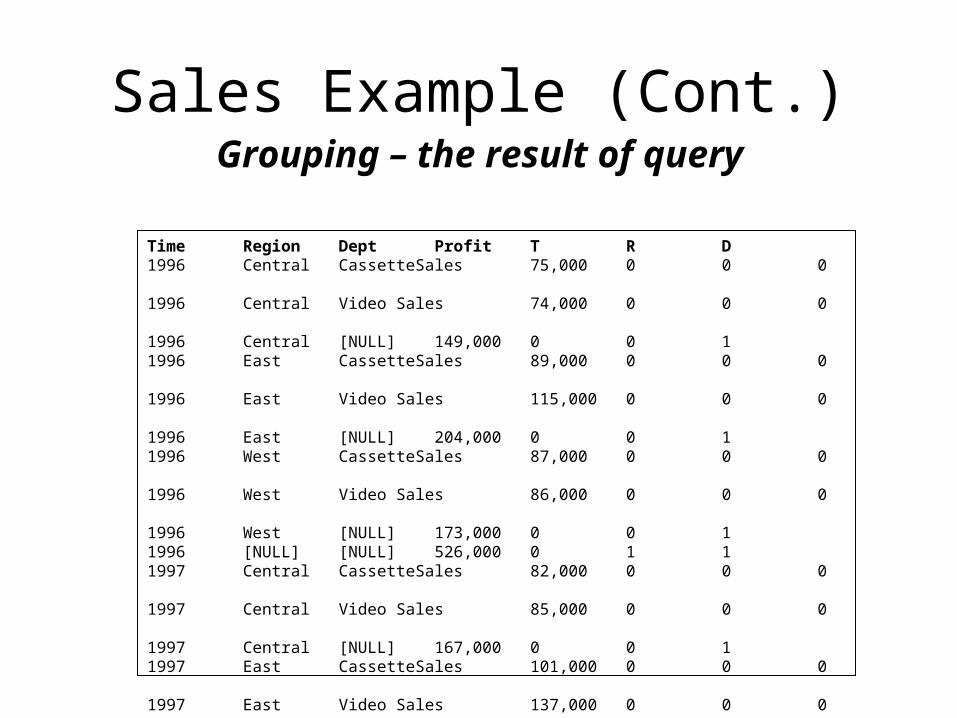
Time Region Dept Profit T R D 1996 Central CassetteSales 75,000 0 0 0 1996 Central Video Sales 74,000 0 0 0 1996 Central [NULL] 149,000 0 0 1 1996 East CassetteSales 89,000 0 0 0 1996 East Video Sales 115,000 0 0 0 1996 East [NULL] 204,000 0 0 1 1996 West CassetteSales 87,000 0 0 0 1996 West Video Sales 86,000 0 0 0 1996 West [NULL] 173,000 0 0 1 1996 [NULL] [NULL] 526,000 0 1 1 1997 Central CassetteSales 82,000 0 0 0 1997 Central Video Sales 85,000 0 0 0 1997 Central [NULL] 167,000 0 0 1 1997 East CassetteSales 101,000 0 0 0 1997 East Video Sales 137,000 0 0 0 1997 East [NULL] 238,000 0 0 1 1997 West VideoRental 96,000 0 0 0 1997 West VideoSales 97,000 0 0 0 1997 West [NULL] 193,000 0 0 1 1997 [NULL] [NULL] 598,000 0 1 1 [NULL] [NULL] [NULL] 1,124,000 1 1 1
Sales Example (Cont.)Grouping – the result of query
Grouping
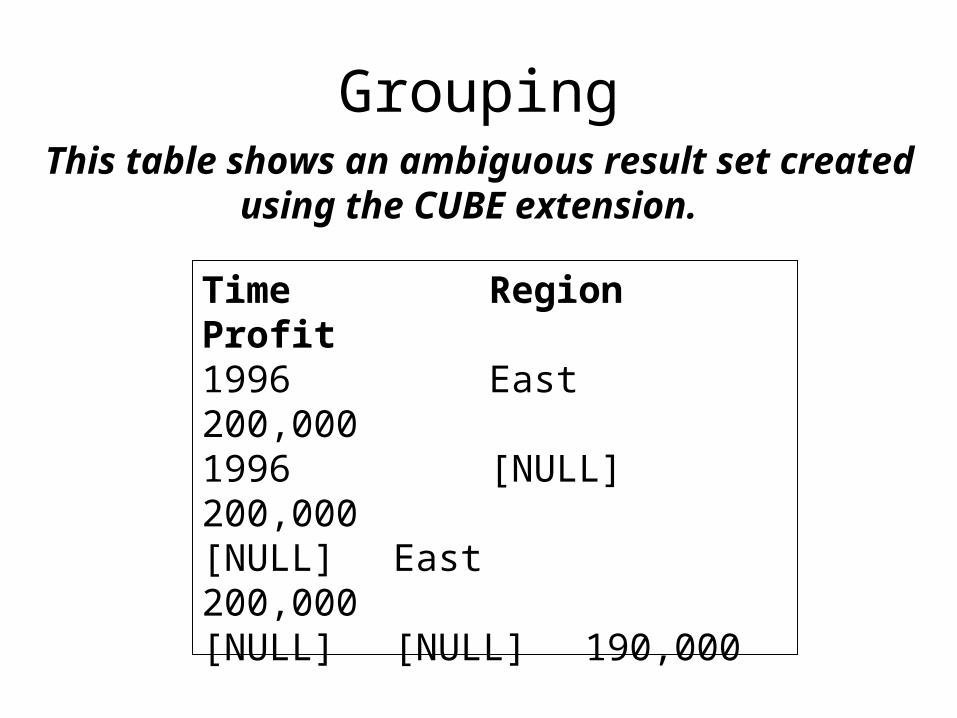
Time Region Profit 1996 East 200,000 1996 [NULL] 200,000 [NULL] East 200,000 [NULL] [NULL] 190,000 [NULL] [NULL] 190,000 [NULL] [NULL] 190,000 [NULL] [NULL] 390,000
This table shows an ambiguous result set created using the CUBE extension.
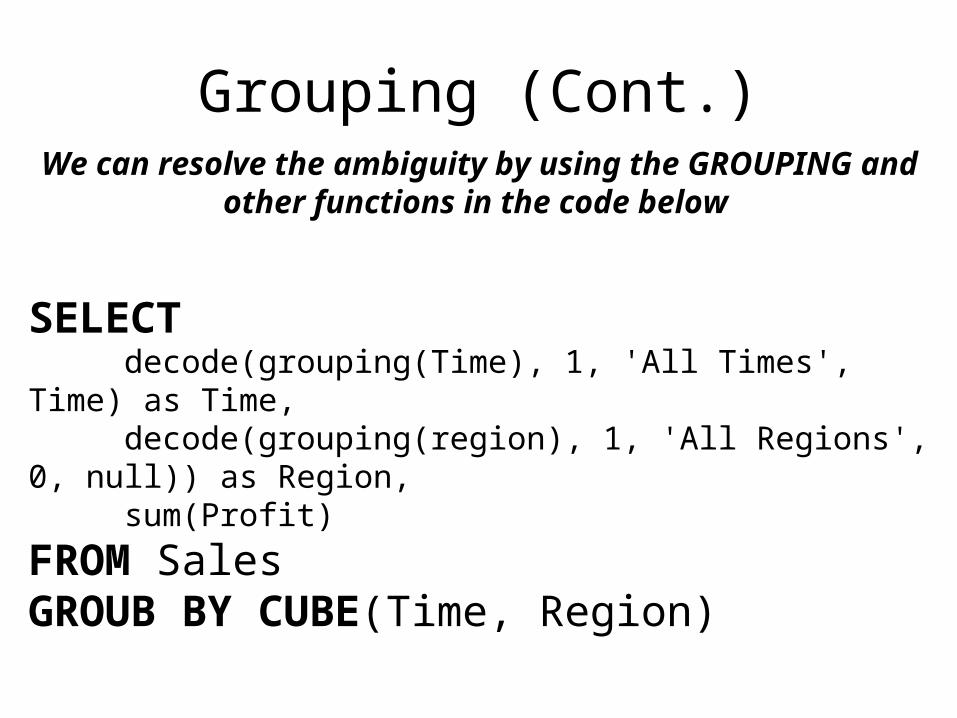
Grouping (Cont.)We can resolve the ambiguity by using the GROUPING and other
functions in the code below
SELECT decode(grouping(Time), 1, 'All Times', Time) as Time, decode(grouping(region), 1, 'All Regions', 0, null)) as Region, sum(Profit)
FROM Sales GROUB BY CUBE(Time, Region)
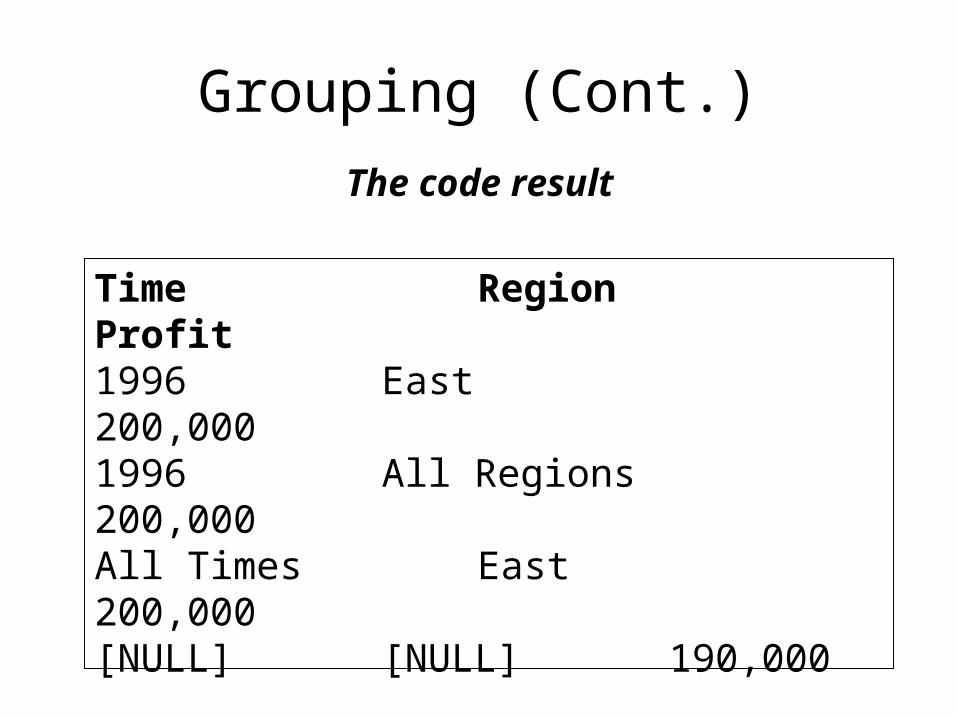
Grouping (Cont.)
The code result
Time Region Profit 1996 East 200,000 1996 All Regions 200,000 All Times East 200,000 [NULL] [NULL] 190,000 [NULL] All Regions 190,000 All Times [NULL] 190,000 All Times All Regions 390,000
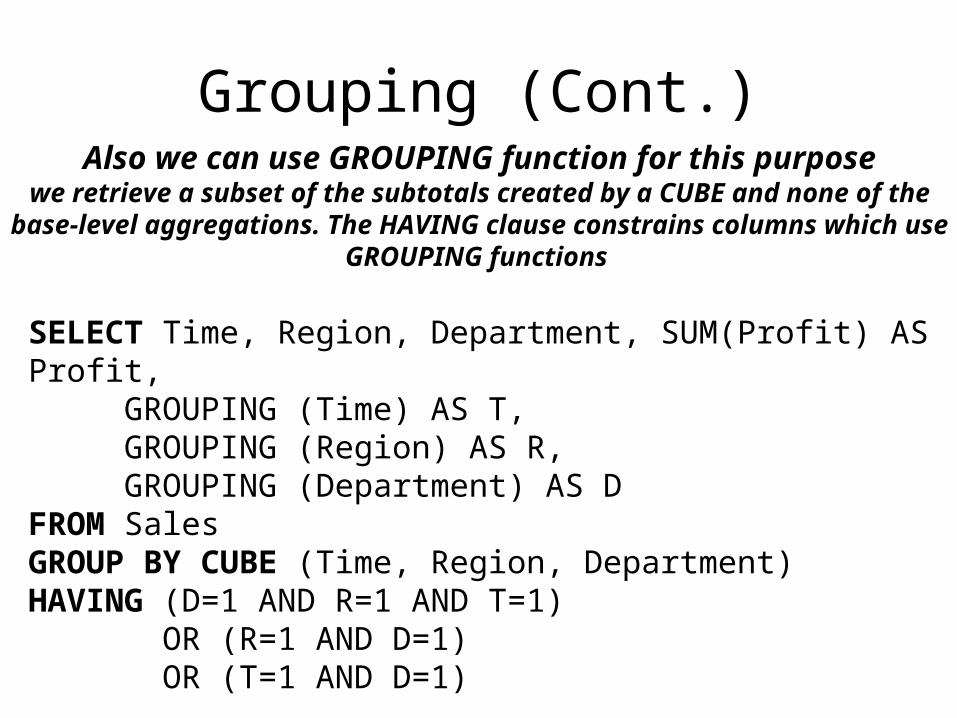
Grouping (Cont.)Also we can use GROUPING function for this purpose
we retrieve a subset of the subtotals created by a CUBE and none of the base-level aggregations. The HAVING clause constrains columns which use GROUPING
functions
SELECT Time, Region, Department, SUM(Profit) AS Profit, GROUPING (Time) AS T, GROUPING (Region) AS R, GROUPING (Department) AS D
FROM Sales GROUP BY CUBE (Time, Region, Department) HAVING (D=1 AND R=1 AND T=1)
OR (R=1 AND D=1) OR (T=1 AND D=1)
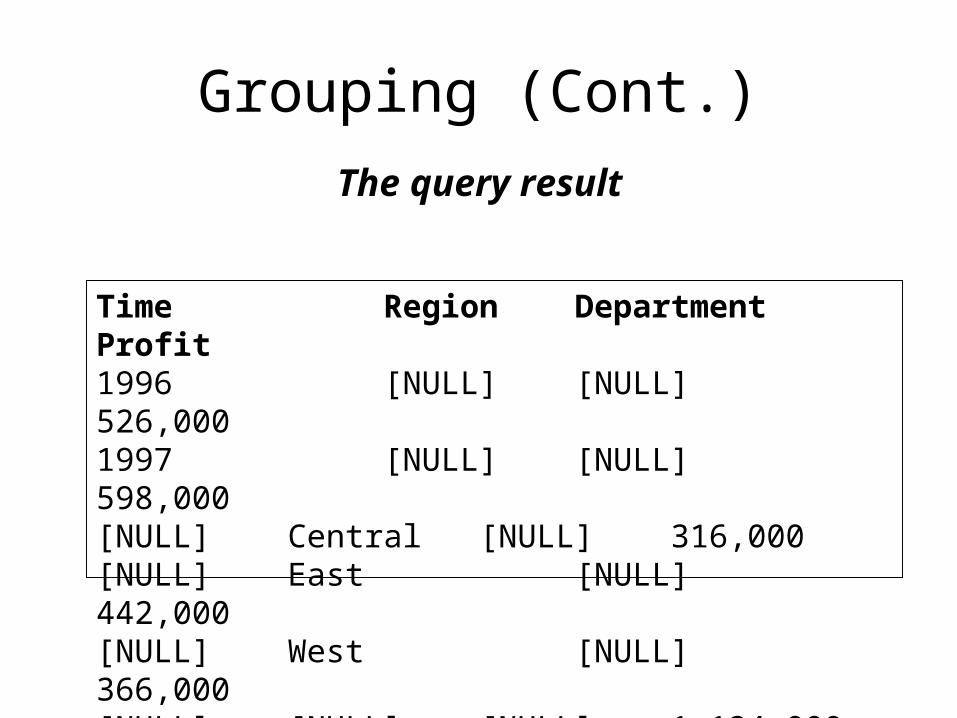
Grouping (Cont.)
The query result
Time Region Department Profit 1996 [NULL] [NULL] 526,000 1997 [NULL] [NULL] 598,000 [NULL] Central [NULL] 316,000 [NULL] East [NULL] 442,000 [NULL] West [NULL] 366,000 [NULL] [NULL] [NULL] 1,124,000
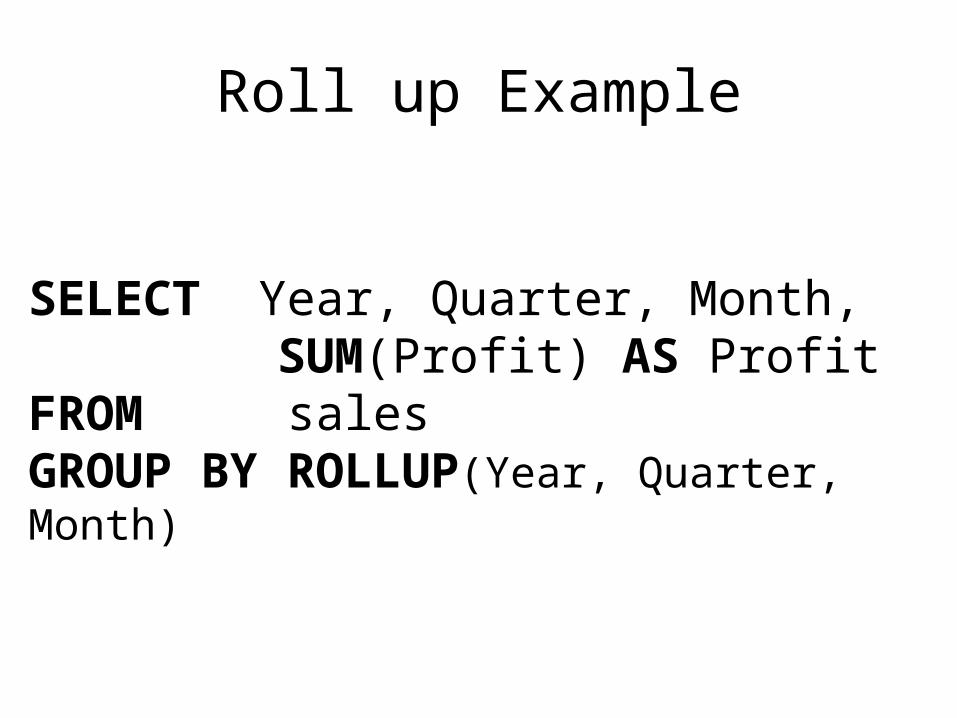
Roll up Example
SELECT Year, Quarter, Month, SUM(Profit) AS Profit
FROM sales GROUP BY ROLLUP(Year, Quarter, Month)
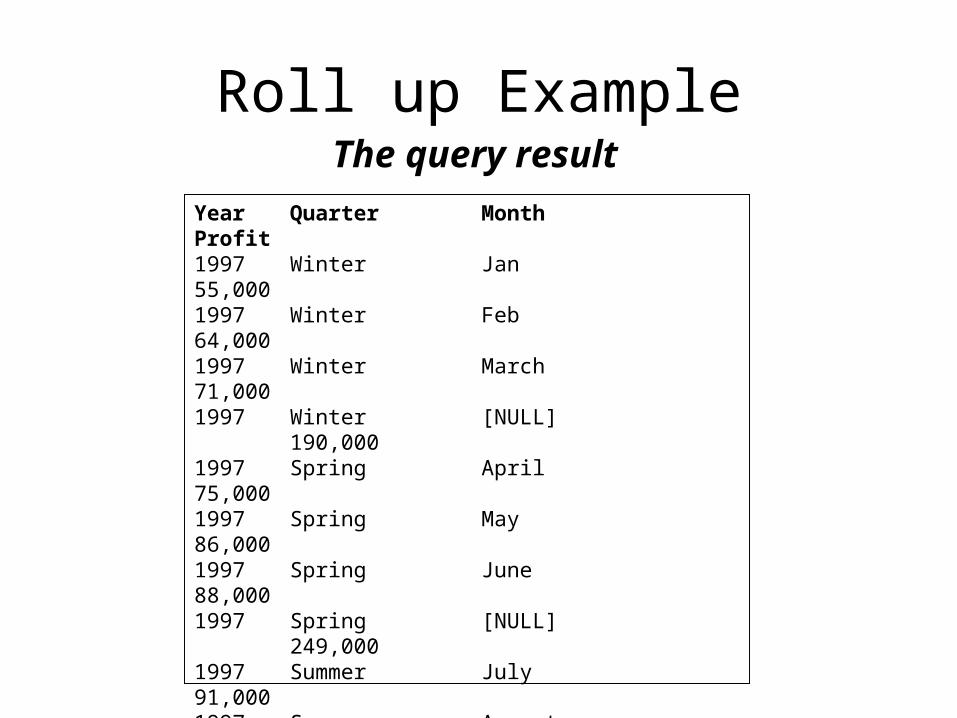
Year Quarter Month Profit 1997 Winter Jan 55,000 1997 Winter Feb 64,000 1997 Winter March 71,000 1997 Winter [NULL] 190,000 1997 Spring April 75,000 1997 Spring May 86,000 1997 Spring June 88,000 1997 Spring [NULL] 249,000 1997 Summer July 91,000 1997 Summer August 87,000 1997 Summer September 101,000 1997 Summer [NULL] 279,000 1997 Fall October 109,000 1997 Fall November 114,000 1997 Fall December 133,000 1997 Fall [NULL] 356,000 1997 [NULL] [NULL] 1,074,000
The query result
Roll up Example

اللهم سبحانكوبحمدك
أنت إال إله أال أشهد
وأتوب أستغفركإليك،،