
Irvin M. Modlin*, Ignat Drozdov and Mark Kidd Gut ...
11
DOI 10.1515/cclm-2013-0496 Clin Chem Lab Med 2013; x(x): xxx–xxx Irvin M. Modlin*, Ignat Drozdov and Mark Kidd Gut neuroendocrine tumor blood qPCR fingerprint assay: characteristics and reproducibility Abstract Background: We have developed a PCR-based tool that measures a 51-gene panel for identification of gastro- enteropancreatic (GEP) neuroendocrine neoplasms (NENs) in peripheral blood. This manuscript assesses the robustness (performance metrics) of this tool with a specific focus on the effects of individual parameters including collection, storage, acid suppressive medica- tion [proton pump inhibitor (PPI)], age, sex, race and food on accuracy. Methods: Performance metrics were evaluated using a gold standard (mRNA derived from three individual human neuroendocrine tumor cell lines) and clinical samples using qPCR. Results: One hundred percent of the 51 transcripts were amplified in the gold standard (NEN cell line-derived mRNA) (C Q < 35, average efficiency 1.94). The inter- and intra-assay variations were 1%–2%. In clinical samples, 50 of 51 targets (98%) were amplified. The inter- and intra- assay reproducibility ranged between 0.4% and 1.2%. The coefficient of variation (CV) was 5.3%. Expression of the reference gene, ALG9, was robust (low variation, low M-value, PCR efficiency) and unaffected by sample pro- cessing. Test meals, long-term PPI use ( > 1 year), age, sex and ethnicity had no effect on the signature. Expression of two genes, ALP2 and CD59 correlated strongly with RNA integrity (R= 0.72, p< 0.001) and could be used to assess storage and processing. Conclusions: The 51 marker gene signature was robust and reproducible, exhibiting acceptable inter- and intra- assay metrics ( < 5%). Feeding, PPI intake, age, sex and ethnicity do not affect the signature. Expression levels of APLP2 and CD59 are effective surrogate markers of proper sample collection and processing. Keywords: blood; gene marker; MIQE; neuroendocrine tumor; qPCR; reproducibility; score; variability. *Corresponding author: Irvin M. Modlin, Department of Surgery, Yale University School of Medicine, New Haven, CT 06510, USA, E-mail: [email protected] Ignat Drozdov and Mark Kidd: Department of Surgery, Yale University School of Medicine, New Haven, CT, USA Gene names ALG9 – ALG9, α-1,2-mannosyltransferase; APLP2 – amyloid β (A4) precursor-like protein 2; CD59 – CD59 molecule, complement regulatory protein; HSF2 – heat shock transcription factor 2; MAP3K7CL – (C21ORF7) MAP3K7 C-terminal like; NOL3 – nucleolar protein 3 (apo- ptosis repressor with CARD domain); NUDT3 – nudix (nucleoside diphosphate-linked moiety X)-type motif 3; PKD1 – polycystic kidney disease 1 (autosomal domi- nant); SSTR1 – somatostatin receptor 1; SSTR5 – somato- statin receptor 5; TRMT112 – tRNA methyltransferase 11-2 homolog (S. cerevisiae). Introduction Real time PCR (qPCR) is the gold standard for nucleic acid quantification. Its strengths embrace a number of parame- ters including: dynamic quantitative range (5–8 log orders of magnitude); increased sensitivity (e.g., ≥ 1000× more sensitive than dot blots); and ability to detect single tran- script copies and reliably differentiate small differences in gene expression (approx. 25% changes). Quantitative PCR has become standard for the detection of BCL-ABL altera- tions in leukemia [1], determining prognosis of breast cancer [2–4] and identification of metastasis, recurrence, and prediction of responses to radio- and chemotherapy in colon cancer [5, 6]. Despite the clinical significance, translation has proven challenging, e.g., peripheral blood screens for colorectal cancer [7], because of a number of variables including expense, low availability and the high sensitivity of the technique (erroneous amplification). The exponential nature of the amplification proto- col combined with small quantities of target may result in substantial differences in final yield if there are minor variations in reaction components and thermal cycling conditions and/or mispriming events [8–12]. These consid- erations have led to rigorous assessments of assay utility [13], particularly in the routine setting [14, 15]. Stringent quality control, standardization of sample acquisition and processing are therefore a prerequisite in the development and application of molecular tools [16].
Transcript of Irvin M. Modlin*, Ignat Drozdov and Mark Kidd Gut ...

DOI 10.1515/cclm-2013-0496 Clin Chem Lab Med 2013; x(x): xxx–xxx
Irvin M. Modlin*, Ignat Drozdov and Mark Kidd
Gut neuroendocrine tumor blood qPCR fingerprint assay: characteristics and reproducibility
Abstract
Background: We have developed a PCR-based tool that measures a 51-gene panel for identification of gastro-enteropancreatic (GEP) neuroendocrine neoplasms (NENs) in peripheral blood. This manuscript assesses the robustness (performance metrics) of this tool with a specific focus on the effects of individual parameters including collection, storage, acid suppressive medica-tion [proton pump inhibitor (PPI)], age, sex, race and food on accuracy.Methods: Performance metrics were evaluated using a gold standard (mRNA derived from three individual human neuroendocrine tumor cell lines) and clinical samples using qPCR.Results: One hundred percent of the 51 transcripts were amplified in the gold standard (NEN cell line-derived mRNA) (CQ < 35, average efficiency 1.94). The inter- and intra-assay variations were 1%–2%. In clinical samples, 50 of 51 targets (98%) were amplified. The inter- and intra-assay reproducibility ranged between 0.4% and 1.2%. The coefficient of variation (CV) was 5.3%. Expression of the reference gene, ALG9, was robust (low variation, low M-value, PCR efficiency) and unaffected by sample pro-cessing. Test meals, long-term PPI use ( > 1 year), age, sex and ethnicity had no effect on the signature. Expression of two genes, ALP2 and CD59 correlated strongly with RNA integrity (R = 0.72, p < 0.001) and could be used to assess storage and processing.Conclusions: The 51 marker gene signature was robust and reproducible, exhibiting acceptable inter- and intra-assay metrics ( < 5%). Feeding, PPI intake, age, sex and ethnicity do not affect the signature. Expression levels of APLP2 and CD59 are effective surrogate markers of proper sample collection and processing.
Keywords: blood; gene marker; MIQE; neuroendocrine tumor; qPCR; reproducibility; score; variability.
*Corresponding author: Irvin M. Modlin, Department of Surgery, Yale University School of Medicine, New Haven, CT 06510, USA, E-mail: [email protected] Drozdov and Mark Kidd: Department of Surgery, Yale University School of Medicine, New Haven, CT, USA
Gene names
ALG9 – ALG9, α-1,2-mannosyltransferase; APLP2 – amyloid β (A4) precursor-like protein 2; CD59 – CD59 mole cule, complement regulatory protein; HSF2 – heat shock transcription factor 2; MAP3K7CL – (C21ORF7) MAP3K7 C-terminal like; NOL3 – nucleolar protein 3 (apo-ptosis repressor with CARD domain); NUDT3 – nudix (nucleoside diphosphate-linked moiety X)-type motif 3; PKD1 – polycystic kidney disease 1 (autosomal domi-nant); SSTR1 – somatostatin receptor 1; SSTR5 – somato-statin receptor 5; TRMT112 – tRNA methyltransferase 11-2 homolog (S. cerevisiae).
IntroductionReal time PCR (qPCR) is the gold standard for nucleic acid quantification. Its strengths embrace a number of parame-ters including: dynamic quantitative range (5–8 log orders of magnitude); increased sensitivity (e.g., ≥ 1000 × more sensitive than dot blots); and ability to detect single tran-script copies and reliably differentiate small differences in gene expression (approx. 25% changes). Quantitative PCR has become standard for the detection of BCL-ABL altera-tions in leukemia [1], determining prognosis of breast cancer [2–4] and identification of metastasis, recurrence, and prediction of responses to radio- and chemotherapy in colon cancer [5, 6]. Despite the clinical significance, translation has proven challenging, e.g., peripheral blood screens for colorectal cancer [7], because of a number of variables including expense, low availability and the high sensitivity of the technique (erroneous amplification).
The exponential nature of the amplification proto-col combined with small quantities of target may result in substantial differences in final yield if there are minor variations in reaction components and thermal cycling conditions and/or mispriming events [8–12]. These consid-erations have led to rigorous assessments of assay utility [13], particularly in the routine setting [14, 15]. Stringent quality control, standardization of sample acquisition and processing are therefore a prerequisite in the development and application of molecular tools [16].
2 Modlin et al.: Robustness of GEP-NEN blood qPCR analysis
This text describes our development of a hydrolysis probe-based molecular signature for gastroenteropan-creatic neuroendocrine neoplasms (GEP-NENs) based on a 51 marker gene signature we derived [17]. Peripheral blood expression of these markers is included in four gene-based classifiers that are used to derive a quotient, the “NEN score”. This differentiates GEP-NENs and con-trols with a high PPV and NPV ( > 90%) [17]. Typically, a consistent protocol for RNA isolation, cDNA synthesis and qPCR should provide a stable platform for target and refer-ence gene analyses [8, 18–21]. We assessed the robustness of this approach and examined potential sources of vari-ation including meals and proton pump inhibitor (PPI) usage, both known to significantly alter peripheral blood biomarker measurements in GEP-NENs [22]. Additionally, we describe the utility of a specific subset of the panel as a surrogate tool to assess suitability of sample processing and preparation.
Materials and methodsStudies were undertaken to assess the effect of a number of variables on assay performance and NEN score (detailed descriptions in the Supplemental Data, which accompanies the article at http://www.degruyter.com/view/j/cclm.2014.52.issue-3/issue-files/cclm.2014.52.issue-3.xml). These included: the limit of detection and quantifica-tion of the assay, the inter- and intra-assay specifications, reproduc-ibility in individual samples, storage (blood manipulation prior to analysis), long-term ( > 1 year) PPI usage, feeding and daily varia-tion. These parameters were evaluated using a gold standard (mRNA derived from three individual human neuroendocrine tumor cell lines) and in clinical samples (Figure S1).
All samples were collected and analyzed according to a stand-ard IRB protocol (Yale University: 6/5/2012) in accordance with the World Medical Association Declaration of Helsinki regarding ethi-cal conduct of research involving human subjects [17]. Details of the cases and controls are included (Supplemental Data, Table S1). Blood samples (5 mL) were collected in 9 mg K2EDTA tubes (BD Vacutainer Venous Blood Collection Tubes, BD Diagnostics, Franklin, NJ, USA). Aliquots of whole blood were stored at −80°C within 2 h of collection (samples immediately stored on ice/4°C after sampling) per stand-ard molecular diagnostics protocols [23]. For timed experiments and analyses of RNA degradation, samples were collected and stored at 4°C for 30 min–48 h prior to freezing at −80°C and then processed.
A two-step protocol (RNA isolation with cDNA production and qPCR) was undertaken using a manual technique in the authors’ lab-oratory. Transcripts (mRNA) were isolated from 1 mL EDTA-collected blood samples using the mini blood kit (Qiagen, Valencia, CA, USA). The RNA quantity was 50 μL, the quality was > 1.8 (A260:280 ratio); anal-ysis of the RNA pattern on electrophoresis (Agilent Technologies) RIN > 5.0 [24]. The standard Qiagen isolation protocol (heme/gDNA contamination not detected) with no modifications was used. cDNA was produced from 50 μL RNA using a High Capacity Reverse tran-scriptase kit (Life Technologies, Grand Island, NY, USA: cDNA pro-duction 2000–2500 ng/μL) and stored at −80°C. qPCR was performed
(384-well plate, HT-7900) with the cDNA (200 ng/μL) and 16 μL of reagents/well (Universal Master Mix II with UNG, Life Technologies, triplicate wells) (50°C 2 min, 95°C 10 min, then 95°C 15 s, 60°C, 60 s for 40 cycles). The majority of primers (Table S2) were exon spanning (82%, the remainder spanned one exon); all were < 160 bprs.
Sample setsA schematic demonstrating our approach is included in Figure S1. Briefly, we examined qPCR efficiency, limit of detection (LOD), limit of quantification (LOQ), inter- and intra-assay variation. In addi-tion we assessed the daily stability of the test, the effects of feeding, age, sex, ethnicity (Table S3) and long-term PPIs on the molecular fingerprint (Table S4). We further assessed sample stability and the adequacy of sample preparation, by measuring the effects of refrig-eration (4°C).
Data analysisRaw CQ values as well as normalized values (using ALG9 and the ΔΔCQ method [17, 25]) were calculated (Microsoft Excel, Redmond, WA, USA). Non-parametric Mann-Whitney and Spearman’s correla-tions were used to compare samples and the Fisher’s test was used for binary comparison (GraphPad Prism 5, La Jolla, CA, USA). For generation of the NEN score, we used a MATLAB (R2011a, Mathworks, Natick, MA, USA) implementation of prediction approaches (Supple-mental Data and Table S5) [17].
Results
qPCR efficiency and limits of detection and quantification
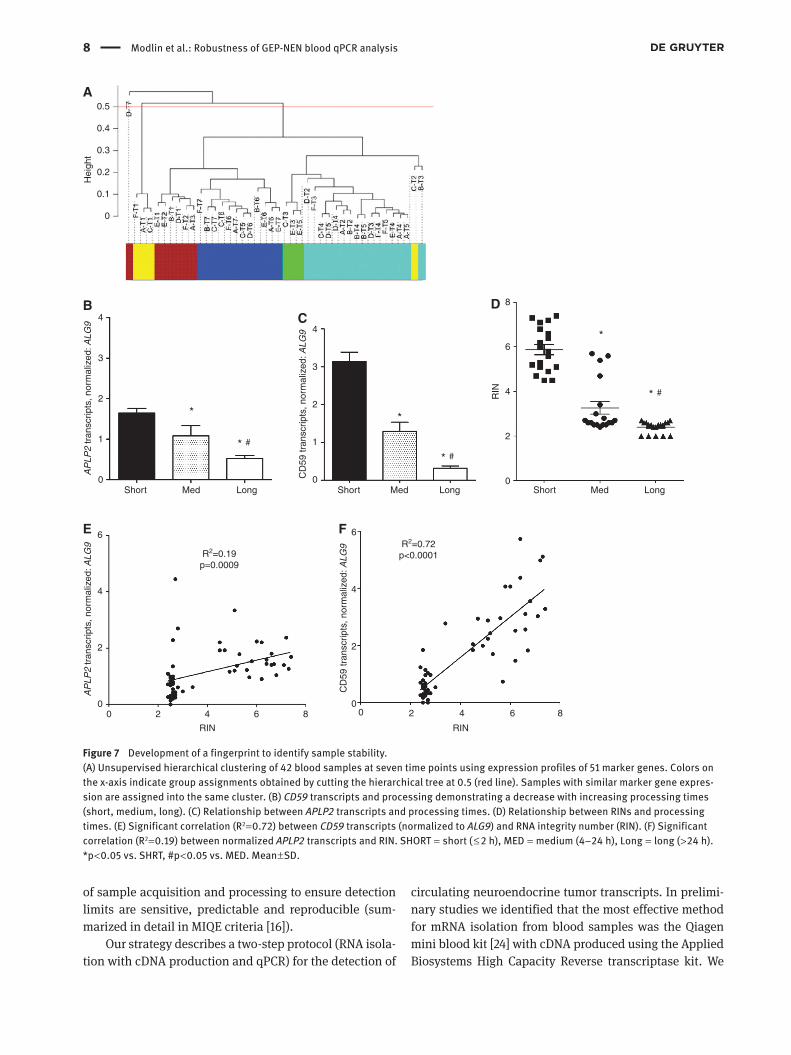
Using the NEN standard, the average CQ for the 51 marker genes and the reference gene ALG9 (detailed discov-ery in Supplemental Data, Figure S2-7) was 28.86 ± 0.62 and ranged from 25.14 (TRMT112) to 35.14 (C21ORF7) (Figure 1A). The overall qPCR efficiency for the genes was 1.94 ± 0.11 and ranged from 1.70 (NUDT3) to 2.34 (NOL3) (Figure 1B). The efficiency for ALG9 was 1.995. qPCR reac-tions are regarded as not inhibited when the qPCR effi-ciency ranges 75%–120% [26].
To assess the limit of the blank (LOB), we measured transcripts in six runs replacing cDNA with water. Single wells (one of three) were identified as positive for three genes, SSTR1 (CQ = 36.95), SSTR5 (CQ = 37.01) and TRMT112 (CQ = 37.02) in one of the six runs. Using a cut-off of ≥ 2 posi-tive wells as a measure of positivity, each of these three genes was considered not amplified. The calculated LOB therefore was 0.

Modlin et al.: Robustness of GEP-NEN blood qPCR analysis 3
The LOD in the gold standard was 2 ng/μL (Figure 1C). The percentage of targets that were positive at each of the cDNA concentrations ranged from 71% to 81% (0.2 ng/mL) to 100% ( ≥ 200 ng/mL) (Figure 1D). The LOD calculated from the regression curve was 0.21 ng/μL and the LOQ was calculated as 0.63 ng/μL. The dynamic range was 1000.
In the clinical sample mix, the LOD ranged from 8 to 100 ng/μL (Figure 1E). The percentage of targets that were positive at each cDNA concentration ranged from 4.25% to 6.25% (0.2 ng/μL) to 98%–100% ( ≥ 200 ng/μL) (Figure 1F). For the clinical mix, increasing the number of cycles to 45–50 cycles identified positive expression in < 1% of target samples; the false-negative rate (at CQ = 40) was cal-culated to be 0.8%. The LOD calculated from the regres-sion curve was 0.43 ng/μL and the LOQ was 1.32 ng/μL. The dynamic range was determined to be 100.
In additional studies, we evaluated the effect of the different cDNA dilutions on the MATLAB-derived “NEN score” (Supplemental Data and Table S5) to assess whether this was altered. This was analyzed in both the gold stand-ard and in six clinical samples at concentrations ranging between 2 and 2000 ng/μL (n = 6 samples/dilution). For the gold standard, all samples were classified at all dilutions; the NEN scores at 2 ng/μL were lower (2.5 ± 0.25) than at
20–2000 ng/μL (all scores 3.6 ± 0.25, no difference between scores). For the clinical samples, a classification could not be performed at 2 ng/μL (below detection level), 3/6 (50%) samples were classified at 20 ng/μL, while all six samples were classified at 200 and 2000 ng/μL. Sample classifica-tions were not different at the 200 and 2000 ng/μL dilu-tion (majority vote score was 3.3 ± 0.2).
These results demonstrate that clinical samples ≥ 200 ng/μL can be effectively and reproducibly analyzed. All further analyses were thereafter undertaken with a concentration of 200 ng/μL and a cut-off of 40 cycles.
Inter- and intra-assay variability
To determine the inter- and intra-assay reproducibility, we assessed both the gold standard and the expression in the same clinical sample processed on separate days (n = 3, SI NEN samples). For the gold standard, variability was assessed in 20 different qPCR runs. The inter-assay vari-ability was 2.14% ± 1.14% and ranged from 0.91% (PKD1) to 5.6% (SSTR5) (Figure 2A). The intra-assay (5 runs) was 1.02% ± 0.74% and ranged from 0.12 (HSF2) to 2.31 (SSTR5) (Figure 2B). Assay precision is summarized in Figure 2C. For the clinical samples, the inter-assay variability was
Figure 1 qPCR characteristics and detection analysis of the neuroendocrine tumor cell lines (gold standard) and clinical samples.(A) Mean CQ values for each gene (2, 20, 200 ng/μL cDNA) demonstrate that 50/51 (98%) of genes are amplified at < 35 cycles. (B) A waterfall plot of the qPCR efficiencies demonstrate that 45/51 (88%) of genes range between 1.8 and 2.2. The average efficiency was 1.94. (C) Detec-tion probability curve for the gold standard (NET cell lines) demonstrating the 95% efficiency was 2 ng/μL. (D) > 95% of genes were ampli-fied using > 2 ng/μL. (E) Detection probability curve for the clinical sample mix demonstrated that the 95% efficiency ranged between 8 and 64 ng/μL cDNA. (F) Analysis of all targets identified that the majority > 95% could be amplified using 100 ng/μL at CQ = 40. Mean ± SD, n = 8.

4 Modlin et al.: Robustness of GEP-NEN blood qPCR analysis
0.5%–1.2% while the intra-assay reproducibility was 0.4%–1%.
In a second analysis, blood from 14 individual patient samples (divided into two aliquots prior to pro-cessing) demonstrated that, as a group, the Spearman’s correlation was 0.72 (p < 0.0001). Samples were therefore significantly correlated at a CQ level (Figure 2D). The CV was 5.33%. Samples were also normalized to ALG9 per protocol; the Spearman’s correlations for each of the nor-malized genes ranged between 0.66 and 0.9, (p < 0.0001) with a median of 0.81. As a group, the overall correla-tion was 0.78 (p < 0.0001) (Figure 2E). An analysis of the
NEN scores identified that the samples exhibited similar scores [p = 0.87 (not different), CV = 0.9] (Figure 2F). The qPCR test is therefore highly reproducible at three differ-ent levels: CQ value, normalized expression and the NEN score.
Day-to-day variability
A consecutive daily analysis of eight small intestinal (SI) NEN patients, identified that the Spearman’s correlation ranged between 0.8 and 0.92 (p < 0.0001) with a median
40
100
10
1
0.1
0.010.01 0.1 1 10 100 1000
PCR, normalized to ALG9
S1 S2
p=NS
4
3
2
NE
N S
core
1
0
R2=0.72p<0.0001
R2=0.78p<0.0001
35
30
25
Gol
d st
anda
rd
Clin
ical
sam
ples
PC
R, C
Q-S
1
PC
R, n
orm
aliz
ed to
ALG
9
PCR, CQ-S2
25 30 35 40
Inter-assy variabilityA
B
C
D
E F
10
8
6
4
2
0
Var
iabi
lity,
%
2.14±1.14 (mean variability±SDEV)
Gene name, n=52
Intra-assy variability10
8
6
4
2
0
Var
iabi
lity,
% 1.02±0.74 (mean variability±SDEV)
Gene name, n=52
10
9
8
Precision
Inter-assay
Intra-assay
Inter-assay
Intra-assay
7
6
5
4
3
2
1
0
Var
iabi
lity,
%
Daily variation,n=20 runs
Plate variation,n=5 runs
Figure 2 Reproducibility of the qPCR-based fingerprint in the neuroendocrine tumor cell lines (gold standard) and clinical samples.(A) Waterfall plot of inter-assay variability (n = 20 runs) for each of the 51 genes and ALG9. The mean variability (for all genes) was 2.14%. (B) Waterfall plot of the intra-assay variability (n = 5 runs); the mean variability was 1.02%. (C) Precision of the qPCR demonstrating inter- and intra-assay variability for each of the 51 marker genes and the 1 reference gene (52 genes) was < 6%, with averages < 2%. (D) Analysis of the 14 clinical samples identified the correlation for CQ values as 0.72 (Spearman’s, p < 0.0001). (E) Following normalization to ALG9, the Spear-man’s correlation was 0.784 (p < 0.0001). (F) Individual NEN scores were not different (p = 0.87). Mean ± SD. Data is log scaled in (B).

Modlin et al.: Robustness of GEP-NEN blood qPCR analysis 5
of 0.86. As a group, the overall correlation was 0.86 (p < 0.0001) (Figure 3A). The overall CV was 7.7%. Samples normalized to ALG9 exhibited Spearman’s correlations ranging between 0.78 and 0.93, (p < 0.0001) with a median of 0.86 (Figure 3B). The samples exhibited similar NEN scores (p = 1.0) which were closely correlated (Rs = 0.96, p < 0.001, CV = 0.95) (Figure 3C). These data indicate that the day-to-day variability in the qPCR test is low and the test is highly reproducible.
Assessment of feeding on the molecular fingerprint
We evaluated the effects of feeding on the qPCR finger-print in five SI NENs. Unsupervised hierarchical clus-tering based on marker gene expression values did not identify intrinsic relationships between feeding and gene expression (Figure 4A) or the NEN score (Figure 4B) over a 4-h experimental period. No differences were noted in reference gene expression (Figure S8B). The fingerprint is therefore robust and is not affected by food intake.
Relationship between age, sex, ethnicity and PPI usage on molecular fingerprint
No relationship was noted between age, sex, ethnicity and the NEN score in an analysis of 61 individuals with NENs (Supplemental Data, Table S3, Figure S9). Eleven individ-uals with gastroesophageal reflux disease (GERD) on long-term ( > 1 year PPI) exhibited scores of 0–1 (normal range) despite elevated plasma CgA levels (mean 32.6 U/L, range: 19–94) in 10 of the 11 (91%) individuals (Supplemental Data, Table S4, Figure 5).
Assessment of storage conditions on the qPCR fingerprint
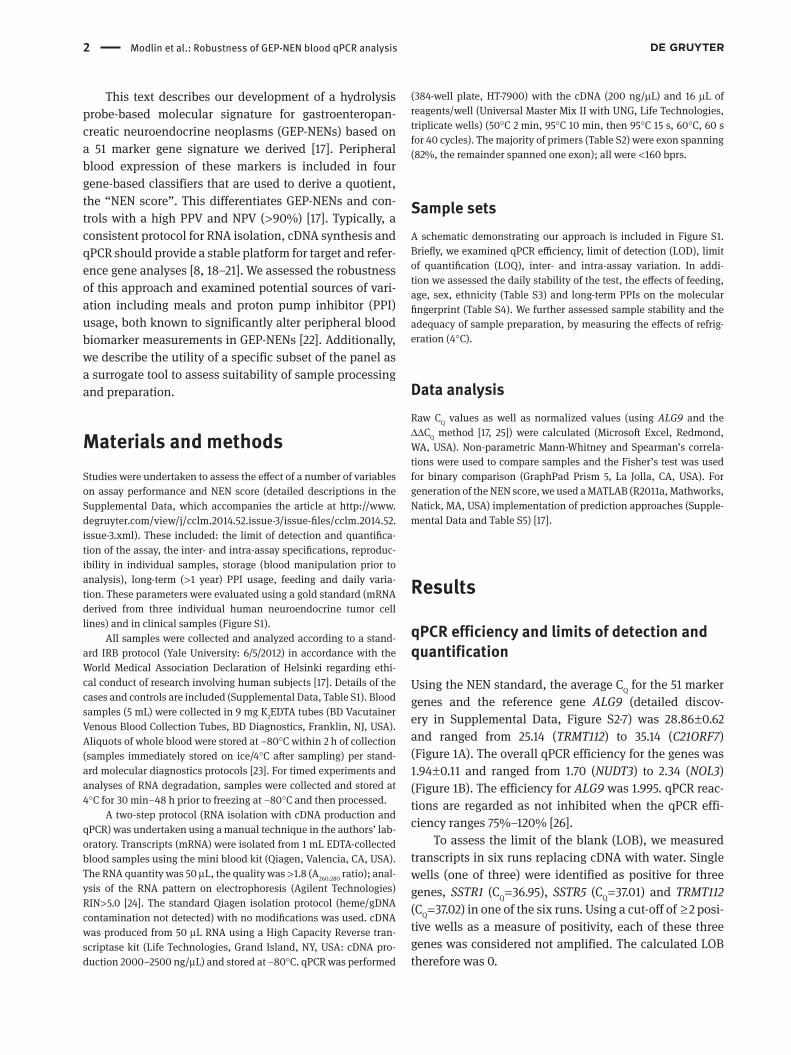
We analyzed 51 marker genes in six patients with samples stored at time 0, 0.5, 1, 2, 4, 24 and 48 h at 4°C prior to pro-cessing. A time-dependent decrease in average expression over time prior to freezing (1.4–2.5-fold decrease, Figure 6A) was evident. This variability resulted in a reduction in the NEN score at times > 2 h (Figure 6B). After 2 h, 15 of 42 (36%) of samples had an abnormal score ( > “1” difference from the index time point of T = 0 h storage). These samples all exhibited a RIN < 3, consistent with RNA degradation. Four of 6 (67%) patients exhibited an abnormal score. This was evident at 4 h (2 patients) and 24 h (2 patients). At this time point such samples would have been identified as “Normal”, i.e., scores 0–1 (Figure 6C). The GEP-NEN molec-ular signature can be considered stable for approximately hours at 4°C. Beyond this gene expression decreases as a function of storage and RNA degradation.
Derivation of a qPCR fingerprint that identi-fies adequacy of sample preparation
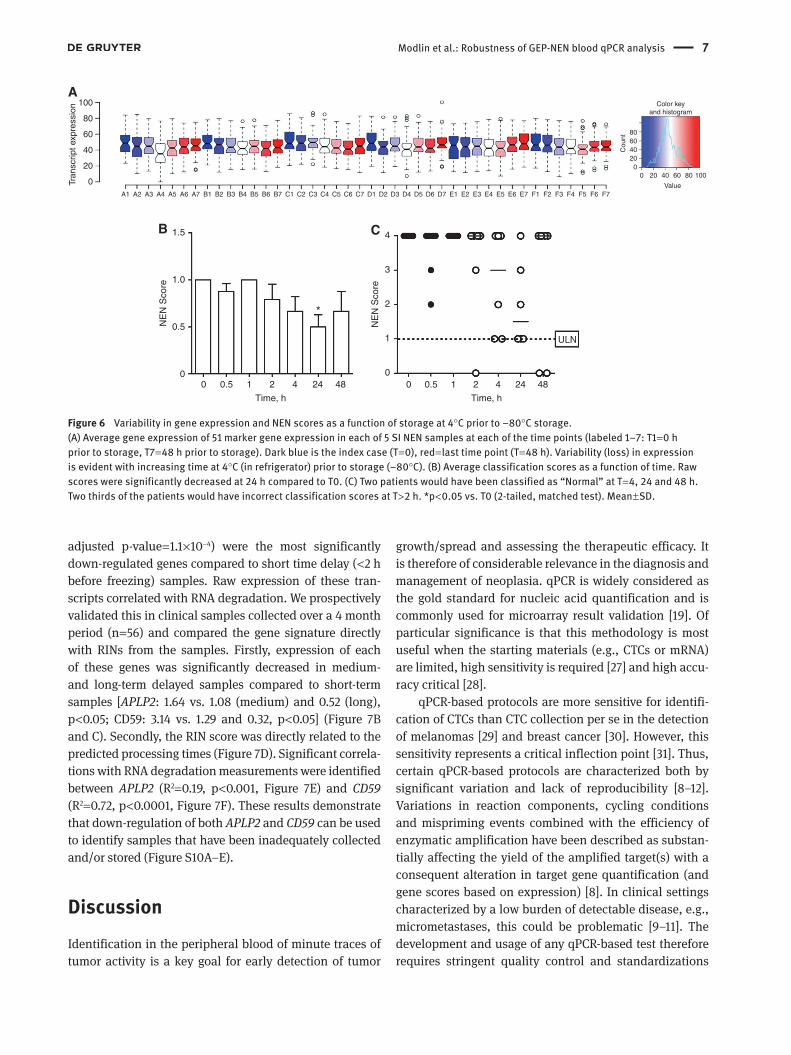
An analysis of marker genes in the previous section (Assessment of storage conditions on the qPCR fingerprint) identified expression of a subset that could be used to define appropriate sample storage and preparation. Unsu-pervised hierarchical clustering of the transcript data (from Figure 6A) identified three sample populations: first, characterized by samples stored for shorter periods (brown and yellow clusters), second, samples stored for interme-diate periods of time (green and turquoise clusters), and third, samples stored for long periods of time (blue cluster). Clusters were not characterized by homogeneous patient
45 1000
100
4
3
2
1
0S1 S2
10
1
0.1
0.01
40
R2=0.86p<0.0001
A B CR2=0.86p=0.0001
35
2525 0.01 0.1 1 10 100 100035
S1, CQ
S2,
CQ
S2,
Nor
mal
ized
to A
LG9
NE
N S
core
S1, Normalized to ALG9
30 4540
30
Figure 3 Day-by-day variability in the qPCR-fingerprint in 8 small intestine (SI) NEN samples.(A) The Spearman’s correlation for CQ values was 0.86 (p < 0.0001). (B). Following normalization to ALG9, the Spearman’s correlation was 0.86 (p < 0.0001). (C) Individual NEN scores were not different (p = 1). Mean ± SD. Data is log scaled in (B).

6 Modlin et al.: Robustness of GEP-NEN blood qPCR analysis
groups (i.e., consisting of samples collected from the same individual) but were grouped according to the time delay prior to RNA extraction (Figure 7A). Differential expres-sion analysis revealed that APLP2 (long vs. short: log
fold change = −1.3, adjusted p-value = 1.1 × 10⁻⁶, medium vs. short: log fold change = −0.9, adjusted p-value = 6.4 × 10⁻⁵) and CD59 (long vs. short: log fold change = −1.2, adjusted p-value = 1.4 × 10⁻⁶, medium vs. short: log fold change = −0.8,
0.50
A
B
0.5
0.50.5
0.50.52
2
2
1001
0
1244
4
4
10
0
AR
AF
1R
AF
1
HS
F2
HD
AC
9F
ZD
7T
ph1
ZZ
Z3
RS
F1
PN
MA
2
EN
PP
4C
TG
FV
MAT
1S
ST
R5
AT6V
1HP
KD
1Y
MAT
2F
LJ 1
035
CO
MM
D 9
TE
CP
R2
C22
1orf
7O
AZ
2S
MA
RC
D3
PLD
3R
NF
41P
QB
P1
NU
DT
3PA
NK
2B
NIP
3LY
PS
13C
FAM
131A
PH
F21
AW
DF
Y3
RT
N2
MO
RF
4L2
TR
MT
112
ZF
HX
3Z
XD
CN
OL3
SS
TR
4S
ST
R1
SS
TR
3
SPA
TA7
GLT
8D1
AK
AP
8L
NA
P1L
1A
PLP
2K
RA
SC
D 5
9B
RA
FLE
01
Ki 6
7
0.33
0.330.50
0.17
0.170.00
4
3
2
NE
N S
core
1
00 0.5 1 2 4
Time, h
Figure 4 Effects of feeding on gene expression measured over a 4-h period.(A) Hierarchical cluster analysis demonstrated no effect of feeding on gene expression. (B) No significant alterations were noted in NEN scores over the 4-h period. (n = 5). Mean ± SD, n = 5 SI NEN patients. Black bar = index case (time = T0).
B100 4
3
2
1
0
9080706050403020100
CgA
ULN
ULN
NEN Score
NE
N S
core
Chr
omog
rani
n A
, ELI
SA
A4
3
2
NE
N S
core
1
00 20 40 60
Plasma chromogranin A, U/L
80 100
Figure 5 Assessment of relationship between PPI usage, elevated chromogranin A and the NEN score.(A) No correlation was noted between plasma CgA levels and score (line = linear correlation curve, dotted lines = 95% CI). (B) Ten of 11 patients had elevated CgA ( > 19 U/L); none of the 11 patients had a NEN score > 1. Mean ± SD. ULN, upper limit of normal.
Modlin et al.: Robustness of GEP-NEN blood qPCR analysis 7
adjusted p-value = 1.1 × 10⁻⁴) were the most significantly down-regulated genes compared to short time delay ( < 2 h before freezing) samples. Raw expression of these tran-scripts correlated with RNA degradation. We prospectively validated this in clinical samples collected over a 4 month period (n = 56) and compared the gene signature directly with RINs from the samples. Firstly, expression of each of these genes was significantly decreased in medium- and long-term delayed samples compared to short-term samples [APLP2: 1.64 vs. 1.08 (medium) and 0.52 (long), p < 0.05; CD59: 3.14 vs. 1.29 and 0.32, p < 0.05] (Figure 7B and C). Secondly, the RIN score was directly related to the predicted processing times (Figure 7D). Significant correla-tions with RNA degradation measurements were identified between APLP2 (R2 = 0.19, p < 0.001, Figure 7E) and CD59 (R2 = 0.72, p < 0.0001, Figure 7F). These results demonstrate that down-regulation of both APLP2 and CD59 can be used to identify samples that have been inadequately collected and/or stored (Figure S10A–E).
DiscussionIdentification in the peripheral blood of minute traces of tumor activity is a key goal for early detection of tumor
growth/spread and assessing the therapeutic efficacy. It is therefore of considerable relevance in the diagnosis and management of neoplasia. qPCR is widely considered as the gold standard for nucleic acid quantification and is commonly used for microarray result validation [19]. Of particular significance is that this methodology is most useful when the starting materials (e.g., CTCs or mRNA) are limited, high sensitivity is required [27] and high accu-racy critical [28].
qPCR-based protocols are more sensitive for identifi-cation of CTCs than CTC collection per se in the detection of melanomas [29] and breast cancer [30]. However, this sensitivity represents a critical inflection point [31]. Thus, certain qPCR-based protocols are characterized both by significant variation and lack of reproducibility [8–12]. Variations in reaction components, cycling conditions and mispriming events combined with the efficiency of enzymatic amplification have been described as substan-tially affecting the yield of the amplified target(s) with a consequent alteration in target gene quantification (and gene scores based on expression) [8]. In clinical settings characterized by a low burden of detectable disease, e.g., micrometastases, this could be problematic [9–11]. The development and usage of any qPCR-based test therefore requires stringent quality control and standardizations
A100
80
60
Tran
scrip
t exp
ress
ion
40
20
0A1 A2 A3 A4 A5 A6 A7 B1 B2 B3 B4 B5 B6 B7 C1 C2 C3 C4 C5 C6 C7 D1 D2 D3 D4 D5 D6 D7 E1 E2 E3 E4 E5 E6 E7 F1 F2 F3 F4 F5 F6 F7
Value
Color keyand histogram
00
204060
Cou
nt
80
20 40 60 80 100
ULN
C 4
3
2
NE
N S
core
1
0
Time, h
0 0.5 1 2 4 24 48
B
Time, h
0
1.5
1.0
0.5
00.5 1 2 4 24 48
*
NE
N S
core
Figure 6 Variability in gene expression and NEN scores as a function of storage at 4°C prior to −80°C storage.(A) Average gene expression of 51 marker gene expression in each of 5 SI NEN samples at each of the time points (labeled 1–7: T1 = 0 h prior to storage, T7 = 48 h prior to storage). Dark blue is the index case (T = 0), red = last time point (T = 48 h). Variability (loss) in expression is evident with increasing time at 4°C (in refrigerator) prior to storage (−80°C). (B) Average classification scores as a function of time. Raw scores were significantly decreased at 24 h compared to T0. (C) Two patients would have been classified as “Normal” at T = 4, 24 and 48 h. Two thirds of the patients would have incorrect classification scores at T > 2 h. *p < 0.05 vs. T0 (2-tailed, matched test). Mean ± SD.
8 Modlin et al.: Robustness of GEP-NEN blood qPCR analysis
of sample acquisition and processing to ensure detection limits are sensitive, predictable and reproducible (sum-marized in detail in MIQE criteria [16]).
Our strategy describes a two-step protocol (RNA isola-tion with cDNA production and qPCR) for the detection of
circulating neuroendocrine tumor transcripts. In prelimi-nary studies we identified that the most effective method for mRNA isolation from blood samples was the Qiagen mini blood kit [24] with cDNA produced using the Applied Biosystems High Capacity Reverse transcriptase kit. We
A
RIN
0
2
4
R2=0.19p=0.0009
6
0 2 4 6 8
AP
LP2
tran
scrip
ts, n
orm
aliz
ed: A
LG9
ER2=0.72
p<0.0001
RIN
0 2 4 6 80
2
4
6
CD
59 tr
ansc
ripts
, nor
mal
ized
: ALG
9
F
0.5
0.4
0.3
0.2
Hei
ght
0.1
0
B
Short Med
*
* #
Long
AP
LP2
tran
scrip
ts, n
orm
aliz
ed: A
LG9
0
2
3
1
4 C
Short Med Long
*
* #
0
2
3
1
4
CD
59 tr
ansc
ripts
, nor
mal
ized
: ALG
9D
Short Med Long
*
* #4
2
0
6
8
RIN
Figure 7 Development of a fingerprint to identify sample stability.(A) Unsupervised hierarchical clustering of 42 blood samples at seven time points using expression profiles of 51 marker genes. Colors on the x-axis indicate group assignments obtained by cutting the hierarchical tree at 0.5 (red line). Samples with similar marker gene expres-sion are assigned into the same cluster. (B) CD59 transcripts and processing demonstrating a decrease with increasing processing times (short, medium, long). (C) Relationship between APLP2 transcripts and processing times. (D) Relationship between RINs and processing times. (E) Significant correlation (R2 = 0.72) between CD59 transcripts (normalized to ALG9) and RNA integrity number (RIN). (F) Significant correlation (R2 = 0.19) between normalized APLP2 transcripts and RIN. SHORT = short ( ≤ 2 h), MED = medium (4–24 h), Long = long ( > 24 h). *p < 0.05 vs. SHRT, #p < 0.05 vs. MED. Mean ± SD.

Modlin et al.: Robustness of GEP-NEN blood qPCR analysis 9
used a HT-7900 machine with 384-well plates and 16 μL of reagents/well and include primers ( < 160 bprs) that are exon spanning to minimize genomic DNA amplification. These consistent parameters for RNA isolation, cDNA syn-thesis and qPCR were selected to ensure a stable platform for target and reference gene analysis [16]. Our reference gene selection (Supplemental Data, Figures S2–8) identi-fied a robust gene (ALG9) that could be effectively used in our normalization protocol. Examination of the assay characteristics and reproducibility included analyses of two sample sets a NEN gold standard comprising tran-scripts from three individual neuroendocrine tumor cell lines and clinical samples from 107 individual SI NENs.
The LOB for the assay was 0. The LOD ranged from 0.21–0.43 ng/μL (gold standard-clinical samples) and the LOQ ranged from 0.63–1.32 ng/μL. The dynamic range of the assay was 100–1000 ng/μL. These results demon-strated that samples ≥ 200 ng/μL could be effectively and reproducibly analyzed at a CQ cut-off of 40 cycles. False negatives were calculated to be < 1%. Further observa-tions from subsequent individual patient studies (n~400 samples) [17] using the LOD as 40 cycles and 200 ng/μL cDNA identified target amplification in 95.3% ± 0.2% of genes examined. These parameters compare well with similar effective laboratory tests. For example, a clini-cal laboratory qPCR-based protocol for the detection of BCR-ABL fusion genes in CML can amplifies the gene or its fusion in 90%–94% [32].
The inter-assay variability was 0.5%–2.1% while the intra-assay variability ranged from 0.4% to 1.02%. Using hydrolysis probe assays, the variability between dupli-cates and triplicates within the same run, and between different runs, was between 0% and 5% [21]. In the case of multiplex approaches this may range as high as 13% [33]. Our protocol results are therefore consistent with other hydrolysis probe-based studies [8, 18–21].
In 14 patients, the CV for the same sample analyzed on two different days was 5.3% demonstrating the effective-ness of this approach. A CV of 4%–24% can routinely be achieved and is generally reported and accepted [34, 35]. While CQs are generally used as measures for reproduc-ibility, they are logarithmic units and may misrepresent true variability [34]. A number of other groups have gener-ated scores (usually a summation) from normalized qPCR values, e.g., for interferon gene expression [36] or T-cell function [37] (both in rheumatoid arthritis [RA]). Although these demonstrate efficacy in differentiating RA subtypes, there exists limited information in the literature validat-ing the robustness of summation-based scores. Our final output is a MATLAB-generated score from the normalized expression values (the NEN score). Assessment of scores
identified these to be significantly correlated and was not different between the two assay times (CV = 0.9–0.95). This indicates this additional parameter was highly stable. By way of comparison, the correlation coefficients for gene expression in leukemia protocols can range between 0.62 and 0.79 [1]. This demonstrates that the NEN score is as robust as clinically-based PCR assays. It is also signifi-cantly better than other NEN assays, e.g., the currently used peripheral blood biomarker chromogranin A (CgA). The CgA assay specifics vary broadly with median sensi-tivities of 63% and CV of approximately 0.6 between test platforms [22] compared to the NEN score which exhibits sensitivities of > 90% and CV > 0.9 [17].
Circadian alteration in CTCs appears in a minority of patients ( < 5%) [38]. However, data on day-to-day vari-ation is not available. We sought to evaluate whether a molecular signature was stable or exhibited significant daily variability. Samples did not exhibit significant day-to-day variation which indicates that variability in the qPCR test is low, an important requisite for longitudinal evaluation of clinical status.
Food intake significantly alters the level of GEP NEN biomarkers thus patient fasting is an important prereq-uisite for diagnostic accuracy. The assessment of fasting samples is therefore a necessity for numerous GEP-NEN peripheral blood biomarkers including CgA, gastrin, pan-creatic polypeptide, insulin, serotonin, VIP and soma-tostatin [22]. In assessment of the molecular footprint, unsupervised hierarchical clustering failed to identify intrinsic relationships between feeding and gene expres-sion, and the NEN score was not altered over a 4-h period following a test meal. We therefore conclude that the fin-gerprint is robust and is not affected by food intake.
Other factors that may influence the score include sex, age, ethnicity and medication. The latter is particu-larly influential for the CgA assay which is elevated by PPI usage [39]. We could identify no relationship between age, sex and ethnicity and the NEN score in an analysis of 61 patients. No elevation in NEN score (0–1) was noted in 11 GERD patients (10 with elevated CgA) treated with PPIs > 1 year.
The GEP-NEN molecular signature was stable for approximately 2 h at 4°C; gene expression, however, decreased as a function of storage and RNA degradation. To ensure optimal and reproducible data, samples should be stored at −80°C within 2 h of collection. A critical feature of any test development is the ability to confirm the integrity/suitability of the sample under evaluation. Typi-cally, the complete RNA pattern on electrophoresis (RIN score) [40] is used to assess sample degradation in qPCR-based protocols. We evaluated the efficacy of storage time

10 Modlin et al.: Robustness of GEP-NEN blood qPCR analysis
(at 4°C) on the RIN score and determined prospectively whether any set of genes could be used as a predictor of sample integrity. Our initial analyses identified a vari-able degradation in RNA with storage but also identified the expression of two candidate genes, APLP2 and CD59, as accurate markers of degradation. In 56 prospectively collected samples, we identified significant correlations between normalized gene expression, the predicted pro-cessing times and the RIN scores. This confirmed that the expression of both these genes could be used as surrogate markers of adequate sample collection and processing.
In this manuscript, we have examined the assay char-acteristics and reproducibility of a peripheral blood qPCR-based fingerprint (“NEN score”) for GEP-NENs to assess the robustness of the process. Our data demonstrates that the 51 gene transcript signature was robust and reproduc-ible, exhibiting suitable inter- and intra-assay metrics ( < 5%). The score was stable and unaffected by feeding, age, sex, ethnicity or long-term PPI usage. These param-eters indicate this may provide an accurate and sensitive
multi transcript molecular tool to identify NENs and assess disease progress using peripheral blood samples.
Acknowledgments: Daniele Alaimo and Steve Callahan for technical support.
Conflict of interest statement
Authors’ conflict of interest disclosure: The authors stated that there are no conflicts of interest regarding the publication of this article. Research funding played no role in the study design; in the collection, analysis, and interpretation of data; in the writing of the report; or in the decision to submit the report for publication.Research funding: Funding for this project was provided by Clifton Life Sciences.Employment or leadership: None declared.Honorarium: None declared.
Received July 2, 2013; accepted September 19, 2013
References1. Gabert J, Beillard E, van der Velden VH, Bi W, Grimwade D,
Pallisgaard N, et al. Standardization and quality control studies of ′real-time′ quantitative reverse transcriptase polymerase chain reaction of fusion gene transcripts for residual disease detection in leukemia a Europe Against Cancer program. Leukemia 2003;17:2318–57.
2. van ′t Veer LJ, Dai H, van de Vijver MJ, He YD, Hart AA, Mao M, et al. Gene expression profiling predicts clinical outcome of breast cancer. Nature 2002;415:530–6.
3. Huang E, Cheng SH, Dressman H, Pittman J, Tsou MH, Horng CF, et al. Gene expression predictors of breast cancer outcomes. Lancet 2003;361:1590–6.
4. Hess KR, Anderson K, Symmans WF, Valero V, Ibrahim N, Mejia JA, et al. Pharmacogenomic predictor of sensitivity to preoperative chemotherapy with paclitaxel and fluorouracil, doxorubicin, and cyclophosphamide in breast cancer. J Clin Oncol 2006;24:4236–44.
5. Cheng SH, Horng CF, West M, Huang E, Pittman J, Tsou MH, et al. Genomic prediction of locoregional recurrence after mastectomy in breast cancer. J Clin Oncol 2006;24:4594–602.
6. Helland A, Johnsen H, Froyland C, Landmark HB, Saetersdal AB, Holmen MM, et al. Radiation-induced effects on gene expression: an in vivo study on breast cancer. Radiother Oncol 2006;80:230–5.
7. Schuster R, Max N, Mann B, Heufelder K, Thilo F, Grone J, et al. Quantitative real-time RT-PCR for detection of disseminated tumor cells in peripheral blood of patients with colorectal cancer using different mRNA markers. Int J Cancer 2004;108:219–27.
8. Wu DY, Ugozzoli L, Pal BK, Qian J, Wallace RB. The effect of temperature and oligonucleotide primer length on the specificity and efficiency of amplification by the polymerase chain reaction. DNA Cell Biol 1991;10:233–8.
9. Dingemans AM, Brakenhoff RH, Postmus PE, Giaccone G. Detection of cytokeratin-19 transcripts by reverse transcriptase-polymerase chain reaction in lung cancer cell lines and blood of lung cancer patients. Lab Invest 1997;77:213–20.
10. Zippelius A, Kufer P, Honold G, Kollermann MW, Oberneder R, Schlimok G, et al. Limitations of reverse-transcriptase polymerase chain reaction analyses for detection of micromet-astatic epithelial cancer cells in bone marrow. J Clin Oncol 1997;15:2701–8.
11. Henke W, Loening SA. Detection of illegitimate transcripts of prostate-specific antigen mRNA in blood by reverse transcription-polymerase chain reaction. Int J Cancer 1998;77:164–5.
12. Lambrechts AC, van’t Veer LJ, Rodenhuis S. The detection of minimal numbers of contaminating epithelial tumor cells in blood or bone marrow: use, limitations and future of RNA-based methods. Ann Oncol 1998;9:1269–76.
13. Sokoloff MH, Tso CL, Kaboo R, Nelson S, Ko J, Dorey F, et al. Quantitative polymerase chain reaction does not improve preoperative prostate cancer staging: a clinico-pathological molecular analysis of 121 patients. J Urol 1996;156:1560–6.
14. Gala JL, Heusterspreute M, Loric S, Hanon F, Tombal B, Van Cangh P, et al. Expression of prostate-specific antigen and prostate-specific membrane antigen transcripts in blood cells: implications for the detection of hematogenous prostate cells and standardization. Clin Chem 1998; 44:472–81.
15. de la Taille A, Olsson CA, Katz AE. Molecular staging of prostate cancer: dream or reality? Oncology (Williston Park) 1999;13:187–94; discussion 94–8, 204–5 pas.

Modlin et al.: Robustness of GEP-NEN blood qPCR analysis 11
16. Bustin SA, Benes V, Garson JA, Hellemans J, Huggett J, Kubista M, et al. The MIQE guidelines: minimum information for publication of quantitative real-time PCR experiments. Clin Chem 2009;55:611–22.
17. Modlin I, Drozdov I, Kidd M. The identification of gut neuro endocrine tumor disease by multiple synchronous transcript analysis in blood. Plos One 2013;e63364.
18. Liu W, Saint DA. Validation of a quantitative method for real time PCR kinetics. Biochem Biophys Res Commun 2002;294:347–53.
19. Bustin SA. Absolute quantification of mRNA using real-time reverse transcription polymerase chain reaction assays. J Mol Endocrinol 2000;25:169–93.
20. Lekanne Deprez RH, Fijnvandraat AC, Ruijter JM, Moorman AF. Sensitivity and accuracy of quantitative real-time polymerase chain reaction using SYBR green I depends on cDNA synthesis conditions. Anal Biochem 2002;307:63–9.
21. Bustin SA. Quantification of mRNA using real-time reverse transcription PCR (RT-PCR): trends and problems. J Mol Endocrinol 2002;29:23–39.
22. Lawrence B, Gustafsson BI, Kidd M, Pavel M, Svejda B, Modlin IM. The clinical relevance of chromogranin A as a biomarker for gastroenteropancreatic neuroendocrine tumors. Endocrinol Metab Clin North Am 2011;40:111–34.
23. Raza A, Ali Z, Irfan J, Murtaza S, Shakeel S. Analytical variables influencing the HCV RNA determination by TaqMan real-time PCR in routine clinical laboratory practice. Mol Biol Rep 2012;39:7421–7.
24. Fleige S, Walf V, Huch S, Prgomet C, Sehm J, Pfaffl MW. Comparison of relative mRNA quantification models and the impact of RNA integrity in quantitative real-time RT-PCR. Biotechnol Lett 2006;28:1601–13.
25. Kidd M, Nadler B, Mane S, Eick G, Malfertheiner M, Champaneria M, et al. GeneChip, geNorm, and gastrointestinal tumors: novel reference genes for real-time PCR. Physiol Genomics 2007;30:363–70.
26. Buh Gasparic M, Cankar K, Zel J, Gruden K. Comparison of different real-time PCR chemistries and their suitability for detection and quantification of genetically modified organisms. BMC Biotechnol 2008;8:26.
27. Fink L, Seeger W, Ermert L, Hanze J, Stahl U, Grimminger F, et al. Real-time quantitative RT-PCR after laser-assisted cell picking. Nat Med 1998;4:1329–33.
28. Ginzinger DG, Godfrey TE, Nigro J, Moore DH, 2nd, Suzuki S, Pallavicini MG, et al. Measurement of DNA copy number at microsatellite loci using quantitative PCR analysis. Cancer Res 2000;60:5405–9.
29. Palmieri G, Pirastu M, Strazzullo M, Ascierto PA, Satriano SM, Motti ML, et al. Clinical significance of PCR-positive mRNA markers in peripheral blood and regional nodes of malignant melanoma patients. Melanoma Cooperative Group. Recent Results Cancer Res 2001;158:200–3.
30. Van der Auwera I, Peeters D, Benoy IH, Elst HJ, Van Laere SJ, Prove A, et al. Circulating tumour cell detection: a direct comparison between the CellSearch System, the AdnaTest and CK-19/mammaglobin RT-PCR in patients with metastatic breast cancer. Br J Cancer 2010;102:276–84.
31. Freeman WM, Walker SJ, Vrana KE. Quantitative RT-PCR: pitfalls and potential. Biotechniques 1999;26:112–22, 24–5.
32. Wong FL, Hamidah NH, Hawa AA, Nurul AN, Leong CF, Saw F, et al. Real-time quantification for BCR-ABL transcripts in chronic myeloid leukaemia patients in UKMMC, Malaysia. Malays J Pathol 2011;33:107–12.
33. Jia X, Ju H, Yang L, Tian Y. A novel multiplex polymerase chain reaction assay for profile analyses of gene expression in peripheral blood. BMC Cardiovasc Disord 2012;12:51.
34. Schmittgen TD, Zakrajsek BA, Mills AG, Gorn V, Singer MJ, Reed MW. Quantitative reverse transcription-polymerase chain reaction to study mRNA decay: comparison of endpoint and real-time methods. Anal Biochem 2000;285:194–204.
35. Ding C, Cantor CR. A high-throughput gene expression analysis technique using competitive PCR and matrix-assisted laser desorption ionization time-of-flight MS. Proc Natl Acad Sci USA 2003;100:3059–64.
36. Raterman HG, Vosslamber S, de Ridder S, Nurmohamed MT, Lems WF, Boers M, et al. The interferon type I signature towards prediction of non-response to rituximab in rheumatoid arthritis patients. Arthritis Res Ther 2012;14:R95.
37. Pratt AG, Swan DC, Richardson S, Wilson G, Hilkens CM, Young DA, et al. A CD4 T cell gene signature for early rheumatoid arthritis implicates interleukin 6-mediated STAT3 signalling, particularly in anti-citrullinated peptide antibody-negative disease. Ann Rheum Dis 2012;71:1374–81.
38. Martin M, Garcia-Saenz JA, Maestro De las Casas ML, Vidaurreta M, Puente J, Veganzones S, et al. Circulating tumor cells in metastatic breast cancer: timing of blood extraction for analysis. Anticancer Res 2009;29:4185–7.
39. Giusti M, Sidoti M, Augeri C, Rabitti C, Minuto F. Effect of short-term treatment with low dosages of the proton-pump inhibitor omeprazole on serum chromogranin A levels in man. Eur J Endocrinol 2004;150:299–303.
40. Brisco MJ, Morley AA. Quantification of RNA integrity and its use for measurement of transcript number. Nucleic Acids Res 2012;25:25.


![PROCEEDINGS OF SPIE...66360L Infrared photoconductivity of InGaAs/GaAs heterostructures with quantum dots [6636-20] V. Shashkin, V. Daniltsev, M. Drozdov, Y. Drozdov, V. Zakamov, A](https://static.fdocuments.net/doc/165x107/5f7f564ac2db2c4ae40102b1/proceedings-of-spie-66360l-infrared-photoconductivity-of-ingaasgaas-heterostructures.jpg)

