Irrigation Management in the Western States - … · Irrigation Management in the Western States...
32
1 Irrigation Management in the Western States Fandi P. Nurzaman 21 April 2017 Department of Civil and Environmental Engineering, University of California - Davis, Davis, CA 95616; email: [email protected] ABSTRACT Irrigation systems have been employed in the American West for several centuries by Native Americans, Spanish explorers, Anglo-American settlers, and farmers working with the Federal Government of the United States. Surface water is the primary water source in the 17 western-most contiguous states in the United States (about 64% of total irrigation withdrawals in 2010 nationwide). However, application of gravity-driven surface irrigation has decreased significantly over years, replaced by pressure irrigation systems in the Western States. Mutual organization, either unincorporated or incorporated, and irrigation districts were the two most common irrigation organizations which delivered irrigation water for 45% of total acres irrigated in the arid west in 1978. These irrigation organizations have helped farmers arrange and pay for irrigation services in the Western States with their distinctive financing mechanisms. Increasing discontinuance of irrigation, growing expenses for irrigation water, and escalating water competition are some challenges for managing irrigation in the Western States. Relying more on groundwater, improving irrigation technologies, and determining what commodities to grow are some of examples on how farmers respond to those challenges. KEYWORDS: Irrigation, the Western States, Management INTRODUCTION Irrigation infrastructure has a foundational role in the history of the 17 western-most contiguous states (hereafter referred to as the Western States) by providing water for agriculture in these driest America’s of states, including Arizona, California, Colorado, Idaho, Kansas, Montana, Nebraska, Nevada, New Mexico, North Dakota, Oklahoma, Oregon, South Dakota, Texas, Utah, Washington and Wyoming (United States Department of Agriculture, 2016b). These infrastructures support life and agricultural prosperity in arid regions in the west and, in many ways, also shape, not only the agricultural economy, but the entire economy of the Western States. Irrigation networks deliver water for about 40 million acres of irrigated agriculture land in the Western States, primarily in the Columbia and Snake River Basins of the Pacific Northwest, California’s Central Valley, and the High Plains Ogallala region (United States Department of Agriculture, 2016b). These irrigated areas significantly contribute to the United States’ economy in general and the Western States’ economies in particular, reflected by the sales of agricultural products from dry states. From the 2012 Census of Agriculture, the Western States’ share on United States’ total agriculture sales are significant, especially for: i) wheat (~70% of United States’ total sales); ii) horticulture (more than one third); iii) vegetables (more than a half); iv) fruits, tree nuts and berries (more than 80%); and v) cotton and cottonseed (more than 40%). Without irrigation, millions of acres of western land would be barren desert or low value grazing with far less economic value (Selby, 1949). Many of these agriculture products would be imported from other parts of the United States or other countries.
Transcript of Irrigation Management in the Western States - … · Irrigation Management in the Western States...
1
Irrigation Management in the Western States
Fandi P. Nurzaman
21 April 2017
Department of Civil and Environmental Engineering, University of California - Davis, Davis, CA 95616; email: [email protected]
ABSTRACT
Irrigation systems have been employed in the American West for several centuries by Native Americans, Spanish explorers, Anglo-American settlers, and farmers working with the Federal Government of the United States. Surface water is the primary water source in the 17 western-most contiguous states in the United States (about 64% of total irrigation withdrawals in 2010 nationwide). However, application of gravity-driven surface irrigation has decreased significantly over years, replaced by pressure irrigation systems in the Western States. Mutual organization, either unincorporated or incorporated, and irrigation districts were the two most common irrigation organizations which delivered irrigation water for 45% of total acres irrigated in the arid west in 1978. These irrigation organizations have helped farmers arrange and pay for irrigation services in the Western States with their distinctive financing mechanisms. Increasing discontinuance of irrigation, growing expenses for irrigation water, and escalating water competition are some challenges for managing irrigation in the Western States. Relying more on groundwater, improving irrigation technologies, and determining what commodities to grow are some of examples on how farmers respond to those challenges.
KEYWORDS: Irrigation, the Western States, Management
INTRODUCTION
Irrigation infrastructure has a foundational role in the history of the 17 western-most contiguous states (hereafter referred to as the Western States) by providing water for agriculture in these driest America’s of states, including Arizona, California, Colorado, Idaho, Kansas, Montana, Nebraska, Nevada, New Mexico, North Dakota, Oklahoma, Oregon, South Dakota, Texas, Utah, Washington and Wyoming (United States Department of Agriculture, 2016b). These infrastructures support life and agricultural prosperity in arid regions in the west and, in many ways, also shape, not only the agricultural economy, but the entire economy of the Western States. Irrigation networks deliver water for about 40 million acres of irrigated agriculture land in the Western States, primarily in the Columbia and Snake River Basins of the Pacific Northwest, California’s Central Valley, and the High Plains Ogallala region (United States Department of Agriculture, 2016b). These irrigated areas significantly contribute to the United States’ economy in general and the Western States’ economies in particular, reflected by the sales of agricultural products from dry states. From the 2012 Census of Agriculture, the Western States’ share on United States’ total agriculture sales are significant, especially for: i) wheat (~70% of United States’ total sales); ii) horticulture (more than one third); iii) vegetables (more than a half); iv) fruits, tree nuts and berries (more than 80%); and v) cotton and cottonseed (more than 40%). Without irrigation, millions of acres of western land would be barren desert or low value grazing with far less economic value (Selby, 1949). Many of these agriculture products would be imported from other parts of the United States or other countries.
2
Irrigation infrastructure becomes more important in the Western States today since it conveys water for food production and other purposes. It allows food crop production in arid/semi-arid areas where it otherwise would be largely impossible (The Office of Technology Assessment, 1983). Besides supporting various crops, irrigation also supports a wide range industries and economic activities related to agriculture, such as cattle farming and dairying. Irrigated land is needed for the livestock industry to produce feed and pasture for dairying and beef cattle/sheep production. Livestock watering is often fed with irrigation water supplies (United States Geological Survey, 2016). Irrigated farm land becomes necessary to make agriculture less subject to drought. Based on United States Department of Agriculture, more than 80% of farmland is in the Western States, and two thirds of irrigated land in the U.S. is in those states. Nearly two thirds of total U.S. sales for cattle in 2012 comes from the Western States (United States Department of Agriculture, 2015b) while the share for sheep and goat farming is nearly 60% of U.S. total sales (United States Department of Agriculture, 2015a). The share for dairy cattle and milk is also quite significant with around 40% of U.S. sales in 2012 (United States Department of Agriculture, 2014). With these shares from the Western States, the United States has the largest fed-cattle industry in the world and is the world's largest producer of beef, primarily high-quality, grain-fed beef for domestic and export use (United States Department of Agriculture, 2016a).
How irrigation infrastructure is used and managed in the arid/semi-arid states, is the subject of this paper. This paper begins by introducing the brief history of irrigation infrastructure in the Western States from the early days before and during European exploration to the present period and irrigation application in arid/semi-arid regions such as how water is delivered from point of source to farmland. Arrangements for irrigation service, institutional frameworks, and financing mechanisms will be discussed later as aspects of irrigation management. Finally, some inevitable challenges for irrigation management such as growing discontinuance of irrigation, growing expenses for irrigation water, and escalating water competition, including the recent and predicted future directions to deal with those situations, are reviewed as a growing population shifts to western states (Kearney et al., 2014).
IRRIGATION DEVELOPMENT
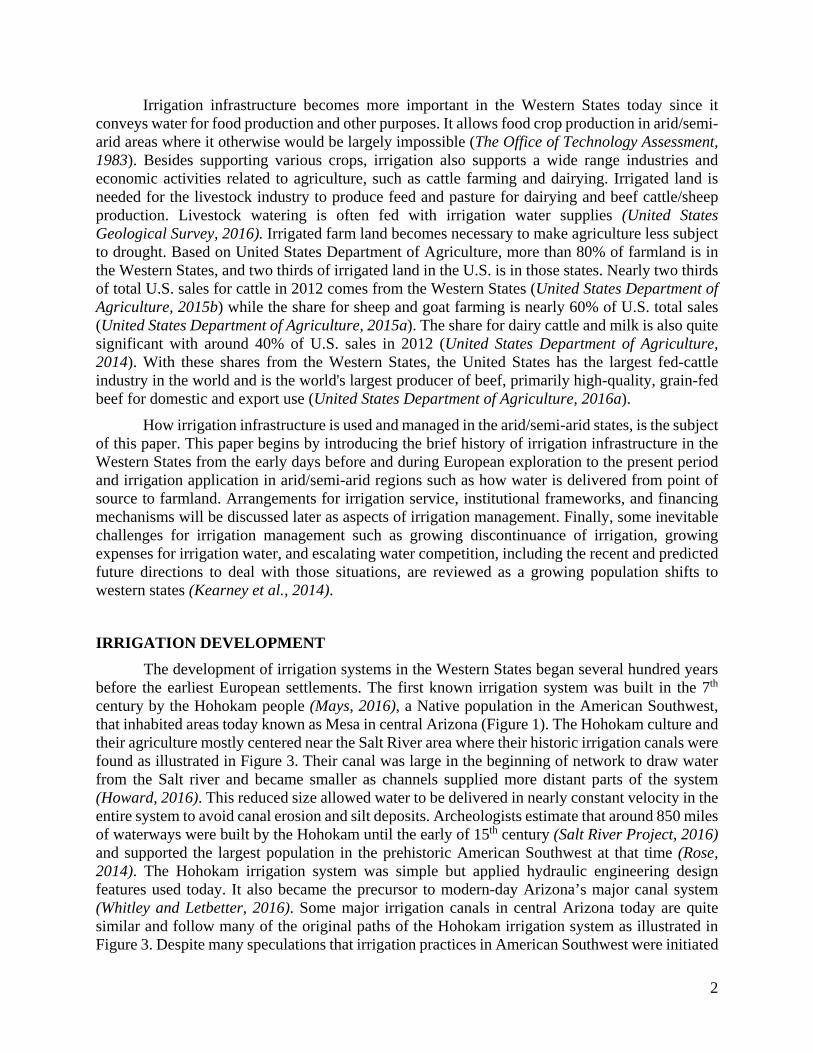
The development of irrigation systems in the Western States began several hundred years before the earliest European settlements. The first known irrigation system was built in the 7th century by the Hohokam people (Mays, 2016), a Native population in the American Southwest, that inhabited areas today known as Mesa in central Arizona (Figure 1). The Hohokam culture and their agriculture mostly centered near the Salt River area where their historic irrigation canals were found as illustrated in Figure 3. Their canal was large in the beginning of network to draw water from the Salt river and became smaller as channels supplied more distant parts of the system (Howard, 2016). This reduced size allowed water to be delivered in nearly constant velocity in the entire system to avoid canal erosion and silt deposits. Archeologists estimate that around 850 miles of waterways were built by the Hohokam until the early of 15th century (Salt River Project, 2016) and supported the largest population in the prehistoric American Southwest at that time (Rose, 2014). The Hohokam irrigation system was simple but applied hydraulic engineering design features used today. It also became the precursor to modern-day Arizona’s major canal system (Whitley and Letbetter, 2016). Some major irrigation canals in central Arizona today are quite similar and follow many of the original paths of the Hohokam irrigation system as illustrated in Figure 3. Despite many speculations that irrigation practices in American Southwest were initiated
3
long before that time, the Hohokam were the only identified culture with a major irrigation system in the prehistoric American Southwest and one of the largest and most sophisticated irrigation networks ever created using preindustrial technology in prehistoric North America (Howard, 1992). Due to limited evidence of other cultures having the large-scale irrigation to intensify food production (Wills and Dorshow, 2012), the Hohokam irrigation system can be considered the first irrigation system in the Western States, and all of North America.
Figure 1 (Left). Map of the Hohokam Cultural Region (Rose, 2014) Figure 2 (Top Right). Excavated Hohokam Canal at Snaketown in 1964 (Arizona State Museum, 2016) Figure 3. (Bottom Right) Illustration of the Prehistoric Hohokam Canal compares to Modern Canal (Salt River Project, 2016)
The Western States entered a new era on the development of irrigation system in early 17th century when hundreds of the earliest Spanish settlers reached the Pueblo area, the native American culture in Northwestern New Mexico illustrated in Figure 4, and began to colonize the American Southwest (Gale Research Inc, 1997). The need to grow wheat to feed the Spanish settlers led to irrigation canals and the beginning of Spanish irrigation in New Mexico (Wozniak, 1998). Even though there were speculations that the Pueblo people already knew and practiced canal irrigation before the Spanish occupation (Simmons, 1972), the Spaniards intensified the use of irrigation canals in the Pueblo areas. During the early 17th to early 19th centuries, irrigation systems and availability of irrigable land in the American Southwest supported agriculture and ensured political hegemony in these areas. Many pieces of land were granted to settlers by the Spanish Government to secure and defend the colonized areas with the accessibility of irrigated water to support the existence of settlement in granted land areas. The construction of a complex and expansive irrigation system became one of the most significant accomplishments of Spanish Colonial residents during their occupation period in the American Southwest (City of San Antonio,
4
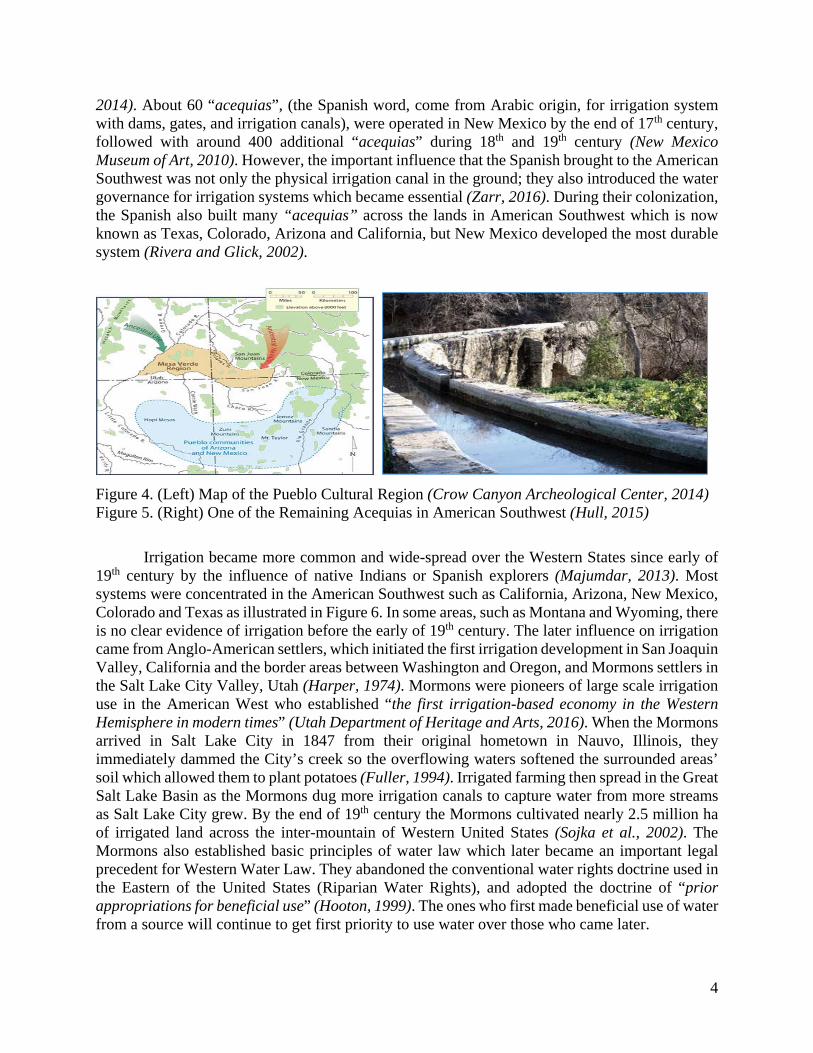
2014). About 60 “acequias”, (the Spanish word, come from Arabic origin, for irrigation system with dams, gates, and irrigation canals), were operated in New Mexico by the end of 17th century, followed with around 400 additional “acequias” during 18th and 19th century (New Mexico Museum of Art, 2010). However, the important influence that the Spanish brought to the American Southwest was not only the physical irrigation canal in the ground; they also introduced the water governance for irrigation systems which became essential (Zarr, 2016). During their colonization, the Spanish also built many “acequias” across the lands in American Southwest which is now known as Texas, Colorado, Arizona and California, but New Mexico developed the most durable system (Rivera and Glick, 2002).
Figure 4. (Left) Map of the Pueblo Cultural Region (Crow Canyon Archeological Center, 2014) Figure 5. (Right) One of the Remaining Acequias in American Southwest (Hull, 2015)
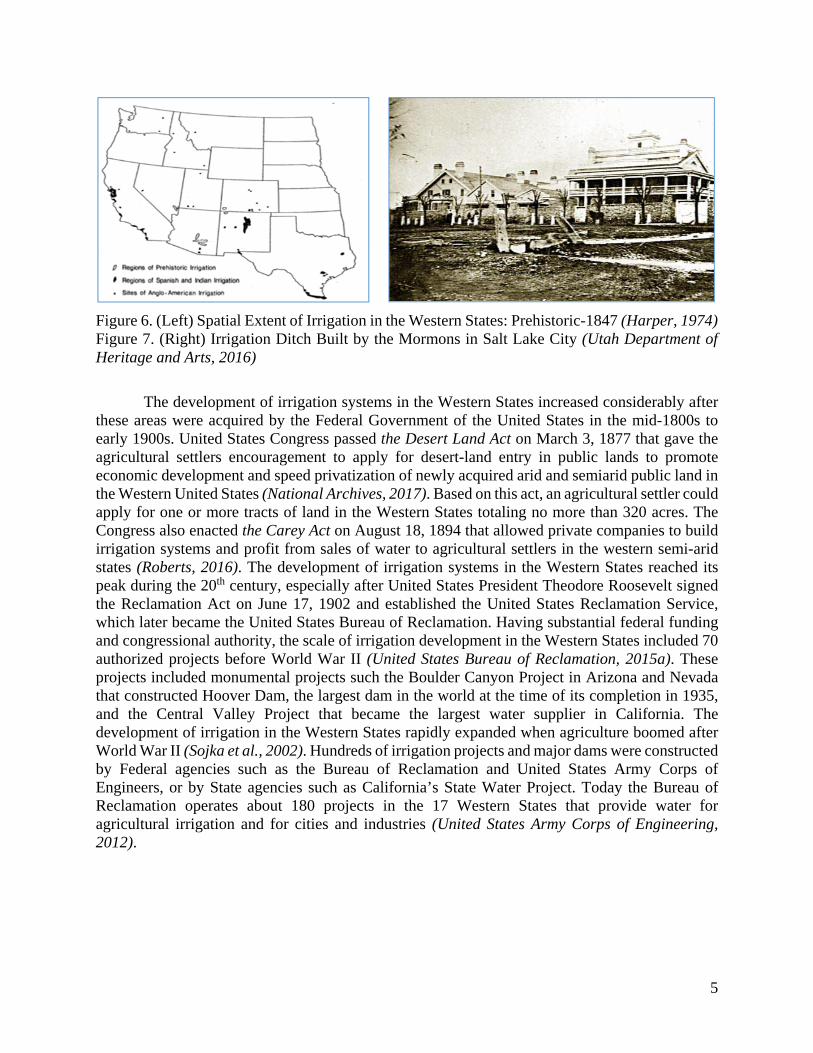
Irrigation became more common and wide-spread over the Western States since early of 19th century by the influence of native Indians or Spanish explorers (Majumdar, 2013). Most systems were concentrated in the American Southwest such as California, Arizona, New Mexico, Colorado and Texas as illustrated in Figure 6. In some areas, such as Montana and Wyoming, there is no clear evidence of irrigation before the early of 19th century. The later influence on irrigation came from Anglo-American settlers, which initiated the first irrigation development in San Joaquin Valley, California and the border areas between Washington and Oregon, and Mormons settlers in the Salt Lake City Valley, Utah (Harper, 1974). Mormons were pioneers of large scale irrigation use in the American West who established “the first irrigation-based economy in the Western Hemisphere in modern times” (Utah Department of Heritage and Arts, 2016). When the Mormons arrived in Salt Lake City in 1847 from their original hometown in Nauvo, Illinois, they immediately dammed the City’s creek so the overflowing waters softened the surrounded areas’ soil which allowed them to plant potatoes (Fuller, 1994). Irrigated farming then spread in the Great Salt Lake Basin as the Mormons dug more irrigation canals to capture water from more streams as Salt Lake City grew. By the end of 19th century the Mormons cultivated nearly 2.5 million ha of irrigated land across the inter-mountain of Western United States (Sojka et al., 2002). The Mormons also established basic principles of water law which later became an important legal precedent for Western Water Law. They abandoned the conventional water rights doctrine used in the Eastern of the United States (Riparian Water Rights), and adopted the doctrine of “prior appropriations for beneficial use” (Hooton, 1999). The ones who first made beneficial use of water from a source will continue to get first priority to use water over those who came later.
5
Figure 6. (Left) Spatial Extent of Irrigation in the Western States: Prehistoric-1847 (Harper, 1974) Figure 7. (Right) Irrigation Ditch Built by the Mormons in Salt Lake City (Utah Department of Heritage and Arts, 2016)
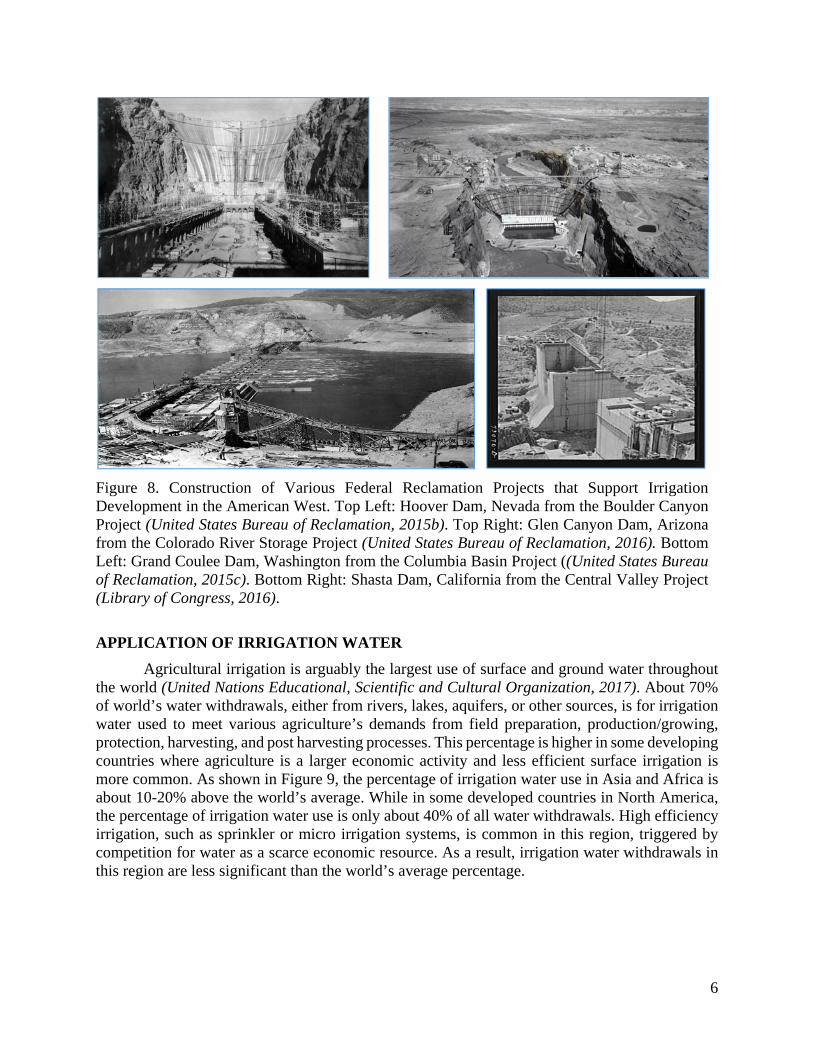
The development of irrigation systems in the Western States increased considerably after these areas were acquired by the Federal Government of the United States in the mid-1800s to early 1900s. United States Congress passed the Desert Land Act on March 3, 1877 that gave the agricultural settlers encouragement to apply for desert-land entry in public lands to promote economic development and speed privatization of newly acquired arid and semiarid public land in the Western United States (National Archives, 2017). Based on this act, an agricultural settler could apply for one or more tracts of land in the Western States totaling no more than 320 acres. The Congress also enacted the Carey Act on August 18, 1894 that allowed private companies to build irrigation systems and profit from sales of water to agricultural settlers in the western semi-arid states (Roberts, 2016). The development of irrigation systems in the Western States reached its peak during the 20th century, especially after United States President Theodore Roosevelt signed the Reclamation Act on June 17, 1902 and established the United States Reclamation Service, which later became the United States Bureau of Reclamation. Having substantial federal funding and congressional authority, the scale of irrigation development in the Western States included 70 authorized projects before World War II (United States Bureau of Reclamation, 2015a). These projects included monumental projects such the Boulder Canyon Project in Arizona and Nevada that constructed Hoover Dam, the largest dam in the world at the time of its completion in 1935, and the Central Valley Project that became the largest water supplier in California. The development of irrigation in the Western States rapidly expanded when agriculture boomed after World War II (Sojka et al., 2002). Hundreds of irrigation projects and major dams were constructed by Federal agencies such as the Bureau of Reclamation and United States Army Corps of Engineers, or by State agencies such as California’s State Water Project. Today the Bureau of Reclamation operates about 180 projects in the 17 Western States that provide water for agricultural irrigation and for cities and industries (United States Army Corps of Engineering, 2012).
6
Figure 8. Construction of Various Federal Reclamation Projects that Support Irrigation Development in the American West. Top Left: Hoover Dam, Nevada from the Boulder Canyon Project (United States Bureau of Reclamation, 2015b). Top Right: Glen Canyon Dam, Arizona from the Colorado River Storage Project (United States Bureau of Reclamation, 2016). Bottom Left: Grand Coulee Dam, Washington from the Columbia Basin Project ((United States Bureau of Reclamation, 2015c). Bottom Right: Shasta Dam, California from the Central Valley Project (Library of Congress, 2016).
APPLICATION OF IRRIGATION WATER
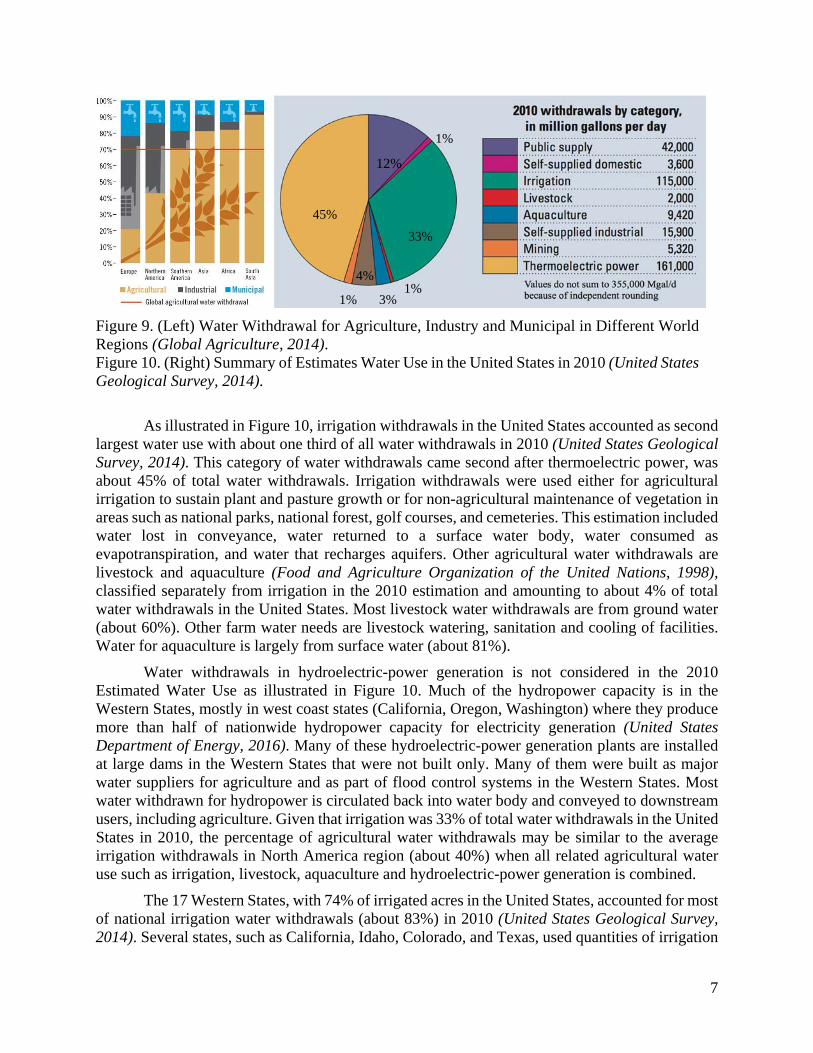
Agricultural irrigation is arguably the largest use of surface and ground water throughout the world (United Nations Educational, Scientific and Cultural Organization, 2017). About 70% of world’s water withdrawals, either from rivers, lakes, aquifers, or other sources, is for irrigation water used to meet various agriculture’s demands from field preparation, production/growing, protection, harvesting, and post harvesting processes. This percentage is higher in some developing countries where agriculture is a larger economic activity and less efficient surface irrigation is more common. As shown in Figure 9, the percentage of irrigation water use in Asia and Africa is about 10-20% above the world’s average. While in some developed countries in North America, the percentage of irrigation water use is only about 40% of all water withdrawals. High efficiency irrigation, such as sprinkler or micro irrigation systems, is common in this region, triggered by competition for water as a scarce economic resource. As a result, irrigation water withdrawals in this region are less significant than the world’s average percentage.
7
Figure 9. (Left) Water Withdrawal for Agriculture, Industry and Municipal in Different World Regions (Global Agriculture, 2014). Figure 10. (Right) Summary of Estimates Water Use in the United States in 2010 (United States Geological Survey, 2014).
As illustrated in Figure 10, irrigation withdrawals in the United States accounted as second largest water use with about one third of all water withdrawals in 2010 (United States Geological Survey, 2014). This category of water withdrawals came second after thermoelectric power, was about 45% of total water withdrawals. Irrigation withdrawals were used either for agricultural irrigation to sustain plant and pasture growth or for non-agricultural maintenance of vegetation in areas such as national parks, national forest, golf courses, and cemeteries. This estimation included water lost in conveyance, water returned to a surface water body, water consumed as evapotranspiration, and water that recharges aquifers. Other agricultural water withdrawals are livestock and aquaculture (Food and Agriculture Organization of the United Nations, 1998), classified separately from irrigation in the 2010 estimation and amounting to about 4% of total water withdrawals in the United States. Most livestock water withdrawals are from ground water (about 60%). Other farm water needs are livestock watering, sanitation and cooling of facilities. Water for aquaculture is largely from surface water (about 81%).
Water withdrawals in hydroelectric-power generation is not considered in the 2010 Estimated Water Use as illustrated in Figure 10. Much of the hydropower capacity is in the Western States, mostly in west coast states (California, Oregon, Washington) where they produce more than half of nationwide hydropower capacity for electricity generation (United States Department of Energy, 2016). Many of these hydroelectric-power generation plants are installed at large dams in the Western States that were not built only. Many of them were built as major water suppliers for agriculture and as part of flood control systems in the Western States. Most water withdrawn for hydropower is circulated back into water body and conveyed to downstream users, including agriculture. Given that irrigation was 33% of total water withdrawals in the United States in 2010, the percentage of agricultural water withdrawals may be similar to the average irrigation withdrawals in North America region (about 40%) when all related agricultural water use such as irrigation, livestock, aquaculture and hydroelectric-power generation is combined.
The 17 Western States, with 74% of irrigated acres in the United States, accounted for most of national irrigation water withdrawals (about 83%) in 2010 (United States Geological Survey, 2014). Several states, such as California, Idaho, Colorado, and Texas, used quantities of irrigation
12%
45%
33%
1%
1% 3%
4%
1%
8
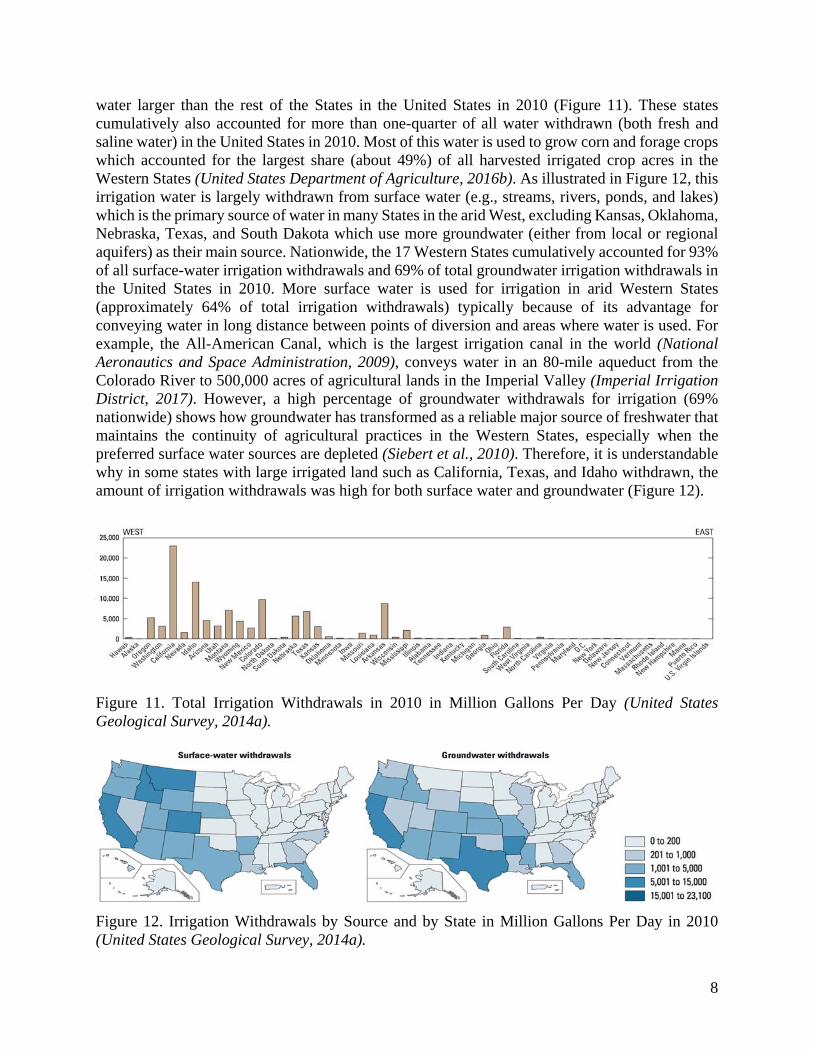
water larger than the rest of the States in the United States in 2010 (Figure 11). These states cumulatively also accounted for more than one-quarter of all water withdrawn (both fresh and saline water) in the United States in 2010. Most of this water is used to grow corn and forage crops which accounted for the largest share (about 49%) of all harvested irrigated crop acres in the Western States (United States Department of Agriculture, 2016b). As illustrated in Figure 12, this irrigation water is largely withdrawn from surface water (e.g., streams, rivers, ponds, and lakes) which is the primary source of water in many States in the arid West, excluding Kansas, Oklahoma, Nebraska, Texas, and South Dakota which use more groundwater (either from local or regional aquifers) as their main source. Nationwide, the 17 Western States cumulatively accounted for 93% of all surface-water irrigation withdrawals and 69% of total groundwater irrigation withdrawals in the United States in 2010. More surface water is used for irrigation in arid Western States (approximately 64% of total irrigation withdrawals) typically because of its advantage for conveying water in long distance between points of diversion and areas where water is used. For example, the All-American Canal, which is the largest irrigation canal in the world (National Aeronautics and Space Administration, 2009), conveys water in an 80-mile aqueduct from the Colorado River to 500,000 acres of agricultural lands in the Imperial Valley (Imperial Irrigation District, 2017). However, a high percentage of groundwater withdrawals for irrigation (69% nationwide) shows how groundwater has transformed as a reliable major source of freshwater that maintains the continuity of agricultural practices in the Western States, especially when the preferred surface water sources are depleted (Siebert et al., 2010). Therefore, it is understandable why in some states with large irrigated land such as California, Texas, and Idaho withdrawn, the amount of irrigation withdrawals was high for both surface water and groundwater (Figure 12).
Figure 11. Total Irrigation Withdrawals in 2010 in Million Gallons Per Day (United States Geological Survey, 2014a).
Figure 12. Irrigation Withdrawals by Source and by State in Million Gallons Per Day in 2010 (United States Geological Survey, 2014a).
9
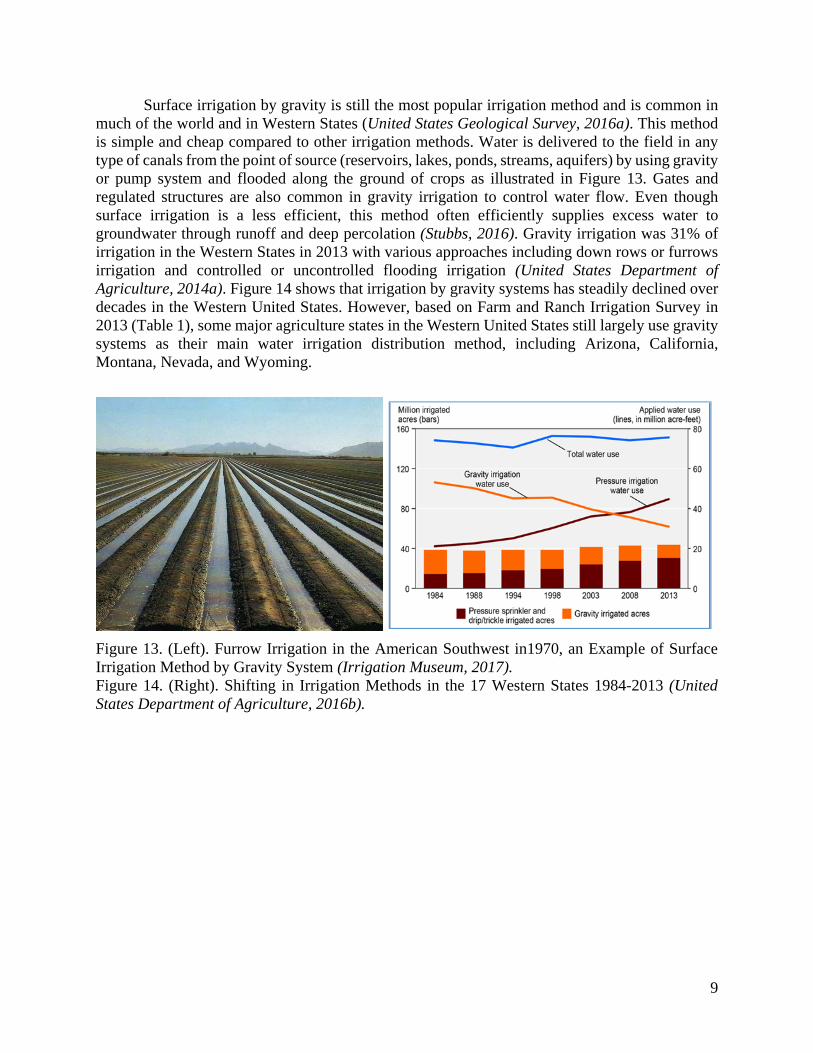
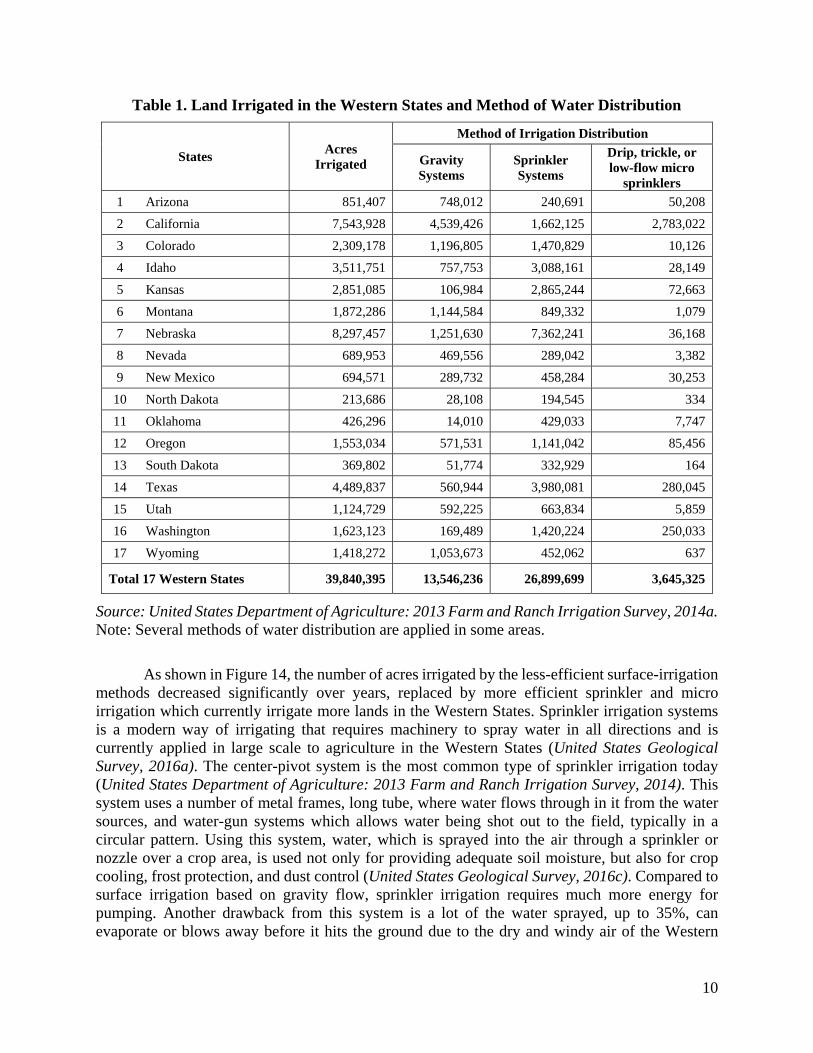
Surface irrigation by gravity is still the most popular irrigation method and is common in much of the world and in Western States (United States Geological Survey, 2016a). This method is simple and cheap compared to other irrigation methods. Water is delivered to the field in any type of canals from the point of source (reservoirs, lakes, ponds, streams, aquifers) by using gravity or pump system and flooded along the ground of crops as illustrated in Figure 13. Gates and regulated structures are also common in gravity irrigation to control water flow. Even though surface irrigation is a less efficient, this method often efficiently supplies excess water to groundwater through runoff and deep percolation (Stubbs, 2016). Gravity irrigation was 31% of irrigation in the Western States in 2013 with various approaches including down rows or furrows irrigation and controlled or uncontrolled flooding irrigation (United States Department of Agriculture, 2014a). Figure 14 shows that irrigation by gravity systems has steadily declined over decades in the Western United States. However, based on Farm and Ranch Irrigation Survey in 2013 (Table 1), some major agriculture states in the Western United States still largely use gravity systems as their main water irrigation distribution method, including Arizona, California, Montana, Nevada, and Wyoming.
Figure 13. (Left). Furrow Irrigation in the American Southwest in1970, an Example of Surface Irrigation Method by Gravity System (Irrigation Museum, 2017). Figure 14. (Right). Shifting in Irrigation Methods in the 17 Western States 1984-2013 (United States Department of Agriculture, 2016b).
10
Table 1. Land Irrigated in the Western States and Method of Water Distribution
States Acres
Irrigated
Method of Irrigation Distribution
Gravity Systems
Sprinkler Systems
Drip, trickle, or low-flow micro
sprinklers
1 Arizona 851,407 748,012 240,691 50,208
2 California 7,543,928 4,539,426 1,662,125 2,783,022
3 Colorado 2,309,178 1,196,805 1,470,829 10,126
4 Idaho 3,511,751 757,753 3,088,161 28,149
5 Kansas 2,851,085 106,984 2,865,244 72,663
6 Montana 1,872,286 1,144,584 849,332 1,079
7 Nebraska 8,297,457 1,251,630 7,362,241 36,168
8 Nevada 689,953 469,556 289,042 3,382
9 New Mexico 694,571 289,732 458,284 30,253
10 North Dakota 213,686 28,108 194,545 334
11 Oklahoma 426,296 14,010 429,033 7,747
12 Oregon 1,553,034 571,531 1,141,042 85,456
13 South Dakota 369,802 51,774 332,929 164
14 Texas 4,489,837 560,944 3,980,081 280,045
15 Utah 1,124,729 592,225 663,834 5,859
16 Washington 1,623,123 169,489 1,420,224 250,033
17 Wyoming 1,418,272 1,053,673 452,062 637
Total 17 Western States 39,840,395 13,546,236 26,899,699 3,645,325
Source: United States Department of Agriculture: 2013 Farm and Ranch Irrigation Survey, 2014a. Note: Several methods of water distribution are applied in some areas.
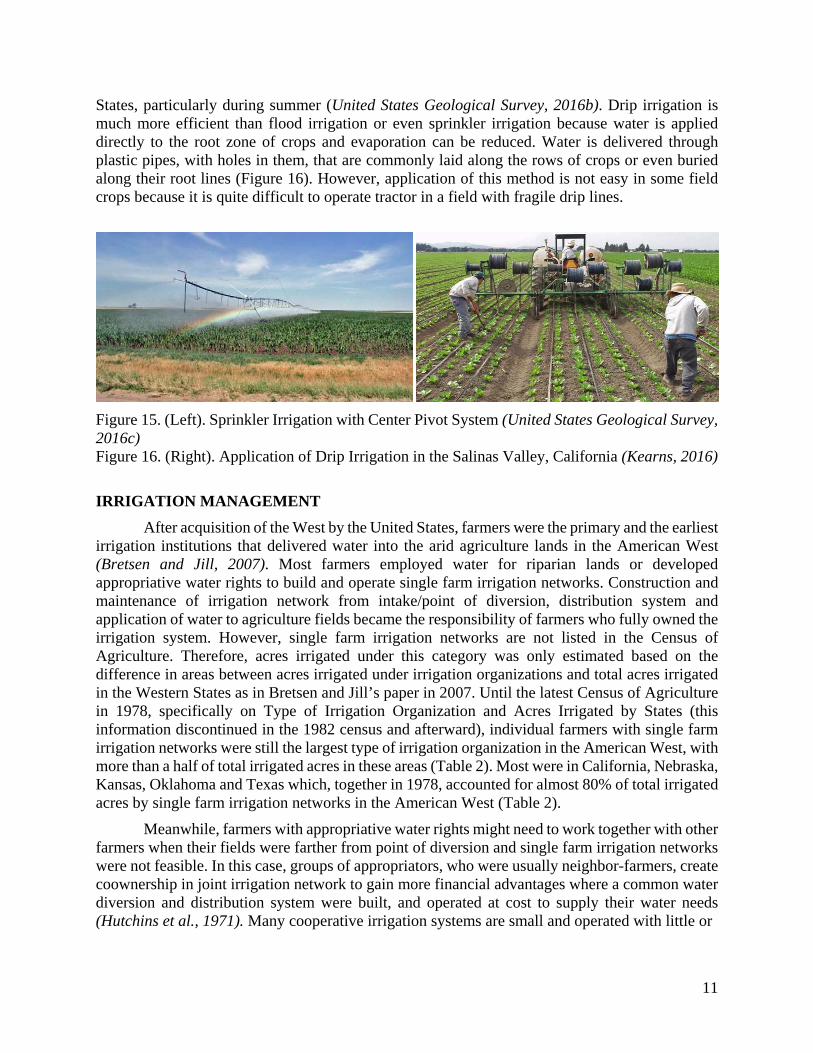
As shown in Figure 14, the number of acres irrigated by the less-efficient surface-irrigation methods decreased significantly over years, replaced by more efficient sprinkler and micro irrigation which currently irrigate more lands in the Western States. Sprinkler irrigation systems is a modern way of irrigating that requires machinery to spray water in all directions and is currently applied in large scale to agriculture in the Western States (United States Geological Survey, 2016a). The center-pivot system is the most common type of sprinkler irrigation today (United States Department of Agriculture: 2013 Farm and Ranch Irrigation Survey, 2014). This system uses a number of metal frames, long tube, where water flows through in it from the water sources, and water-gun systems which allows water being shot out to the field, typically in a circular pattern. Using this system, water, which is sprayed into the air through a sprinkler or nozzle over a crop area, is used not only for providing adequate soil moisture, but also for crop cooling, frost protection, and dust control (United States Geological Survey, 2016c). Compared to surface irrigation based on gravity flow, sprinkler irrigation requires much more energy for pumping. Another drawback from this system is a lot of the water sprayed, up to 35%, can evaporate or blows away before it hits the ground due to the dry and windy air of the Western
11
States, particularly during summer (United States Geological Survey, 2016b). Drip irrigation is much more efficient than flood irrigation or even sprinkler irrigation because water is applied directly to the root zone of crops and evaporation can be reduced. Water is delivered through plastic pipes, with holes in them, that are commonly laid along the rows of crops or even buried along their root lines (Figure 16). However, application of this method is not easy in some field crops because it is quite difficult to operate tractor in a field with fragile drip lines.
Figure 15. (Left). Sprinkler Irrigation with Center Pivot System (United States Geological Survey, 2016c) Figure 16. (Right). Application of Drip Irrigation in the Salinas Valley, California (Kearns, 2016)
IRRIGATION MANAGEMENT
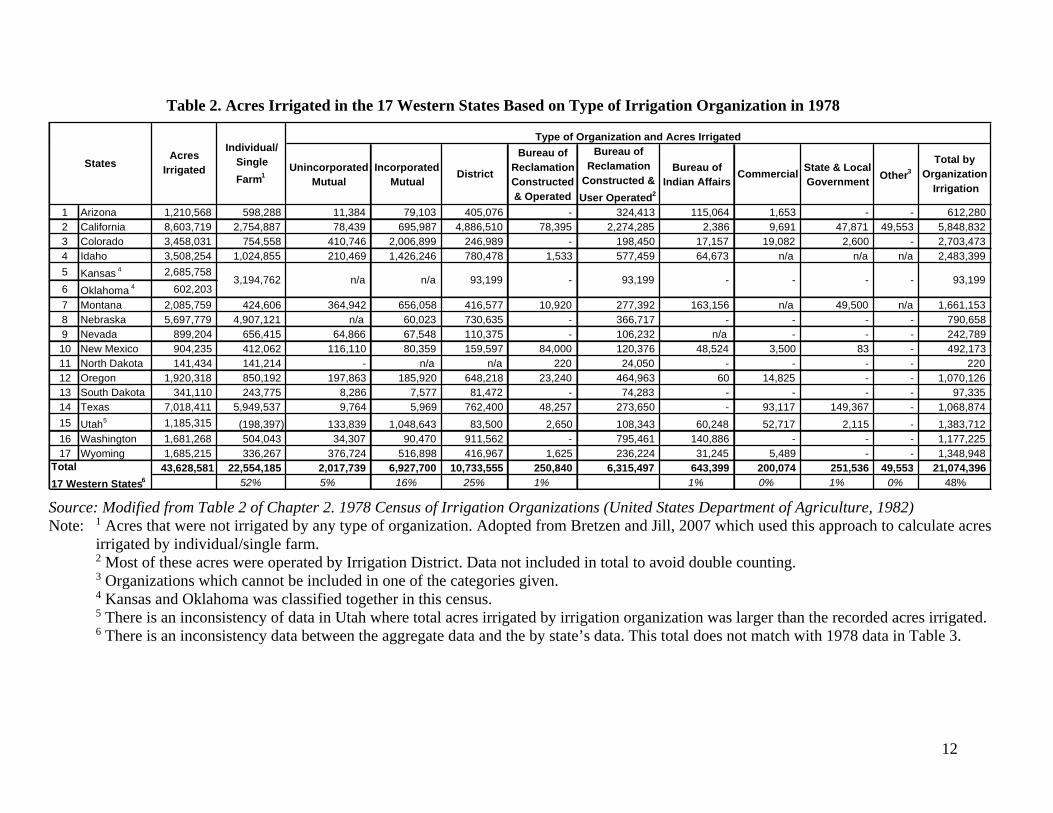
After acquisition of the West by the United States, farmers were the primary and the earliest irrigation institutions that delivered water into the arid agriculture lands in the American West (Bretsen and Jill, 2007). Most farmers employed water for riparian lands or developed appropriative water rights to build and operate single farm irrigation networks. Construction and maintenance of irrigation network from intake/point of diversion, distribution system and application of water to agriculture fields became the responsibility of farmers who fully owned the irrigation system. However, single farm irrigation networks are not listed in the Census of Agriculture. Therefore, acres irrigated under this category was only estimated based on the difference in areas between acres irrigated under irrigation organizations and total acres irrigated in the Western States as in Bretsen and Jill’s paper in 2007. Until the latest Census of Agriculture in 1978, specifically on Type of Irrigation Organization and Acres Irrigated by States (this information discontinued in the 1982 census and afterward), individual farmers with single farm irrigation networks were still the largest type of irrigation organization in the American West, with more than a half of total irrigated acres in these areas (Table 2). Most were in California, Nebraska, Kansas, Oklahoma and Texas which, together in 1978, accounted for almost 80% of total irrigated acres by single farm irrigation networks in the American West (Table 2).
Meanwhile, farmers with appropriative water rights might need to work together with other farmers when their fields were farther from point of diversion and single farm irrigation networks were not feasible. In this case, groups of appropriators, who were usually neighbor-farmers, create coownership in joint irrigation network to gain more financial advantages where a common water diversion and distribution system were built, and operated at cost to supply their water needs (Hutchins et al., 1971). Many cooperative irrigation systems are small and operated with little or
12
Table 2. Acres Irrigated in the 17 Western States Based on Type of Irrigation Organization in 1978
UnincorporatedMutual
IncorporatedMutual
District
Bureau ofReclamationConstructed& Operated
Bureau ofReclamation
Constructed & User Operated2
Bureau ofIndian Affairs
Commercial State & LocalGovernment Other3
Total by Organization
Irrigation
1 Arizona 1,210,568 598,288 11,384 79,103 405,076 - 324,413 115,064 1,653 - - 612,280 2 California 8,603,719 2,754,887 78,439 695,987 4,886,510 78,395 2,274,285 2,386 9,691 47,871 49,553 5,848,832 3 Colorado 3,458,031 754,558 410,746 2,006,899 246,989 - 198,450 17,157 19,082 2,600 - 2,703,473 4 Idaho 3,508,254 1,024,855 210,469 1,426,246 780,478 1,533 577,459 64,673 n/a n/a n/a 2,483,399
5 Kansas 4 2,685,758
6 Oklahoma 4 602,203
7 Montana 2,085,759 424,606 364,942 656,058 416,577 10,920 277,392 163,156 n/a 49,500 n/a 1,661,153 8 Nebraska 5,697,779 4,907,121 n/a 60,023 730,635 - 366,717 - - - - 790,658 9 Nevada 899,204 656,415 64,866 67,548 110,375 - 106,232 n/a - - - 242,789 10 New Mexico 904,235 412,062 116,110 80,359 159,597 84,000 120,376 48,524 3,500 83 - 492,173 11 North Dakota 141,434 141,214 - n/a n/a 220 24,050 - - - - 220 12 Oregon 1,920,318 850,192 197,863 185,920 648,218 23,240 464,963 60 14,825 - - 1,070,126 13 South Dakota 341,110 243,775 8,286 7,577 81,472 - 74,283 - - - - 97,335 14 Texas 7,018,411 5,949,537 9,764 5,969 762,400 48,257 273,650 - 93,117 149,367 - 1,068,874
15 Utah5 1,185,315 (198,397) 133,839 1,048,643 83,500 2,650 108,343 60,248 52,717 2,115 - 1,383,712 16 Washington 1,681,268 504,043 34,307 90,470 911,562 - 795,461 140,886 - - - 1,177,225 17 Wyoming 1,685,215 336,267 376,724 516,898 416,967 1,625 236,224 31,245 5,489 - - 1,348,948
43,628,581 22,554,185 2,017,739 6,927,700 10,733,555 250,840 6,315,497 643,399 200,074 251,536 49,553 21,074,396 52% 5% 16% 25% 1% 1% 0% 1% 0% 48%
Individual/SingleFarm1
Type of Organization and Acres Irrigated
93,199
StatesAcres
Irrigated
- 93,199 - - - -
Total17 Western States6
n/a n/a 93,199 3,194,762
Source: Modified from Table 2 of Chapter 2. 1978 Census of Irrigation Organizations (United States Department of Agriculture, 1982) Note: 1 Acres that were not irrigated by any type of organization. Adopted from Bretzen and Jill, 2007 which used this approach to calculate acres
irrigated by individual/single farm. 2 Most of these acres were operated by Irrigation District. Data not included in total to avoid double counting. 3 Organizations which cannot be included in one of the categories given. 4 Kansas and Oklahoma was classified together in this census. 5 There is an inconsistency of data in Utah where total acres irrigated by irrigation organization was larger than the recorded acres irrigated. 6 There is an inconsistency data between the aggregate data and the by state’s data. This total does not match with 1978 data in Table 3.
13
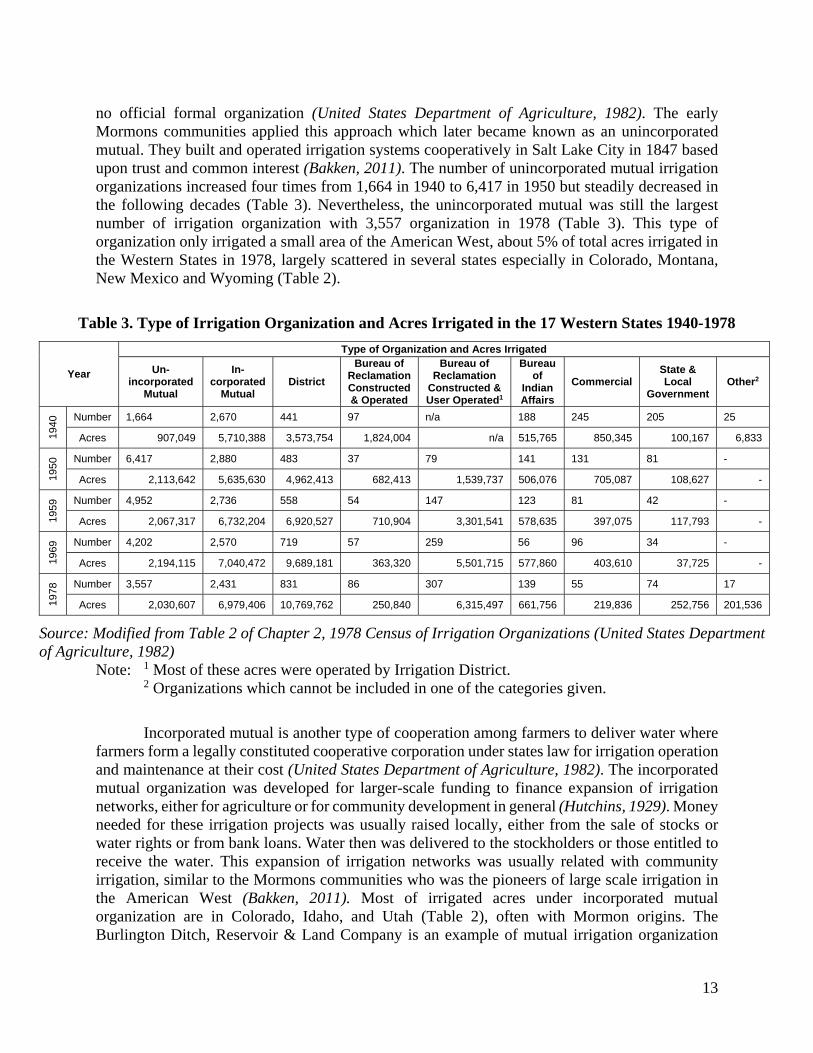
no official formal organization (United States Department of Agriculture, 1982). The early Mormons communities applied this approach which later became known as an unincorporated mutual. They built and operated irrigation systems cooperatively in Salt Lake City in 1847 based upon trust and common interest (Bakken, 2011). The number of unincorporated mutual irrigation organizations increased four times from 1,664 in 1940 to 6,417 in 1950 but steadily decreased in the following decades (Table 3). Nevertheless, the unincorporated mutual was still the largest number of irrigation organization with 3,557 organization in 1978 (Table 3). This type of organization only irrigated a small area of the American West, about 5% of total acres irrigated in the Western States in 1978, largely scattered in several states especially in Colorado, Montana, New Mexico and Wyoming (Table 2).
Table 3. Type of Irrigation Organization and Acres Irrigated in the 17 Western States 1940-1978
Year
Type of Organization and Acres Irrigated
Un-incorporated
Mutual
In-corporated
Mutual District
Bureau of ReclamationConstructed& Operated
Bureau of Reclamation
Constructed & User Operated1
Bureau of
IndianAffairs
Commercial State & Local
Government Other2
1940
Number 1,664 2,670 441 97 n/a 188 245 205 25
Acres 907,049 5,710,388 3,573,754 1,824,004 n/a 515,765 850,345 100,167 6,833
1950
Number 6,417 2,880 483 37 79 141 131 81 -
Acres 2,113,642 5,635,630 4,962,413 682,413 1,539,737 506,076 705,087 108,627 -
1959
Number 4,952 2,736 558 54 147 123 81 42 -
Acres 2,067,317 6,732,204 6,920,527 710,904 3,301,541 578,635 397,075 117,793 -
1969
Number 4,202 2,570 719 57 259 56 96 34 -
Acres 2,194,115 7,040,472 9,689,181 363,320 5,501,715 577,860 403,610 37,725 -
1978
Number 3,557 2,431 831 86 307 139 55 74 17
Acres 2,030,607 6,979,406 10,769,762 250,840 6,315,497 661,756 219,836 252,756 201,536
Source: Modified from Table 2 of Chapter 2, 1978 Census of Irrigation Organizations (United States Department of Agriculture, 1982)
Note: 1 Most of these acres were operated by Irrigation District. 2 Organizations which cannot be included in one of the categories given.
Incorporated mutual is another type of cooperation among farmers to deliver water where farmers form a legally constituted cooperative corporation under states law for irrigation operation and maintenance at their cost (United States Department of Agriculture, 1982). The incorporated mutual organization was developed for larger-scale funding to finance expansion of irrigation networks, either for agriculture or for community development in general (Hutchins, 1929). Money needed for these irrigation projects was usually raised locally, either from the sale of stocks or water rights or from bank loans. Water then was delivered to the stockholders or those entitled to receive the water. This expansion of irrigation networks was usually related with community irrigation, similar to the Mormons communities who was the pioneers of large scale irrigation in the American West (Bakken, 2011). Most of irrigated acres under incorporated mutual organization are in Colorado, Idaho, and Utah (Table 2), often with Mormon origins. The Burlington Ditch, Reservoir & Land Company is an example of mutual irrigation organization
14
which has operated since 1885 and became part of history of Adams and Weld Counties, Colorado (Burlington Ditch Reservoir & Land Company, 2011). Acres irrigated under incorporated mutual organizations increased significantly during 1940-1978, from 5.7 million acres in 1940 to 7.0 million acres in 1978, but the number of irrigation organizations decreased over time with 2,431 organization in 1978 (Table 3). In total, incorporated mutual organizations were responsible to deliver water for about 16% of total acres irrigated in the Western States in 1978 (Table 2).
Commercial organizations began involvement in irrigation development when irrigation based communities became more popular and continued as a common feature of many settlements in the American West (Bakken, 2011), especially after the Carey Act, the Federal law in 1894 that allowed private companies to profit from sales of water (Roberts, 2016). The commercial irrigation company was one of the earliest corporate institutions that started to build large irrigation projects in the American West (Bretsen and Jill, 2007). Most commercial irrigation organizations were controlled by owners and usually are profit oriented. In this type of organization, irrigation services were an incidental function and not the main purpose of the organization (United States Department of Agriculture, 1982). In the late of 19th century, many private or corporate entities were land developers, who held an appropriative water right, that mostly looked for profit from land sales and they used irrigation networks to help sell land to settlers (Hutchins, 1929). A large block of land, later divided into several parcels, was installed with irrigation networks and then sold as new farms to settlers along with its share of water rights. The control of the irrigation system was usually transferred to the landowners where the operation and maintenance of the infrastructure was no longer the responsibility of the land developer. Another example of commercial irrigation organization was a private corporation which produces electricity from water then to landowners for irrigation. Numerous commercial irrigation companies existed by the 1880s (especially in California, Colorado, Texas and Utah) and reached their peak in 1920 when 1.6 million acres of agriculture land were irrigated by this organization type, or about 11% of total acres irrigated in the American West that year (Bretsen and Jill, 2007). The acres irrigated by these commercial networks decreased significantly during 1920-1978 and few remain. The existence of commercial irrigation companies was superseded by incorporated mutual and irrigation districts that deliver more water to more agriculture land in arid west. Commercial irrigation organizations irrigated less than 1% of total acres irrigated in the American West by 1978 (Table 2).
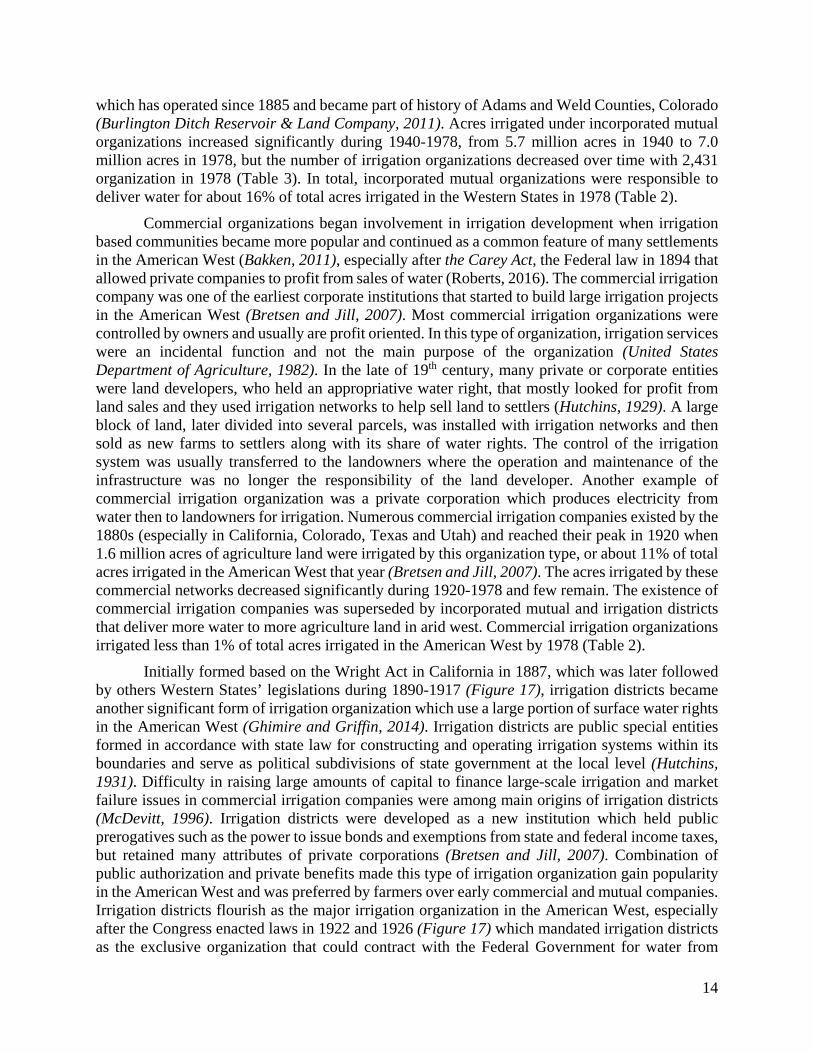
Initially formed based on the Wright Act in California in 1887, which was later followed by others Western States’ legislations during 1890-1917 (Figure 17), irrigation districts became another significant form of irrigation organization which use a large portion of surface water rights in the American West (Ghimire and Griffin, 2014). Irrigation districts are public special entities formed in accordance with state law for constructing and operating irrigation systems within its boundaries and serve as political subdivisions of state government at the local level (Hutchins, 1931). Difficulty in raising large amounts of capital to finance large-scale irrigation and market failure issues in commercial irrigation companies were among main origins of irrigation districts (McDevitt, 1996). Irrigation districts were developed as a new institution which held public prerogatives such as the power to issue bonds and exemptions from state and federal income taxes, but retained many attributes of private corporations (Bretsen and Jill, 2007). Combination of public authorization and private benefits made this type of irrigation organization gain popularity in the American West and was preferred by farmers over early commercial and mutual companies. Irrigation districts flourish as the major irrigation organization in the American West, especially after the Congress enacted laws in 1922 and 1926 (Figure 17) which mandated irrigation districts as the exclusive organization that could contract with the Federal Government for water from
15
Reclamation projects (Bakken, 2011). The opportunity to get water from Reclamation projects attracted many earlier irrigation organizations to transform into irrigation districts as mentioned in Bretsen and Jill’s paper in 2007 where 69% of 29 studied irrigation districts in the American West in 1940 began their institutional forms as mutual or commercial irrigation companies. As a result, the number of irrigation districts and the acres irrigated under this irrigation organizations increased significantly from 441 irrigation districts with 3.5 million acres irrigated in 1940 to 831 irrigation districts with 10.7 million acres irrigated in 1978 (Table 3). California, with the Federal Central Valley Project as the largest Bureau of Reclamation’s irrigation project (Austin, 2014), has the most irrigation districts and the largest acres supplied by irrigation districts. About 45% of total acres irrigated under irrigation districts in 1978 were in California (Table 2) with 225 irrigation districts, or about 30% of all irrigation districts in the American West (United States Department of Agriculture, 1982).
Figure 17. Important Timeline of Irrigation Organization’s Development in the Western States (summarized from various sources: Hutchins, 1931; Fuller, 1994; State Impact Texas, 2013; United States Bureau of Reclamation, 2015a; Roberts, 2016; The California Department of Water Resources, 2017; The Montana Department of Natural Resources and Conservation, 2017)
Other forms of irrigation organizations in the arid west come from various government agencies such as the United States Bureau of Reclamation, United States Bureau of Indian Affairs, and many water agencies from state and local government levels (United States Department of Agriculture, 1982). The United States Bureau of Reclamation, established in 1902, has constructed more than 600 dams and 8,000 miles’ irrigation canals (the United States Bureau of Reclamation, 2016a). These deliver water for 10 million acres of agricultural land, which makes the United States Bureau of Reclamation as the nation’s largest wholesale water supplier. Most of these facilities had been delegated to irrigation districts after 1940 (Table 3) where the control of the systems (operations, maintenances, personnel) was transferred to the contracting organizations but the United States Bureau of Reclamation still owns the assets. For example, the All-American Canal, built by the United States Bureau of Reclamation in 1930s, is currently operated by the Imperial Irrigation District (Imperial Irrigation District, 2017). Based on the 1978 Agricultural Census, the United States Bureau of Reclamation only operated several facilities, mainly in California and New Mexico (Table 2). The United States Bureau of Indian Affairs, another federal
1890
Washington
Kansas Nevada
1891
The Carey Act
1894
OregonIdaho
Nebraska
Colorado
1895
1901
Texas
1905
WyomingMontana
1907
New MexicoUtah
1909
Arizona
1912
Oklahoma
1915
South DakotaNorth Dakota
19171902
The Reclamation Act
Federal Government influences.1877: The Desert Land Act enacted to speed privatization of public land in the newly acquired Western States. 1894: The Carey Act enacted, Commercial companies can make profit from selling water.1902: The Reclamation Act enacted, the formerly Bureau of Reclamation established.1922: The Congress authorized the Bureau of Reclamation to contract directly with irrigation districts for repayment of reclamation project costs. 1926: The Congress mandated that irrigation districts as the only form of irrigation organization that could contract with the federal government for cost payment.
1877
The DesertLand Act
California
1887
Farmers influences. 1847: The Mormons arrived in Salt Lake City. Pioneered in irrigation communities (unincorporated & incorporated mutual)
State Government influences.1887‐1917: The year of enactment of the original irrigation district laws.1937. Montana’s first water projects.1957. California’s state water projects.1961. Texas’ first state water projects.
1847
The first modern irrigation‐based
economy established
1922
The Congress’ Decision
1926
The Congress’ Decision
Montana State Water Projects
1937
California State Water Projects
1957
Texas State Water Projects
1961
16
agency, provides water to over 780,000 acres of land in the Western States, for Indian Reservations (the United Bureau of Indian Affairs, 2017). Most of these irrigated areas were in Arizona, Montana and Washington (Table 2). These areas slightly increased from 0.52 million acres in 1940 to 0.66 million acres in 1978 (Table 3) and then became 0.78 million acres in 2017 (the United Bureau of Indian Affairs, 2017). Several state and local government agencies, mainly California, Montana and Texas, also are involved in irrigation projects (Table 2) but at smaller scales. These other government agencies, in total, irrigate about 1 million acres’ land or about 3% of total acres irrigated in the Western States in 1978 (Table 2).
FINANCING ON IRRIGATION SERVICES
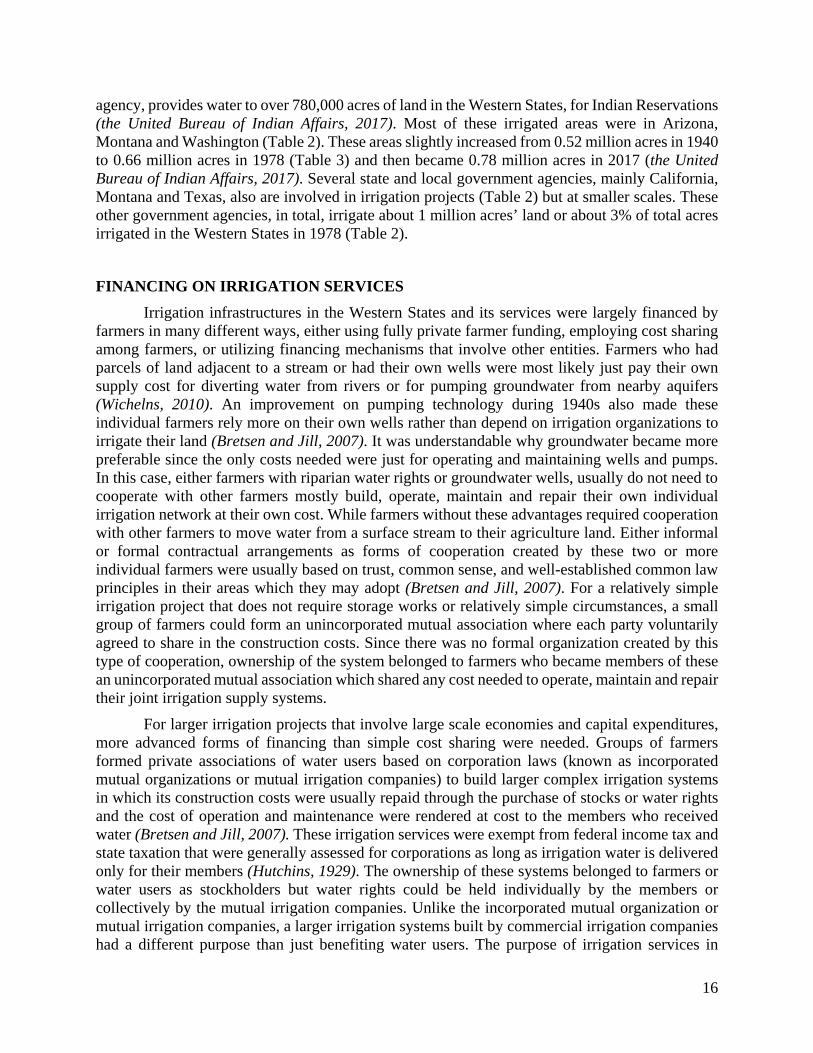
Irrigation infrastructures in the Western States and its services were largely financed by farmers in many different ways, either using fully private farmer funding, employing cost sharing among farmers, or utilizing financing mechanisms that involve other entities. Farmers who had parcels of land adjacent to a stream or had their own wells were most likely just pay their own supply cost for diverting water from rivers or for pumping groundwater from nearby aquifers (Wichelns, 2010). An improvement on pumping technology during 1940s also made these individual farmers rely more on their own wells rather than depend on irrigation organizations to irrigate their land (Bretsen and Jill, 2007). It was understandable why groundwater became more preferable since the only costs needed were just for operating and maintaining wells and pumps. In this case, either farmers with riparian water rights or groundwater wells, usually do not need to cooperate with other farmers mostly build, operate, maintain and repair their own individual irrigation network at their own cost. While farmers without these advantages required cooperation with other farmers to move water from a surface stream to their agriculture land. Either informal or formal contractual arrangements as forms of cooperation created by these two or more individual farmers were usually based on trust, common sense, and well-established common law principles in their areas which they may adopt (Bretsen and Jill, 2007). For a relatively simple irrigation project that does not require storage works or relatively simple circumstances, a small group of farmers could form an unincorporated mutual association where each party voluntarily agreed to share in the construction costs. Since there was no formal organization created by this type of cooperation, ownership of the system belonged to farmers who became members of these an unincorporated mutual association which shared any cost needed to operate, maintain and repair their joint irrigation supply systems.
For larger irrigation projects that involve large scale economies and capital expenditures, more advanced forms of financing than simple cost sharing were needed. Groups of farmers formed private associations of water users based on corporation laws (known as incorporated mutual organizations or mutual irrigation companies) to build larger complex irrigation systems in which its construction costs were usually repaid through the purchase of stocks or water rights and the cost of operation and maintenance were rendered at cost to the members who received water (Bretsen and Jill, 2007). These irrigation services were exempt from federal income tax and state taxation that were generally assessed for corporations as long as irrigation water is delivered only for their members (Hutchins, 1929). The ownership of these systems belonged to farmers or water users as stockholders but water rights could be held individually by the members or collectively by the mutual irrigation companies. Unlike the incorporated mutual organization or mutual irrigation companies, a larger irrigation systems built by commercial irrigation companies had a different purpose than just benefiting water users. The purpose of irrigation services in
17
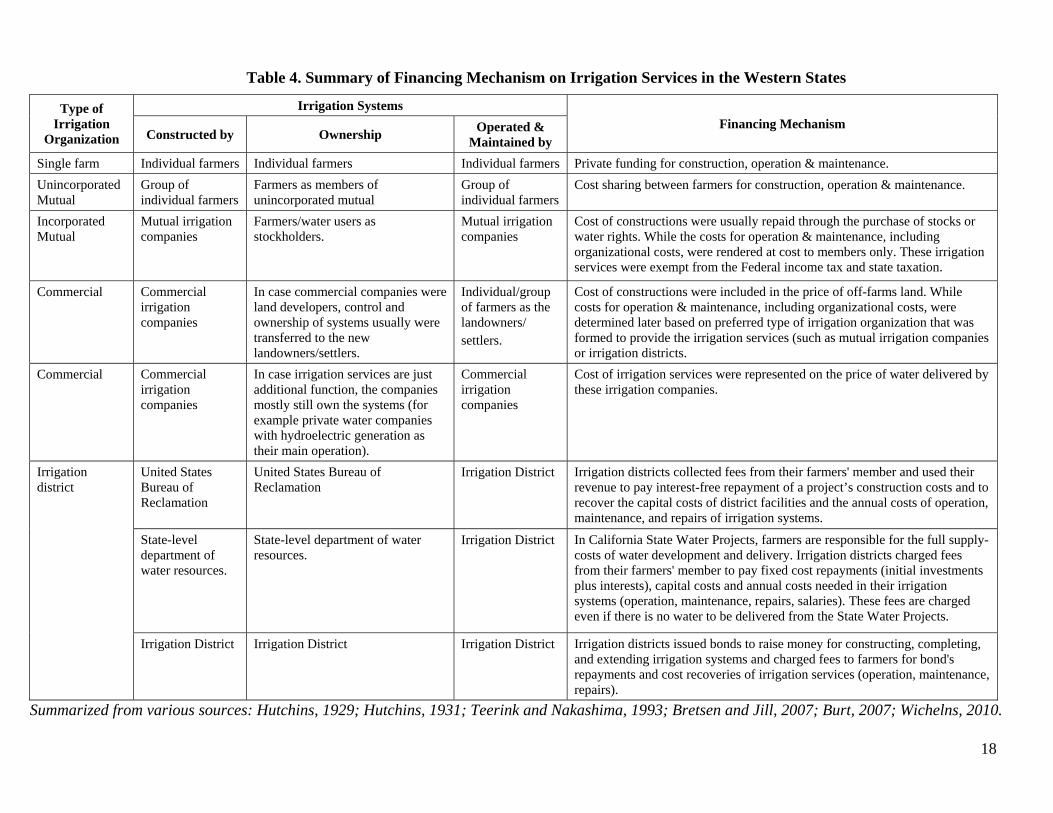
commercial irrigation companies was to provide a profit for shareholders who made speculation investments on land development (Bretsen and Jill, 2007). Where the commercial irrigation companies were land developers, the construction costs of irrigation infrastructures for large block of land were included in the price of subdivided farms sold by the companies as the entities which also held appropriative water rights (Hutchins, 1929). Control and ownership of the irrigation systems were usually transferred to the new landowners which then operated and maintained the services using their preferred type of irrigation organization, either forming incorporated mutual organizations or irrigation districts. Another case where the commercial irrigation companies were not land developers is shown in Table 4.
Financing mechanisms for irrigation services under irrigation districts were more complex and slightly different the previous types of irrigation organizations. Rather than just including farmers as water users and irrigation organizations as water suppliers, financing in irrigation districts involved at least three parties: farmers, irrigation districts as representatives of water users’ associations, and federal or state agencies as constructors of large-scale irrigation projects in many areas of the Western States. Farmers, who are members of irrigation districts, usually do not make agreements with or give their payments to parties who build irrigation infrastructures like farmers in the mutual irrigation companies or commercial irrigation companies. Instead of paying directly to the Bureau of Reclamation or state-level department of water resources, money needed to repay project construction costs or capital costs and annual costs for operating (including salaries), maintaining, and repairing the irrigation systems (Teerink and Nakashima, 1993). Most of these payments, especially which were under the Reclamation Projects, were also affected by federal financial subsidies that allow farmers to get interest-free repayment of a project’s construction costs and reduced repayment obligation based on ability to pay and other consideration such as economic hardship, unproductive lands, or drought (United States General Accounting Office, 1996). In some circumstances, the federal government also can cancel some of farmers’ repayment obligations and shifts them to other beneficiaries (Wichelns, 2010). Tualatin Irrigation Project in Oregon is an example where the 81% of the allocated costs was shifted to commercial users which receive electricity generated by the projects since farmers could only repay $ 5.9 million of the $ 31.5 million’s construction costs allocated to irrigation (United States General Accounting Office, 1996).
Prices and costs of irrigation water in the Western States are largely affected by geographic location, availability and accessibility of water, and institutional arrangements adopted in each region. Farmers in Washington or Oregon might spend less for water than farmers in California or Texas. Farmers with riparian water rights could have low cost of irrigation water due to their location near water. While farmers with appropriative water rights might need to spend more on irrigation infrastructure or pumping costs, if there are nearby aquifers, to get their water. Farmers in irrigation districts that have contracts to receive water from the Reclamation Projects, also enjoy low costs of irrigation water due to economies of scale and federal subsidies from interest-free repayment of project construction costs and flexible repayments which consider farmers’ ability to pay (United States Department of Justice, 2015). These advantages were hardly found in any irrigation projects with mutual irrigation companies, commercial irrigation companies or even with other governmental irrigation projects, such as the California State Water Projects where farmers must pay fixed cost repayments for (initial investments plus interest) and the annual costs of operation and maintenance even if there is no water available to be delivered (Teerink and Nakashima, 1993). As a comparison, farmers with riparian water rights or contracts under the Re-
18
Table 4. Summary of Financing Mechanism on Irrigation Services in the Western States
Type of Irrigation
Organization
Irrigation Systems Financing Mechanism
Constructed by Ownership Operated &
Maintained by
Single farm Individual farmers Individual farmers Individual farmers Private funding for construction, operation & maintenance.
Unincorporated Mutual
Group of individual farmers
Farmers as members of unincorporated mutual
Group of individual farmers
Cost sharing between farmers for construction, operation & maintenance.
Incorporated Mutual
Mutual irrigation companies
Farmers/water users as stockholders.
Mutual irrigation companies
Cost of constructions were usually repaid through the purchase of stocks or water rights. While the costs for operation & maintenance, including organizational costs, were rendered at cost to members only. These irrigation services were exempt from the Federal income tax and state taxation.
Commercial Commercial irrigation companies
In case commercial companies were land developers, control and ownership of systems usually were transferred to the new landowners/settlers.
Individual/group of farmers as the landowners/ settlers.
Cost of constructions were included in the price of off-farms land. While costs for operation & maintenance, including organizational costs, were determined later based on preferred type of irrigation organization that was formed to provide the irrigation services (such as mutual irrigation companies or irrigation districts.
Commercial Commercial irrigation companies
In case irrigation services are just additional function, the companies mostly still own the systems (for example private water companies with hydroelectric generation as their main operation).
Commercial irrigation companies
Cost of irrigation services were represented on the price of water delivered by these irrigation companies.
Irrigation district
United States Bureau of Reclamation
United States Bureau of Reclamation
Irrigation District Irrigation districts collected fees from their farmers' member and used their revenue to pay interest-free repayment of a project’s construction costs and to recover the capital costs of district facilities and the annual costs of operation, maintenance, and repairs of irrigation systems.
State-level department of water resources.
State-level department of water resources.
Irrigation District In California State Water Projects, farmers are responsible for the full supply-costs of water development and delivery. Irrigation districts charged fees from their farmers' member to pay fixed cost repayments (initial investments plus interests), capital costs and annual costs needed in their irrigation systems (operation, maintenance, repairs, salaries). These fees are charged even if there is no water to be delivered from the State Water Projects.
Irrigation District Irrigation District Irrigation District Irrigation districts issued bonds to raise money for constructing, completing, and extending irrigation systems and charged fees to farmers for bond's repayments and cost recoveries of irrigation services (operation, maintenance, repairs).
Summarized from various sources: Hutchins, 1929; Hutchins, 1931; Teerink and Nakashima, 1993; Bretsen and Jill, 2007; Burt, 2007; Wichelns, 2010.
19
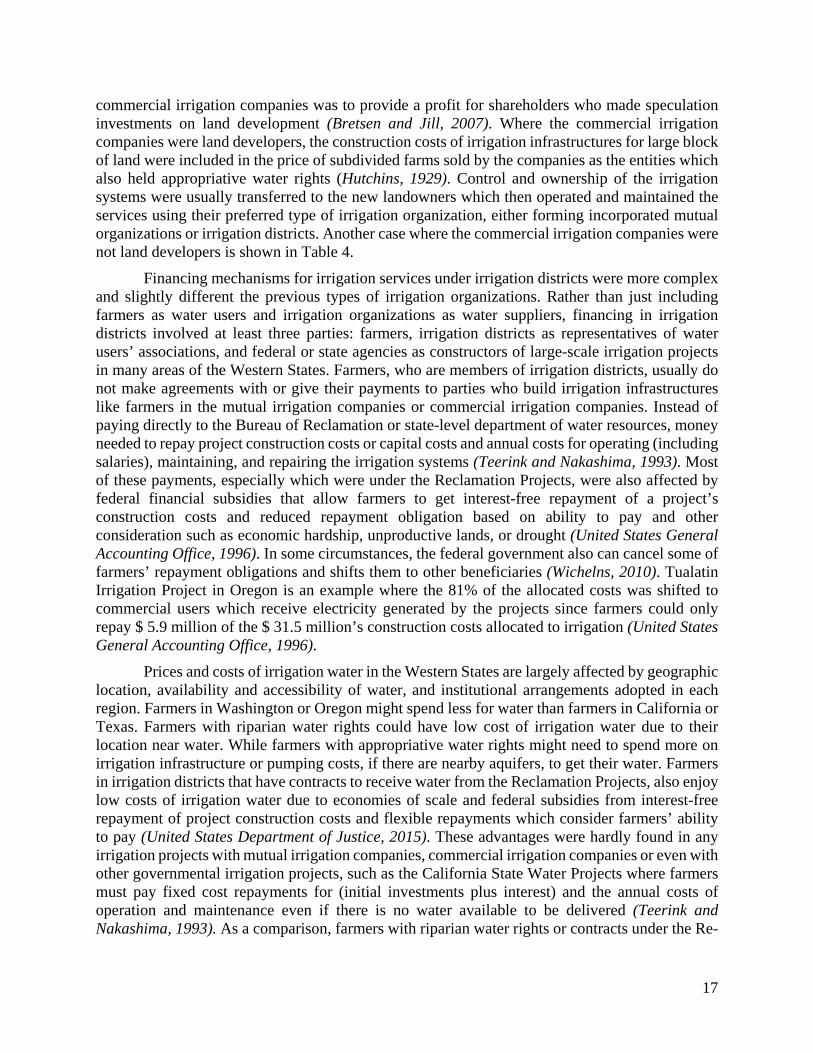
clamation Projects could get their water for very low cost ($ 5 - $ 10 per 1,000 m3) while other farmers with different type of delivery water’s contracts could pay from $ 20 to $ 100 per 1,000 m3 (Wichelns, 2010). In average, farmers in California, Kansas, Nebraska, and New Mexico paid the most expensive price of water from off-farm suppliers (more than $ 40 per acre-foot) in 2013 while farmers in Oklahoma and Wyoming paid the lowest price, less than $ 10 per acre-foot (Table 5). Farmers in California, together with Arizona, also spent more for extracting ground water in the same year (more than $ 120 per acre water from wells) than any other western states (Table 5).
Table 5. Expenses for Irrigation Water 2013 by Water Source
States Off-Farm Suppliers On-Farm Pumping
Total Cost ($1,000)
Average Cost Total Cost($1,000)
Expenses per acre1 Per Acre ($) Per Acre- Foot ($) Water from wells ($) Surface water ($)
1 Arizona 63,322 132.39 29.43 42,674 126.12 22.36
2 California 480,932 132.51 45.59 631,515 127.51 47.28
3 Colorado 17,796 29.83 16.96 77,386 71.26 20.63
4 Idaho 35,326 31.80 17.65 180,959 72.08 46.57
5 Kansas 1,119 36.21 47.16 166,176 56.73 26.64
6 Oklahoma 334 7.47 8.76 22,160 51.99 16.92
7 Montana 11,755 13.89 10.98 19,138 28.91 17.08
8 Nebraska 18,078 42.91 42.19 405,034 48.39 25.32
9 Nevada 2,869 28.10 13.60 31,674 83.51 25.86
10 New Mexico 4,583 49.99 41.46 41,953 80.74 37.34
11 North Dakota 814 29.94 38.85 5,914 28.85 25.19
12 Oregon 20,194 41.79 20.18 53,003 49.38 46.11
13 South Dakota 1,285 22.58 16.80 8,841 26.28 23.93
14 Texas 14,215 46.84 31.05 327,390 75.73 38.16
15 Utah 14,305 26.72 13.34 23,445 56.45 19.09
16 Washington 47,545 71.35 32.01 93,964 76.05 52.16
17 Wyoming 7,428 13.08 8.14 16,470 50.06 18.11
17 Western States 741,900 2,147,696 The United States 764,367 2,669,965
Source: United States Department of Agriculture: 2013 Farm and Ranch Irrigation Survey, 2014a. Note: 1 For operations with only acres in the open.
CHALLENGES IN IRRIGATION MANAGEMENT
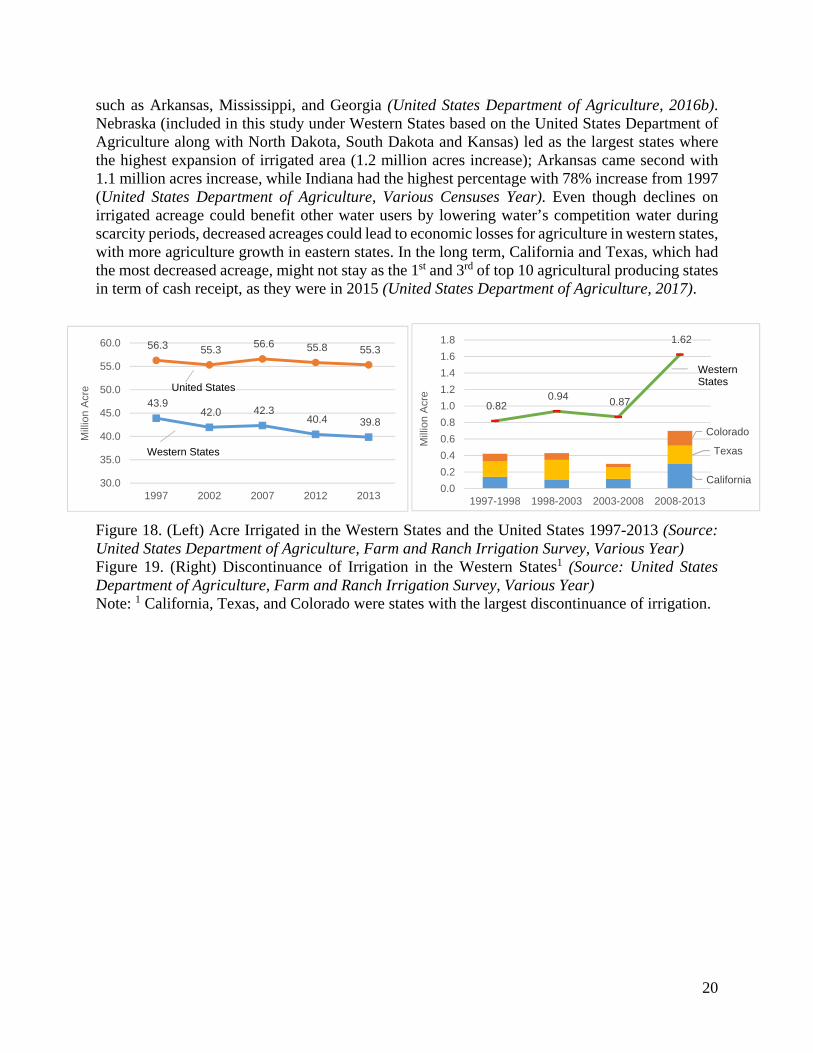
Irrigated land across the United States has decreased by nearly one million acres during 1997-2013 with surprisingly 4 million acres decline in the Western States (Figure 18 and Table 6). Most of the decrease areas occurred across the region where water scarcity occurred due to drought conditions (United States Department of Agriculture, 2016b). All western states, especially in West and South (geographic region defined by United States Census Bureau), shared the same decline while the others in Midwest experienced the opposite. California, Colorado and Texas had the most decreased acreage with more than 3.5 million acres lost (combined) while others experienced up to 20% decreases (Table 6). These trends, to some point, showed that agriculture slowly shifted to more humid areas in the eastern part of country, reflected by increasing irrigated acreage in all states in Midwest and many states in the Mississippi Delta and Southeast regions
20
such as Arkansas, Mississippi, and Georgia (United States Department of Agriculture, 2016b). Nebraska (included in this study under Western States based on the United States Department of Agriculture along with North Dakota, South Dakota and Kansas) led as the largest states where the highest expansion of irrigated area (1.2 million acres increase); Arkansas came second with 1.1 million acres increase, while Indiana had the highest percentage with 78% increase from 1997 (United States Department of Agriculture, Various Censuses Year). Even though declines on irrigated acreage could benefit other water users by lowering water’s competition water during scarcity periods, decreased acreages could lead to economic losses for agriculture in western states, with more agriculture growth in eastern states. In the long term, California and Texas, which had the most decreased acreage, might not stay as the 1st and 3rd of top 10 agricultural producing states in term of cash receipt, as they were in 2015 (United States Department of Agriculture, 2017).
Figure 18. (Left) Acre Irrigated in the Western States and the United States 1997-2013 (Source: United States Department of Agriculture, Farm and Ranch Irrigation Survey, Various Year) Figure 19. (Right) Discontinuance of Irrigation in the Western States1 (Source: United States Department of Agriculture, Farm and Ranch Irrigation Survey, Various Year) Note: 1 California, Texas, and Colorado were states with the largest discontinuance of irrigation.
43.9 42.0 42.3
40.4 39.8
56.3 55.3 56.6 55.8 55.3
30.0
35.0
40.0
45.0
50.0
55.0
60.0
1997 2002 2007 2012 2013
Mill
ion
Acr
e
California
Texas
Colorado
0.82 0.94 0.87
1.62
0.0
0.2
0.4
0.6
0.8
1.0
1.2
1.4
1.6
1.8
1997-1998 1998-2003 2003-2008 2008-2013
Mill
ion
Acr
e
Western States
Western States
United States
21
Table 6. Acres Irrigated in the Western States 1997-2013
States Acres Irrigated
1997-2013 1997 2002 2007 2012 2013
1 Arizona 1,075,336 931,735 876,158 880,613 851,407 (223,929)
2 California 8,886,693 8,709,353 8,016,159 7,861,964 7,543,928 (1,342,765)
3 Colorado 3,374,233 2,590,654 2,867,957 2,516,785 2,309,178 (1,065,055)
4 Idaho 3,543,805 3,288,522 3,299,889 3,365,292 3,511,751 (32,054)
5 Kansas1 2,695,816 2,678,277 2,762,748 2,881,292 2,851,085 155,269
6 Montana 2,101,548 1,976,111 2,013,167 1,903,019 1,872,286 (229,262)
7 Nebraska1 7,065,556 7,625,170 8,558,559 8,296,573 8,297,457 1,231,901
8 Nevada 763,742 746,653 691,030 687,790 689,953 (73,789)
9 New Mexico 851,735 844,799 830,048 680,318 694,571 (157,164)
10 North Dakota1 183,004 202,817 236,138 218,407 213,686 30,682
11 Oklahoma 509,109 517,553 534,768 479,750 426,296 (82,813)
12 Oregon 1,963,478 1,907,627 1,845,194 1,629,735 1,553,034 (410,444)
13 South Dakota1 367,195 401,083 373,842 378,678 369,802 2,607
14 Texas 5,764,295 5,074,638 5,010,416 4,489,163 4,489,837 (1,274,458)
15 Utah 1,218,474 1,091,011 1,134,144 1,104,257 1,124,729 (93,745)
16 Washington 1,787,120 1,823,155 1,735,917 1,633,571 1,623,123 (163,997)
17 Wyoming 1,749,908 1,541,688 1,550,723 1,435,710 1,418,272 (331,636)
Total 17 Western States 43,901,047 41,950,846 42,336,857 40,442,917 39,840,395 (4,060,652)
Source: United States Department of Agriculture: Farm and Ranch Irrigation Survey, Various Years. Note: 1 Kansas, Nebraska, North Dakota and South Dakota and other Midwest2 States (Illinois,
Indiana, Iowa Kansas, Michigan, Missouri, Ohio, Wisconsin) experienced increasing in acres irrigated 1997-2013.
2 One of the four geographic regions (West, South, Midwest, Northeast) defined by the United States Census Bureau which is different from two geographic regions (Western, Eastern) defined by the United States Department of Agriculture.
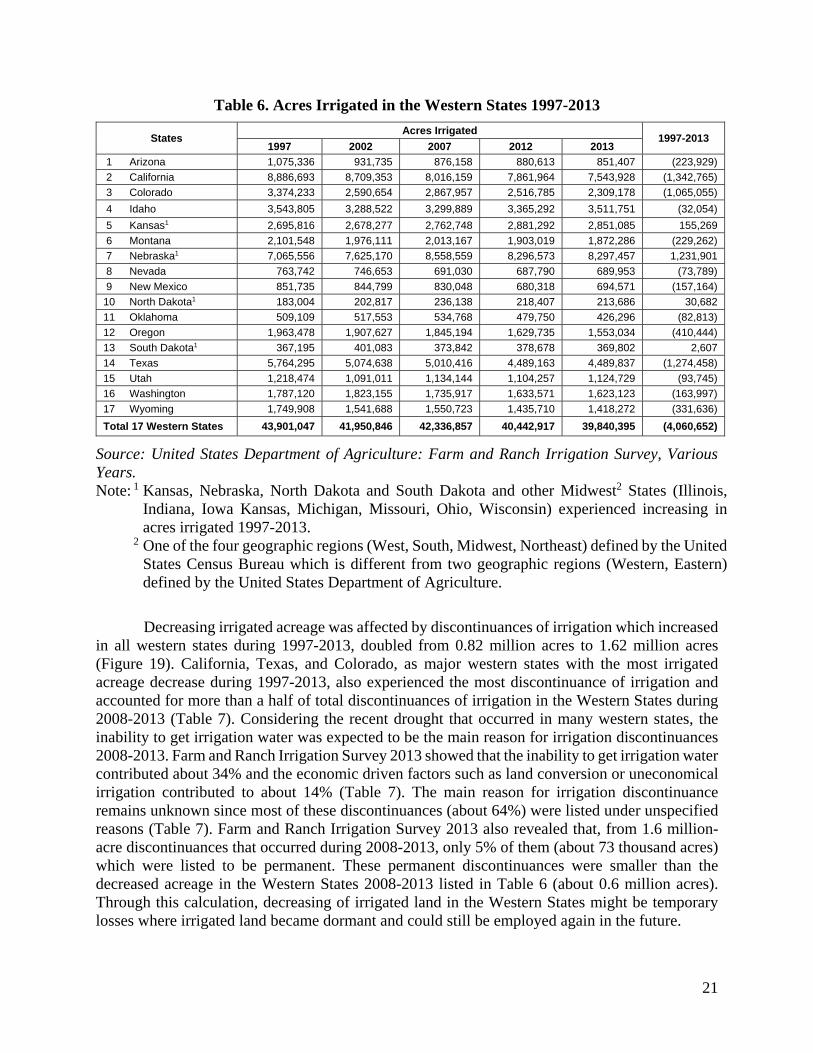
Decreasing irrigated acreage was affected by discontinuances of irrigation which increased in all western states during 1997-2013, doubled from 0.82 million acres to 1.62 million acres (Figure 19). California, Texas, and Colorado, as major western states with the most irrigated acreage decrease during 1997-2013, also experienced the most discontinuance of irrigation and accounted for more than a half of total discontinuances of irrigation in the Western States during 2008-2013 (Table 7). Considering the recent drought that occurred in many western states, the inability to get irrigation water was expected to be the main reason for irrigation discontinuances 2008-2013. Farm and Ranch Irrigation Survey 2013 showed that the inability to get irrigation water contributed about 34% and the economic driven factors such as land conversion or uneconomical irrigation contributed to about 14% (Table 7). The main reason for irrigation discontinuance remains unknown since most of these discontinuances (about 64%) were listed under unspecified reasons (Table 7). Farm and Ranch Irrigation Survey 2013 also revealed that, from 1.6 million-acre discontinuances that occurred during 2008-2013, only 5% of them (about 73 thousand acres) which were listed to be permanent. These permanent discontinuances were smaller than the decreased acreage in the Western States 2008-2013 listed in Table 6 (about 0.6 million acres). Through this calculation, decreasing of irrigated land in the Western States might be temporary losses where irrigated land became dormant and could still be employed again in the future.
22
Table 7. Discontinuance of Irrigation in the Western States in 2013
Source: Modified from Table 27 of the 2012 Census of Agriculture: Farm and Ranch Irrigation Survey 2013 (United States Department of Agriculture, 2014)
Note. 1 Since previous census year (2008). 2 Respondents could choose more than one reason for not irrigating. 3 This category is for any discontinuance reason that was not specified on the Agriculture Census’ report form
23
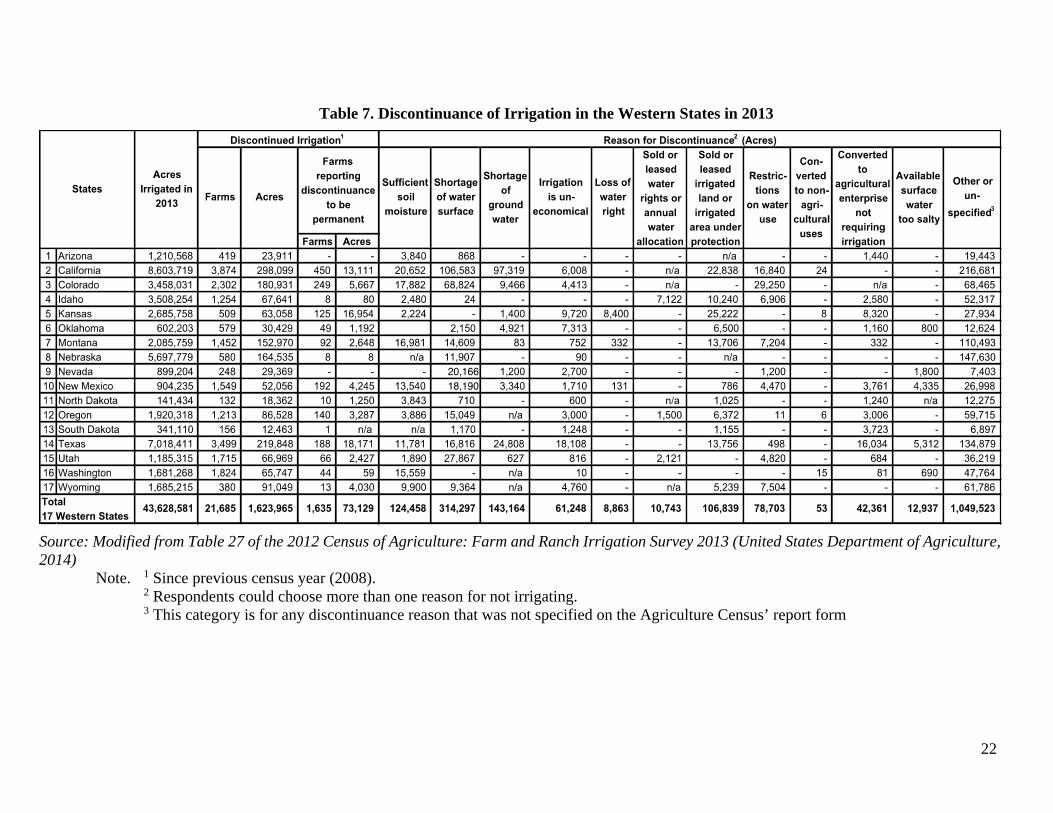
Beside the high rate of discontinuances of irrigation, farmers in the Western States are also facing the rising cost of irrigation water over the last few decades. The cost of irrigation water from off-farm suppliers such as federal/state government agencies, irrigation districts, and mutual irrigation companies has gradually increased since 1979. California has been consistent as the most expensive state for irrigation water in the Western States. The cost of irrigation water from off-farm suppliers in California was up to four times higher than any other western states. The average cost per acre irrigated in California ramped up from below $40 in 1979 to more than $140 in 2008 (but surprisingly decreased about $10 in 2013), while the other western states experienced more steady increases during 1979-2013 (Figure 20). Since most of those off-farm suppliers, unincorporated mutual, mutual irrigation companies, irrigation districts, the bureau of reclamation, which covered almost a half of total acre irrigated in the Western States (Table 2), are not supposed to profit from sales of water, the rising cost of irrigation water could be affected by greater costs of irrigation services such as operation and maintenance. [Costs for irrigation services in unincorporated mutual and incorporated mutual organizations were rendered at cost to their member who received the benefit of irrigation services. The biggest cost component of water supply from irrigation districts was repayment of Reclamation Project’s cost which was free from interest. – Refer back to “Financing in Irrigation Services” (Table 4)]. Expenses for maintenance and repairs of irrigation per acre irrigated in the most irrigated Western States did increase 1.9-3.9 times during 1979-2008 (Figure 21). It costed more than $35 per acre irrigated in California and varied around $8 to $25 in other western-most irrigated states in 2008 (Figure 21).
Figure 20. (Left) Average Cost Per Acre1 Irrigated from Off-Farm Water Suppliers in Six Most Irrigated States2 in the Western States (Source: United States Department of Agriculture, Farm and Ranch Irrigation Survey, Various Census Years). Figure 21. (Right) Expenses for Maintenance and Repairs of Irrigation Equipment and Facilities3 Per Acre Irrigated in Six Most Irrigated States2 in the Western States (Source: United States Department of Agriculture, Farm and Ranch Irrigation Survey, Various Census Years). Note: 1 Average costs per acre foot of water were not listed in the earlier censuses.
2 Accounted for more than 70% of total irrigated land in the Western States in 2013. 3 This category was not available on Farm and Ranch Irrigation Survey 2013.
California
Idaho
NebraskaTexas
Kansas
Colorado -
20.0
40.0
60.0
80.0
100.0
120.0
140.0
160.0
197
9
198
4
198
8
199
4
199
8
200
3
200
8
201
3
US
D
California
Idaho
Nebraska
Texas
Kansas
Colorado
0.0
5.0
10.0
15.0
20.0
25.0
30.0
35.0
40.0
197
9
198
4
198
8
199
4
199
8
200
3
200
8
US
D
24
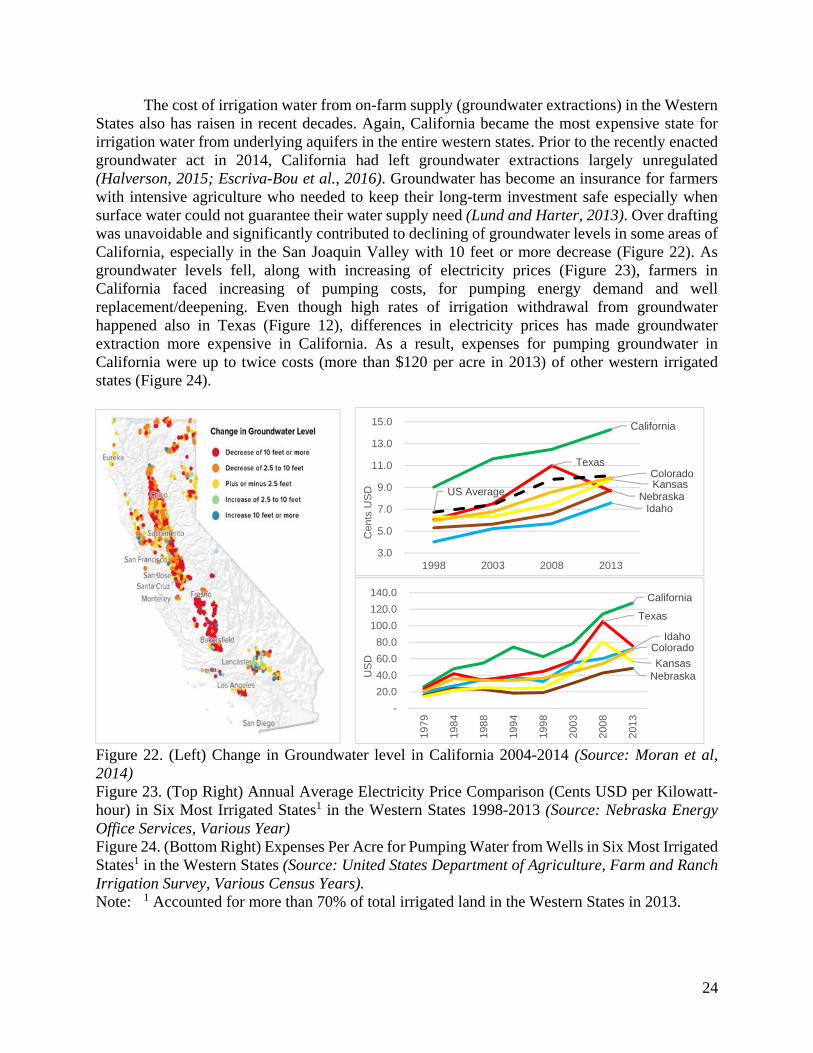
The cost of irrigation water from on-farm supply (groundwater extractions) in the Western States also has raisen in recent decades. Again, California became the most expensive state for irrigation water from underlying aquifers in the entire western states. Prior to the recently enacted groundwater act in 2014, California had left groundwater extractions largely unregulated (Halverson, 2015; Escriva-Bou et al., 2016). Groundwater has become an insurance for farmers with intensive agriculture who needed to keep their long-term investment safe especially when surface water could not guarantee their water supply need (Lund and Harter, 2013). Over drafting was unavoidable and significantly contributed to declining of groundwater levels in some areas of California, especially in the San Joaquin Valley with 10 feet or more decrease (Figure 22). As groundwater levels fell, along with increasing of electricity prices (Figure 23), farmers in California faced increasing of pumping costs, for pumping energy demand and well replacement/deepening. Even though high rates of irrigation withdrawal from groundwater happened also in Texas (Figure 12), differences in electricity prices has made groundwater extraction more expensive in California. As a result, expenses for pumping groundwater in California were up to twice costs (more than $120 per acre in 2013) of other western irrigated states (Figure 24).
Figure 22. (Left) Change in Groundwater level in California 2004-2014 (Source: Moran et al, 2014) Figure 23. (Top Right) Annual Average Electricity Price Comparison (Cents USD per Kilowatt-hour) in Six Most Irrigated States1 in the Western States 1998-2013 (Source: Nebraska Energy Office Services, Various Year) Figure 24. (Bottom Right) Expenses Per Acre for Pumping Water from Wells in Six Most Irrigated States1 in the Western States (Source: United States Department of Agriculture, Farm and Ranch Irrigation Survey, Various Census Years). Note: 1 Accounted for more than 70% of total irrigated land in the Western States in 2013.
California
IdahoNebraska
Texas
KansasColorado
US Average
3.0
5.0
7.0
9.0
11.0
13.0
15.0
1998 2003 2008 2013
Cen
ts U
SD
California
Idaho
Nebraska
Texas
Kansas
Colorado
-
20.0
40.0
60.0
80.0
100.0
120.0
140.0
197
9
198
4
198
8
199
4
199
8
200
3
200
8
201
3
US
D
25
PROMISING FUTURE DIRECTION
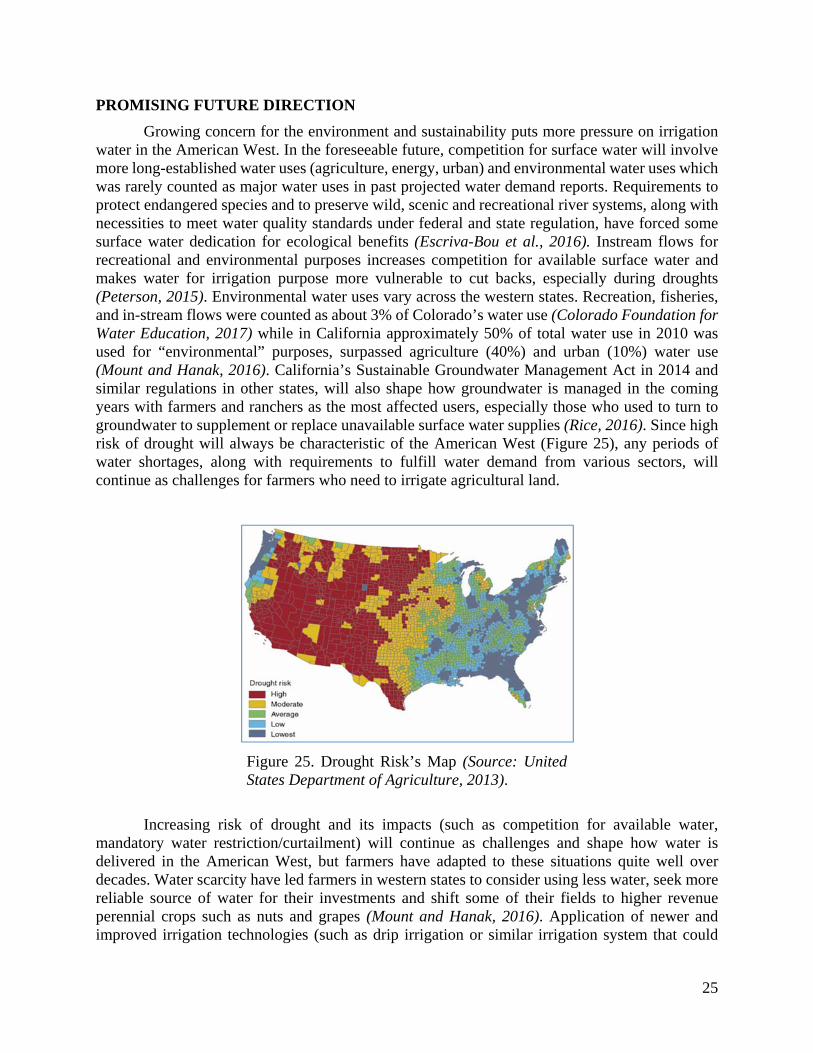
Growing concern for the environment and sustainability puts more pressure on irrigation water in the American West. In the foreseeable future, competition for surface water will involve more long-established water uses (agriculture, energy, urban) and environmental water uses which was rarely counted as major water uses in past projected water demand reports. Requirements to protect endangered species and to preserve wild, scenic and recreational river systems, along with necessities to meet water quality standards under federal and state regulation, have forced some surface water dedication for ecological benefits (Escriva-Bou et al., 2016). Instream flows for recreational and environmental purposes increases competition for available surface water and makes water for irrigation purpose more vulnerable to cut backs, especially during droughts (Peterson, 2015). Environmental water uses vary across the western states. Recreation, fisheries, and in-stream flows were counted as about 3% of Colorado’s water use (Colorado Foundation for Water Education, 2017) while in California approximately 50% of total water use in 2010 was used for “environmental” purposes, surpassed agriculture (40%) and urban (10%) water use (Mount and Hanak, 2016). California’s Sustainable Groundwater Management Act in 2014 and similar regulations in other states, will also shape how groundwater is managed in the coming years with farmers and ranchers as the most affected users, especially those who used to turn to groundwater to supplement or replace unavailable surface water supplies (Rice, 2016). Since high risk of drought will always be characteristic of the American West (Figure 25), any periods of water shortages, along with requirements to fulfill water demand from various sectors, will continue as challenges for farmers who need to irrigate agricultural land.
Figure 25. Drought Risk’s Map (Source: United States Department of Agriculture, 2013).
Increasing risk of drought and its impacts (such as competition for available water, mandatory water restriction/curtailment) will continue as challenges and shape how water is delivered in the American West, but farmers have adapted to these situations quite well over decades. Water scarcity have led farmers in western states to consider using less water, seek more reliable source of water for their investments and shift some of their fields to higher revenue perennial crops such as nuts and grapes (Mount and Hanak, 2016). Application of newer and improved irrigation technologies (such as drip irrigation or similar irrigation system that could
26
deliver water directly to the root zone) is expected for agriculture, especially for in high value crops (such as almonds that involves long term investments), not only as responses to drought, but also because it helps farmers improve crop yields (Peterson, 2015). Beside using temporary transfers of water from one water user to another user to meet water demand (California State Water Resources Control Board, 2017), farmers are predicted to still rely on groundwater as an alternative source of water during drought years despite increasing expenses of groundwater extraction. Recently enacted California groundwater act in 2014 could be challenges but will not discourage groundwater extractions, at least for the near future, since it takes some years for this law to be fully implemented. [Based on California Groundwater Legislation Timeline, identified critically over drafted high and medium priority basins began to be managed under a groundwater sustainability plan by January 31, 2020] Some irrigation districts also have viewed modernization of irrigation system (canals’ automation or upgrading irrigation ditches to achieve more precision on water delivery) as alternative approaches to minimize spills and to support high-tech on-farm irrigation methods (Burt and Styles, 2000), but application of this approach might be difficult in the near future because it could require massive new investments. If severe drought happens again in the future and water restriction/curtailments applied, farmers might prefer to fallow some of fields (and convert the rest to grow higher value crops) and sell their water for temporary periods.
CONCLUSIONS
History showed how irrigation has a foundational role in the development of the American West. Over centuries, irrigation infrastructure has served various purposes, from supporting Native population in central Arizona before the earliest European settlements, ensuring political hegemony during Spanish colonization, until speeding economic expansion in the beginning of 20th century. The need of irrigation water in these arid regions has triggered, not only improvement in irrigation technology, but also transformation within irrigation communities itself. While gravity-based irrigation systems were mostly used in the earliest civilizations, pressure based irrigation systems are currently common across the western states. Development of irrigation organizations, which started with co-ownership of irrigation networks (created by neighbor appropriator farmers with cost sharing) and moved largely to establishment of irrigation districts (which served most non-riparian water right farmers with more advanced financing mechanisms), also helped transformation of the American West from barren desert and low value grazing into the largest agriculture areas in the United States by expanding delivery of irrigation water across the western states.
As population grows in western states, along with increasing concern for environment and sustainability, some challenges for managing irrigation could lead to decreasing acres of irrigated land in the West, including discontinuance of irrigation, greater expenses for irrigation water, and escalating competition for water. For the last few decades, farmers with intensive agriculture have turned to groundwater when surface water could not guarantee water supply for their long-term crop investments. These practices are predicted to continue in the foreseeable future even though the California Sustainable Groundwater Management Act or similar regulations in other states have been enacted. Increasing risk of drought and experiences of severe water allocation curtailment in the past will force farmers to consider using less water. Farmers are likely to consider modernizing their irrigation systems to have more precision in water delivery to minimize spills and to improve on-farm irrigation efficiencies. Farmers also have an option to abandon some agriculture and try make money from selling their water rights during drought years.
27
REFERENCES
Arizona State Museum. (1964). “Snaketown Hohokam Defined.” Pieces of the Puzzle: New Perspectives on the Hohokam. http://www.statemuseum.arizona.edu/exhibits_events#. (November 29, 2016).
Austin, C. (2014). “The Central Valley Project.” https://mavensnotebook.com/the-notebook-file-cabinet/californias-water-systems/the-central-valley-project/. https://mavensnotebook.com, September 15, 2014. (February 25, 2017).
Bakken, G. M. (2011). “The World of American West.” Rouledge, 2011. Bretsen, S. N., Hill, P. J. (2007). “Irrigation Institution in American West.” UCLA Journal of
Environmental Law and Policy Vol. 25:283, Burlington Ditch Reservoir & Land Company. (2011). “Burlington Ditch Reservoir & Land
Company: History.” http://www.burlingtonres.com/history.htm. (February 22, 2017). Burt, C. M. (2007). “Volumetric Irrigation Water Pricing Consideration.” Irrigation Drainage
Syst. 21:133-144. Burt, C. M., Styles, S. W. (2000). “Irrigation District Service in the Western U.S.” Journal of
Irrigation and Drainage Engineering, ASCE 126(5):279-282, 2000. California Department of Water Resources. (2017). “History of Water Development and the State
Water Projects.” http://www.water.ca.gov/swp/history.cfm, (February 27, 2017). California Groundwater. (2017). “Groundwater Legislation Timeline.”
http://groundwater.ca.gov/timeline.cfm, (March 29, 2017). California State Water Resources Control Board. (2017). “The Water Rights Process.”
http://www.waterboards.ca.gov/waterrights/board_info/water_rights_process.shtml, (March 29, 2017).
City of San Antonio. (2014). “Acequias.” http://www.sanantonio.gov/Mission-Trails/Mission-Trails-Historic-Sites/Detail-Page/ArtMID/16185/ArticleID/4230/Acequias. (December 3, 2016).
Colorado Foundation for Water Education. (2017). “Colorado’s Water Users.” https://www.yourwatercolorado.org/about-cfwe/55-water-education/water-planning-a-distribution/836-colorado-water-users, (March 28, 2017).
Crow Canyon Archeological Center. (2014). “Post Pueblo Period: Overview.” https://www.crowcanyon.org/educationproducts/peoples_mesa_verde/post_pueblo_overview.asp, (December 4, 2016)
Escriva-Bou, A., McCann, H., Hanak, E., Lund, J., Gray, B. (2016). “Accounting for California’s Water.” Public Policy Institute of California, Water Policy Center Report, July, 2016.
Food and Agriculture Organization of the United Nations. (1998). “Rural Aquaculture: Overview and Framework for Country Reviews.” Regional Office for Asia and Pasific, Bangkok, Thailand. http://www.fao.org/docrep/003/x6941e/x6941e04.htm, 1998.
Fuller, C. (1994). “The Utah History Encyclopedia: Irrigation in Utah.” The University of Utah Press, http://www.uen.org/utah_history_encyclopedia/i/IRRIGATION.html. (December 4, 2016).
Gale Research Inc. (1997). “Early Settlement of the Southwest by Spain.” http://www.encyclopedia.com/history/news-wires-white-papers-and-books/early-settlement-southwest-spain. (December 1, 2016).

28
Ghimire, N., Griffin, R. C. (2014). “The Water Transfer Effects of Alternative Irrigation Institutions.” American Journal of Agricultural Economics, April 28, 2014.
Global Agriculture. (2014). “Agriculture at Crossroads: Findings and recommendation for future farming.” http://www.globalagriculture.org/report-topics/water.html, January 22, 2017.
Harper, K. C. (1974). “The Mormon Role in Irrigation Beginnings and Diffusions in the Western States: An Historical Geography.” Department of Geography, Brigham Young University, August, 1974.
Halverson, N. (2015). “9 Sobering Facts About California’s Groundwater Problem.” https://www.revealnews.org/article/9-sobering-facts-about-californias-groundwater-problem/, (March 16, 2017).
Highland Ditch Company. (2017). “Home.” http://highlandditch.com/concrete5.4.2.2/ (February 20, 2017).
Hooton, L. W. (1999). “Pioneers of '47–Pioneer Irrigators.” http://www.slcdocs.com/utilities/NewsEvents/news1999/news7221999.htm (December 4th, 2016).
Howard, J. B. (1992). “Desert Canals: Hohokam Legacy.“ Pueblo Grande Museum Profiles No. 12. https://www.phoenix.gov/parkssite/Documents/d_048513.pdf.
Howard, J. B. (2016). “Hohokam Canals: Prehistoric Engineering.” http://arizonaexperience.org/remember/hohokam-canals-prehistoric-engineering. (December 1, 2016)
Hull, R. (2015). “Nation’s Oldest Aqueduct in Texas Still Thriving Today.” The American Society of Civil Engineers (ASCE) News, http://news.asce.org/nations-oldest-aqueduct-in-texas-still-thriving-today/, February 19, 2015.
Hutchins, W. A. (1929). “Mutual Irrigation Companies.” United States Department of Agriculture, Technical Bulletin No. 82, January 1929.
Hutchins, W. A. (1931). “Summary of Irrigation-District Statutes.” United States Department of Agriculture, Miscellaneous Publication No. 103, January 1931.
Hutchins, W. A., Ellis, H. H., DeBraal, J. P. (1971). “Water Rights Laws in the Nineteen Western States.” United States Department of Agriculture, 1971.
Imperial Irrigation District. (2017). “All American Canal.” http://www.iid.com/water/water-transportation-system/colorado-river-facilities/all-american-canal. (February 6, 2017).
Irrigation Museum. (2017). “Furrow Irrigation.” http://www.irrigationmuseum.org/item1.aspx?id=129. (February 7, 2017)
Kearney, M. S., Harris, B. H., Hersbein, B., Jacome, E., Nantz, G. (2014). “In Times of Drought: Nine Economic Facts about Water in the United States: 3. Population growth is highest in America’s driest states.” The Hamilton Project: Policy Memo, October 2014.
Kearns, F. (2016). “Changes in Irrigation Technology May Lead to Water Quality Gains.” Regents of University of California, http://ucanr.edu/blogs/blogcore/postdetail.cfm?postnum=20751 (April 11, 2016).
Library of Congress. (2016). “Shasta Dam, Shasta County, California. The dam Under Construction.” http://www.loc.gov/pictures/item/fsa2000049931/PP/. (December 5, 2016)
Lund, J., Harter, T. (2013). “California’s Groundwater Problems and Prospects.” UC Davis Center for Watershed Sciences, January 30, 2013.
29
Majumdar, D. K. (2013). “Irrigation Water Management: Principles and Practice.” PHI Learning Private Limited, Delhi, Second Editions, 2013.
McDevitt, E. P. (1996). “The Evolution of Irrigation Institutions in California: The Rise of the Irrigation District, 1910–1930.” The Journal of Economic History, Volume 56, June 1996.
Mays, W. M., (2016). “Irrigation Systems, Ancient.” Water Encyclopedia: Science and Issues. http://www.waterencyclopedia.com/Hy-La/Irrigation-Systems-Ancient.html. (November 29, 2016).
Moran, T., Choy, J., Sanchez, C. (2014). “The Hidden Costs of Groundwater Overdraft.” Water in the West, Stanford Woods Institute for Environment - The Bill Lane Center for the American West, http://waterinthewest.stanford.edu/groundwater/overdraft/, September 9, 2014.
Mount, J., Hanak, E. (2016). “Water Use in California.” Public Policy Institute of California, http://www.ppic.org/main/publication_show.asp?i=1108, July, 2016.
National Aeronautics and Space Administration. (2009). “All-American Canal.” Earth Observatory, http://earthobservatory.nasa.gov/IOTD/view.php?id=37078, February 23, 2009.
National Archives. “Land Act.” https://www.archives.gov/files/calendar/genealogy-fair/2014/handouts/session-11-handout-5of5-martinez-land-other-land-acts.pdf, (April 21, 2017).
Nebraska Energy Office Services. (Various Year). “Annual Average Electricity Price Comparison by State.” http://www.neo.ne.gov/statshtml/204.htm, (June 28, 2016). New Mexico Museum of Art. (2010). “History: The Politics of Water.”
http://online.nmartmuseum.org/nmhistory/people-places-and-politics/water/history-water.html. (December 1, 2016)
Peterson, M. (2015). “Drought: 10 Things to Know About California Water Use.” KPCC’s Environment and Science, http://www.scpr.org/news/2015/04/15/50941/10-things-to-know-about-california-water-use/, April 15, 2015.
Rice, J. (2016). “Commentary: Farmers Must Stay Engaged in Groundwater Planning.” California Farm Bureau Federation, http://www.agalert.com/story/?id=9290, February 3, 2016.
Rivera, J. A., Glick, T. F. (2002). “Iberian Origins of New Mexico’s Community Acequias.” The XIII Economic History Congress, Buenos Aires, Argentina, July 2002.
Roberts, P. (2016). “A New History of Wyoming: Chapter 13. Water and Irrigation in Wyoming.” University of Wyoming, Department of History. http://www.uwyo.edu/robertshistory/new_history_of_wyoming_chapter_13_water.htm. (December 5, 2016).
Rose, D. (2014). “The Hohokam.” http://www.arizonaruins.com/articles/hohokam/hohokam.html. (November 29, 2016).
Salt River Project. (2016). “Water in The Valley: From the Hohokam to SRP.” http://www.srpnet.com/Errors/Http404.aspx?404;https://www.srpnet.com:443/water/pdfx/ResIrrigationSpring16.pdf, Irrigation News for SRP Residential Shareholders, Spring 2016.
Selby, H. E. (1949). “The Importance of Irrigation in the Economy of the West.” Journal of Farm Economics, Vol. 31, No. 4, Part 2: Proceedings Number (Nov., 1949), pp. 955-964.
30
Siebert, S., Burke, J., Faures, J. M., Frenken, K., Hoogeveen, J., Doll, P., Portmann, F. T. (2010). “Groundwater Use for Irrigation - A Global Inventory.” Hydrology and Earth System Sciences, October 12, 2010.
Simmons, M. (1972). “Spanish Irrigation Practice in New Mexico.” New Mexico Historical Review XLVII:2, 1972.
Sojka, R. E., Bjorneberg, D.L, Entry, J.A. (2002). “Irrigation: An Historical Perspective.” Encyclopedia of Soil Science, Marcel Dekker Inc., 2002.
State Impact Texas. (2013). “A Brief History of the Texas Water Plan.” https://stateimpact.npr.org/texas/2013/05/28/a-brief-history-of-the-texas-water-plan/, May 28, 2013.
Stubbs, M. (2016). “Irrigation in U.S. Agriculture: On-Farm Technologies and Best Management Practices.” Congressional Research Service, October 17, 2016.
Teerink, J.R., Nakashima, M. (1993). “Water Allocation, Rights, and Pricing: Examples from Japan and the United States.”
The Montana Department of Natural Resources and Conservation. (2017). “Water Projects.” http://dnrc.mt.gov/divisions/water/projects, (February 27, 2017).
The Office of Technology Assessment. (1983). “Water-Related Technologies for Sustainable Agriculture in U.S. Arid/Semiarid Lands.” The United States Congress, October 1983.
United Nations Educational, Scientific and Cultural Organization. (2017). “Facts and Figures: Agriculture is the largest consumer of freshwater.” http://www.unesco.org/new/en/natural-sciences/environment/water/wwap/facts-and-figures/all-facts-wwdr3/fact2-agricultural-use/. (January 24, 2017).
United States Army Corps of Engineering. (2012). “Water in the U.S. American West: 150 Years of Adaptive Strategies.” Policy Report for the 6th World Water Forum, March 2012
United States Bureau of Indian Affairs (2017). “Branch of Irrigation and Power.” https://www.bia.gov/WhoWeAre/BIA/OTS/IPSOD/IrrigationandPower/index.htm, February 24, 2017.
United States Bureau of Reclamation (2015a). “Brief History Bureau of Reclamation.” Bureau of Reclamation History Program. August 4, 2015.
United States Bureau of Reclamation. (2015b). “Hoover Dam.” http://www.usbr.gov/lc/hooverdam/faqs/damfaqs.html. March 12, 2015.
United States Bureau of Reclamation (2015c). “Grand Coulee Dam.” http://www.usbr.gov/pn/grandcoulee/history/construction/gallery/7.html. May 4, 2015.
United States Bureau of Reclamation. (2016). “Glen Canyon Unit.” http://www.usbr.gov/uc/rm/crsp/gc/. February 3, 2016.
United States Bureau of Reclamation. (2016a). “About Us-Fact Sheet.” https://www.usbr.gov/main/about/fact.html, August 23, 2016.
United States Department of Agriculture. (1982). “1978 Census of Irrigation Organizations.” 1978 Census of Agriculture, February 1982.
United States Department of Agriculture. (2013). “The Role of Conservation Program Design in Drought-Risk Adaptation.” Economic Research Service, https://www.ers.usda.gov/amber-waves/2013/july/the-role-of-conservation-program-design-in-drought-risk-adaptation/, July 01, 2013.
31
United States Department of Agriculture. (2014). “Dairy Cattle and Milk.” 2012 Census of Agriculture Highlights, https://www.agcensus.usda.gov/Publications/2012/Online_Resources/Highlights/Dairy_Cattle_Milk_Prod/Dairy_Cattle_and_Milk_Production_Highlights.pdf, October 2014.
United States Department of Agriculture. (2014a). “2012 Census of Agriculture.” Farm and Ranch Irrigation Survey 2013, November, 2014.
United States Department of Agriculture. (2015). “Cotton and Cottonseed Farming.” 2012 Census of Agriculture Highlights, https://www.agcensus.usda.gov/Publications/2012/Online_Resources/Highlights/Cotton/Highlights_Cotton.pdf, January 2015.
United States Department of Agriculture. (2015a). “Sheep and Goat Farming.” 2012 Census of Agriculture Highlights, https://www.agcensus.usda.gov/Publications/2012/Online_Resources/Highlights/Sheep_and_Goat/Sheep_and_Goat_Farming.pdf, January 2015.
United States Department of Agriculture. (2015b). “Cattle Industry.” 2012 Census of Agriculture Highlights, https://www.agcensus.usda.gov/Publications/2012/Online_Resources/Highlights/Cattle/Cattle_Highlights.pdf, February 2015.
United States Department of Agriculture. (2015c). “Wheat Farming.” 2012 Census of Agriculture Highlights, https://www.agcensus.usda.gov/Publications/2012/Online_Resources/Highlights/Wheat%20Farming/Wheat_Farming.pdf, March 2015.
United States Department of Agriculture. (2015). “Fruits, Tree Nuts, and Berries.” 2012 Census of Agriculture Highlights, https://www.agcensus.usda.gov/Publications/2012/Online_Resources/Highlights/Fruit_Tree_Nuts_and_Berries/FruitsNutsBerries_AgCensusHighlights.pdf, October 2015.
United States Department of Agriculture. (2015e). “Vegetable Production.” 2012 Census of Agriculture Highlights, https://www.agcensus.usda.gov/Publications/2012/Online_Resources/Highlights/Vegetable/Vegetable_Production_AgCensusHighlights.pdf, October 2015.
United States Department of Agriculture. (2016). “U.S. Horticulture in 2014.” 2012 Census of Agriculture Highlights, https://www.agcensus.usda.gov/Publications/2012/Online_Resources/Highlights/Horticulture/Census_of_Horticulture_Highlights.pdf, January 2016.
United States Department of Agriculture. (2016a). “Cattle & Beef: Overview.” Economic Research Service, http://www.ers.usda.gov/topics/farm-practices-management/irrigation-water-use/background/#definitions. (October 6, 2016).
United States Department of Agriculture. (2016b). “Irrigation & Water Use: Background.” Economic Research Service, http://www.ers.usda.gov/topics/farm-practices-management/irrigation-water-use/background/#definitions. (October 12, 2016).
United States Department of Agriculture. (2017). “FAQs: Which are the top 10 agricultural producing States?” Economic Research Service, https://www.ers.usda.gov/faqs/ (January 23, 2017).

32
United States Department of Energy. (2016). “Where Hydropower is Generated.” http://www.eia.gov/energyexplained/index.cfm?page=hydropower_where. (November 14, 2016).
United States Department of Justice. (2015). “Federal Reclamation Projects.” https://www.justice.gov/enrd/federal-reclamation-projects, May 12, 2015.
United States General Accounting Office. (1996). “Bureau of Reclamation: Information on Allocation and Repayment of Costs of Constructing Water Projects.” GAO/RCED-96-109, July, 1996.
United States Geological Survey. (2014) “Summary of Estimated Water Use in the United States in 2010.” Fact Sheet 2014–3109. https://pubs.usgs.gov/fs/2014/3109/pdf/fs2014-3109.pdf. (November, 2014)
United States Geological Survey. (2014a) “Estimated Water Use in the United States in 2010.” Circular 1405, https://pubs.usgs.gov/circ/1405/pdf/circ1405.pdf, 2014.
United States Geological Survey. (2016) “Livestock Water Use.” http://water.usgs.gov/edu/wulv.html. (October 27, 2016).
United States Geological Survey. (2016a). “Irrigation Techniques.” https://water.usgs.gov/edu/irmethods.html. (December 2, 2016).
United States Geological Survey. (2016b). “Irrigation: Typical Sprinkler (Spray) Irrigation.” https://water.usgs.gov/edu/irsprayhigh.html. (December 2, 2016)
United States Geological Survey. (2016c). “Irrigation Water Use.” https://water.usgs.gov/watuse/wuir.html (December 9, 2016)
United States Geological Survey. (2016d). “Water Science Photo Gallery.” https://water.usgs.gov/edu/gallery/irrigation-sprinkler.html. (December 9, 2016)
Utah Department of Heritage and Arts. (2016). “Using Water: Irrigation.” http://ilovehistory.utah.gov/topics/water/irrigation.html. (December 4th, 2016).
Whitley, K., Letbetter, J. (2016). “Hohokam Canal System.” Arizona Heritage Waters. http://www.azheritagewaters.nau.edu/loc_hohokam.html. (December 1, 2016).
Wichelns, D. (2010). “Agricultural Water Pricing: United States.” The Organization for Economic Co-Operation and Development’s Study: Sustainable Management of Water Resources in Agriculture, 2010.
Wills, W. H., Dorshow, W. B. (2012). “Agriculture and Community in Chaco Canyon: Revisiting Pueblo Alto.” Journal of Anthropological Archaeology, Volume 31, Issue 2, June 2012, Pages 138–155.
Wozniak, F. E. (1998). “Irrigation in Rio Grande Valley, New Mexico: A Study and Annotated Bibliography of the Development of Irrigation System.” United States Department of Agriculture Forest Service, Rocky Mountain Research Station, Ft. Collins, Colorado, May 1997.
Zarr, G. (2016). “How the Middle Eastern Irrigation Ditch Called Acequia Changed the American Southwest.” AramcoWorld Vol. 67, No. 5, September/October, 2016.


![Irrigation Systems Audits in Epirus and Western …...Irrigation Systems Audits in Epirus and Western Greece WP5, Action 5.2. Deliverable 3 1 Front page back [intentionally left blank]](https://static.fdocuments.net/doc/165x107/5e4e149858e0b4661d64ce54/irrigation-systems-audits-in-epirus-and-western-irrigation-systems-audits-in.jpg)