Irrigation: making the most of your water
49
Caleb M. Carter UW Extension Educator Master Hay Grower Workshop Riverton, WY March 25, 2015 Irrigation: making the most of your water
-
Upload
caleb-m-carter -
Category
Environment
-
view
37 -
download
0
Transcript of Irrigation: making the most of your water

Caleb M. CarterUW Extension EducatorMaster Hay Grower WorkshopRiverton, WYMarch 25, 2015
Irrigation: making the most of your water

Available soil moisture
• Field Capacity• 50% Available
Water• Permanent
Wilting Point• MAD
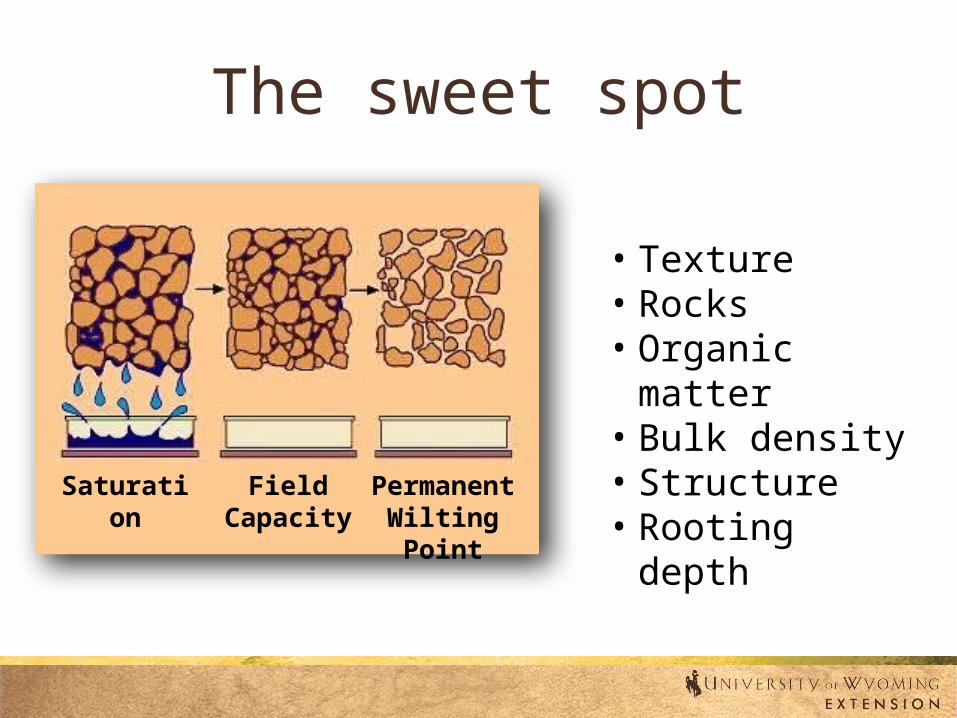
The sweet spot
Saturation Field Capacity
Permanent Wilting Point
• Texture• Rocks• Organic matter• Bulk density• Structure• Rooting depth

Effects of irrigation on infiltration
Soil Texture
Basic Infiltration Rate (in/hr)
Fine sand 0.50 – 0.75Sandy loam 0.35 – 0.5Silt loam 0.25 – 0.40Clay 0.10 – 0.20
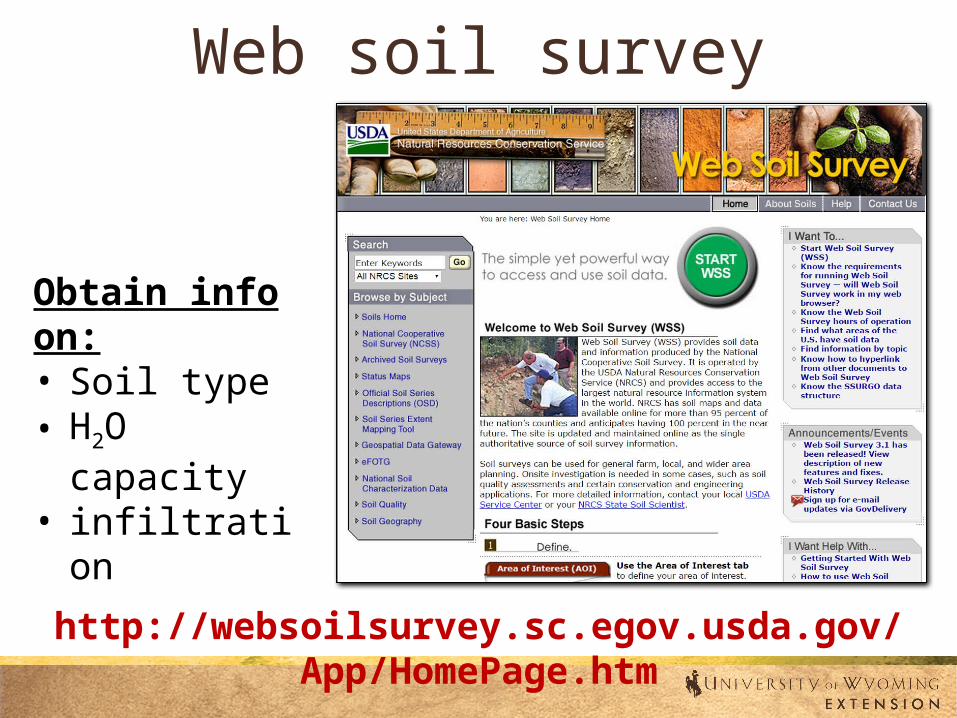
Web soil survey
Obtain info on:• Soil type• H2O capacity• infiltration
http://websoilsurvey.sc.egov.usda.gov/App/HomePage.htm

Active root zone

IRRIGATION SYSTEM CHECKUP

Potential problems in the field
• Inappropriate monitoring of systems to ensure proper operation
• Sprinkler installation or maintenance problems• Sprinkler placement that decreases uniformity
and does not provide evaporation savings that many expect
• Runoff due to inappropriate sprinkler selection or system operation
• Inadequate pressure at pivot point to provide desired flow rate and uniformity
• System capacity is not appropriate

Pivot characteristicsSpan
Span end (ft)
Area within the span (acres)
Discharge from span (gpm)
1 180 2 14
2 360 7 42
3 540 12 71
4 720 16 99
5 900 21 127
6 1080 26 156
7 1260 30 184
OH 1310 9 56
Total 124 750
7 x 180 ft. spans
Span1 2 3 4 5 6 7

Pivot efficiency
Good uniformity

Pivot efficiency
Poor uniformity

Pivot efficiency
Different soils?

Need to know
• Depth per circle• Uniformity of application• Pressure/flow monitoring• Pump/pivot interaction• Managing limited capacity• Control runoff• Select appropriate sprinkler
packages

How much water are you applying?
System capacity (gpm/ac)
System flow rate for land acres of:
Depth applied (in/day)
Depth applied (in/wk)
Time to apply one inch (days)120 130 160 240
3.0 360 390 480 720 0.16 1.1 6.33.5 420 455 560 840 0.19 1.3 5.44.0 480 520 640 960 0.21 1.5 4.74.5 540 585 720 1080 0.24 1.7 4.25.0 600 650 800 1200 0.27 1.9 3.85.5 660 715 880 1320 0.29 2.0 3.46.0 720 780 960 1440 0.32 2.2 3.16.5 780 845 1040 1560 0.34 2.4 2.97.0 840 910 1120 1680 0.37 2.6 2.77.5 900 975 1200 1800 0.40 2.8 2.58.0 960 1040 1280 1920 0.42 3.0 2.48.5 1020 1105 1360 2040 0.45 3.2 2.2

Sprinkles• Follow manufacturer
recommendations• Narrow spacing for
expensive sprinklers may not be advisable
• Get in field to see how good the coverage is
• Check runoff when lateral aligns with row direction

Monitor pressure/flow rate

Monitoring pressure
• Buy a pressure gauge and make sure your system is operated at the designed pressure.
• Pressure regulators are important to low-pressure sprinkler packages and will not function properly unless the delivery line pressure is at least 5 psi greater than the pressure rating of the regulator.
• A non-functioning regulator means non-uniform water application.

Volume
• Acre-inch: The volume of water required to cover 1 acre 1-inch deep.
• Acre-foot: The volume of water required to cover 1 acre 1-foot deep.
• 1 cubic foot = 7.48 gallons = 62.4 pounds• 1 acre-inch = 3,630 cubic feet = 27,154
gallons• 1 acre-foot = 12 acre inches = 43,560
cubic feet = 325,851 gallons

Flow
• 1 acre-inch/hour = approximately 450 gallons per minute = 1 cubic foot per second

Runoff potential
0 0.15 0.25 0.35 0.45 0.55 0.65 0.75 0.85 1.05 1.15 1.25 1.350.0
0.5
1.0
1.5
2.0
2.5
Time (hours)
Rate
(inc
hes/
hour
)
Infiltration rate-How fast soil takes in water
Application rate-How fast water is applied

Runoff potential
0 0.15 0.25 0.35 0.45 0.55 0.65 0.75 0.85 1.05 1.15 1.25 1.350.0
0.5
1.0
1.5
2.0
2.5
Time (hours)
Rate
(inc
hes/
hour
)
Infiltration rate-How fast soil takes in water
Application rate-How fast water is applied
Surface storage amount ponded
Surfacesaturates

Runoff potential
0 0.15 0.25 0.35 0.45 0.55 0.65 0.75 0.85 1.05 1.15 1.25 1.350.0
0.5
1.0
1.5
2.0
2.5
Time (hours)
Rate
(inc
hes/
hour
)
Infiltration rate-How fast soil takes in water
Application rate-How fast water is applied
Surface storage amount ponded
Surfacesaturates
Runoff PotentialWater that can move in or leave the field
Runoff begins

Runoff potential

Runoff potential

Reducing runoff
• Short term– Speed up the pivot
• Long term– Increase wetted diameter– Reduce gpm– Increase surface storage– Increase infiltration rate
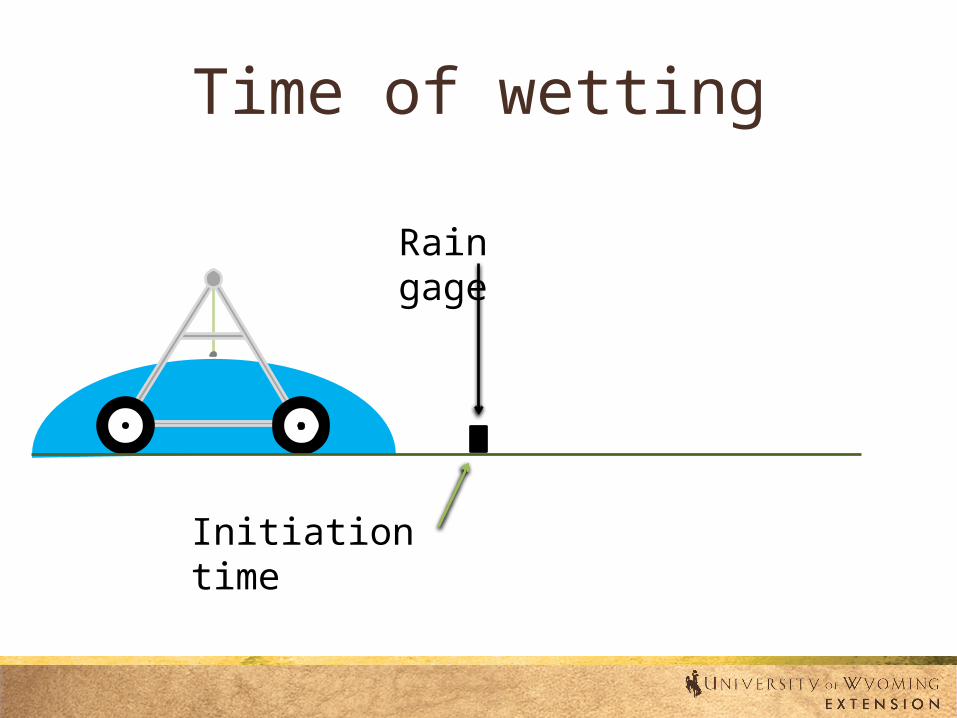
Time of wetting
Initiation time
Rain gage

Time of wetting
Initiation time
Rain gage
End time
Time of wetting = end time – initiation time
Sprinkler height?
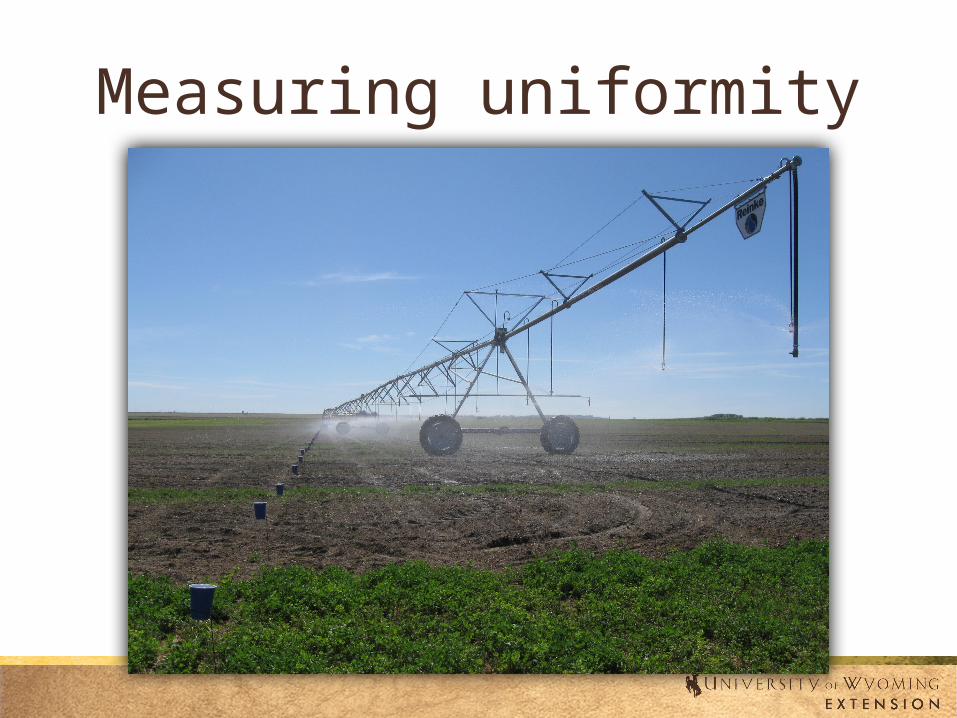
Measuring uniformity

Hard to manage what you don’t measure
• Schedule irrigations• Measure soil water• Monitor pivot• Control

WHEEL AND HAND LINES


Taxi system/Wipe

Skip

The offset

Sprinkler type

Pressure

HOW MUCH TO WATER?


Feel method• If it makes a ball
and falls apart when you bounce it in your hand, needs irrigation

Irrigation scheduling example
• Alfalfa – 5 ft. rooting depth
• Soil – loamy sand

Irrigation scheduling example
• 5 x 0.5 = 2.5 in AWC
• MAD = 50%• 2.5 x 0.50 = 1.75
in. PAW• Assume 3 in.
applied in 24 hrs.• Will need to go to
12 hr. sets

Available water capacity (AWC)Texture Soil Textural Class Estimated Average Plant AWC (in/ft2)
Sandy Soils Coarse Sands 0.5
Loamy sands 1.0
Loamy fine sands 1.25
Loamy very fine sands 1.25
Fine sands 1.25
Very fine sands 1.25
Loamy Soils Moderately coarse Sandy loam 1.5
Fine sandy loam 1.5
Medium Very fine sandy loam 2.0
Loam 2.0
Silt loam 2.0
Silt 2.0
Moderately fine Clay loam 2.2
Sandy clay loam 2.2
Silty clay loam 2.2
Clayey Soils Fine Sandy clay 2.0
Silty clay 2.0
Clay 2.0
http://www.nrcs.usda.gov/wps/portal/nrcs/detail/mt/soils/?cid=nrcs144p2_057354

Irrigation scheduling example
Soil Texture Available Water (AW) in/ftCoarse Sand 0.2 0.8‐Fine Sand 0.7 1.0‐Loamy Sand 0.8 1.3‐Sandy Loam 1.1 1.6‐Fine Sandy Loam 1.2 2.0‐Silt Loam 1.8 2.5‐Silty Clay Loam 1.6 1.9‐Silty Clay 1.5 2.0‐Clay 1.3 1.8‐Peat Mucks 1.9 2.9‐

Pivot example
• Pivot output in acre-in?
• Soil?
• Catch: has to wait 24 hrs. between circles
• What is peak ET in summer?
• 0.8 acre-in/24 hrs.• Sandy loam:1.5
AWC• MAD:1.5 x 0.5 =
0.75 PAW


Fall irrigation
Why? • Increase fall weed flush
• Can facilitate fall tillage
• Fall plant growth– Tiller production
• Leaching of salts• Storing soil
moisture

What it is all about…

Summary• Get sprinkler chart & ensure package is properly
installed• Determine if system capacity is adequate for your
location• Ensure that pump and pivot are properly matched• Buy good pressure gauge and operate system at design
pressure• Operate system when crops are small and look for
broken, plugged sprinklers or pressure regulators, other leaks
• Observe water application in the outermost span on the steepest portion of the field to see if you have runoff, if problems exist:– Reduce the application depth– Use reduced tillage to enhance surface storage and infiltration– Eventually evaluate if different sprinkler package would help– Select devices with large droplet size when renozzling
• Routinely maintain mechanical/electrical components

Questions?
Caleb CarterUW Extension Educator Goshen County(307) [email protected]
http://www.uwyoextension.org/highplainscropsite/