IRRI Limited Proceedings Seriesbooks.irri.org/9712202038_content.pdf · Xa14). We continued...
107
The International Rice Research Institute (IRRI) was established in 1960 by the Ford and Rockefeller Foundations with the help and approval of the Government of the Philippines. Today IRRI is one of 15 nonprofit international research centers supported by the Consultative Group on International Agricultural Research (CGIAR – www.cgiar.org). IRRI receives support from several CGIAR members, including the World Bank, European Union, Asian Development Bank, Interna- tional Fund for Agricultural Development, International Development Research Centre, Rockefeller Foundation, and agencies of the following governments: Australia, Belgium, Canada, People’s Republic of China, Denmark, France, Germany, India, Islamic Republic of Iran, Japan, Republic of Korea, The Netherlands, Norway, Philippines, Spain, Sweden, Switzerland, Thailand, United Kingdom, United States, and Vietnam. The responsibility for this publication rests with the International Rice Research Institute. Suggested citation: IRRI-Japan Collaborative Research Project. 2004. Blessings from Nature and Science for the Future. IRRI Limited Proceedings No. 10. Los Baños (Philippines): International Rice Research Institute. 122 p. ISBN 971-22-0203-8 ISSN 0117-8180 IRRI Limited Proceedings Series The series allows IRRI scientists and partners to quickly share information with specialized institutions and individuals. It consists of proceedings from conferences, meetings, and workshops. To permit rapid publication, the review and editing may not be as rigorous as with formal proceedings. Copyright International Rice Research Institute 2004 Mailing address: DAPO Box 7777, Metro Manila, Philippines Phone: +63 (2) 580-5600 Fax: +63 (2) 580-5699 Email: [email protected] Home page: www.cgiar.org.irri Riceweb: www.riceweb.org Rice Knowledge Bank: www.knowledgebank.irri.org Courier address: Suite 1009, Pacific Bank Building 6776 Ayala Avenue, Makati City, Philippines Tel. +63 (2) 891-1236, 891-1174, 891-1258, 891-1303
Transcript of IRRI Limited Proceedings Seriesbooks.irri.org/9712202038_content.pdf · Xa14). We continued...

The International Rice Research Institute (IRRI) was established in 1960 by the Ford and Rockefeller Foundations with the help and approval of the Government of the Philippines. Today IRRI is one of 15 nonprofit international research centers supported by the Consultative Group on International Agricultural Research (CGIAR – www.cgiar.org). IRRI receives support from several CGIAR members, including the World Bank, European Union, Asian Development Bank, Interna-tional Fund for Agricultural Development, International Development Research Centre, Rockefeller Foundation, and agencies of the following governments: Australia, Belgium, Canada, People’s Republic of China, Denmark, France, Germany, India, Islamic Republic of Iran, Japan, Republic of Korea, The Netherlands, Norway, Philippines, Spain, Sweden, Switzerland, Thailand, United Kingdom, United States, and Vietnam. The responsibility for this publication rests with the International Rice Research Institute.
Suggested citation:IRRI-Japan Collaborative Research Project. 2004. Blessings from Nature and Science for the Future. IRRI Limited Proceedings No. 10. Los Baños (Philippines): International Rice Research Institute. 122 p.
ISBN 971-22-0203-8ISSN 0117-8180
IRRI Limited Proceedings Series
The series allows IRRI scientists and partners to quickly share information with specialized institutions and individuals. It consists of proceedings from conferences, meetings, and workshops. To permit rapid publication, the review and editing may not be as rigorous as with formal proceedings.
Copyright International Rice Research Institute 2004
Mailing address: DAPO Box 7777, Metro Manila, PhilippinesPhone: +63 (2) 580-5600Fax: +63 (2) 580-5699Email: [email protected] page: www.cgiar.org.irriRiceweb: www.riceweb.org
Rice Knowledge Bank: www.knowledgebank.irri.orgCourier address: Suite 1009, Pacific Bank Building 6776 Ayala Avenue, Makati City, Philippines Tel. +63 (2) 891-1236, 891-1174, 891-1258, 891-1303

iii
Foreword iv
Breeding and genetics
Research on resistance to bacterial 3
blight in rice
T. Ogawa, T. Yamamoto, S. Taura, N.
Endo, H. Kaku, R. Ikeda, G.S. Khush,
and T.-W. Mew
Genetic studies in relation to breeding 17
rice varieties resistant to tungro disease
R. Ikeda, N. Kobayashi, and T. Imbe
Developing rice blast differential lines 31
and evaluating partial resistance for
the breeding of durable rice varieties
in the tropics
H. Kato, T. Imbe, H. Tsunematsu,
and Y. Fukuta
Genetic analysis of blast resistance 45
genes in elite indica-type rice
L.A. Ebron, Y. Fukuta, T. Imbe, H. Kato,
M.J.T. Yanoria, H. Tsunematsu,
G.S. Khush, and M. Yokoo
Identifying blast resistance genes in 53
elite indica-type rice varieties bred at
the International Rice Research Institute
L.A. Ebron, Y. Fukuta, T. Imbe, H. Kato,
M.J.T. Yanoria, H. Tsunematsu,
G. Khush, and M. Yokoo
Contents
The reaction pattern of quantitative 61
trait loci for agronomic traits under
different regions for temperate and
tropical rice
Y. Fukuta, E. Araki, S. Kobayashi,
L.A. Ebron, T. Umemoto, S. Morita,
K. Nagata, T. Sato, T. Nagamine,
T. Fukuyama, H. Sasahara, H. Nemoto,
H. Maeda, K. Hamamura, T. Ogata,
Y. Matsue, K. Ichitani, A. Takagi,
K. Tamura, and G.S. Khush
Crop management
Nutritional aspects of rice grain yield 73
G. Wada, P.C. Sta. Cruz,
and H. Ando
Ecophysiology of rice cultivation under 93
anaerobic direct sowing
M. Yamauchi
Stabilizing rice production under water 99
stress in rainfed and upland cropping
M. Kondo, M.V.R. Murty, P.P. Pablico,
D.V. Aragones, A. Aguilar, R. Agbisit,
K.S. Kwak, T. Winn, K. Okada,
and Ki-Do Park
Nitrogen-use efficiency as affected by 107
cultural and varietal differences under
flooded soil conditions
K. Kakuda and T. Nozoe
Inhibition of rice growth in the field 115
by water drainage in fallow
T. Nozoe

iv
The IRRI-Japan collaborative research project, functioningthrough a donation by the Japanese government, started in1989. Under this project, research to improve the produc-tivity of the rice plant and establish environment-friendlytechnology in the tropics has been carried out until nowthrough four phases. Each stage was set up to last five years.Plant breeders and agronomists have been seconded fromJapan, and research has been done according to the follow-ing phases (listing dates, subjects, and participating scien-tists by research area).
Phase I (December 1984 to November 1989)“The development of material-saving technology inrice cultivation”Genetics and breeding: Drs. Tsuguhumi Ogawa andRyoichi IkedaAgronomy and plant physiology: Dr. Genshichi Wada
Phase II (December 1989 to November 1994)“The development of stabilization technology for ricedouble cropping in the tropics”Genetics and breeding: Drs. Ryoichi Ikeda and TokioImbeAgronomy and plant physiology: Dr. Minoru Yamauchi
Phase III (December 1994 to November 1999)“Stabilization of rice culture under water stress in thetropics using a broader spectrum of genetic resources”Genetics and breeding: Drs. Tokio Imbe and HiroshiKatoAgronomy and plant physiology: Dr. Motohiko Kondo
Phase IV (October 1999 to September 2004)“Physio-genetic study on yield determination and eco-logical adaptability for sustainable rice culture”Genetics and breeding: Dr. Yoshimichi FukutaAgronomy and soil science: Dr. Takuhito Nozoe
The results have already been explained in several hun-dred publications. Based on these results, a workshop washeld to discuss these results and knowledge for future policyat JIRCAS on 24-25 September 2002. In the presence ofstaff members who were involved in research planning atJIRCAS, IRRI, and MAFF (Ministry of Agriculture, Forestry,and Fisheries), scientists from each stage, and collaborators,all the researchers presented their results. This Proceedingssummarizes the research results from each phase.
Foreword

Breeding and genetics

3
This project on resistance to rice bacterial blight (BB) has concentrated on the breeding of interna-
tional differentials, gene analysis using races and differentials of Japan and IRRI, and the specific
reaction between rice cultivars and races of BB pathogen in various countries.
The genes for BB resistance identified in each country were reported on the basis of analysis
using local bacterial isolates. These genes could not be compared directly with each other. Therefore,
it was necessary to reanalyze key cultivars using a uniform set of races and to compare the results of
previous studies in each country to have a common base for defining the relationships between the
groups of BB pathogens and the resistance of rice cultivars. Japanese and IRRI differentials were
analyzed using Japanese and Philippine BB isolates. Four resistance genes were identified.
To develop near-isogenic lines (NILs) having each BB resistance gene, we used an inoculation
test with 7 Japanese races and 13 Philippine ones to select recurrent parents: IR24 (indica), Milyang
23 (indica-japonica), and Toyonishiki (japonica). NILs were developed to establish a set of interna-
tional differentials with a monogenic base of the pathogen with resistance to BB and to supply
reliable materials to breeding programs for resistant cultivars. An initial set of NILs (36 lines) with
diverse genes for resistance was developed in 1987 and seeds distributed to scientists of various
countries. From then on, systematic research using these materials as a common base was carried
out internationally.
We collected more than 500 rice leaves affected by BB from 1982 to 1988 and examined
variation in the pathogenicity of these isolates at the isolation greenhouse in TARC. The isolates were
grouped into 28 races on the basis of their pathogenicity to Japanese and Philippine differentials.
The distribution of races was quite specific to each country.
To identify new sources of resistance to BB, we inoculated about 30,000 rice cultivars using six
BB races of the Philippines. The reaction pattern mostly corresponded to those of rice cultivars with
known BB resistance genes (Xa3, Xa4, xa5, Xa10, Xa4 + Xa10, xa5 + Xa7, Xa4 + xa5, xa5 + xa13, and
Xa14). We continued inoculation tests on rice cultivars (about 1,000 per country) stored at IRRI to
examine the gene distribution in each country. Results showed that the distribution of each gene
appeared to be geographic. In addition, the morphological characters of cultivars in each group
suggested that the differentiation of BB resistance genes was probably linked with the differentia-
tion of rice cultivars into distinct ecotypes.
To increase the genetic resources for resistance to BB, we carried out a study to induce mutants
with resistance to BB by chemical mutagen. We found two resistant mutant lines (XM5 and XM6).
M3 progenies derived from M
2 plants in both mutant lines were tested for segregation for resistance;
the results showed that these mutant lines have single recessive genes for BB races. From an allelic
test between XM5 or XM6 and known recessive genes (xa5, xa8, and xa13), we concluded that the
two recessive genes are new ones, and designated the genes as xa19 and xa20.
This project has developed the first NILs for rice diseases and insects and established a com-
mon basis of research on resistance to BB disease by exchanging materials among rice-growing
countries.
Research on resistance to bacterialblight in riceT. Ogawa, T. Yamamoto, S. Taura, N. Endo, H. Kaku, R. Ikeda, G.S. Khush, and T.-W. Mew

4
Bacterial blight (BB) caused by Xanthomonas oryzae pv.oryzae is one of the major diseases of rice in the rice-grow-ing countries of Asia. Yield losses in severely infected fieldsranged from 20% to 30% (Ou 1985) and data showed thatyield loss could reach about 80% (Singh et al 1977). Reli-ance is considerably high on the use of resistant cultivarsfor controlling the disease because of the ineffectiveness ofbactericidal agents.
Since the pathogenic specialization in the causal bac-terium of BB was first reported in Japan by Kuhara et al(1958) and Kusaba et al (1958), several reports have beenpublished on the variability of pathogenicity in the bacte-rium and of the resistance.
Mostly Japanese researchers and IRRI (InternationalRice Research Institute, Philippines) scientists carried outrecent research on BB. Many researchers (Ezuka and Horino1974, Reddy and Ou 1976, Sato et al 1976, Choi et al 1976,1977) mentioned the existence of the specialization of races.Nishimura (1961) began genetic studies on the resistance ofrice to BB. Four major genes (Xa1, Xa2, Xaw, and Xakg)were identified in Japan (Sakaguchi 1967, Ezuka et al 1974,Ogawa et al 1978). Seven new loci for resistance (Xa4, xa5,Xa6, Xa7, xa8, xa9, and Xa10) were identified by IRRI sci-entists (Petpisit et al 1977, Olufowote et al 1977, Librojo etal 1976, Sidhu et al 1978, Sidhu and Khush 1978, Singh etal 1983, Yoshimura et al 1983).
Since the differential cultivars and bacterial races usedat both sites (Japan and Philippines) were different, the twogroups of scientists had difficulty in distinguishing the re-sistance gene. To control the disease, it is important to havea common base to define the relationship between the viru-lence of the groups of the BB pathogens and the resistanceof rice cultivars to the races. Thus, it is desirable at this stageto compare and analyze the results of the studies conductedin Japan and at IRRI.
Dr. N.C. Brady, former IRRI director general, proposedcollaborative research on the development of BB-resistantisogenic lines between Japan and IRRI in 1978. As a result,TARC (Tropical Agricultural Research Center), of the MAFF(Ministry of Agriculture, Fisheries, and Forestry), Japan, sentone plant pathologist to IRRI for collaborative researchduring a few months in 1979, 1980, and 1981. However, thecollaborative research was limited to the area of plant pa-thology. The first workshop of IRRI-MAFF on research col-laboration was in Tsukuba, Japan, in September 1981. Dur-ing the workshop, it was agreed that basic studies on thecontrol of pests and diseases, particularly bacterial blight,would be one of the appropriate collaborative research sub-jects, which should begin immediately. It was further de-cided that both IRRI and TARC would coordinate the imple-mentation of the collaborative research. After the first IRRI-MAFF workshop, a meeting on the BB project was held atTARC in February 1982, in which Japanese scientists/ad-ministrators participated. In this meeting, the participantsdiscussed the plans on BB collaborative research proposedby TARC. Then, they agreed that four main subjects shouldbe studied in BB collaborative research. They also decided
that a TARC plant breeder should be assigned to IRRI on along-term basis and a TARC plant pathologist should visitregularly for a short time to participate in the BB program.As a follow-up to the discussion held in September 1981, aplanning workshop was held at IRRI in March 1982 be-tween MAFF and IRRI scientists/administrators. Subse-quently, four proposed studies presented by MAFF wereagreed upon. In April 1982, one plant breeder and one plantpathologist joined TARC, started a preliminary experimentat TARC, and then joined IRRI to conduct the collabora-tive program in September 1982.
In 1984, IRRI and the government of Japan agreed toinitiate collaborative efforts on selective aspects of low-input rice cultivation, in recognition of the need to developlow-input technology for irrigated paddy rice in the tropicsand semitropics. The collaborative program mentionedabove for research on resistance to BB was included as acomponent of this Low-Input Technology Research Project.
This paper deals only with developing the internationaldifferentials because of a limitation in space. For those in-terested in learning more about the overall achievements ofthe project, please see the published references.
Breeding of near-isogenic lines
Near-isogenic lines (NILs) with diverse genes for resistanceto major diseases and insects can be powerful tools in iden-tifying races and biotypes of diseases and insects. In rice, noNILs can be used among the countries because of some dif-ficulties in exchanging materials among rice-growing coun-tries.
To establish a common basis of research on resistanceto BB, we began developing NILs with diverse genes forresistance to BB disease. As a result, we have developed aninitial set of NILs, although a few isolates avirulent to recur-rent plants were identified during the development of theNILs.
Materials and methods
The initial plan for developing NILs with diverse genes forresistance to BB was to breed the BC
4F
4 lines with each
monogenic basis for the resistance.The resistant donors for developing NILs are as fol-
lows: Kogyoku for Xa1 and Xa12, Te-tep for Xa2, Chugoku45 for Xa3, Java 14 for Xa3, IR8 for Xa11, IR20 for Xa4,IR1545-339 for xa5, DV85 for Xa7, Zenith for Xa3 (Xa6),Sateng for Xa3 (xa9), Cas 209 for Xa10, and PI231129 forxa8.
The recurrent parents for developing NILs are as fol-lows: IR24 for indica genetic background, Toyonishiki forjaponica genetic background, and Milyang 23 for indica-japonica hybrid genetic background. The sources of origi-nal seeds for these materials were already described.
The basic procedure is shown in Figures 1–5. All cross-ing work for developing NILs was done continuously atIRRI. After the original crossing between recurrent parents

5
and each resistant donor, the first backcrosses to F1 hybrids
were made, and the selection of plants carrying a dominantresistance gene was started by inoculation using Philippineisolates. For the selection of plants carrying a recessive gene,F
2 progenies of backcrossed hybrids were inoculated with
Philippine isolates. From the second backcross, at least sevenplants of each line were crossed with each recurrent parentto get a progeny carrying each resistance gene with morethan a 99% possibility. This process was repeated until theBC
4F
2 generation of each breeding line carrying resistance
genes.On the other hand, progenies between recurrent parents
and resistant donors for developing NILs were inoculatedmostly from the BC
3F
1 advanced generation with Japanese
isolates at TARC because the rice-cropping season is onceper year in Japan. To select backcrossed progenies, morethan seven crossed seeds were sent to TARC.
With this process, backcrossed progenies carrying eachresistance gene were advanced until the BC
4F
2 generation.
The BC4F
2 plants showing resistance to BB isolates and
having an introduced recessive gene, such as xa5 in IR1545-339, were considered to be homozygous for the recessivegene. On the other hand, the homozygosity of breeding lineshaving the introduced dominant gene was tested in the F
3
lines. From the BC4F
3, each line was inoculated with suit-
able BB isolates and was compared with the recurrent par-
ent. Uniformity for plant type was also considered withineach line.
Thus, in the BC4F
4 generation, or in a more advanced
generation, each breeding line was designated by the nameIR-BB as a NIL. A number is assigned to each gene withresistance to BB. The recurrent parent has a backgroundfrom three varieties: “0” represents IR24, “1” representsToyonishiki, and “2” represents Milyang 23. For example,the NIL carrying the Xa3 gene and backcrossed byToyonishiki is designated as IR-BB 103. The number “3”represents the Xa3 gene.
Results and discussion
Developing NILs carrying the Xa3 gene
Chugoku 45 and Java 14 were used as resistant donors fordeveloping near-isogenic lines carrying the Xa3 gene. More-over, Zenith (originally identified as Xa6) and Sateng (origi-nally identified as xa9) were also used as resistant donorsfor developing NILs. During our studies, Xa6 in Zenith andxa9 in Sateng were revealed to be identical to Xa3 inChugoku 45 and Java 14. Therefore, Zenith and Sateng alsoserve as donors of NILs carrying the Xa3 gene.
Initial crossing between recurrent parents (female) andcultivars harboring the Xa3 gene was done from December1982 to March 1983, and the first backcross between these
Fig. 1. Procedural steps in breeding for lines carrying dominant gene for Philippine races.
Resistant cultivar × recurrent parent (RP)
F1 × RP More than 7 crossed seeds
BC1F
1 × RP More than 7 crossed seeds
Inoculation test (IT) with resistant plants
BC2F
1 × RP More than 7 crossed seeds
IT with resistant plants
BC3F
1 × RP More than 7 crossed seeds
IT with resistant plants
BC4F
1Selection of resistant
IT plants
BC4F
2Selection of resistant
IT plants
BC4F
3Selection of homozygous
IT resistant line (20 plants line–1)
Selection of plant type
Harvesting per plant
BC4F
4Selection of line
IT Selection of plant type

6
F1 hybrids and IR24 was completed during April to May
1983. About 12 BC1F
1 progenies of every cross-combina-
tion were planted with 20 cm between plants and everyplant was inoculated with Philippine race 1 (PXO61).
The inoculation test for all BC1F
1 lines indicated that
several plants of every line were resistant to PXO61 (1).That is, it was confirmed that Sateng also carried a domi-nant gene for the Philippine isolate as mentioned in thegenetic study in an earlier section. More than seven plantsin several BC
2F
1 progenies were backcrossed with IR24
during December 1983 to January 1984. Every plant of theBC
2F
1 lines was also inoculated with PXO61 (1).
After the backcross to each plant of the BC2F
1 lines, our
results of genetic studies indicated that plants carrying theXa3 gene could be selected by Philippine isolates. There-fore, after that, we selected plants of backcrossed progeniesby using only Philippine isolates. The backcrossed seeds ofBC
2F
1 plants were sent to TARC and BC
3F
1 plants were
inoculated with T7174 (IA) and T7133 (IIIA) to remove theplants carrying Xa1 and Xa12 in Java 14 and IR20.
The fourth backcrossing to plants in selected BC3F
1
lines was done during June to July 1984. Before the back-crossing, all plants were inoculated with PXO61 (1). The
few BC4F
1 lines derived from the resistant BC
3F
1 plants were
planted and inoculated with four Philippine isolates. Aboutfive lines of the BC
4F
2 generation derived from resistant
BC4F
1 plants were planted and inoculated with four Philip-
pine isolates at IRRI. The seeds of the BC4F
2 seeds were sent
to TARC and BC4F
2 plants from the seeds were inoculated
with one or two Japanese isolates. From the BC4F
2 genera-
tion, the plant types of each line were also compared withthose of the recurrent parents.
More than 20 plants in the BC4F
2 generation with
shorter lesion length than the resistant plants were harvested.Each ten BC
4F
3 lines of different cross-combinations were
planted and inoculated with four Philippine races. From theinoculation test, homozygous lines for resistance were se-lected and harvested. After the BC
4F
4 generation, selection
for plant type was again repeated and compared with that ofthe recurrent parents. Each line of the BC
4F
4 generation was
also planted and inoculated at TARC.Finally, we designated line names of the NILs mostly
in the BC4F
5. In the advanced generations after the designa-
tion of each NIL, plant types of the breeding lines werecompared with those of the recurrent parents for selection ofa better line.
Fig. 2. Procedural steps in breeding for lines carrying recessive gene for Philippine races.
Resistant cultivar × recurrent parent (RP)
F1 × RP More than 7 crossed seeds
BC1F
1 × RP More than 7 crossed seeds × 7 plants
BC1F
2Inoculation test for selection of BC
1F
1
Inoculation test (IT)
BC2F
1 × RP Inoculation test for selection of BC
1F
1
BC2F
2Inoculation test for selection of BC
1F
1
IT BC3F
1 × RP
BC3F
2
IT
BC4F
1Selection of crossed seeds
IT with BC3F
1 showing resistance
in BC3F
2 generation
BC4F
2Selection of resistant plant
IT after inoculation test
BC4F
3Selection of line by uniformity
IT and plant type
Harvesting per plant
(total of 20 plants)
BC4F
4Selection of line
IT

7
The resistant plants are all heterozygous genotypes forthe resistance gene Xa3, that is, the data show the degree ofresistance under the heterozygous genotype carrying theXa3 gene. Recurrent parents Milyang 23 and IR24 showedtypical susceptibility of Japanese and Philippine BB iso-lates, whereas Toyonishiki showed moderate susceptibilityin our preliminary experiment. In the BC
4F
1 generation, the
heterozygous plants (R+) with a Toyonishiki backgroundshowed short lesion length for four Philippine isolates. Onthe other hand, the heterozygous plants (R+) with a Milyang23 or IR24 background showed much longer lesions thanthose with a Toyonishiki background. Most of the lesionlengths in the resistant plants (R+) were longer than those ofthe susceptible plants (++) with a Toyonishiki background.However, the lesion length of the resistant plants (R+) witha Milyang 23 or IR24 background was clearly shorter thanthat of the susceptible plants (++). Therefore, these data in-dicate that the lesion length of resistant plants carrying Xa3for BB is variable according to the genetic background.
The inoculation results with these developed NILs in-dicated that NILs carrying Xa3 showed a slightly shorterlesion length with a Toyonishiki background than thosewith a Milyang 23 or IR24 background. However, the dif-
ference in lesion length between different backgrounds wasless in homozygous resistant plants than in the heterozy-gous resistant plants mentioned above.
Developing NILs carrying the Xa4 gene
IR20, an IRRI differential, was used as a resistant donor fordeveloping NILs carrying the Xa4 gene.
The initial crossing between the three recurrent parentsand IR20 was done in January 1983, and the first backcrossin April to May 1983. The second backcrosses to the BC
1F
1
progenies were done in August 1983. At the same time, theBC
1F
1 plants were inoculated with four Philippine races.
The BC2F
1 progenies obtained by backcross between IR24
and resistant BC1F
1 plants were also inoculated with four
Philippine races and were then backcrossed again with eachrecurrent parent. BC
1F
2 progenies and BC
3F
1 progenies were
also inoculated with Japanese isolates at TARC to removethe Xa1 gene from backcrossed progenies. From the F
2 analy-
sis of Kogyoku/IR20, IR20 was identified as carrying thesame gene(s) of Kogyoku in addition to Xa4.
After the inoculation of BC3F
1 progenies at IRRI, the
last backcross was made to them from December 1983 toFebruary 1984. The BC
4F
1 progenies were inoculated with
Fig. 3. Procedural steps in breeding for lines carrying Xa7 of DV85 (xa5, Xa7) for Philippine races.
Susceptible plant
BC3F
2
IT
Resistant cultivar × recurrent parent (RP)
F1 × RP More than 7 crossed seeds
BC1F
1 × RP More than 7 crossed seeds
for all resistant plants
BC2F
1 × RP More than 7 crossed seeds
IT × 7 resistant plants
BC3F
1 × RP More than 7 crossed seeds
IT × all resistant plants of each line
BC4F
1 × RP More than 7 crossed seeds
IT × 7 resistant plants, but discard line
that presented resistant plant
in BC3F
2 generation
BC4F
2Selection of resistant plant
IT
BC4F
3Selection of homozygous resistant line
IT and plant type
Harvesting per plant
(more than 20 plants)
BC4F
4Selection of line and plant
IT
Inoculation test (IT)

8
four Philippine races to select resistant plants carrying Xa4.The data indicate that the Xa4 gene in IR20 has a differentdegree of resistance to Philippine races 1 and 4. The degreeof resistance to race 1 was slightly variable between differ-ent backgrounds, and variable to race 4 by different back-grounds. Moreover, Xa4 might convey resistance to races 2and 3 at a very minor level.
After the selection of resistant BC4F
1 plants, the gen-
eration of each progeny was advanced by self-pollination.The BC
4F
2, BC
4F
3, and BC
4F
4 progenies were inoculated
with Philippine races at IRRI and with Japanese races atTARC. At the same time, the plant type of these progenieswas compared with the plant type of each recurrent parent.In BC
4F
3 progenies, homozygous lines carrying the Xa4
gene could not be identified. Afterward, 5 to 0 plants of afixed line in the resistance gene were selected based on thesimilarity of plant type with each recurrent parent.
In BC4F
5 lines carrying Xa4, we finally selected NILs
per each recurrent parent and designated them as IR-BB4(IR24 background), IR-BB 104 (Toyonishiki background),and IR-BB204 (Milyang 23 background), respectively. TheXa4 gene conveys relatively stable resistance to race 1, butvariable resistance in different backgrounds to race 4. More-over, the reaction to races 2 and 3 of NILs did not showcomplete susceptibility in the lines with an IR24 or
Toyonishiki background. Therefore, the Xa4 gene mightexpress pleiotropy on resistance to BB isolates.
Developing NILs carrying the xa5 gene
IR1545-339, an IRRI differential, was used as a resistantdonor for developing NILs carrying the xa5 gene. An IRRI-bred line, IR1545-339, was developed from the cross be-tween IR24 and DZ192. Therefore, the xa5 gene in IR1545-339 was derived from that of DZ192.
The initial cross between recurrent parents and IR1545-339 was made during January to February 1983, and thenthe first backcrosses between recurrent parents and F
1 hy-
brids were made during April to May 1983. More than sevenplants of BC
1F
1 progenies per different recurrent parent were
backcrossed again. At the same time, plants of BC1F
2 prog-
enies were inoculated with four Philippine races, and thenBC
1F
1 plants carrying the xa5 gene were specified. The ge-
netic study of IR1545-339 for resistance confirmed thatIR1545-339 had only one recessive gene for Japanese iso-lates and it was identical to xa5. Therefore, the progenies ofthe backcrossing program were inoculated and selected onlywith Philippine races and the process was repeated from theBC
1F
1 to BC
4F
2 generation.
Since xa5 is a recessive gene, we can get the homozy-gous genotype for the resistance in BC
4F
2 progenies, that is,
Fig. 4. Procedural steps in breeding for lines carrying Xa4 of IR20 (Xa1, Xa4, Xa12) for Philippine races.
Resistant cultivar × recurrent parent (RP)
F1
× RP More than 7 crossed seeds
BC1F
1× RP More than 7 crossed seeds
Inoculation test (IT) × resistant plant
BC2F
1 × RP More than 7 crossed seeds
IT × 7 resistant plants
BC3F
1 × RP More than 20 crossed seeds
IT × 7 resistant plants
Send half of crossed
seeds to Japan
BC4F
1 × RP Discard crossed seeds with plants that
IT showed resistance to race I and V
Inoculation test for in BC3F
2 in Japan
Japanese race I and
Indonesian race V BC4F
2Selection of resistant plants
IT
BC4F
3Selection of homozygous resistant
IT line and plant type
Harvesting per plant (20 plants)
BC4F
4Selection of line and plant
by plant type

9
if a BC4F
2 progeny shows resistance, it is considered a ho-
mozygous genotype for the gene. Thus, we have developedNILs from the generation by inoculation test and compari-son of plant type with that of each recurrent parent. FromBC
4F
3 lines, the inoculation test with Japanese races and
comparison of plant type with each recurrent parent werealso done at TARC. As a result, IR-BB5 (IR24 background),IR-BB 105 (Toyonishiki background), and IR-BB 205(Milyang 23 background) were developed in 1987. Afterthe designation of NILs, we still continued selecting betterlines among NILs.
The lesion length of NILs for four Philippine isolatesshowed that the xa5 gene expressed a longer lesion lengthin a Toyonishiki background than in an IR24 background,although parental Toyonishiki had a shorter lesion lengththan that of parental IR24. Moreover, the xa5 gene was con-firmed to convey resistance to race 4.
Developing NILs carrying the Xa7 gene
An IRRI differential, DV85, was used as a resistant donor fordeveloping NILs carrying Xa7. DV85 was identified to haveone recessive gene, xa5, and one dominant gene, Xa7 (Sidhuet al 1978). Actually, no cultivar with the Xa7 gene onlyhas been found yet.
The initial crosses between recurrent parents and DV85were made from December 1982 to January 1983. Then, thefirst backcrosses to the F
1 hybrids were completed in April
1983. The BC1F
1 progenies were inoculated with four Phil-
ippine races and the plants resistant to Philippine races 2and 3 were backcrossed with recurrent parents from July toAugust 1983. The third backcrosses to the BC
2F
1 progenies
were made using more than seven plants per each recurrentparent. The BC
2F
2 progenies were inoculated with four Phil-
ippine races. Moreover, to remove the recessive gene, xa5,or to separate the recessive gene, xa5, and the dominantgene, Xa7, the BC
2F
3 progenies were inoculated on 17 plants
per line with four Philippine races and then the carryinggene(s) of each BC
2F
1 and BC
3F
1 progeny were identified
by the results.At that time, Saha (1984) reported that DV85 had two
dominant genes and one recessive gene. Therefore, we hadto confirm this result, though our inoculation results withthe backcrossed progenies showed that DV85 had one domi-nant gene, not more than one dominant gene. Thus, we ad-vanced the backcross program only to IR24 backcrossedprogenies, and then, after the confirmation of the resistancegene in DV85, we continued backcrossing to Toyonishikiand Milyang 23 progenies.
Fig. 5. Procedural steps in breeding for lines carrying gene with resistance to Japanese race only.
Resistant cultivar × recurrent parent (RP) No selection
F1
× RP More than 7 crossed seeds: no selection
BC1F
1× RP More than 7 crossed seeds × 7
plants: no selection
BC2F
1× RP More than 7 crossed seeds × 7
plants × 7 lines: no selection
BC3F
1 × RP More than 20 crossed seeds
(the above 343 plants from crossed plants)
Send half of crossed
seeds to Japan
BC4F
1 × RP Crossing with 7 plants from crossed seeds
Inoculation test showed resistance to Japanese races
for Japanese races in BC3F
2
BC4F
2
Send harvested seeds of F2
per plant (about 30 grains
per plant)
BC4F
3Selection of lines that showed homozygous
resistant lines and plant type
Inoculation test for Japanese races Harvesting per plant (20 plants)
Selection of homozygous
resistant lines BC4F
4Selection of line

10
As a result, the last backcrosses were made with IR24 inFebruary 1985, and with Toyonishiki or Milyang 23 in July1986. The BC
4F
1 and BC
4F
2 progenies were inoculated with
four Philippine races. In the BC4F
3 progenies, homozygous
lines for resistance were selected. Afterward, NILs with ahomozygous genotype were compared with each recurrentparent based on uniformity and plant type. Now, NILs wereadvanced to the BC
4F
7 generation with an IR24 background
and to BC4F
4 with a Toyonishiki or Milyang 23 background.
We designated NILs as IR-BB 7 (IR24 background), IR-BB107 (Toyonishiki background), and IR-BB 207 (Milyang23 background).
The data showed that the Xa7 gene conveyed high re-sistance to Philippine races 1, 2, and 3, but was susceptibleto race 4. However, the resistance to race 1 was slightlylower than that to races 2 and 3.
Developing NILs carrying the xa8 gene
PI231129 has been identified as carrying the xa8 gene forresistance by Sidhu et al (1978). No other cultivars wereidentified to have this xa8 gene. However, PI231129 is notincluded in IRRI differentials. Thus, PI231129 was used asa resistant donor for developing NILs carrying the xa8 gene.
The initial crosses between recurrent parents andPI231129 were made in January 1983, and then the firstbackcrosses to F
1 hybrids were carried out from May to July
1983. The second backcrosses to BC1F
1 progenies were made
using more than seven plants per recurrent parent from Au-gust to November 1983. The BC
2F
2 progenies were inocu-
lated with four Philippine races for specifying the BC2F
2
plants carrying the recessive gene xa8. The third backcrossesto BC
2F
1 progenies were made from March to April 1984.
The BC3F
2 progenies were also inoculated with four
Philippine races. However, there were some difficulties inspecifying plants carrying the resistance gene. Therefore,every BC
3F
1 plant was crossed with PI231129 and recurrent
parents to confirm which plants have the resistance gene ofPI231129. The crosses were made from February to April1986. Afterward, the inoculation test with four Philippineraces was carried out for the progenies of IR24/PI231129//3*IR24///PI231129 and the BC
4F
1 progenies carrying the
resistance gene were specified by the test.In BC
4F
2 progenies, more than 20 plants having moder-
ate resistance to Philippine races 1, 2, and 3 were selectedper recurrent parent. From the BC
4F
3 lines, every plant was
inoculated with four Philippine races and the uniformity ofthe reaction was considered. At the same time, the planttype of each line was compared with that of each recurrentparent.
During the season of NILs evaluation, PI231129 didnot head because it has high photosensitivity. The lesionlength of selected NILs for four Philippine races was longer,although it was shorter than the lesion length of each recur-rent parent. Moreover, lesion development of the NILs didnot stop after inoculation. The resistance conveyed by thexa8 gene might be different from that of the other genesidentified for resistance to BB.
Developing NILs carrying the Xa10 gene
An IRRI differential, Cas 209, was used as a resistant donorfor developing NILs carrying the Xa10 gene. At that time,only Cas 209 was identified as having Xa10 for BB. Xa10conveys resistance to race 2 only and Cas 209 shows sus-ceptibility to all Japanese races. Therefore, the breeding ofNILs carrying Xa10 has been done only at IRRI in the earlygenerations, but, in the later generations, breeding lines wereplanted at TARC for comparison of plant type with that ofthe recurrent parents.
The initial crosses between recurrent parents and Cas209 were made from December 1982 to January 1983, andthe first backcrosses between F
1 hybrids and recurrent par-
ents were completed from April to May 1983. The BC1F
1
progenies were inoculated with PXO86 (2) for selecting re-sistant plants, and then crossed with recurrent parents (sec-ond backcrosses) from July to September 1983. This proce-dure was repeated until the fourth backcrosses with recur-rent parents.
The BC4F
2 progenies were inoculated with four Philip-
pine races to confirm the reaction of the plants carryingXa10. The results of inoculation show that plants carryingXa10 have a similar degree of resistance to race 2 amongdifferent backgrounds, that is, every heterozygous (resis-tant) plant with a different background had a short lesionlength for race 2. At the same time, susceptible plants with adifferent background showed a lesion length similar to thatof each recurrent parent.
After the BC4F
2 progenies, the developed plants were
compared with the plant type of each recurrent parent atboth IRRI and TARC. The NILs did not show a difference inlesion length for race 2 among each background, that is, thelesion lengths were very short. Therefore, the expression ofXa10 for resistance appears not to be affected by geneticbackground.
Developing NILs carrying the Xa11 gene
An IRRI differential, IR8 (susceptible check), was used as aresistant donor for developing NILs carrying Xa11. Xa11was identified originally in RP9-3 (Ogawa and Yamamoto1986), and then in this study, Elwee and IR8 were also iden-tified as carrying the Xa11 gene. Xa11 conveys resistanceto some Japanese races but not to any Philippine races. There-fore, crossing work for developing NILs has been done onlyat IRRI, but selection for plants carrying Xa11 was done atTARC.
Initial crossing between recurrent parents and IR8 wasdone in January 1983. The first backcrossing to F
1 hybrids
was carried out from April to June 1983 and the secondbackcrossing to BC
1F
1 progenies was done using about seven
plants per recurrent parent during August to November 1983.BC
1F
2 progenies for the Toyonishiki or Milyang 23 back-
cross program were inoculated with Japanese races at TARCand BC
1F
1 plants carrying Xa11 were selected according to
the results.Inoculation can be done once a year in the field at
TARC. Therefore, we continued crossing the necessary num-

11
ber of combinations with recurrent parents to involve Xa11in the backcross progenies. As a result, crossing of 50 BC
2F
1
plants with IR24, 59 BC2F
1 plants with Toyonishiki, and 58
BC2F
1 plants with Milyang 23 was done from March to May
1984. Furthermore, crossing of 102 BC3F
1 plants with IR24,
62 BC3F
1 plants with Toyonishiki, and 62 BC
3F
1 plants with
Milyang 23 was completed during November 1984.The fourth backcrossed seeds were sown at TARC in
1985, and the plants were inoculated with Japanese races IBand IIIA. The BC
4F
1 plants showing resistance to the two
races were harvested and then the BC4F
2 progenies were
planted at TARC in 1986. Twenty lines per recurrent parentwere evaluated based on resistance to Japanese races, planttype, and grain shape. Five lines per recurrent parent wereselected from plant type and grain shape and then, withinthe selected lines, plants resistant to Japanese races wereharvested.
At TARC in 1987, the BC4F
3 lines were further evalu-
ated based on resistance and plant type. As a result, fewlines per recurrent parent having homozygous resistancewere selected. The selected lines were evaluated based onplant type at IRRI in 1988. Finally, each line per recurrentparent was selected and designated as IR-BB 11 (IR24 back-ground), IR-BB 111 (Toyonishiki background), and IR-BB201 (Milyang 23 background).
Developing NILs carrying the Xa1 and Xa12 gene
A Japanese differential, Kogyoku, was used as a resistantdonor for developing NILs carrying Xa1 and Xa12.
First, we repeatedly backcrossed and inoculated plantsto get backcrossed progenies resistant to Japanese race IAand an Indonesian isolate, Xo7306, because the genes Xa1and Xa12 could not be separated from each other due to thevery close linkage between them.
Initial crosses between recurrent parents and Kogyokuwere made from December 1982 to February 1983, and thefirst backcrosses were made in April 1983. The progenies ofBC
1F
1 plants (BC
1F
2) were inoculated with a Japanese iso-
late and an Indonesian isolate in the isolation greenhouseat TARC, where the BC
1F
1 plants carrying a resistance gene
were identified. Backcrosses with recurrent parents were re-peated more than three times without selection by inocula-tion of a Japanese and Indonesian isolate due to space limi-tations of the isolation greenhouse at TARC.
The second backcrossing was done from July to Au-gust 1983, the third from December 1983 to February 1984,and the fourth in October 1984. All BC
4F
1 progenies were
sent to TARC. The BC4F
1 progenies taken from 191 cross-
combinations were inoculated with a Japanese isolate,T7174, and an Indonesian isolate, Xo7306, at the isolationgreenhouse of TARC in 1985. After selection of plants re-sistant to the two isolates, more than 2,000 plants of theBC
4F
2 progenies per recurrent parent were inoculated with
the two isolates.Several plants appeared to show a different reaction to
the two isolates, but no plant was susceptible to an isolatein the progenies. Therefore, we decided first to develop ho-
mozygous lines resistant to the two isolates, and at the sametime we continue looking for plants showing resistance toonly one isolate. Thus, we selected homozygous resistantlines with resistance to two races in BC
4F
3 progenies at TARC
in 1987; these lines were designated as IR-BB 1 (IR24 back-ground), IR-BB 101 (Toyonishiki background), and IR-BB201 (Milyang 23 background).
We still need to continue to segregate plants with twokinds of resistance: resistant to only the Japanese isolateand resistant to only the Indonesian isolate. It is possiblethat the two genes, Xa1 and Xa12, are located on the samelocus.
Developing NILs carrying the Xa2 gene
A Japanese differential, Te-tep, was used as a resistant donorfor developing NILs carrying Xa2. However, Te-tep has beenidentified as carrying Xa1 and Xa2 and it might carry onemore gene (such as Xa12) with resistance to Indonesian iso-late Xo7306 (Sakaguchi 1967, Ogawa et al 1978). Further-more, a recent inoculation test showed that Te-tep was resis-tant to Indonesian isolate Xo7435 (IV) while other Japanesedifferentials were susceptible to it. Therefore, we initiallydeveloped NILs carrying all resistance genes in Te-tep, andlater on tried to separate each resistance gene in Te-tep.
Crosses between recurrent parents and Te-tep were madein January 1983 and then the first backcrosses to F
1 hybrids
were completed from April to May 1983. The BC1F
2 prog-
enies were inoculated with four isolates, T7174 (IA), T7147(II), Xo7435 (IV), and Xo7306 (V), at the isolation green-house of TARC. The selected BC
1F
1 plants from the above
results were backcrossed with recurrent parents from Au-gust to November 1983. The third backcrosses were fromJanuary to February 1984 and the fourth backcrosses fromFebruary to March 1985. The fourth backcrossed seeds(BC
4F
1) were sent to TARC in 1985 and selection was then
made to identify resistant plants in backcrossed progeniesby inoculation with the four isolates.
More than 2,000 plants (BC4F
2 progenies) were inocu-
lated per recurrent parent in 1986 and BC4F
3 progenies were
evaluated in 1987. We selected homozygous lines resistantto Japanese isolates T7174 (IA) and T7147 (II) and Indone-sian isolate Xo7306, and homozygous lines resistant to In-donesian isolate Xo7435 (Table 78) because there were stillsome difficulties in separating lines resistant to either T7147or Xo7306.
In addition to the relationship between Xa1 and Xa12,it is possible that the resistance genes in Te-tep are eachlocated on the same locus, though we need to continue tosegregate plants with one resistance gene.
Thus, we finished developing a basic set of NILs forresearch on resistance to rice bacterial blight. The seedshave already been distributed to scientists of various coun-tries and biotechnologists in the U.S. and Japan, and reportson which lines were used have been published.
The reactions of the development of NILs for the Japa-nese and Philippine races of BB pathogen are shown inTable 1. It should be noted that only two Myanmar isolates

12
among more than 500 isolates of our collection from Asiancountries (which we will describe later) were not virulent tothe recurrent parents, while they were virulent to a few BBdifferentials. In addition, one Japanese isolate was not viru-lent to IR24 and Milyang 23, while it was virulent toToyonishiki (Yamamoto and Ogawa 1990).
Bibliography
Adhikari TB, Mew TW, Leach JE. 1999. Genotypic pathotypicdiversity in Xanthomonas oryzae pv. oryzae in Nepal. Phy-topathology 89:687-694.
Blair MW, McCouch SR. 1997. Microsatellite and sequence-tagged site markers diagnostic for the rice bacterial leafblight resistance gene xa-5. Theor. Appl. Genet. 95:174-184.
Caldecott RS, Stevens H, Roberts BJ. 1959. Stem rust resistantvariants in irradiated populations: mutation or field hybrids?Agron. J. 51:401-403.
Choi YC. 1981. The outbreak and control of bacterial diseases inKorea. Proceedings of the Seminar on pest management ofrice in East Asia. 9-1-9-36.
Choi YC, Cho EH, Chung BJ, Cho YS, Yoo YH. 1977. “Kresek”disease in Korea. I. The grouping of the pathogens and re-production of “Kresek”. Korean J. Plant Prot. 16(1):1-6. (InKorean with English summary.)
Choi YC, Sato T, Watanabe B. 1976. Races of Xanthomonasoryzae in Korea. Ann. Phytopathol. Soc. Jpn. 42:357-358.(Abstr.)
Endo N, Ogawa T. 1997. Isozyme genotype of major cultivargroups resistant to bacterial blight in Asian rice. Breed. Sci.47:237-243.
Endo N, Ogawa T, Khush GS. 1997. Isozyme classification ofMyanmar rice cultivars resistant to bacterial blight. Breed.Sci. 47:27-32.
Ezuka A, Horino O. 1974. Classificationn of rice varieties andXanthomonas oryzae strains on the basis of their differentialinteractions. Bull. Tokai-Kinki Natl. Agric. Exp. Stn. 27:1-19.
Ezuka A, Horino O, Toriyama K, Shinoda H, Morinaka T. 1975.Inheritance of resistance of rice variety Wase Aikoku 3 toXanthomonas oryzae. Bull. Tokai-Kinki Natl. Agric. Exp.Stn. 28:124-130.
Gao DY, Xu ZG, Chen ZY, Sun LH, Sun QM, Lu F, Hu BS, LiuYF, Tang LH. 2001. Identification of a new gene for resis-tance to bacterial blight in a somaclonal mutant HX-3 (in-dica). Rice Genet. Newsl. 18:66-68.
Glaszmann JC. 1987a. Isozymes and classification of Asian ricevarieties. Theor. Appl. Genet. 74:21-30.
Glaszmann JC. 1987b. A simplified method to classify rice vari-eties with isozymes. Int. Rice Res. Newsl. 12(3):5-7.
Hopkins CCM, White FF, Choi SH, Guo A, Leach JE. 1992.Identification of a family of avirulence genes fromXanthomonas oryzae pv. oryzae. Mol. Plant-Microbe Inter-act. 5(6):451-459.
Horino O, Mew TW, Khush GS, Ezuka A. 1980. Resistance ofJapanese and IRRI differential rice varieties to pathotypesof Xanthomonas oryzae in the Philippines and in Japan. IRRIResearch Paper Series 53:1-11.
Huang N, Angeles ER, Domingo J, Magpantay G, Singh S, ZhangG, Kumaravadivel N, Bennett J, Khush GS. 1997. Pyramidingof bacterial blight resistance genes in rice: marker-assistedselection using RFLP and PCR. Theor. Appl. Genet. 95:313-320.
IRRI (International Rice Research Institute). 1975. Annual reportfor 1974. Los Baños (Philippines): IRRI. 384 p.
IRRI (International Rice Research Institute). 1980. Standard evalu-ation system for rice. Los Baños (Philippines): IRRI. 16 p.
Ismachin MK, Mugiono. 1977. Selection for bacterial leaf-blight(Xanthomonas oryzae) and sheath-blight (Rhizoctoniaoryzae) resistant mutants in a collection of early rice mu-tants. In: Induced mutations against plant diseases. Vienna(Austria): International Atomic Energy Agency. p 199-211.
Iwata N, Satoh H, Omura T. 1984. The relationships betweenchromosomes identified cytologically and linkage groups.Rice Genet. Newsl. 1:128-132.
Jayaraj D, Seshu DV, Shastry SVS. 1972. Genetics of resistanceto bacterial leaf blight in rice. Indian J. Genet. Plant Breed.32(1):77-89.
Table 1. Reactiona of near-isogenic lines (NILs) to Japanese and Philippine races of BB pathogen (corrected according to Ogawa et al
1991).
Japanese raceb Philippine race
NILs
IA IB I I IIIA IIIB IV 1 2 3 4 5 6
IR-BB 1 HR HR M S S S S S S S S S
IR-BB 2 HR HR HR S S S S S S S S S
IR-BB 3 R B R B R B R B R B S R B R B R B R B R B S
IR-BB 4 R R R R R R R S S M R S
IR-BB 5 R R R R R R R R R M R S
IR-BB 7 HR HR HR HR HR HR R HR HR S HR S
IR-BB 8 R HR HR HR R R R R R M R M
IR-BB 10 S S S S S S S HR S S HR S
IR-BB 11 S R R R S S S S S S S S
aReaction at booting stage, HR = highly resistant, RB = resistant with browning margin, R = resistant, M = moderately susceptible to moderately resistant, S = susceptible.bStandard isolates for each race are as follows: T7174 for race IA, T7156 for race IB, T7147 for race II, T7133 for race IIIA, Q6803 for race IIIB, H75373 for race IV, PXO61 for race
1, PXO86 for race 2, PXO79 for race 3, PXO71 for race 4, PXO112 for race 5, PXO for race 6. The reaction to Japanese race V (H75304) is not included in this table because
of the low virulence.

13
Kaji R, Ogawa T. 1995. Identification of the located chromo-some of the resistance gene, Xa-7, to bacterial leaf blight inrice. Jpn. J. Breed. 45(Suppl. 1):79.
Kariya K, Wahio O. 1959. Varietal resistance to bacterial leafblight in relation to races of the causal bacterium. ChugokuAgric. Res. 14:41-43. (In Japanese with English summary.)
Katayama T, Terao H, Inouye J, Chern JL. 1982. Phylogeneticrelationship between five ecotypes and Japanese varietiesin rice. Jpn. J. Breed. 32:333-340.
Kato S. 1930. On the affinity of rice varieties of rice plants, Oryzasativa L. J. Dept. Agric. Kyushu Imp. Univ. 2:242-276.
Kauffman HE, Reddy APK, Hsieh SPY, Merca SD. 1973. Animproved technique for evaluating resistance of rice variet-ies to Xanthomonas oryzae. Plant Dis. Rep. 57:537-541.
Khush GS. 1990. Report of meetings to discuss chromosomenumbering system in rice. Rice Genet. Newsl. 7:12-15.
Khush GS, Angeles ER. 1999. A new gene for resistance to race6 of bacterial blight in rice, Oryza sativa L. Rice Genet.Newsl. 16:92-93.
Khush GS, Singh RJ, Sur SC, Librojo AL. 1984. Primary trisomicsof rice: origin, morphology, cytology and use in linkage map-ping. Genetics 107:141-163.
Khush GS, Bacalangco E, Ogawa T. 1990. A new gene for resis-tance to bacterial blight from O. longistaminata. Rice Genet.Newsl. 7:121-122.
Kinoshita T. 1995 Report of committee on gene symbolization,nomenclature and linkage groups. Rice Genet. Newsl. 12:9-153.
Konzak CF. 1959. Radiation-induced mutations for stem rust re-sistance in oats. Agron. J. 51:518-520.
Kuhara S, Kurita T, Tagami Y, Fujii H, Sekiya N. 1965. Studieson the strain of Xanthomonas oryzae (Uyeda et Ishiyama)Dowson, the pathogen of the bacterial leaf blight of rice withspecial reference to its pathogenicity and phage-sensitivity.Bull. Kyshu Agric. Exp. Stn. 11:263-312. (In Japanese withEnglish summary.)
Kuhara S, Sekiya N, Tagami Y. 1958. On the pathogen of bacte-rial leaf blight of rice isolated from severely affected areawhere resistant variety was widely cultivated. Ann.Phytopathol. Soc. Jpn. 23:9 (Abstr.) (In Japanese.)
Kurata N, Omura T. 1978. Karyotype analysis in rice. I. A newmethod for identifying all chromosome pairs. Jpn J. Genet.53:251-255.
Kusaba T, Watanabe M, Tabei H. 1966. Classification of thestrains of Xanthomonas oryzae (Uyeda et Ishiyama) Dowsonon the basis of their virulence against rice plants. Bull. Natl.Inst. Agric. Sci. Ser. C 20:67-82. (In Japanese with Englishsummary.)
Kusaba T, Watanabe M, Tabei H, Mukoo H. 1958. Varietal dif-ference in resistance to bacterial leaf blight in rice: special-ization in pathogenicity (1). Ann. Phytopathol. Soc. Jpn. 23:9(Abstr.) (In Japanese.)
Lee SW, Choi SH, Han SS, Lee DG, Lee BY. 1999. Distributionof Xanthomonas oryzae pv. oryzae strains virulent to Xa21in Korea. Phytopathology 89:928-933.
Librojo V, Kauffman HE, Khush GS. 1976. Genetic analysis ofbacterial leaf blight resistance in four varieties of rice.SABRAO J. 8:105-110.
Lin XH, Zhang DP, Xie YF, Gao HP, Zhang QF. 1996. Identify-ing and mapping a new gene for bacterial blight resistance inrice based on RFLP markers. Phytopathology 86:1156-1159.
Matsuo T. 1952. Genecological studies on the cultivated rice.Bull. Natl. Inst. Agric. Sci. D3:1-112.
Mazzola M, Leach JE, Nelson R, White FF. 1994. Aanlysis ofthe interaction between Xanthomonas oryzae pv. oryzae andthe rice cultivars IR24 and IRBB21. Phytopathology 84:392-397.
Mew TW. 1987. Current status and future prospects of researchon bacterial leaf blight of rice. Ann. Rev. Phytopathol. 25:359-382.
Mew TW, Vera Cruz CM. 1977. Pathogenic strains ofXanthomonas oryzae in the Philippines. Int. Rice Res. Newsl.2(3):8.
Mew TW, Vera Cruz CM. 1979. Variability of Xanthomonasoryzae: specificity in infection of rice differentials. Phytopa-thology 69:152-155.
Mew TW, Vera Cruz CM, Reyes RC. 1982. Interaction ofXanthomonas campestris pv. oryzae and a resistant rice cul-tivar. Phyopathology 72(7):786-789.
Mir GN, Khush GS. 1990. Genetics of resistance to bacterialblight in rice cultivar DV86. Crop Res. 3(2):194-198.
Morinaga T. 1954. Classification of rice varieties on the basis ofaffinity: studies on rice breeding. Jpn. J. Breed. 4(Suppl.1):1-14.
Morinaga T. 1968. Origin and geographical distribution of Japa-nese rice. Trop. Agric. Res. Ser. 3:1-15.
Morishima H, Oka HI. 1981. Phylogenetic differentiation of cul-tivated rice. XXII. Numerical evaluation of the indica-japonica differentiation. Jpn. J. Breed. 31:402-413.
Moses CJ, Rao YP, Siddiq EA. 1974. Inheritance of resistance tobacterial blight in rice. Indian J. Genet. Plant Breed.34(2):271-279.
Nagao S, Takahashi M. 1963. Genetical studies on rice plant.XXVII. Trial construction of twelve linkage groups of Japa-nese rice. J. Fac. Agric. Hokkaido Univ. 53:72-130. (In Japa-nese with English summary.)
Nakagahra M. 1978. The differentiation, classification and cen-ter of diversity of cultivated rice by isozyme analysis. Trop.Agric. Res. Ser. 11:77-82.
Nakagahra M, Nagamine T, Okuno K. 1986. Spontaneous oc-currence of low amylose genes and geographical distribu-tion of amylose content in Asian rice. Rice Genet. Newsl.3:46-48.
Nakai H, Goto M. 1974. An approach for breeding varieties ofrice resistant to bacterial leaf blight with induced mutations.J. Agric. Sci. Camb. 84:167-172.
Nakai H, Goto M. 1975. Studies on mutation breeding of rice forbacterial leaf blight resistance. 1. Variations in bacterial leafblight reactions found in M2 generation. SABRAO J. 7:159-170.
Nakai H, Goto M. 1977. Mutation breeding of rice for bacterialleaf-blight resistance. In: Induced mutations against plantdiseases. Vienna (Austria): International Atomic EnergyAgency. p 171-186.
Nakai H, Nakamura K, Kuwahara S, Saito M. 1988. Geneticstudies of an induced rice mutant resistant to multiple racesof bacterial leaf blight. Rice Genet. Newsl. 5:101-103.
Nakai H, Nakamura K, Saito M. 1988. Studies on mutation breed-ing of rice for bacterial-leaf-blight resistance. 6. Determina-tion of gene of the resistant M41 mutant to the multiple races.Jpn. J. Breed. 38(Suppl. 2):290-291. (In Japanese.)

14
Nakai H, Kuwahara S, Senga S. 1990. Genetic analysis of aninduced mutant of rice for a quantitative resistance to bacte-rial leaf blight. Jpn. J. Breed. 40:397-409.
Nei M. 1987. Molecular evalutionary genetics. New York (USA):Columbia University Press.
Nishimura Y. 1961. Studies on the reciprocal translocations inrice and barley. Bull. Natl. Inst. Agric. Sci. Ser. D 9:171-235.(In Japanese with English summary.)
Nishiyama K. 1977. Storage of plant bacterium pathogen by freezemethod. Shokubutsu-Boeki 31:465-467.
Noda T, Ohuchi A. 1989. A new pathogenic race of Xanthomonascampestris pv. oryzae and inheritance of resistance to it.Ann. Phytopath. Soc. Jpn. 55:201-207.
Noda T, Yamamoto T, Kaku H, Horino O. 1996. Geographicaldistribution of pathogenic races of Xanthomonas oryzae pv.oryzae in Japan in 1991 and 1993. Ann. Phytopathol. Soc.Jpn. 62:549-553.
Noda T, Li C, Li J, Ochiai H, Isel K, Kaku H. 2001. Pathogenicdiversity of Xanthomonas oryzae pv. oryzae strains fromYunnan province, China. JARQ 35(2):97-103.
Noda T, Du PV, Dinh HD, Kaku H. Pathogenicity of Xanthomonasoryzae pv. oryzae strains in Vietnam. Ann. Phytopathol. Soc.Jpn. 65:293-296.
Ochiai H, Horino O, Miyajima K, Kaku H. 2000. Genetic diver-sity of Xanthomonas oryzae pv. oryzae strains from Sri Lanka.Phytopathology 90:415-421.
Ogawa T. 1983. Pathogenic specialization in bacterial groups Iand III of Xanthomonas campestris pv. oryzae in Japan.Ann. Phytopathol. Soc. Jpn. 49:61-72.
Ogawa T, Morinaka T, Fujii K, Kimura T. 1978. Inheritance ofresistance of rice varieties of Kogyoku and Java 14 to bacte-rial group V of Xanthomonas oryzae. Ann. Phytopathol. Soc.Jpn. 44:137-141.
Ogawa T, Fujii K. 1979. Studies on the breeding of rice varietiesresistant to bacterial leaf blight. 1. Resistance of rice nativevarieties in Japan. Bull. Chugoku Natl. Agric. Exp. Stn.A26:67-80.
Ogawa T, Yamamoto T. 1986. Inheritance of resistance of bac-terial blight in rice. In: Rice genetics. Manila (Philippines):International Rice Research Institute. p 471-479.
Ogawa T, Lou L, Tabien RE, Romero GO, Endo N, Khush GS.1987. A new recessive gene for resistance to bacterial blightof rice. Rice Genet. Newsl. 4:98-100.
Ogawa T, Kaku H, Yamamoto T. 1989. Resistance gene of ricecultivar Asominori to bacterial blight of rice. Jpn. J. Breed.39(Suppl. 1):196-197. (In Japanese.)
Ogawa T, Khush GS. 1989. Major genes for resistance to bacte-rial blight in rice. In: Bacterial blight of rice. Manila (Philip-pines): International Rice Research Institute. p 177-192.
Ogawa T, Yamamoto T, Khush GS, Mew TW. 1990. Geneticsof resistance in rice cultivars Chugoku 45 and Java 14 toPhilippine and Japanese races of bacterial blight pathogen.Jpn. J. Breed. 40:77-90.
Ogawa T, Yamamoto T, Khush GS, Mew TW. 1990. Geneticsof resistance in rice cultivars Zenith and Cempo Selak toPhilippine and Japanese races of bacterial blight pathogen.Jpn. J. Breed. 40:183-192.
Ogawa T, Yamamoto T, Khush GS, Mew TW. 1990. Geneticsof resistance in rice cultivar Sateng to Philippine and Japa-nese races of bacterial blight pathogen. Jpn. J. Breed. 40:329-338.
Ogawa T, Yamamoto T, Khush GS, Mew TW. 1990. Geneticsof resistance in rice cultivars IR20 and Semora Mangga toPhilippine and Japanese races of bacterial blight pathogen.Jpn. J. Breed. 40:435-447.
Ogawa T, Yamamoto T, Khush GS, Mew TW. 1991. Resistanceand its inheritance to bacterial blight of IR8 rice cultivargroup. Jpn. J. Breed. 41:211-221.
Ogawa T, Yamamoto T, Khush GS, Mew TW. 1991. Breedingof near-isogenic lines of rice with single genes for resistanceto bacterial blilght pathogen (Xanthomonas campestris pv.oryzae). Jpn. J. Breed. 41:523-529.
Ogawa T, Busto GA, Tabien RE, Romero GO, Endo N, KhushGS. 1991. Grouping of rice cultivars based on the reactionpattern to Philippine races of bacterial blight pathogen(Xanthomonas campestris pv. oryzae). Jpn J. Breed. 41:109-119.
Oka HI. 1958. Intervarietal variation and classification of culti-vated rice. Indian J. Genet. Plant Breed. 18:79-89.
Oka HI. 1988. Indica-japonica differentiation of rice cultivars. In:Origin of cultivated rice. Tokyo (Japan): Japan ScientificSocieties Press. p 141-179.
Olufowote JO, Khush GS, Kauffman HE. 1977. Inheritance ofbacterial bllight resistance in rice. Phytopathology 67:772-775.
Ott L, Scandalios JG. 1978. Genetic control and linkage relation-ship among aminopeptidases in maize. Genetics 89:137-146.
Ou SH. 1985. Rice diseases. Revised edition. Kew, Surrey (En-gland): Commonwealth Mycological Institute. p 61-96.
Petpisit V, Khush GS, Kauffman HE. 1977. Inheritance of resis-tance to bacterial blight in rice. Crop. Sci. 17:551-554.
Ram M. 1974. Useful induced mutations in rice. In: Inducedmutations for disease resistance in crop plant. Vienna (Aus-tria): International Atomic Energy Agency. p 161-164.
Reddy OR, Ou SH. 1976. Pathogenic variability in Xanthomonasoryzae. Phytopathology 66:906-909.
Ronald P, Albano B, Tabien R, Abenes L, Wu K, McCouch SR,Tanksley SD. 1992. Genetic and physical analysis of therice bacterial blight disease resistance locus, Xa21. Mol.Gen. Genet. 236:113-120.
Saha AK. 1984. Genetics of resistance to Philippine races of thebacterial blight pathogen in four cultivars of rice. Ph.D. the-sis. University of the Philippines Los Baños, Los Baños,Philippines. 131 p.
Sakaguchi S. 1967. Linkage studies on the resistance to bacterialleaf blight, Xanthomonas oryzae (Uyeda et Ishiyama)Dowson, in rice. Bull. Natl. Inst. Agric. Sci. Ser. D 16:1-18.(In Japanese with English summary.)
Sakaguchi S, Suwa T, Murata N. 1968. Studies on the resistanceto bacterial leaf blight, Xanthomonas oryzae (Uyeda etIshiyama) Dowson. In: The cultivated and wild rices. Bull.Natl. Inst. Agric. Sci. Ser. D 18:1-29.
Sanchez AC, Hag LL, Yang D, Brar DS, Ausubel F, Khush GS,Yano M, Sasaki T, Li Z, Huang N. 1999. Genetic and physi-cal mapping of xa13, a recessive bacterial blight resistancegene in rice. Theor. Appl. Genet. 98:1022-1028.
Sato T, Choi YS, Iwasaki M, Watanabe B. 1976. Distribution ofraces of Xanthomonas oryzae in Kyushu. Ann. Phytopathol.Soc. Jpn. 42:357. (Abstr.) (In Japanese.)
Sato YI. 1985. Genetic control of apiculus hair length. Rice Genet.Newsl. 2:72-74.

15
Sato YI. 1991. Variation in spikelet shape of the indica andjaponica rice cultivars in Asian origin. Jpn. J. Breed. 41:121-134.
Sato YI, Ishikawa R, Morishima H. 1990. Nonrandom associa-tion of genes and characters found in indica × japonica hy-brids of rice. Heredity 65:75-79.
Satoh H, Omura T. 1979. Induction of mutation by the treatmentof fertilized egg cells with N-methyl-N-nitrosourea in rice. J.Fac. Agric. Kyushu Univ. 24:165-174.
Satoh H, Omura T. 1986. Mutagenesis in rice by treating fertil-ized egg cells with nitroso compounds. In: Rice genetics.Proceedings of the International Rice Genetics Symposium.Los Baños (Philippines): International Rice Research Insti-tute. p 707-717.
Second G. 1982. Origin of the genic diversity of cultivated rice(Oryza spp.): study of the polymorphism scored at 40isozyme loci. Jpn. J. Genet. 57:25-57.
Shastry SVS, Rangao, Rao DR, Mistra RN. 1960. Pachyteneanalysis in Oryzae. I. Chromosome morphology in Oryzasativa L. Indian J. Genet. Breed. 20:15-21.
Sidhu GS, Khush GS. 1978. Dominance reversal of a bacterialblight resistance gene in some rice cultivars. Phytopathol-ogy 68:461-463.
Sidhu GS, Khush GS, Mew TW. 1978. Genetic analysis of bac-terial blight resistance in seventy-four cultivars of rice, Oryzasativa L. Theor. Appl. Genet. 53:105-111.
Sidhu GS, Khush GS, Mew TW. 1979. Genetic analysis of resis-tance to bacterial blight in seventy cultivars of rice, Oryzasativa L., from Indonesia. Crop Improv. 6:19-25.
Singh CB, Rao YP. 1971. Association between resistance toXanthomonas oryzae and morphological and quality char-acters in induced mutants of Indica and Japonica varieties ofrice. Indian J. Genet. Plant Breed. 31:369-373.
Singh RJ, Khush GS, Mew TW. 1983. A new gene for resistanceto bacterial blight in rice. Crop Sci. 23:558-560.
Singh GP, Srivastava MK, Singh RV, Singh RM. 1977. Variationin quantitative and qualitative losses caused by bacterial blightin different rice varieties. Indian Phytopathol. 30:180-185.
Song WY, Wang GL, Chen LL, Kim HS, Pi LY, Holsten T,Wang B, Zhai WX, Zhu H, Fauquet C, Ronald PC. 1995. Areceptor kinase-like protein encoded by the rice disease re-sistance gene, Xa21. Science 270:1804-1806.
Sur SC, Khush GS. 1984. Chromosomal location of Xa-4 gene.Rice Genet. Newsl. 1:97-98.
Tanksley SD, Rick CM. 1980. Isozymic linkage map of the to-mato: applications in genetics and breeding. Theor. Appl.Genet. 157:161-170.
Taura S, Ogawa T, Yoshimura A, Ikeda R, Omura T. 1991.Identification of a recessive resistance gene in induced mu-tant line XM5 of rice to rice bacterial blight. Jpn. J. Breed.41:427432.
Taura S, Ogawa T, Yoshimura A, Ikeda R, Iwata N. 1992. Iden-tification of a recessive resistance gene to rice bacterialblight of mutant line XM6, Oryza sativa L. Jpn. J. Breed.42:7-13.
Taura S, Ogawa T, Tabien RE, Khush GS, Yoshimura A, OmuraT. 1992. Resistance gene of rice cultivar Taichung Native 1to Philippine races of bacterial blight pathogens. Jpn. J. Breed.42:195-201.
Tin Win. 1973. Virulent strain of Xanthomonas oryzae in thePhilippines. Int. Rice Res. Newsl. 2:7.
Ting Y. 1957. The origin and the differentiation of cultivated ricein China. Npng Ye Xue Bao 8:243-260.
Trouslot P, Second G. 1980. Technique d’electrophorese en ge,Kamidon applique a l’etude du polymorphisme de quatorzeenyzmes du riz. In: Electrophorese d’enzymes de riz.Travaux et documents de l’ORSTOM, 120, ORSTOM, Paris.
Tsuchiya K, Mew TW, Wakimoto S. 1982. Bacteriological andpathological characteristics of wild types and induced mu-tants of Xanthomonas campestris pv. oryzae. Phytopathol-ogy 72:43-46.
Tu J, Ona I, Zhang Q, Mew TW, Khush GS, Datta SK. 1998.Transgenic rice variety ’IR72’ with Xa21 is resistant to bac-terial blight. Theor. Appl. Genet. 97:31-36.
Uchiyamada H, Fujita Y, Kimura K, Yamada T. 1977. Survey ofcharacteristics of domestic and introduced rice varieties.Res. Mater. Hokuriku Agric. 3:137 p. Hokuriku Natl. Agric.Exp. Stn., Joetsu, Niigata, Japan. (In Japanese.)
Ueno K, Sato T, Takahashi N. 1990. The indica-japonica classi-fication of Asian rice ecotypes and Japanese lowland andupland rice (Oryza sativa L.). Euphytica 46:161-164.
Vaughan DA, Juliano A. 1992. Silent allele for Amp-2 foundamong Sulawesi varieties. Rice Genet. Newsl. 9:107-108.
Wakimoto S. 1960. Classification of strains of X. oryzae on thebasis of their susceptibility to bacteriophages. Ann.Phytopathol. Soc. Jpn. 25:39-198.
Wang GL, Song WY, Ruan DL, Sideris S, Ronald PC. 1996. Thecloned gene, Xa21, confers resistance to multipleXanthomonas oryzae pv. oryzae isolates in transgenic plants.Mol. Plant-Microbe Interact. 9:850-855.
Washio O, Kariya K, Toriyama K. 1966. Studies on breeding ricevarieties for resistance to bacterial leaf blight. Bull. ChugokuAgric. Exp. Stn. Ser. A13:55-85. (In Japanese with Englishsummary.)
Watanabe S. 1976. Studies on the breeding of rice varieties resis-tant to bacterial leaf blight in Sri Lanka. Tohoku Nat. Agr.Exp. Sta. 54:1-74. (In Japanese with English summary.)
Willliams CE, Wang B, Holsten TE, Scambray J, de Assis Goesda Silva F, Ronald P. 1996. Markers for selection of the riceXa21 disease resistance gene. Theor. Appl. Genet. 93:1119-1122.
Yamada T. 1984. Multiple allele at the Xa-1 and Xa-kg loci forresistance to bacterial leaf blight. Rice Genet. Newsl. 1:97-98.
Yamada T, Horino O. 1981. Studies on genetics and breeding ofresistance to bacterial leaf blight in rice. V. The multiplealleles resistant to the bacterial groups I and V ofXanthomonas campestris pv. oryzae of Japan in the variet-ies IR28, IR29, and IR30. Jpn. J. Breed. 31:423-431.
Yamada T, Horino O, Samoto S. 1979. Studies on genetics andbreeding of resistance to bacterial leaf blight in rice. 1. Dis-covery of new varietal group on the basis of reaction pat-terns to five different pathotypes of Xanthomonas oryzae(Uyeda et Ishiyama) Dowson in Japan. Ann. Phytopathol.Soc. Jpn. 45:240-246.
Yamamoto T, Hartini RH, Muhammad M, Nishizawa T, TanteraDM. 1977. Variation in pathogenicity of Xanthomonas oryzae(Uyeda et Ishiyama) Dowson and resistance of rice variet-ies to the pathogen. Contr. Centr. Res. Inst. Agric. Bogor28:1-22.

16
Yamamoto T, Ogawa T. 1990. Inheritance of resistance in ricecultivars Toyonishiki, Milyang 23 and IR24 to Myanmarisolates of bacterial leaf blight pathogen. Jpn. Agric. Res. Q.24:74-77.
Yoshimura S. 1993. Genetic analysis of bacterial blight resis-tance genes in rice by using molecular markers. Bull. Inst.Agric. Kyushu Univ. 16:1-64.
Yoshimura A, Mew TW, Khush GS, Omura T. 1983. Inheritanceof resistance to bacterial blight in rice cultivar Cas 209. Phy-topathology 73(10):1409-1412.
Yoshimura A, Omura T, Mew TW, Khush GS. 1985. Geneticbehavior of resistance to bacterial blight in differential ricecultivars in the Philippines. Bull. Inst. Trop. Agric. KyushuUniv. 8:1-54.
Yoshimura S, Yoshimura A, Saito A, Kishimoto N, Kawase M,Yano M, Nakagahra M, Ogawa T, Iwata N. 1992. RFLPanalysis of introgressed chromosomal segments in three near-isogenic lines of rice for bacterial blight resistance genesXa-1, Xa-3, and Xa-4. Jpn. J. Genet. 67:29-37.
Yoshimura S, Yoshimura A, Iwata N, McCouch SR, Abenes A,Baraoidan MR, Mew TW, Nelson R. 1995a. Tagging andcombining bacterial blight resistance genes in rice usingRAPD and RFLP markers. Mol. Breed. 1:375-387.
Yoshimura A, Nelson R, Mew TW, Iwata N. 1995b. Tagging ofXa-1, the bacterial blight resistance gene in rice, by usingRAPD markers. Breed. Sci. 45:81-85.
Yoshimura S, Yoshino M, Morihashi T. 1960. Isotypes ofXanthomonas oryzae and their pathogenicity. Proc. Assoc.Plant Prot. Hokuriku 8:21-24.
Yoshimura S, Umehara Y, Kurata N, Nagamura Y, Sasaki T,Minobe Y, Iwata N. 1996. Characterization of candidateclones of Xa-1, the bacterial blight resistance gene in rice,isolated by map-based cloning. Theor. Appl. Genet. 93:117-122.
Yoshimura S, Yamanouchi U, Katayose Y, Toki S, Wang ZX,Kono I, Kurata N, Yano M, Iwata N, Sasaki T. 1998. Ex-pression of Xa-1, a bacterial blight resistance gene in rice, isinduced by bacterial inoculation. Proc. Natl. Acad. Sci. USA95:1663-1668.
Yu GX, Zhang DP, Xie YF. 1986. Location of genes for resis-tance to Chinese strains of bacterial blight, Xanthomonascampestris pv. oryzae, in IR28. Rice Genet. Newsl. 3:86-87.
Zhang G, Angeles ER, Abenes MLP, Khush GS, Huang N. 1996.RAPD and RFLP mapping of the bacterial blight resistancegene xa13 in rice. Theor. Appl. Genet. 93:65-70.
Zhang Q, Lin SC, Zho BY, Wang CL, Yang WC, Zhou YI, LiDY, Chen CB, Zhu LH. 1998. Identification and tagging of anew gene for resistance to bacterial blight (Xanthomonasoryzae pv. oryzae) from O. rufipogon. Rice Genet. Newsl.15:138-142.
Zho XP, Zhang DP, Xie YF. 1985. Studies on the inheritance ofrice to bacterial blight. J. Huazhong Agric. Coll.(3):11-22.(In Chinese with English summary.)
Notes
Authors’ addresses: T. Ogawa, Miyazaki University, Miyazaki889-2192, Japan; T. Yamamoto, National Agricultural Re-search Center (NARC), NARO, Joetsu 953-0193; S. Taura,Kagoshima University, Kagoshima 890-0065; N. Endo, Bio-technology Research Center, Taisei Corporation, Yokohama245-0051; H. Kaku, National Institute of Agrobiological Sci-ences, Tsukuba 305-8602; R. Ikeda, Japan InternationalResearch Center for Agricultural Sciences, Tsukuba 305-8686, Japan; G.S. Khush and T.-W. Mew, International RiceResearch Institute, DAPO Box 7777, Metro Manila, Philip-pines.
Acknowledgments: We are grateful to Drs. S. Nakagawa and K.Hayashi, former director generals of TARC, Dr. T. Kajiwara,incumbent director general of TARC, Dr. M.R. Vega, formersenior deputy director general of IRRI, and Dr. M.S.Swaminathan, former director general of IRRI for their sup-port for the implementation of this collaborative project.
We also wish to express our sincere thanks to Dr. A.Ezuka, former environmental research coordinator, NationalInstitute of Agroenvironmental Sciences (NIAES), Japan,for his support for this project.
We thank Mr. R.C. Aquino, Mr. R.M. Herrera, Mr.M.S. Alejar, and Ms. L.L. Serrano for their help and col-laboration with this project.
Special thanks are due to project staff, Ms. B.Y. Carillo,secretary; Mr. R.E. Tabien, research assistant; Mr. G.A.Busto, Jr., research aide; Mr. G.O. Romero, research aide;and others for their collaboration.
31
Breeding of rice varieties with durable resistance to blast is the most logical and environ-
ment-friendly approach. Major gene and partial resistance are known. Information about the
virulence of rice blast isolates is important for genetic studies and the breeding of resistant
varieties. W e have tested the pathogenicity of a few hundred blast isolates by inoculating
them to Japanese differential varieties and IRRI near-isogenic lines (NILs) having known
resistance genes. Based on the results of inoculation, standard blast isolates are selected.
However, the virulence of each resistance gene was not clear. Extra genes seemed to exist
in the differentials or NILs.
Varieties with a single but different resistance gene are ideal as differentials for patho-
genicity tests. We developed a set of lines with single but different blast resistance genes as
monogenic lines. Thirteen genes for blast resistance were incorporated. Monogenic lines
with nine genes were also developed.
The reaction patterns of almost all of the donors and differential varieties could be
explained by the reaction patterns of the monogenic lines or combination of lines. However,
resistant reactions of some donors were higher than expected. This higher resistance can be
ascribed to either complementary gene action or the presence of additional resistance
genes besides known ones.
Partial resistance to blast has not been clearly distinguished from major gene resis-
tance in the tropics. Several major genes for resistance to blast were identified recently in IR
varieties at IRRI and the reactions of these genes to Philippine blast isolates were studied.
Consequently, suitable blast isolates could be selected to overcome the effect of these
major genes for evaluating partial resistance to blast under field conditions.
Seventy-two varieties and breeding lines were inoculated with three blast isolates dur-
ing two seasons. Serious blast infection was induced by partial shading, continuous irriga-
tion, and the application of a large amount of fertilizer. Disease damage was evaluated using
the Standard Evaluation System for rice blast.
Partial resistance was clearly distinguished from major gene resistance and the differ-
ences between moderate levels of resistance conferred by major genes and partial resis-
tance were clarified. Among the materials used, IR64 showed a high level of partial resis-
tance. Partial resistance was moderate in IR60 and IR36 and low in IR50 and CO39. These
results were consistent with the results of sequential planting done at IRRI earlier. Partial
resistance levels of several Japanese varieties at IRRI are also consistent with their evalua-
tions in Japan. Significant positive correlations observed among partial resistance to the
three isolates indicate that partial resistance is horizontal in the tropics. A distinction be-
tween major gene and partial resistance to blast is necessary for identifying donors for
developing durably resistant varieties.
Developing rice blast differential linesand evaluating partial resistance for thebreeding of durable rice varieties in the tropicsH. Kato, T. Imbe, H. Tsunematsu, and Y. Fukuta

32
Rice blast, caused by Pyricularia oryzae Cav., is the mostimportant and potentially damaging disease of rice (Oryzasativa L.). Breeding of rice varieties with durable resistanceto this disease is the most logical and environment-friendlyapproach. Major gene and partial resistance to diseases areknown in rice and other crops. In major gene resistance,there is incompatibility between the resistance gene in thehost and the avirulence gene in the pathogen. Partial resis-tance reduces the extent of pathogen reproduction withinthe context of a compatible interaction. Several strategiesto develop durable resistance to blast are possible. Thepyramiding of major genes for resistance, the accumulationof genes for partial resistance, the combination of major andpartial resistance genes, and the use of multiline varietiescomposed of isogenic lines with major resistance genes aresome feasible approaches.
Pathogenicity of IRRI blast isolates
Information about the virulence of rice blast isolates is im-portant for genetic studies and the breeding of resistant va-rieties. A set of international differential varieties for riceblast established by Atkins et al (1967) has been used invarious parts of the world. However, since genetic analysisof the resistance genes of the varieties is lacking, differen-tiation of races based on their avirulence could not be car-ried out. Two sets of differential varieties (Yamada et all976, Kiyosawa l984) have been used in Japan to identifyraces of the blast fungus. Each differential variety with oneresistance gene effective against Japanese races was selectedbased on genetic analysis. Shin 2, one of the differentials,carries Pik-s, which is not effective against Japanese iso-lates but is effective against a Philippine blast isolate(Kiyosawa 1969a). Pish was also identified in it by using aJapanese isolate (Imbe and Matsumoto 1985). It is not ef-fective against most of the Japanese isolates. The presenceof Pik-s and Pish in the differentials did not seem to beimportant in Japan. These sets enabled us to differentiateblast races based on their avirulence in Japan.
Blast resistance genes in most of the indica varieties,including IRRI-bred IR cultivars, have not been identifiedbecause of their complexities. Among Japanese varieties,14 alleles on 8 loci have been identified. Except for Pia,Pii, Pik-s, and Pish, the other 10 alleles have been intro-duced into Japanese varieties from indica donors. There-fore, those genes may also exist in indica varieties.
We have tested the pathogenicity of a few hundred blastisolates by inoculating them to Japanese differential variet-ies and IRRI near-isogenic lines (NILs) having known resis-tance genes. These blast isolates had been collected fromall over the Philippines or were found in the IRRI blastnursery. They were classified into around 30 differentpathotypes according to their pathogenicities. The patho-genicities of the blast isolates are usually used for the analysisof resistance genes of cultivars. Based on the results of in-oculation, the standard blast isolates are selected (Table 1).
The pathogenicity of these isolates had been analyzedby using Japanese differentials and IRRI NILs. Pia, Pib, Pit,Pi19(t), and Pik-s were resistant to a few isolates. Pish seemedto be moderately resistant to many isolates. Pii and Pi3(t)showed reaction patterns similar to each other. Pik, Pik-h,Pik-m, Pik-p, and Pi1 showed a lower number of moderatereactions and their patterns were also similar to one another.Piz, Piz-5, and Piz-t showed moderate reactions against manyisolates and their reaction patterns are also similar to oneanother. Pita, Pita-2, and Pi20 showed fewer moderate re-actions. According to these results, the virulence of eachresistance gene was not clear. Extra genes seemed to exist inthe differentials or NILs.
Developing monogenic lines for blast resistance
Varieties with a single but different resistance gene are idealas differentials for pathogenicity tests of a pathogen (Flor1956). A set of differential lines with a single known resis-tance gene was needed to identify the virulence of rice blastisolates. We therefore developed a set of lines with singlebut different blast resistance genes as monogenic lines. Aset of monogenic lines could be suitable for use as differen-tials for rice blast because of their superior ability for racedifferentiation. The monogenic lines can also be used forgenetic analysis of genes for blast resistance.
Pi19(t) was identified in the Japanese variety AichiAsahi (Hayashi et al 1998). This gene could not be incorpo-rated into the monogenic lines at IRRI as it was not effec-tive against any of the isolates at IRRI. Therefore, selectionof Pi19(t) and confirmation of the existence of Pia, Pik-s,and Pish in the lines were carried out at the National Agri-cultural Research Center (NARC) in Japan through the Ja-pan-IRRI shuttle research project.
To develop a line with a single blast resistance gene,we applied the backcross breeding method. Varieties andlines with known genes for resistance were used as donors.Lijiangxintuanheigu (LTH) was used as a recurrent parentin the backcrossing. LTH, which is a japonica variety fromYunnan Province in China, is highly susceptible to riceblast. No isolate incompatible with LTH was found in China(Ling et al 1995) and all of the blast isolates evaluated atIRRI so far were also compatible with the variety. No majorresistance gene for rice blast has been identified in LTH. Allof the materials were planted under long-day treatment toextend the growing period because most of the lines prob-ably carry the photosensitivity inherited from LTH. A 30-minute interruption of the dark period was performed as along-day treatment from 21 days after seeding (DAS) to 70–75 DAS.
To confirm the existence of a single resistance gene,BC
1F
2 populations and their selected progenies were inocu-
lated with suitable isolates. A maximum of 20 pregerminatedseeds of a line was used for the inoculations. Inoculationwas performed at the 4.0- to 4.9-leaf seedling stage by usingthe spraying method (Inukai et al 1994, Hayashi et al 1998).

33
Ta
ble
1.
Re
ac
tio
n p
att
ern
s o
f d
iffe
ren
tia
l va
rie
tie
s t
o P
hil
ipp
ine
bla
st
iso
late
s.a
Dif
fere
nti
al
va
rie
ty o
r d
on
or
of
resis
tan
ce
ge
ne
Gro
up
Iso
late
Ca
loro
K 5
9A
ich
i A
sah
iS
hin
2B
L1F
uji
sa
ka
C1
04
PK
TK
an
to 5
1K
3Tsu
yua
ke
K 6
0C
10
1 L
AC
Fu
ku
nis
hik
iC
10
1 A
51
Tori
de
1Ya
sh
iro
mo
ch
iR
eih
oIR
24
Pik
-sP
itP
iaP
ik-s
,P
ib,
Pii,
Pi3
Pik
Pik
-hP
ik-m
Pik
-pP
i1P
iz,
Piz
-5P
iz-t
Pit
aP
ita
-2P
i20
Pib
,
(?)
(Pik
-s)
Pi1
9(t
)P
ish
Pis
hP
ik-s
(Pia
)(P
ia)
Pis
h(P
ia)
(Pis
h)
(?)
(Pia
) P
ik-s
XX
IXb
B9
00
02
SS
RM
RS
RR
RR
RR
RR
RR
RR
XX
IXb
C9
23
-49
SS
RS
RS
RR
RR
RR
RR
RR
RR
IXb
BN
11
1S
SS
MM
RM
RR
RR
RM
RM
SR
R
XIV
aB
N2
09
SM
SM
RS
SR
RR
RR
RM
RR
RR
XX
IbJM
B8
40
61
0S
SS
RR
SS
RR
RR
RR
RR
RR
R
Ive
V8
60
10
RS
SM
RS
SR
RR
RR
RM
RS
RR
XX
VII
IV
85
01
96
RR
SR
–R
RR
RR
RR
RM
MR
RR
IIIK
81
-3M
SS
SR
SS
RR
RR
RR
MM
MR
S
XX
IK8
1-2
5R
SS
MM
RR
SS
SR
SR
MM
RR
S
VP
O6
-6S
SS
MM
RM
RR
RR
RR
RM
SS
S
IbC
a8
9S
SS
SM
SS
RR
RR
RM
RM
SS
S
IIIb
V8
50
25
6S
SS
MM
SS
RR
RR
RR
MR
MR
S
XV
IIb
M3
6-1
-3-1
0-1
–S
SR
RR
RS
RS
RM
RR
RS
R–
IIIa
M6
4-1
-3-9
-1S
SS
SM
SS
SS
SM
MM
RR
MR
S
IIIa
M3
9-1
-3-8
-1S
SS
SM
MM
SS
SS
MR
MR
MR
S
XIV
aM
10
1-1
-2-9
-1–
SS
MR
SS
RR
RR
RR
SR
RR
–
aR
= r
es
ista
nt,
S =
su
sc
ep
tib
le,
M =
mo
de
rate
ly r
es
ista
nt.

34
Each seedling was examined 5 to 7 days after inoculationusing a modified classification based on a 0–5 scale (Mackilland Bonman 1992). All the isolates of Pyricularia griseaused at IRRI were either maintained as stock cultures in theEntomology and Plant Pathology Division of IRRI or wereisolated from the blast nursery of IRRI. All the isolates usedat NARC were maintained at the Rice Pathology Labora-tory in NARC.
Only one resistance gene was transferred from a donorharboring more than one resistance gene. As an example,Aichi Asahi, one of the Japanese differential varieties, car-ries two blast resistance genes, Pia (Yamasaki and Kiyosawa1966) and Pi19(t) (Hayashi et al 1998). Aichi Asahi wasused as a donor for the two genes. Aichi Asahi was crossedand backcrossed with LTH. Twenty-four BC
1F
1 plants were
self-pollinated. The 24 BC1F
2 families were inoculated with
Ina72 (Av-a and Av-19+) and CHNOS58-3-1 (Av-a+ andAv-19) at NARC.
To select the monogenic line with Pia, a family thatshowed segregation for resistance to Ina72 and a suscep-tible reaction to CHNOS58-3-1 was selected. This familywas expected to be heterozygous for Pia but lacked Pi19(t).The same BC
1F
2 families were inoculated with B90002 (Av-
a and Av-19+) and C923-49 (Av-a and Av-19+) at IRRI. Thesegregation pattern of Pia in these lines was identical atboth NARC and IRRI. Nine resistant plants in the selectedBC
1F
2 family were self-pollinated. Among the nine BC
1F
3
lines, two lines were homozygous-resistant to B90002. Thus,these two lines were homozygous-resistant to Pia but didnot carry Pi19(t). From the two lines, seven resistant plantswere selected and self-pollinated. All of these BC
1F
4 lines
were homozygous-resistant to B90002. These BC1F
4 lines
were also inoculated with TH68-140 (Av-a and Av-19+) atNARC. All of the plants in each line were resistant to TH68-140. The homozygosity of Pia was thus confirmed. Theselines were self-pollinated until they were morphologicallyuniform.
To obtain a monogenic line with Pi19(t), three BC1F
2
families that showed segregation for resistance to CHNOS58-3-1 but a susceptible reaction to Ina72 were selected atNARC. These families, which were expected to be heterozy-gous for Pi19(t) but lacked Pia, were inoculated with B90002and C923-49 at IRRI. All the plants in these families weresusceptible to both isolates. Eight plants of the selectedfamilies were self-pollinated and BC
1F
3 lines were obtained.
Ten BC1F
4 lines were derived from each BC
1F
3 line. A total
of 80 BC1F
4 lines were tested with CHNOS58-3-1 at NARC.
Ten lines were found to be homozygous-resistant. Theselines were homozygous for Pi19(t) but did not have Pia.From the 10 BC
1F
4 lines, 22 plants were randomly selected
and self-pollinated. These 22 BC1F
5 lines were inoculated
with CHNOS58-3-1 and TH68-140 at NARC. All the plantsof these lines were resistant to CHNOS58-3-1. Twenty-onelines showed a susceptible reaction to TH68-140 and onlyone line was moderately resistant to this isolate. Two linesthat were resistant to CHNOS58-3-1 but susceptible to TH68-
140 were selected. These lines were self-pollinated untilthey were morphologically uniform.
To develop other lines, inoculation and selection withsuitable isolates were carried out in the same way as forAichi Asahi. Some of the lines were also backcrossed toeliminate unnecessary genes. From the 25 resistant donors,a total of 29 lines with single genes were developed (Table2). Monogenic homozygous lines for 23 known resistancegenes were obtained. These lines were designated as IRBL,followed by the resistance gene and an abbreviation for theresistant donor. For example, IRBLa-A is the monogenicline with Pia developed from Aichi Asahi.
Fourteen genes for blast resistance—Pia, Pii, Pik(Yamasaki and Kiyosawa 1966), Pita (Kiyosawa 1966), Pita-2 (Kiyosawa 1967a), Piz (Kiyosawa 1967b), Pik-s (Kiyosawa1969a), Pik-p (Kiyosawa 1969b), Pik-h (Kiyosawa and Murty1969), Piz-t (Yokoo and Kiyosawa 1970), Pib and Pit(Kiyosawa 1972), Pik-m (Kiyosawa 1978), and Pish (Imbeand Matsumoto 1985)—were identified in Japan. Mono-genic lines with all of these genes except for Pit were devel-oped. The monogenic line with Pit is under development.In accordance with the naming and symbolization of blastresistance genes, new blast resistance genes are designated
Table 2. Monogenic lines with different genes for blast resistance.
Line Resistance gene Donor Generation
IRBLa-A Pia Aichi Asahi BC1F10
IRBLa-C Pia CO39 BC1F10
IRBLi-F5 Pii Fujisaka 5 BC1F10
IRBLks-F5 Pik-s Fujisaka 5 BC1F10
IRBLks-S Pik-s Shin 2 BC1F10
IRBLk-Ka Pik Kanto 51 BC1F9
IRBLkm-Ts Pik-m Tsuyuake BC1F6
IRBLkp-K60 Pik-p K60 BC1F8
IRBLkh-K3 Pik-h K3 BC1F8
IRBLz-Fu Piz Fukunishiki BC1F10
IRBLz5-CA Piz-5(= Pi2(t)) C101A51 BC3F8
IRBLzt-T Piz-t Toride 1 BC1F10
IRBLta-K1 Pita(= Pi4(t)) K1 BC2F8
IRBLta-CT2 Pita C105TTP2L9 BC3F8
IRBLta-CP1 Pita C101PKT BC5F6
IRBLta2-Pi Pita-2 Pi No. 4 BC1F5
IRBLta2-Re Pita-2 Reiho BC1F6
IRBLb-B Pib BL1 BC1F8
IRBLsh-S Pish Shin 2 BC1F10
IRBLsh-B Pish BL1 BC1F8
IRBL1-CL Pi1 C101LAC BC3F8
IRBL3-CP4 Pi3 C104PKT BC2F8
IRBL5-M Pi5(t) RIL249a BC3F8
IRBL7-M Pi7(t) RIL29a BC3F8
IRBL9-W Pi9(t) WHD-IS-75-1-127 BC3F8
IRBL11-Zh Pi11(t) Zhaiyeqing 8 BC2F8
IRBL12-M Pi12(t) RIL10a BC2F8
IRBL19-A Pi19(t) Aichi Asahi BC1F10
IRBL20-IR24 Pi20 ARL24b BC1F6
aRecombinant inbred lines from a cross of CO39 and Moroberekan (Wang et al 1994).bRecombinant inbred line from a cross of Asominori and IR24 (Tsunematsu et al
1996).

35
as Pi followed by a numeral. Pi1 to Pi20 have been desig-nated (Kinoshita 1998). Monogenic lines with nine of thegenes—Pi1, Pi3, Pi5(t), Pi7(t), Pi9(t), Pi11(t), Pi12(t), Pi19(t),and Pi20—were developed. Mackill and Bonman (1992)developed NILs of CO39 with Pi1(t), Pi2(t), Pi3(t), Pi4-a(t),and Pi4-b(t). Inukai et al (1994) investigated the relation-ship between the resistance genes in the NILs of CO39 andthe Japanese differentials. It was found that Pi1 and Pi3were new genes. Pi2(t) was renamed as Piz-5 because it wasallelic to Piz. Pi4-a(t) was found to be identical to Pita.Wang et al (1994) identified and mapped Pi5(t) and Pi7(t)using recombinant inbred lines derived from the cross be-tween CO39 and Moroberekan. Hayashi et al (1998) identi-fied Pi19(t) in Aichi Asahi and Imbe et al (1997) reportedPi20 in IR24. Although Pi9(t), Pi11(t), and Pi12(t) are notregistered by the committee on rice gene symbolization ofthe Rice Genetics Cooperative, monogenic lines with theseresistance genes were developed. Brar and Khush (1997)reported Pi9(t) in an introgression line of Oryza minuta.Zhu et al (1993) identified Piz-h in Zhaiyeqing 8 and it wasrenamed as Pi11(t) (Kinoshita et al 1994). Inukai et al (1996)reported Pi12(t) in the recombinant inbred line. The remain-ing resistance genes identified recently have not yet beenincorporated into the monogenic lines. Monogenic resis-tant lines with only the major resistance genes were devel-oped and genes conferring partial resistance were not con-sidered in the development of monogenic lines.
The monogenic lines, their donors, and some of thedifferential varieties were inoculated with 12 representa-tive blast isolates at IRRI (Table 3). Both IRBLsh-S fromShin 2 and IRBLsh-B from BL1 for Pish showed a moder-ately resistant reaction to the isolates used and the linesdisplayed a broad spectrum of resistance to the Philippineisolates. Other blast isolates tested so far also showed thesame reactions to the gene. This result is contrary to thatobtained with Japanese blast isolates; most of these werecompatible to Pish. It is thus considered that Pish could beuseful as a source of durable resistance to blast in the Philip-pines. IRBL19-A, which carries Pi19(t) from Aichi Asahi,showed a susceptible reaction to all of the isolates. So far,we have not found any Philippine blast isolates that areincompatible to Pi19(t). Pi19(t) was identified in Aichi Asahiand other Japanese differentials against a blast isolate fromYunnan Province, China (Hayashi et al 1998). It was allelicor closely linked to the Pita locus.
IRBLk-Ka, IRBLkp-K60, IRBLkh-K3, IRBLkm-Ts,IRBL1-CL, and IRBL7-M showed almost the same reactionpattern to all the isolates used. Multiple alleles at the Piklocus (Pik, Pik-p, Pik-h, and Pik-m, except for Pik-s), Pi1and Pi7(t), could not be differentiated using these isolates.Other isolates not listed in the table also showed the samereactions to the genes, and we have no isolate to distinguishthese genes from each other at IRRI. Till distinguishableisolates are identified, these genes are designated Pik* inthis report. The Pi1 gene was closely linked to the Pik locus(Inukai et al 1994), and Pi7(t) was found to be allelic or
closely linked to Pi1 (Wang et al 1994, Inukai et al 1996).Therefore, the origin of these genes was presumed to be thesame.
IRBLi-F5 and IRBL3-CP4 showed almost the same re-action pattern to the isolates used. The isolates could notdifferentiate between Pii and Pi3. The Pii and Pi3 geneswere closely linked to each other (Inukai et al 1994). There-fore, the two genes should also be treated as one. The Pi5(t)gene showed a tendency similar to that of Pii and Pi3 interms of reaction to the isolates (Wang et al 1994, Inukai etal 1996). However, the line with Pi5(t) showed a higherresistance level than those with Pii and Pi3. We have toconfirm the resistance pattern of the Pi5(t) gene by inocu-lating the NILs with Pi5(t) because we could not knowwhether the line possesses extra genes for a moderate reac-tion or whether Pi5(t) itself showed higher resistance. IRBL9-W, with Pi9(t) from WHD-IS-75-1-127, showed a resistantreaction to almost all the isolates used.
The reaction patterns of almost all of the donors anddifferential varieties could be explained on the basis of thereaction patterns of the monogenic lines or combination ofthe lines. However, resistant reactions of some of the donorswere higher than expected. For example, BL1 has Pib(Yokoo et al 1978) and Pish (Imbe and Matsumoto 1985). Itwas used as a donor for these genes. IRBLb-B for Pib andIRBLsh-B for Pish were derived from BL1. The resistancepattern of BL1 was different from that expected from thecombined resistance of Pib and Pish. BL1 was resistant tothe isolates PO6-6, Ca89, BN111, M36-1-3-10-1, andV850196, whereas IRBLsh-B was moderately resistant tothese isolates and IRBLb-B was susceptible, presumablybecause of complementation of Pib and Pish, or the pres-ence of other genes in BL1.
RIL249 is one of the recombinant inbred lines withPi5(t) derived from a cross between CO39 and Moroberekan(Wang et al 1994). RIL249 may also have inherited Piafrom CO39. RIL249 was resistant to the isolates B90002and C923-49, to which IRBL5-M was susceptible. IRBLa-C was resistant to these isolates. From the reaction patternsof RIL249, IRBL5-M, and IRBLa-C, we conclude thatRIL249 has Pia. Resistant or moderately resistant reactionsof RIL249 to the isolates BN209, M36-1-3-10-1, and M101-1-2-9-1 could not be explained by the combined reaction ofPia and Pi5(t). The higher resistance of RIL249 can be as-cribed to either complementation of Pia and Pi5(t) or to thepresence of an additional gene or genes for resistance be-sides Pia and Pi5(t).
Zhaiyeqing 8 is the donor of Pi11(t) in IRBL11-Zh(Zhu et al 1993). This donor showed a resistant or moder-ately resistant reaction to the isolates PO6-6, IK81-25,V850196, and M64-1-3-9-1, which were compatible withIRBL11-Zh. These results indicated that Zhaiyeqing 8 mightharbor a resistance gene or genes in addition to Pi11(t).
The monogenic lines we developed could be useful forstudying the pathogenicity of blast isolates and this infor-mation could contribute to the elucidation of genetic as-

36
Table 3. Reactions of monogenic lines, their donors, and differentials to selected Philippine blast isolates.
Line/ Resistance Reaction to isolatea
variety gene
1 2 3 4 5 6 7 8 9 10 11 12
IRBLa-A Pia S S S S S S R R S S S S
IRBL19-A Pi19(t) S S S S S S S S S S S MS
Aichi Asahi Pia, Pi19(t) S S S S S S R R S S S S
IRBLa-C Pia S S S S S S R-M R S S S S
CO39 Pia S S S S S S R R S S S MS
IRBLi-F5 Pii M S R-M S R S S S R S S S
IRBLks-F5 Pik-s S S S S S S S S R R S S
Fujisaka 5 Pii, Pik-s R-M S R S R S MS S R R S M-S
IRBLks-S Pik-s M S S S S S MS-S S R R S S
IRBLsh-S Pish R-M M-MS R-M R-M R R-M R-M M M R-M R-M M-MS
Shin 2 Pik-s, Pish M M M R-M R R M M-MS R R M-MS M
IRBLk-Ka Pik R R S R R S R R R R S R
IRBLkp-K60 Pik-p R R S R R S R R R R S R
IRBLkh-K3 Pik-h R R S R R S R R R R S R
IRBLkm-Ts Pik-m R R S R R S R R R R S R
Kanto 51 Pik R R S R R S R R R R S R
IRBLz-Fu Piz R-M M M R-M S R R-M M MS M M MS
Fukunishiki Piz, Pish R M R R R R R R R R-M R-M R
IRBLz5-CA Piz-5 R-M R-M R-M R-M R R R-M R R-M R-M R-M S
C101A51 Piz-5 (Pia) R R M R-M R R R R R R R M-MS
IRBLzt-T Piz-t S S R-M S S S R R S R R S
Toride 1 Piz-t (Pish) M M R M M R-M R R M R R M
IRBLta-K1 Pita S S R-M M-S S S R S R S R S
IRBLta-CT2 Pita S S MS-S S S S R S R S R S
IRBLta-CP1 Pita S S R S S S M S R S R-M S
Yashiromochi Pita S S R MS S R-M R S R S R S
IRBLta2-Pi Pita-2 S S R R R R R S R R R R
IRBLta2-Re Pita-2 S S R R R R R S R R R R
Reiho Pita-2, Pi a S S R R R R R R R R R R
IRBLb-B Pib S S S R S S R R S R-M S R
IRBLsh-B Pish M M-S M M M M M S M R-M MS MS
BL1 Pib, Pish R R R-M R R R R R R R M R
IRBL1-CL Pi1 R R S R-M R S R R R R S R
C101LAC Pi1 (Pia) R R S R R S R R R R S R
IRBL3-CP4 Pi3 R S R S R S S S R S S MS
C104PKT Pi3 (Pia) R S M S R MS-S R R R S S M-MS
IRBL5-M Pi5(t) S S R S R S M-MS MS-S R MS-S S MS
RIL 249 Pi5(t) MS-S MS-S R R R M R R R MS S R
IRBL7-M Pi7(t) R R S R R S R R R R S R
RIL 29 Pi7(t) R R S R R MS R R R R S R
IRBL9-W Pi9(t) R R M R R R R R R R-M R R
WHD-IS-75-1-127 Pi9(t) R R R-M R R R R R R-M R R-M R
IRBL11-Zh Pi11(t) S S S R S S R-M R S M S R
Zhaiyeqing 8 Pi11(t) M MS-S R R MS M-MS R R R R R R
IRBL12-M Pi12(t) S S S R S S R-M R S MS-S S R
RIL 10 Pi12(t) S S S R S MS-S R R M-MS M S R
IRBL20-IR24 Pi20 S S S S R R R R S R S S
ARL 20 Pi20 S S S S R R R R S R S S
a1 = PO6-6, 2 = Ca89, 3 = IK81-25, 4 = BN209, 5 = BN111, 6 = M36-1-3-10-1, 7 = B90002, 8 = C923-49, 9 = V850196, 10 = V86010, 11 = M64-1-3-9-1, 12 = M101-1-2-9-1.
Reactions: R = resistant, M = moderately resistant, MS = moderately susceptible, S = susceptible.
pects of rice blast. A set of NILs is the most suitable materialfor race differentiation. We have begun developing NILswith single resistance genes. However, it may take time toestablish them. A set of monogenic lines could be suitablefor use as differentials for rice blast until a set of NILs iscompleted. These monogenic lines will be distributed as
candidates for blast differentials to scientists working onrice blast in collaboration with the International Networkfor Genetic Evaluation of Rice (INGER). Global applicabil-ity of the monogenic lines as differentials for blast will beevaluated through international collaboration.

37
Studies on partial resistance to rice blastin the tropics
Partial resistance to blast in the tropics is not well studiedfor two reasons. First, most of the studies concerning partialresistance were carried out in Japan and published in Japa-nese journals (Yunoki et al 1970, Asaga 1981, Shindo andAsaga 1989, Higashi 1995, Kiyosawa and Ando 1997, Naitoand Yaegashi 1997). Second, partial resistance of the vari-ety must be evaluated under the conditions where the typeand number of major genes for resistance are known. Untilrecently, information on the presence of major genes in tropi-cal varieties was lacking. For example, the number of majorresistance genes in IR36 was not known. In addition, theinteraction of natural or purified blast isolates with majorgenes for resistance (pathogenicity) was not known in thetropics until recently. This information is necessary to over-come the effect of major resistance genes for evaluatingpartial resistance.
Ikehashi and Kiyosawa (1981) studied partial resistanceof Japanese rice varieties against blast isolates from the trop-ics. They introduced Philippine blast isolates to Japan andstudied the partial resistance of Japanese varieties againstthose isolates in the field. However, they could not elimi-nate the effect of Pish, which was not known at that time.Pish was reported by Imbe and Matsumoto (1985) and it iswidely distributed among Japanese varieties. It showedmoderate resistance against all blast isolates from the Phil-ippines (Imbe et al 2000, Tsunematsu et al 2000). Bonmanand Bandong (1989) studied partial resistance in the trop-ics. They equated moderately resistant reactions with par-tial resistance. However, moderately resistant reactions arenot always equivalent to partial resistance (Imbe et al 2000).Wang et al (1994) also tried to identify partial resistance inthe tropics. They used Moroberekan and CO39 recombi-nant inbred lines. Unfortunately, they could not obtain theblast isolates virulent against Moroberakan, which is sup-posed to possess several major resistance genes. Moreover,they used blast isolate PO6-6 to distinguish between plantswith major genes for resistance (those with no disease symp-toms) and partial resistance (those with moderately resis-tant reactions). However, the isolate they used showed mod-erately resistant reactions on varieties with Pii, Pi3, Piz,Piz-5, and Pish (Imbe et al 2000, Tsunematsu et al 2000).These moderately resistant reactions are due to major genesfor resistance and the reactions are specific between PO6-6and the major genes. As a result, Imbe et al (2000) andTsunematsu et al (2000) could not clearly distinguish par-tial resistance from major gene resistance. Studies on du-rable blast resistance in a sequential planting experimentwith 2- or 4-week seeding intervals were conducted at IRRI(IRRI 1994). Partial resistance could not be clearly distin-guished from major gene resistance because informationabout blast population dynamics was lacking.
Imbe et al (2000) and Ebron et al (2004) recently iden-tified major genes for resistance in IR varieties. At the sametime, the pathogenicities of Philippine blast isolates were
determined against known major resistance genes (Imbe etal 2000, Tsunematsu et al 2000). These important break-throughs enabled us to carry out our study successfully. Byselecting suitable blast isolates, we could eliminate the ef-fect of major resistance genes and evaluate the partial resis-tance of rice varieties. International differential lines withsingle resistance genes for rice blast were also developed(Tsunematsu et al 2000). We could monitor the pathogenic-ity of blast isolates in the field by using these lines. Byusing this information and materials, we tried to identifythe partial resistance of IR varieties in the tropics.
Materials and methods
Inoculation and disease evaluation
The sporulation of blast and production of lesions on plantsare necessary conditions for the evaluation of partial resis-tance because partial resistance reduces the extent of patho-gen reproduction. We prepared the plots by surroundingthem with 2-m-high plastic fences to prevent the migrationof blast spores from other fields and natural populations(Fig. 1). These fences were also effective in diminishingwind velocity in the plots. A less windy condition favorsthe multiplication of blast spores. We planted spreader rowsof susceptible varieties that were inoculated with blast iso-lates to encourage the multiplication and spread of diseaseto the test rows. One blast isolate was inoculated to eachspreader row, which was the first row in a plot. Inoculationwas done in the evening at the fourth-leaf stage by spraying240 mL m–2 spore suspension, adjusted to approximately 1× 10⁵ spores mL–1. During inoculation, plastic barriers be-tween rows were installed to prevent the escape of blastspores to other rows. Inoculated rows were covered withplastic sheets until the next morning to maintain moistureon the leaves.
Two experiments were conducted at IRRI, Los Baños,Laguna, Philippines. Experiment I was conducted from Janu-ary to March 1999, when the average temperatures wererelatively low. Experiment II was conducted from Octoberto December 1999. To reduce sunlight and keep high hu-
���
������
����������� ���������
�����
�����
�����
�����
�����
�����
�����
� ������� �����������
�������
�������
�������
����
������
Fig. 1. Plot design of experiment I.

38
midity in the plots, double-layered cheesecloth was installedat 2-m height above the plots. Sunlight penetration rateswere 57.8% and 32.4% in experiments I and II, respectively.Seedlings were grown on raised beds like upland paddyfields. Plants were irrigated by using steel pipes with holesseveral times a day. The cheesecloth was made wet from0800 to 0900 but we made sure blast spores were not washedoff the leaves. Disease intensity was evaluated using theStandard Evaluation System (SES, IRRI 1996) for rice (Table4).
Experiment I
Seventy varieties and breeding lines were used in experi-ment I (Table 5), 34 of which are IRRI or Philippine SeedBoard-released varieties. Twenty-four were differential lineswith single genes for blast resistance (Tsunematsu et al 2000).By using these lines, we could confirm the pathogenicity ofthe inoculated blast isolates in the plots. CO39 is a blast-susceptible indica variety. IR49830-1-7-2-2 is an elite linesuitable for rainfed lowland conditions. Ten japonica vari-eties and lines were also included. Each plot was inoculatedwith blast isolates PO6-6 and BN111 on 3 February 1999.Both of these isolates were collected in the Philippines andmaintained at IRRI. The major genes for resistance of thematerials used and the expected major resistance gene reac-tions are shown in Table 5 (Imbe et al 2000, Ebron et al2004).
Each plot had four rows. All 70 varieties and breedinglines were sown with check variety IR50 alternately (Fig.2). IR50 is susceptible to blast (Bonman and Mackill 1988).In five long horizontal rows, we seeded a mixture of IR52and CO39 seeds. One hundred seeds were sown in a 30-cmslot about 3 cm deep. The seeding of the first row (spreaderrow) was done on 15 January 1999. The second to fourthrows were sown on 25 January. A total of 240 kg N ha–1 wasapplied in four split doses at 10-d intervals starting from theday of seeding. An additional 80 kg of ammonium sulfateha–1 was applied to the second to fourth rows on 24 Febru-
ary. Leaf blast disease was evaluated twice a week from 10February to 9 March using the SES. Blast-damaged areas onthe third leaf of six plants of each variety were measured.Sampling was done on the first row on 16 February and onthe second to fourth rows on 1 March.
Experiment II
Fifty varieties and lines were used in experiment II (Table5). IR64 and US-2 were additional entries. IR64 has Pita,Pi20, Piz-t, Pib, and Pik-s major genes for resistance. US-2is a japonica susceptible line with no major resistance gene.Blast isolates PO6-6 and M36-1-3-10-1 (M36) were usedfor inoculating each plot. M36 was collected from the Phil-ippines and stored in the Entomology and Plant PathologyDivision at IRRI.
Each plot had four rows. All 50 varieties and breedinglines were sown with check variety IR50 (Fig. 3). The rowratio of IR50 to test entries was 1 to 2 in this experiment. Wealso seeded IR50 in five long horizontal rows. One hundredseeds were sown in a 30-cm seeding slot about 3 cm deep,the same as in experiment I. Seeding of the first row (spreaderrow) was done on 27 October 1999. The second to fourthrows were sown on 3 November. A total of 320 kg N ha–1 wasapplied in four split doses at 10-d intervals starting from theday of seeding. Leaf blast disease was evaluated twice aweek using the SES, from 6 to 20 December. The damagedarea on the third leaf of six plants of each variety was mea-sured. Sampling was done on the first row on 15 December.
Results
Experiment I
The spreader rows were inoculated on 3 February 1999. Thefirst lesions were observed 5 d after inoculation or on 8February. Six days later, or on 14 February, lesions wereobserved on the second to fourth rows, where artificial in-oculation was not done. Lesions were observed on the samedays in both plots inoculated with different blast isolates.
Table 4. SES leaf blast scoring data for isolate BN111.
Variety Scoring date
Entry no. or breeding
line 10 Feb 16 Feb 19 Feb 23 Feba 26 Feb 2 Mar
Check IR50 5 7 7 8 9 9
PR-1 IR5 5 5 6 6 6 6
Check IR50 6 7 7 8 9 9
PR-2 IR8 2 4 4 5 5 5
Check IR50 6 7 8 8 9 9
PR-3 IR20 6 6 7 7 7 8
Check IR50 6 7 8 8 8 9
aThe data on this day were used in this row. 0 = no lesions observed; 1 = small brown specks of pin-point size or larger brown specks;
2 = small roundish to slightly elongated, necrotic gray spots about 1–2 mm in diameter with a distinct brown margin. Lesions are
mostly found on the lower leaves; 3 = lesion type is the same as in scale 2, but a significant number of lesions are on the upper
leaves; 4 = typical susceptible blast lesions 3 mm or longer, infecting less than 4% of the leaf area; 5 = typical blast lesions infecting
4–10% of the leaf area; 6 = typical blast lesions infecting 11–25% of the leaf area; 7 = typical blast lesions infecting 26–50% of
the leaf area; 8 = typical blast lesions infecting 51–75% of the leaf area and many leaves dead; 9 = more than 75% of the leaf area
affected.

39
Table 5. Partial resistance of IR varieties and monogenic lines.a
Variety or Estimated major Feb 1999 Dec 1999 Ranking of
breeding resistance Av partial
line gene PO6-6 BN111b PO6-6b M36b resistance
IR5 ta,b 1.75 1.76 1.40 0.87 1.45 6
IR8 20,b,k-s 1.50 R 1.40 R 1.45 5
IR20 b,k-s 0.00 –0.05 – – –0.03 41
IR22 20,b,k-s 0.25 R – – 0.25 36
IR24 20,b,k-s,a 1.38 R 0.76 R 1.07 11
IR26 20,b,k-s 2.00 R 1.63 R 1.82 1
IR29 z-t,b,k-s 1.50 0.86 –0.05 –0.01 0.57 27
IR30 b,k-s –0.38 –0.83 0.07 0.33 –0.20 44
IR32 ta,b 0.25 0.08 – – 0.16 38
IR34 z-t,b,k-s,a,? 0.75 0.21 0.82 0.37 0.54 28
IR36 ta,z-t,b,k-s,? 0.63 0.21 0.24 0.08 0.29 35
IR38 ta,b 0.50 –0.18 – – 0.16 39
IR40 ta,b 0.63 0.60 – – 0.61 25
IR42 ta,b 0.75 1.24 0.65 0.33 0.74 21
IR43 20,b 1.63 R 1.75 R 1.69 2
IR44 ta,b 0.00 0.60 – – 0.30 34
IR46 ta,20,b,k-s,? 0.88 R 0.99 R 0.93 15
IR48 ta,20,b 0.88 R - - 0.88 16
IR50 ta,b –0.13 –1.22 0.01 0.05 –0.32 46
IR52 ta,b 0.38 0.99 – – 0.68 23
IR54 ta,b,? M M – – – –
IR56 ta,k* R R – – – –
IR58 ta,b 1.50 0.99 0.47 0.02 0.74 20
IR60 ta,z-t,b,k-s,? 0.50 0.99 0.07 0.27 0.46 31
IR62 ta,b 0.63 0.47 0.59 0.21 0.47 30
IR64 20,ta,z-t,b,k-s,? – – 1.25 R 1.25 7
IR70 ta,k* R R – – – –
IR72 ta,b 0.75 –0.44 0.70 0.40 0.35 33
IR74 20,k*,b,a R R – – – –
PSBRc 1 k* R R – – – –
PSBRc 2 20,b,k-s,a,z-t,? R R – – – –
PSBRc 4 ta,b,? 0.50 M 1.17 0.90 0.86 17
PSBRc 10 20,ta,i,b M R – – – –
PSBRc 18 20,ta,i,b M R – – – –
PSBRc 20 20,ta,i,b M R – – – –
IRBLa-A a 0.63 1.50 0.13 0.78 0.76 18
IRBLa-C a –0.5 –0.31 –0.45 0.24 –0.26 45
IRBLi-F5 i M M M M – –
IRBLks-F5 k-s 1.00 0.60 0.24 0.15 0.50 29
IRBLks-S k-s,? M M M 0.71 0.71 22
IRBLk-ka k R R R 0.75 0.75 19
IRBLkp-K60 k-p R R R 1.25 1.25 8
IRBLkh-K3 k-h R R R 1.13 1.13 9
IRBLz-Fu z M M M M – –
IRBLz5-CA z-5 M R M M – –
IRBLzt-T z-t –0.38 –0.31 0.18 0.27 –0.06 42
IRBLta-K1 ta 1.75 2.04 1.28 1.13 1.55 4
IRBLta-CT2 ta –1.00 –1.35 –0.57 0.33 –0.65 49
IRBLb-B b –0.25 0.86 0.99 0.81 0.60 26
IRBLt-K59 + 0.63 1.37 1.05 0.71 0.94 14
IRBLsh-S sh M M M M – –
IRBLsh-B sh M M M M – –
IRBL1-CL 1 R R R 0.97 0.97 13
IRBL3-CP4 3 M M M M – –
IRBL5-M 5(t) R R R M – –
IRBL7-M 7(t) R R R 0.08 0.08 40
IRBL9-W 9(t) R R R R – –
IRBL12-M 12(t) –1.00 0.08 –0.63 –0.17 –0.43 47
IRBL19-A 19(t) 0.75 0.99 0.30 0.43 0.62 24
CO39 a –1.5 –2.5 –0.28 –0.08 –1.09 50
continued on next page...

40
Table 5 continued.
Variety or Estimated major Feb 1999 Dec 1999 Ranking of
breeding resistance Av partial
line gene PO6-6 BN111b PO6-6b M36b resistance
IR49830-7-1-2-2 k-s,b 0.00 –0.05 0.59 0.46 0.25 37
LTH + 0.25 0.73 0.36 0.46 0.45 32
US-2 + – – –1.15 0.08 –0.53 48
Aichi Asahi a,19(t) 0.00 –0.31 0.01 0.02 –0.70 43
Fujisaka 5 i,k-s M M – – – –
Kanto 51 k R R – – – –
Tsuyuake k-m,sh R R – – – –
Yashiromochi ta,? 0.88 M 1.34 M 1.11 10
Reiho ta-2,a 1.13 R 0.99 R 1.06 12
K59 t,k-s 1.13 2.28 1.57 1.28 1.57 3
Norin 6 k R R – – – –
Zenith z,a M M – – – –
LSD (5%) 1.06
aR = resistant, M = moderately resistant. – = evaluation not done.bLevels of partial resistance were transformed to equivalent values for PO6-6 in February by the regression formulas.
��������������
��������������
��������������
� � � �
!�
�����
�����
�����
"���"���
������
�����
�����
�# �� �! �� �! ��
���
�� �� �"
Fig. 2. Row pattern used in the blast nursery of experiment I. * = check variety IR50.
��������������
��������������
��������������
� � � �
�"�
�����
�����
�����
"���"���
������
�����
�����
��# ��� ��� !# !� !!
���
!� !� " !� !"
��! !�
Fig. 3. Row pattern used in the blast nursery of experiment II. * = check variety IR50.

41
The period from conidia attachment to the formation of le-sions was about 6 days in this experiment. Kato and Kozaka(1974) reported that at 25–32 °C, the number of conidia perlesion was highest on the third day after the appearance oflesions. The first peak of sporulation was estimated on 10February and the second one on 16 February. The clearestdifferences in blast damage between susceptible check IR50and the test materials were observed from late February toearly March. We analyzed the data from that period. Thecycles of blast sporulation were considered to be third tofourth generations at that time. Most of the seedlings ofIR50 died by early March.
A part of the SES-based leaf blast scores are shown inTable 4. The control and the test materials got blast damagegradually. We chose the scores of 23 February for blast dam-age estimation of each entry in this row. Resistance levelwas calculated as the difference between the blast scores ofeach variety and the adjacent IR50 check. For example, theresistance level of IR5 was 2, which was calculated as fol-lows: (8 + 8)/2 – 6 = 2. We measured blast damage based ondamaged leaf area using the SES. The correlation coeffi-cient between the percent blast-damaged leaf area actuallymeasured and SES scores was 0.811 and highly significant.We used 578 pairs of data for this calculation.
The distribution of resistance to isolate PO6-6 is shownin Figure 4. The lowest score was –1.5 (CO39) and the high-est was 6.4 (PSBRc10). We sorted out partial resistance frommajor gene resistance. According to our results, all the en-tries distributed on the right-hand side of the arrow hadincompatible major resistance genes for PO6-6. Amongthem, the lowest resistance level was 2.1 (Norin 6 with in-compatible gene Pik). There were no known blast-incom-patible major resistance genes in all the other varieties andlines on the left-hand side of the arrow. The highest score(2.0) was seen in IR26 and the average was 0.54.
The lowest score for isolate BN111 was –1.4 (CO39)and the highest was 7.9 (IR74). The distribution of majorgene and partial resistance did not overlap (data not shown).All the entries on the right-hand side of the distribution hadincompatible major resistance genes for BN111. The lowestresistance level among them was 3.3 (IRBLks-S with un-known gene). There were no known blast-incompatiblemajor resistance genes in all the other varieties and lines.Their average score was 1.41. K59 had the highest score(3.3).
The pathogenicities of blast isolates used were moni-tored throughout the period by the evaluation of IRBL lineswith single genes for resistance. They were consistentthrough the evaluation (data not shown).
Experiment II
The spreader rows were inoculated on 12 November 1999.The first lesions were observed on 16 November or 4 d afterinoculation. Second-generation lesions were observed on23 November on the second to fourth rows. The time courseof blast infection was almost the same as that in experimentI. However, growth of seedlings in the spreader rows was not
good and blast infection in all the rows was less than that inexperiment I. Differences in blast damage based on SESscores were most distinct between susceptible check vari-ety IR50 and the test entries observed on 10 and 20 Decem-ber. At that time, blast sporulation cycles were consideredat the fourth to sixth generations.
The correlation coefficient between the percent blast-damaged leaf area actually measured and SES scores was0.678 and highly significant. We used the data from 73varieties and lines for this calculation. The lowest score forisolate PO6-6 was –2.2 (US-2) and the highest was 6.9(IRBL3-CP4). The distribution of major gene resistance andpartial resistance overlapped slightly (data not shown). Thelowest score for major gene resistance was 1.3 (IRBL7-Mwith Pi7(t)). Among varieties and lines without incompat-ible resistance genes, 3.3 (IR43) was the highest score andtheir average was 1.04. The lowest score for isolate M36was –0.6 (IRBL12-M) and the highest was 8.3 (IRBL5-M).Major gene and partial resistance overlapped slightly (datanot shown). The lowest score of major gene resistance was3.8 (IR8 with Pi20). Among varieties and lines without in-compatible resistance genes, 4.56 (K59) was the highestscore and their average was 1.66.
The pathogenicities of blast isolates used were moni-tored throughout the period by the evaluation of IRBL lines.They were consistent through the evaluation (data notshown).
Discussion
Partial resistance to rice blast is not well studied in the trop-ics because the pathogenicity of blast isolates in the tropicswas not well known until recently. Without sufficient knowl-edge about pathogenicity, it is impossible to distinguishbetween partial resistance and major gene resistance. In thisstudy, moderate levels of resistance governed by major genesshowed a higher resistance level than partial resistance, eventhough a limited level of overlapping was observed. Wanget al (1994) used blast isolate PO6-6 to distinguish major
$� � ���������%&���
�
�
�
�
�
��
��
��
�� �� � � � � � " � ! � #
'(�)������*������� ���������
Fig. 4. Distribution of resistance to rice blast isolate PO6-6,
February 1999.

42
gene resistance from partial resistance. The results of ourstudy indicated that their supposed partial resistance basedon a moderate level of resistance was different from partialresistance. In addition, the isolate they used showed moder-ately resistant reactions against Pii, Pi3, Piz, Piz-5, and Pish(Imbe et al 2000, Tsunematsu et al 2000). Those moderatereactions were in fact due to major genes and the resistanceof these genes to the blast isolates was specific. Thus, ours isthe first report to clearly distinguish partial resistance frommajor gene resistance in the tropics.
The highest SES score of partial resistance observed inthis study was 4.56 of K59 against M36. Almost all thevarieties with blast-compatible reactions died in experimentI, even though they showed the highest level of partial re-sistance. On the other hand, plants with major gene resis-tance had almost no blast damage. However, under fieldconditions, even a low level of partial resistance is expectedto be more effective than in this study. In a commercial fieldwhen a partially resistant variety is cultivated, the densityof blast spores is much less than in this experiment becausethere is no surrounding susceptible variety such as IR50 asin this experiment. Newly introduced major genes for resis-tance were easily broken down within several years of in-tensive cultivation in blast-prone areas in Japan (Fujita1997) and Korea (Chang 1994). Partial resistance is consid-ered effective and indispensable for reducing the use of fun-gicides for blast control in Japan. To evaluate partial resis-tance of each variety or breeding line, major gene resistanceis often considered as an obstacle.
Partial resistance, also known as horizontal resistance,is expressed against all compatible blast isolates (Yunoki etal 1970, Asaga 1981). A positive and highly significantrelationship was observed between partial resistance to blastisolates PO6-6 and BN111 in a February 1999 experiment (r= 0.780**). For this calculation, we selected 32 varieties orlines that are compatible to both isolates. In the rest thathave major genes for resistance, there was no significantcorrelation between the resistance to PO6-6 and BN111 (r =0.277). This is because major genes confer vertical resis-tance. In this study, partial resistance was horizontal as elabo-rated by Asaga (1981) in Japan. Our results are differentfrom those of Ou (1979), who reported that partial resis-tance of Japanese varieties was vertical. His results wereobtained without knowledge about the existence of themajor gene Pish in Japanese varieties.
Correlation coefficients among partial resistance to dif-ferent blast isolates and seasons are shown in Table 5. Forthis calculation, we selected 24 varieties or lines that arecompatible to three isolates. Among the three blast isolatesover two seasons, we always observed significant positivecorrelations. These results strongly indicate that partial re-sistance is also horizontal in the tropics. The correlationcoefficients were relatively high in the same season (0.79**and 0.78**). These correlation coefficients were even higherthan that of the same isolate for different seasons, which was0.68**. These results suggest that partial resistance may beslightly modified by seasonal and varietal factors.
There were significant positive correlations betweenpartial resistance for different seasons and isolates, but therewere large differences among their averages. By using re-gression equations, we transformed the partial resistance toM36, BN111, and PO6-6 (December 1999 experiment) tothe equivalent of the partial resistance to PO6-6 in the Feb-ruary 1999 experiment (Table 6).
Durable blast resistance was studied at IRRI in sequen-tial planting (IRRI 1994). Even though information aboutblast population dynamics was lacking, IR64 was reportedto have lower disease severity in all 15 sequential crop cycles.Intermediate levels of infection on IR36 and IR60 weremaintained throughout the whole duration of planting.CO39 and IR50 had higher disease severity. These observa-tions were quite consistent with the results of this study.Among the 50 varieties and lines studied, IR64 ranked 7thin level of partial resistance, and IR60 and IR36 were 31stand 35th, respectively. IR50 and CO39 were 46th and werethe lowest. Aichi Asahi is known to have very low partialresistance in Japan and so does US-2 (Hayashi, personalcommunication). Yashiromochi is also ranked “low” andReiho is ranked “slightly low” for partial resistance. Theranking of Yashiromochi and Reiho for partial resistance inJapan is not completely consistent with the results of thisstudy. However, the difference is small. We conclude thatthe results of the present study are quite consistent withpartial resistance evaluations done in Japan in the past.
Wang et al (1994) reported that more than 80% dis-eased leaf area of CO39 was observed in the Philippines.Bonman and Bandong (1989) reported slower diseaseprogress in the Philippines than in Korea. Induction of seri-ous blast infection is not always possible in the Philippines.In experiment I, a very serious blast infection was inducedand most of the susceptible plants died within 1 mo afterinoculation. This success could be attributed to the specialshading and irrigation method used and to the applicationof a large amount of fertilizer. On the other hand, blast in-fection in experiment II was not so severe. There are threepossible explanations for this. First, the temperature washigher during experiment II than during experiment I. Feb-ruary is one of the coolest months in Laguna, Philippines.Cool weather is favorable for blast sporulation (Kato andKozaka 1974). Second, the shading in experiment II wastoo strong to induce good blast infection. The light pen-etration in experiment II was almost half that in experimentI. Third, seedling growth in the spreader rows was not so
Table 6. Correlation coefficients among partial resistance to
different blast isolates over two seasons.
Feb 99 Dec 99
Date Isolate
BN111 PO6-6 M36
Feb PO6-6 0.79** 0.68** 0.43*
Feb BN111 0.69** 0.66**
Dec PO6-6 0.78**

43
good and blast sporulation was affected by smaller leaf de-velopment of the spreader rows.
Disease score was recorded following the SES and thepercentage of damaged leaf area. The correlation coefficientswere high and significant. However, many points were dis-tributed far from the regression equations (scatter diagramnot shown). This could be the result of a too small samplingsize of the damaged leaf area. We took six plants and mea-sured the leaf area affected of the third leaf of each plantonly. These measurements required much labor even with asmall number of plants. In the case of the SES evaluation,we evaluated around 50–80 plants per variety at one glance.This evaluation was quite easy. Moreover, SES evaluationresults were quite reliable, even though assessments weredone on different days.
Strategy for breeding rice varietieswith durable resistance to blast
Newly introduced major genes for blast resistance were eas-ily broken down within several years of intensive cultiva-tion in blast-prone areas such as those in Japan (Yamada1965) and Korea (Chang 1994). We consider that this phe-nomenon is inevitable when using accumulations orpyramidings of major genes. To avoid this risk, it is impor-tant to evaluate the partial resistance of varieties. To evalu-ate them in each country, the following steps are needed.Our study has shown that this can be done.1. Collecting and stocking as many as a few hundred indig-
enous blast isolates.2. Evaluating their pathogenicities by using monogenic
lines.3. Reconstructing monogenic lines in each country. As
shown in this report, Pish and Pik-s in Japanese differen-tial varieties are not very effective in Japan, but they areincompatible in the Philippines. Our monogenic linesmay have new unknown genes in them against blast racesin a newly introduced area. If they do, reconstructing ofmonogenic lines is necessary.
4. Studying the major genes in major varieties by usingcross combinations among monogenic lines and majorvarieties (Toriyama et al 1983).
5. Evaluating partial resistance of major varieties and breed-ing lines.
References
Asaga K. 1981. A procedure for evaluating field resistance toblast in rice varieties. J. Cent. Agric. Exp. Stn. 35:51-138.
Atkins JG, Robert AL, Adair CR, Goto K, Kozaka T, YanagidaR, Yamada M, Matsumoto S. 1967. An international set ofrice varieties for differentiating races of Pyricularia oryzae.Phytopathology 57:297-301.
Bonman JM, Mackill DJ. 1988. Durable resistance to rice blastdisease. Oryza 25:103-110.
Bonman JM, Bandong JM. 1989. Race-specific partial resistanceto blast in temperate japonica rice cultivars. Plant Dis. 73:496-499.
Brar DS, Khush GS. 1997. Alien introgression in rice. Plant Mol.Biol. 35:35-47.
Chang KK. 1994. Blast management in high input, high yieldpotential, temperate rice ecosystem. In: Zeigler RS et al,editors. Rice blast disease. Manila (Philippines): Interna-tional Rice Research Institute. p 451-463.
Ebron LA, Fukuta Y, Imbe T, Kato H, Yanoria MJT, TsunematsuH, Khush GS, Yokoo M. 2004. Identification of blast resis-tance genes in elite indica varieties of rice (Oryza sativa L.).(In preparation.)
Flor HH. 1956. The complementary genetic systems in flax andflax rust. Adv. Genet. 8:29-54.
Fujita Y. 1997. Rice blast: research and control. Nihon BayerAgrochem K.K. Takawa 4-10-8 Minatoku, Tokyo, Japan108. p 36-40.
Hayashi N, Ando I, Imbe T. 1998. Identification of a new resis-tance gene to a Chinese blast fungus isolate in the Japaneserice cultivar Aichi Asahi. Genet. Resistance 88:822-827.
Higashi T. 1995. Genetic studies on field resistance of rice blastdisease. Bull. Tohoku Natl. Agric. Exp. Stn. 90:19-75.
Ikehashi H, Kiyosawa S. 1981. Strain-specific reaction of fieldresistance of Japanese rice varieties revealed with Philip-pine strains of rice blast. Jpn. J. Breed. 31:293-301.
Imbe T, Matsumoto S. 1985. Inheritance of resistance of ricevarieties to the blast fungus strains virulent to the variety“Reiho”. Jpn. J. Breed. 35:332-339.
Imbe T, Oba S, Yanoria MJT, Tsunematsu H. 1997. A new genefor blast resistance in rice cultivar IR24. Rice Genet. Newsl.14:60-62.
Imbe T, Tsunematsu H, Kato H, Khush GS. 2000. Genetic analy-sis of blast resistance in IR varieties and resistance breedingstrategy. In: Tharreau D et al, editors. Advances in rice blastresearch. Dordrecht (Netherlands): Kluwer Academic Pub-lishers. p 1-8.
IRRI (International Rice Research Institute). 1996. Standard evalu-ation system for rice. 4th ed. Makati City (Philippines): IRRI.52 p.
IRRI (International Rice Research Institute). 1994. Durable blastresistance in sequential plantings. Program report for 1993.Makati City (Philippines): IRRI. p 134-136.
Inukai T, Nelson RJ, Zeigler RS, Sarkarung S, Mackill DJ,Bonman JM, Takamure I, Kinoshita T. 1994. Allelism ofblast resistance genes in near-isogenic lines of rice. Phyto-pathology 84:1278-1283.
Inukai T, Zeigler RS, Sarkarung S, Bronson M, Dung LV,Kinoshita T, Nelson RJ. 1996. Development of pre-isogeniclines for rice blast-resistance by marker-aided selection froma recombinant inbred population. Theor. Appl. Genet. 93:560-567.
Kato H, Kozaka T. 1974. Effect of temperature on lesion en-largement and sporulation of Pyricularia oryzae in riceleaves. Phytopathology 64:828-830.
Kinoshita T, Inukai T, Toriyama K. 1994. Gene symbols forblast resistance newly revised. Rice Genet. Newsl. 11:16-18.
Kinoshita T. 1998. Linkage mapping using mutant genes in rice.Rice Genet. Newsl. 15:13-74.
Kiyosawa S. 1966. Studies on inheritance of resistance of ricevarieties to blast. 3. Inheritance of resistance of a rice vari-ety Pi No. 1 to the blast fungus. Jpn. J. Breed. 16:243-250.
Kiyosawa S. 1967a. Inheritance of resistance of the rice varietyPi No. 4 to blast. Jpn. J. Breed. 17:165-172.

44
Kiyosawa S. 1967b. The inheritance of resistance of the Zenithtype varieties of rice to the blast fungus. Jpn. J. Breed. 17:99-107.
Kiyosawa S. 1969a. Inheritance of resistance of rice varieties toa Philippine fungus strain of Pyricularia oryzae. Jpn. J. Breed.19:61-73.
Kiyosawa S. 1969b. Inheritance of blast-resistance in west Paki-stani rice variety Pusur. Jpn. J. Breed. 19:121-128.
Kiyosawa S, Murty VVS. 1969. The inheritance of blast-resis-tance in Indian rice variety HR-22. Jpn. J. Breed. 19:269-276.
Kiyosawa S. 1972. The inheritance of blast resistance transferredfrom some indica varieties in rice. Bull. Natl. Inst. Agric.Sci. D23:69-96.
Kiyosawa S. 1978. Identification of blast-resistance genes in somerice varieties. Jpn. J. Breed. 28:287-296.
Kiyosawa S. 1984. Establishment of differential varieties forpathogenicity test of rice blast fungus. Rice Genet. Newsl.1:95-97.
Kiyosawa S, Ando I. 1997. Blast disease resistance. In: Scienceof the rice plant. Food and Agriculture Policy Research Cen-ter. Yushima, Tokyo, Japan. p 470-500.
Ling Z, Mew TV, Wang J, Lei C. 1995. Development of near-isogenic lines as international differentials of the blast patho-gen. Int. Rice Res. Notes 20:13-14.
Mackill DJ, Bonman JM. 1992. Inheritance of blast resistance innear-isogenic lines of rice. Phytopathology 82:746-749.
Naito H, Yaegashi H. 1997. Rice blast: research and control.Nihon Bayer Agrochem K.K. Takawa 4-10-8 Minatoku,Tokyo, Japan.
Ou SH. 1979. Breeding rice for resistance to blast: a critical re-view. In: Proceedings of the rice blast workshop. Los Baños(Philippines): International Rice Research Institute. p 81-137.
Shindo K, Asaga K. 1989. Studies on a new method to evaluatepanicle resistance of rice varieties to rice blast. Bull. TohokuNatl. Agric. Exp. Stn. 80:1-51.
Toriyama K, Ezuka A, Asaga K, Yokoo M. 1983. A method ofestimating true resistance genes to blast in rice varieties bytesting their backcrossed progenies for rice-specific reac-tions. Jpn. J. Breed. 33:448-456.
Tsunematsu H, Yoshimura A, Harushima Y, Nagamura Y, KurataN, Yano M, Sasaki T, Iwata N. 1996. RFLP frameworkmap using recombinant inbred lines in rice. Breed. Sci.46:279-284.
Tsunematsu H, Yanoria MJT, Ebron LA, Hayashi N, Ando I,Kato H, Imbe T, Khush GS. 2000. Development of mono-genic lines of rice for blast resistance. Breed. Sci. 50:229-234.
Wang GL, Mackill DJ, Bonman JM, McCouch SR, ChampouxMC, Nelson RJ. 1994. RFLP mapping of genes conferringcomplete and partial resistance to blast in a durably resistantrice cultivar. Genetics 136:1421-1434.
Yamada M. 1965. Breakdown of highly blast resistant foreignvarieties. Plant Prot. 19:231-234.
Yamada M, Kiyosawa S, Yamaguchi T, Hirano T, Kobayashi T,Kushibuchi K, Watanabe S. 1976. Proposal of a new methodfor differentiating races of Pyricularia oryzae Cavara inJapan. Ann. Phytopathol. Soc. Jpn. 42:216-219.
Yamasaki Y, Kiyosawa S. 1966. Studies on inheritance of resis-tance of rice varieties to blast. 1. Inheritance of resistance ofJapanese varieties to several strains of the fungus. Bull. Natl.Inst. Agric. Sci. D14:39-69.
Yokoo M, Kiyosawa S. 1970. Inheritance of blast resistance ofthe rice variety, Toride 1, selected from the cross Norin 8 ×TKM.1. Jpn. J. Breed. 20:129-132.
Yokoo M, Kikuchi F, Fujimaki H, Nagai K. 1978. Breeding ofblast resistant lines (BL1 to 7) from indica-japonica crossesof rice. Jpn. J. Breed. 28:359-365.
Yunoki T, Ezuka A, Morinaka T, Sakurai Y, Shinoda H, ToriyamaK. 1970. Studies on the varietal resistance to rice blast. 4.Variation of field resistance due to fungus strains. Bull.Chugoku Agric. Exp. Stn. E. 6:21-41.
Zhu LH, Chen Y, Xu YB, Xu JC, Cai HW, Ling ZZ. 1993. Con-struction of a molecular map of rice and gene mapping usinga double haploid population of a cross between indica andjaponica varieties. Rice Genet. Newsl. 10:132-135.
Notes
Authors’ addresses: H. Kato and T. Imbe, National Institute ofCrop Science, 2-1-18, Kannondai, Tsukuba, Ibaraki 305-8517, Japan; H. Tsunematsu, Japan International ResearchCenter for Agricultural Sciences, 1-1, Ohwashi, Tsukuba,Ibaraki 325-8686, Japan; Y. Fukuta, Japan InternationalResearch Center for Agricultural Sciences (JIRCAS), 1-1Ohwashi, Tsukuba, Ibaraki 305-8686, Japan.
Acknowledgments: This study was supported by the collabora-tive projects at IRRI under a special contribution of the Japa-nese Government through its Ministry of Agriculture, For-estry, and Fisheries. We thank Dr. G.S. Khush and Dr. S.W.Ahn for their useful suggestions. We declare that this experi-mental protocol complies with the current laws of the Philip-pines, where the experiments were conducted.

45
Seven resistance genes, Pia, Pib, Pik-s, Pi-zt, Pi20, Pita, and one other Pik allele, were identified in
International Rice Research Institute (IRRI)-bred rice (Oryza sativa L.) varieties by genetic analyses
based on the differential system using isolates of the blast fungus Pyricularia grisea (Cooke) Sacc.
from the Philippines. Segregation analysis using BC1F2 populations derived from crosses of these
varieties with a susceptible indica-type line, CO39, and allelism tests using F2 hybrid populations
from crosses of IRRI varieties with differential varieties having known resistance genes was carried
out with nine varieties (IR34, IR24, IR36, IR60, PSBRc1, IR74, IR56, IR70, and IR64) and six variet-
ies (IR34, IR36, IR60, IR74, IR46, and IR64), respectively. Selected blast isolates with known
avirulence were used in these analyses, and the genotype in each variety was identified. Among the
genes identified, two, Pib and one Pik allele, were detected in almost all the IRRI varieties used. New
genes, which were not estimated based on the reaction patterns of blast isolates due to the masking
effect of Pita, Pik-h, and Pi20 in a previous analysis, were also identified. We could confirm the
genotypes of resistance genes in IRRI-bred lines and demonstrate the efficiencies of genetic analysis
for blast resistance genes based on the differential system according to the gene-for-gene theory.
Genetic analysis of blast resistancegenes in elite indica-type riceL.A. Ebron, Y. Fukuta, T. Imbe, H. Kato, M.J.T. Yanoria, H. Tsunematsu, G.S. Khush, and M. Yokoo
In rice (Oryza sativa L.), genetic analysis for blast has beengoverned based on the differential system according to thegene-for-gene theory between the host and the fungus,Pyricularia grisea (Cooke) Sacc. (Kiyosawa 1972, Silue etal 1992). Genetic studies performed in this context led tothe identification of many blast resistance genes. In the trop-ics, genetic studies on blast resistance in indica-type variet-ies were limited. The extremely changeable virulence ofthe blast fungus (Ou 1985, Bonman et al 1986) and thepresence of several resistance genes in indica-type culti-vars (Mackill et al 1985, Yu et al 1987) make genetic stud-ies of blast resistance genes difficult.
The limitation in genetic studies of blast resistancecould also be attributed to the lack of a differential systemfor blast resistance genes in the tropical zone. Yamada et al(1976) and Kiyosawa (1984) selected 12 japonica-type dif-ferential varieties for blast resistance, and these were usedto develop the differential system. These differential variet-ies were not well adapted for the blast isolates in the tropi-cal zone because these have an additional gene or genes,Pish or other, which masked the target gene’s reaction (Nodaet al 1999). Yanoria et al (2000) tried to clarify the pathoge-nicities of blast isolates from the Philippines using Japa-nese differential varieties (Yamada et al 1976, Kiyosawa
1984). Among these blast isolates, several with distinctpathogenicities were selected and studied in detail byTsunematsu et al (2000) using a set of monogenic lines,which have a single resistance gene in each genetic back-ground. Using this new system, Ebron et al (submitted) couldestimate the genotypes of 42 IRRI-bred rice varieties, andfound a total of seven resistance genes, Pi20, Pita, Pik-h,Pib, Pik-s, Piz-t, and Pii or Pi3(t), included in them. Thenumber of resistance genes varied from one to four amongthe IRRI varieties, and these were classified into seven vari-ety groups (VG) based mainly on the presence of Pi20, Pita,and one Pik allele. In the pathogenicity analysis for blastisolates from the Philippines, Pik-s could be distinguishedfrom the other four Pik alleles, Pik, Pik-h, Pik-m, and Pik-p,but available isolates have not yet been found to classifythese four alleles (Tsunematsu et al 2000, Yanoria et al 2000).However, Ebron et al (submitted) estimated that the allelemight be Pik-h based on the pedigree research and geno-typic information of the parental lines. Among these genesestimated, two, Pib and one Pik allele (Pik-s or Pik†), werecommon in almost all IRRI varieties. Because of the mask-ing effect of Pi20, Pita, and Pik alleles, the presence of theother genes might not be expected in these varieties.
Toriyama et al (1986) demonstrated that the estimation

46
of genes with resistance to blast in rice varieties by usingsegregation analysis with the hybrid population derivedfrom a cross between resistant and susceptible varieties waseffective. Genetic analysis based on gene segregation in-cluding the allelism test with a differential variety is neces-sary to clarify in detail genotypes in each variety, whichwere estimated by Ebron et al (n.d.). The present study wastherefore undertaken to confirm the genes previously esti-mated or masked by reaction pattern analysis based on thedifferential system.
Materials and methods
Segregation analysis using a hybrid population
derived from the cross between an IRRI
variety and a susceptible variety
Six IRRI varieties, IR34 (VG 1b), IR36 and IR60 (VG 3),IR74 (VG 5), and IR46 and IR64 (VG 7a), previously classi-fied by patterns of reaction to blast isolates from the Philip-pines (Ebron et al, submitted), were backcrossed with a sus-ceptible indica-type variety, CO39, as the recurrent parent.
The BC1F
2 populations, consisting of 53 to 140 lines
derived from different cross combinations, were inoculatedwith selected blast isolates avirulent to the expected genes.Following the procedure of Toriyama et al (1986), the num-ber of genes conferring resistance in a variety was estimatedfrom the segregation of BC
1F
2 lines for each blast isolate.
Three segregation ratios, 1:1, 3:1, and 7:1, betweenheterozygously resistant and homozygously susceptiblelines indicated one, two, and three genes controlling eachresistance. Each BC
1F
2 line was analyzed for its pattern of
reaction to the blast isolates and the kind of gene conferringthe resistance was identified.
Allelism tests using a differential variety
Nine IRRI rice cultivars, IR34 (VG 1b), IR24 (VG 2b), IR36and IR60 (VG 3), PSBRc1 (VG 4), IR74 (VG 5), IR56 andIR70 (VG 6), and IR64 (VG 7b), were crossed with differen-tial varieties, lines, and IRRI cultivars, which already had aknown blast resistance gene.
F2 populations derived from each cross combination
were used to identify the genes. Selected blast isolates aviru-lent to these genes were inoculated to the seedlings of thesame populations. The differential varieties Toride 1 forPiz-t; BL1 for Pib; Yashiromochi, C105TTP2L9, andC101PKT for Pita; Tsuyuake for Pik-m and Kanto 51 forPik; and IR24 for three genes, Pib, Pik-s, and Pi20, wereused. The allelic relationship of the genes was determinedbased on the segregation of the F
2 progenies of a cross to a
particular blast isolate. If the segregation did not includesusceptible plants, it was assumed that the same allele wasincluded in both parental varieties.
Inoculation and evaluation
Pregerminated seeds of each population were sown in a 26× 35-cm plastic tray. Ten grams of ammonium sulfate wasapplied to each tray as basal fertilizer and 1 g was added 1
week before inoculation. In all cases, susceptible cultivarsCO39 and Lijiangxintuanheigu (LTH) were included in eachtray to check the success of inoculation and the virulence ofthe blast isolates used.
Several blast isolates with known avirulence (Yanoriaet al 2000) were used for inoculation. Seedlings at the fourth-leaf stage were sprayed with 40–50 mL of spore suspensionadjusted to 105 spores mL–1 in each tray. Trays were placedinside wet jute sacks for 18–24 hours, and transferred to anair-conditioned glasshouse room with 23 ± 3/30 ± 5 °C nightand day temperature. Blast incidence on each seedling wasexamined 6–7 days after inoculation. The reaction was clas-sified on a 0–5 scale with slight modifications as describedpreviously by Mackill and Bonman (1992). Seedlings rated0–2 were considered resistant (R), 3– moderately resistant(MR), 3+ moderately susceptible (MS), and 4–5+ suscep-tible (S).
Results
Segregation analysis of the BC1F2 population
A total of six varieties were investigated for segregation inBC
1F
2 populations, and the genotype of the resistance genes
was identified (Table 1).In the IR34 population, a total of 104 BC
1F
2 lines were
examined for segregation to five isolates, M39-1-3-8-1, M64-1-3-9-1, BN209, V850196, and B90002. Against M39-1-3-8-1 and M64-1-3-9-1, the lines segregated into 48 heterozy-gous-resistant and 56 homozygous-susceptible lines, and aco-segregation for resistance was recognized between theseisolates. The segregation fitted the 1:1 ratio for single domi-nant gene control. Both isolates were avirulent to Piz-t andPita, but IR34 in VG 1 was estimated to not have Pita.These results indicated that the segregation for resistancewas governed by Piz-t. To isolate BN209, the segregationof heterozygous-resistant and homozygous-susceptible linesfitted to a 3:1 ratio, suggesting that two dominant genescontrolled the resistance. Although one of the genes wasestimated as Pib, because this gene was incompatible withBN209, the other one could not be identified based on thepattern of reaction to blast isolates. It was also found thatthe resistance to isolate V850196 was controlled by twodominant genes. One of these genes was estimated as Pik-s,but the other one could not be identified. Using isolateB90002 avirulent to Pia, which could not be estimated di-rectly under the presence of Pi20, Pita, or Pik†, we exam-ined the segregation, and all lines showed resistance.Tsunematsu et al (2000) indicated that CO39 had Pia. Theseresults suggested that IR34 was also confirmed to have Pia.Thus, IR34 has Pia, Pib, Pik-s, Piz-t, and at least one un-known gene.
IR36 and IR60 were analyzed in VG 3 for three genes,Pita, Pib, and Pik-s, that were not previously estimated byreaction pattern analysis. The 61 BC
1F
2 lines showed a single
dominant gene segregation to IK81-3, which was avirulentto Pita. A segregation controlled by two dominant geneswas shown to isolate BN209, which is avirulent to two resis-

47
tance genes, Pib and Pik†. It was clarified that Pik† was notincluded in VG 3 in previous research. From these results,Pib was estimated to be one of the two genes, but the othergene could not be identified. The two genes, Pita and Pik-s,were identified in the analysis of V850196 based on segre-gation controlled by two dominant genes and by the reac-tion pattern. Finally, it was concluded that the four genes,Pib, Pita, Pik-s, and one unknown gene, were included inIR36.
In the analysis of IR60 using 53 BC1F
2 lines, segrega-
tion controlled by two and three genes was observed forthree isolates, IK81-3, M64-1-3-9-1, and V850196, and one,BN209, respectively. IK81-3 was avirulent to Pita and Pik†,but the latter could not be estimated in VG 3. M64-1-3-9-1has avirulence to Pita and Piz-t, V850196 to Pita and Pik-s,and BN209 to Pib; therefore, the three genes (Pita, Pik-s,and Pib) were related in the segregation. However, one genewith resistance to IK81-3 and two genes with resistance toBN209 could not be identified by reaction patterns. Theseresults indicate that Pib, Pita, Piz-t, and Pik-s, and two kindsof unknown genes, were present in IR60.
In IR74 of VG 5, 76 BC1F
2 lines were analyzed for seg-
regation to six blast isolates, PO6-6 and Ca89 for Pik†, M36-1-3-10-1 for Pi20, BN111 for Pi20 and Pik‡, BN209 for Piband Pik†, and B90002 for Pia, Pik†, Pi20, Pib, and Piz-t.Resistance controlled by a single dominant gene was shownin segregation to the three isolates, PO6-6, Ca89, and M36-1-3-10-1, and a co-segregation was also observed betweenisolates PO6-6 and Ca89. Pik† and Pi20 controlled the seg-regation to two isolates, PO6-6 and Ca89, and to one iso-late, M36-1-3-10-1, respectively. A segregation controlledby two dominant genes was observed in isolates BN111and BN209. One gene, Pik†, was common in the segregationto both isolates. The other genes avirulent to BN111 andBN209 corresponded to Pi20 and Pib, respectively. In theanalysis of B90002, all the lines were resistant, suggestingthat IR74 carried the same gene as CO39. Since only Piawas included in the genetic background of CO39, this genealso exists in IR74. From these results, four resistance genes,Pia, Pib, Pik†, and Pi20, were identified in IR74.
Two varieties, IR46 and IR64, in VG 7a that includedPi20 and Pita were analyzed. Six isolates were used for the
Table 1. Segregation in BC1F2 population derived from the cross between an IRRI-bred variety and a susceptible variety, CO39, as the
recurrent parent.
Cultivar No. of lines χ2 value P Estimated gene
(group) Isolate
RRa R- – Total 1:1b 3:1 7:1 (df = 1)
M39-1-3-8-1 – 48 56 104 0.62a – – 0.43 Piz-t
IR34 M64-1-3-9-1 – 48 56 104 0.62a – – 0.43 Piz-t
(VG 1b) BN209 – 79 25 104 – 0.02 – 0.89 Pib, one unknown
V850196 – 77 27 104 – 0.02 – 0.89 Pik-s, one unknown
B90002 104 – – 104 – – – – Pia
IR36 IK81-3 – 35 26 61 1.32 – – 0.25 Pita
(VG 3) BN209 – 45 16 61 – 0.05 – 0.82 Pib, one unknown
V850196 – 47 14 61 – 0.13 – 0.72 Pita, Pik-s
IK81-3 – 36 17 53 – 1.41 – 0.24 Pita, one unknown
IR60 M64-1-3-9-1 – 40 13 53 – 0.02 – 0.89 Pita, Piz-t
(VG 3) BN209 – 48 5 53 – – 0.46 0.50 Pib, two unknown
V850196 – 37 16 53 – 0.76 – 0.38 Pita, Pik-s
PO6-6 – 34 42 76 0.84b – – 0.36 Pik†, Pi20
Ca89 – 34 42 76 0.84b – – 0.36 Pik†, Pi20
IR74 M36-1-3-10-1 – 36 40 76 0.22 – – 0.64 Pi20
(VG 5) BN111 – 51 25 76 – 2.52 – 0.11 Pik†, Pi20
BN209 – 54 22 76 – 0.63 – 0.43 Pib, Pik†
B90002 76 – – 76 – – – – Pia
IK81-25 – 59 41 100 3.24c – – 0.07 Pita
M64-1-3-9-1 – 59 41 100 3.24c – – 0.07 Pita
IR46 BN111 – 58 42 100 2.56d – – 0.11 Pi20
(VG 7a) M36-1-3-10-1 – 58 42 100 2.56d – – 0.11 Pi20
V850196 – 79 21 100 – 0.85 – 0.36 Pita, Pik-s
BN209 – 81 19 100 – 1.92 – 0.17 Pib, one unknown
IR64 IK81-25 – 41 31 72 1.39 – – 0.24 Pita
(VG 7a) BN111 – 37 35 72 0.06 – – 0.81 Pi20
M64-1-3-9-1 – 51 21 72 – 0.67 – 0.41 Pita, Piz-t
BN209 – 52 17 69 – 0.08 – 0.78 Pib, one unknown
aRR = homozygously resistant, R = heterozygously resistant, – = homozygously susceptible.ba, b, c, and d indicate co-segregation among isolates.

48
segregation analysis in IR46, and four isolates, IK81-25,M64-1-3-9-1, BN111, and M36-1-3-10-1, showed segrega-tion controlled by a single dominant gene. Co-segregationfor resistance between IK81-25 and M64-1-3-9-1, and be-tween BN111 and M36-1-3-10-1, was observed. IK81-25and M64-1-3-9-1 are avirulent to Pita, and BN111 and M36-1-3-10-1 to Pi20. Based on these results, the existence ofPita and Pi20 in IR46 was confirmed. The segregation forresistance to isolates V850196 and BN209 indicated thattwo dominant genes control the resistance. V850196 is aviru-lent to Pita, Pik†, and Pik-s, and BN209 to Pib and Pik†. Pik†
was not included in VG 7a based on the reaction patterns inprevious research. These results indicated that Pita and Pik-s, and Pib and an unknown gene, were related to the segre-gation for resistance to V850196 and BN209, respectively.Thus, Pib, Pik-s, Pita, Pi20, and one unknown gene wereidentified in IR46.
In IR64, 72 BC1F
2 lines were analyzed using four iso-
lates, IK81-25, BN111, M64-1-3-91, and BN209. Segrega-tion controlled by a single dominant gene was observed forisolates IK81-25 and BN111, and two dominant genes forisolates M64-1-3-9-1 and BN209. Three isolates, IK81-25,BN209, and BN111, were avirulent to three genes, Pita,Pib, and Pi20, respectively. M64-1-3-9-1 was avirulent toPita and Piz-t. Pik‡ is not included in VG 7 cultivars. Fromthese results, four genes (Pita, Pib, Pi20, and Piz-t) wereestimated to control the segregation for resistance to theisolates used. However, one of the two resistance genes couldnot be identified in the segregation to BN209.
Allelism tests
A total of 24 F2 populations derived from crosses among
nine IRRI varieties and differential varieties and lines (DV)were used for the allelism tests (Table 2).
In IR34 of VG 1b, two F2 populations derived from the
crosses with Toride 1 as a DV of Piz-t, and BL1 as a DV ofPib, did not show any plants susceptible to isolates M64-1-3-9-1, M39-1-3-8-1, and BN209. The first two isolates andthe last one are avirulent to Piz-t and Pib, respectively. Fromthese results, it was confirmed that IR34 carries Piz-t andPib.
In IR24 of VG 2a, all F2 plants derived from the cross
with BL1 as a DV for Pib were resistant to BN209, whichwas avirulent to Pik† and Pib. These results indicated thepresence of Pib in IR24. The existence of Pib in IR24 previ-ously reported by Imbe et al (1997) was further supportedby the present allelism test.
In IR36 of VG 3, the four kinds of F2 populations de-
rived from the crosses with the DVs, C105TTP2L9 andC101PKT of Pita, Toride 1 of Piz-t, and BL1 of Pib, segre-gated only plants resistant to isolate IK81-25, which wasavirulent to Pita; M39-1-3-8-1 and M64-1-3-9-1, avirulentto Pita and Piz-t; and BN209, avirulent to Pib. These resultsconfirmed that IR36 had Pita, Piz-t, and Pib. The presenceof Piz-t was also confirmed from the segregation of the F
2
population derived from a cross between IR34 and IR36using isolates M39-1-3-8-1 and M64-1-3-9-1. In the F
2 popu-
lation derived from a cross between IR24 and IR36, theallelism of Pib and Pik-s was confirmed using isolates BN209and V850196, respectively.
The F2 populations derived from the crosses of IR60
with IR34 and IR24 did not segregate any plants suscep-tible to isolate BN209 avirulent to Pib and Pik†, V850196avirulent to Pita, Pik-s, and Pik†, and M39-1-3-8-1 and M64-1-3-9-1 avirulent to Pita and Piz-t. IR34 was confirmed withPia, Pib, Piz-t, and Pik-s, and IR24 had Pia, Pib, Pik-s, andPi20. IR60 was not previously estimated to have Pik†,whereas the resistance to M39-1-3-8-1 and M64-1-3-9-1 wasrelated to Piz-t, which was estimated to also be in IR34. Onthis basis, the three genes (Pib, Piz-t, and Pik-s) were alsoconfirmed in IR60 of VG 3.
In PSBRc1 of VG 4, the F2 populations derived from a
cross with IR56 previously estimated to have Pik† and Pitashowed that all plants were resistant to isolate PO6-6 aviru-lent to Pik† and to BN111 avirulent to Pik† and Pi20. SincePi20 was not included in VG 4 by the reaction pattern inprevious research, the resistance of the F
2 plants to these
isolates suggested allelism of Pik† in PSBRc1 and IR56.However, upon inoculation with isolate IK81-25 avirulentto Pita, the F
2 plants segregated into 406 resistant and 126
susceptible, which fit the 3:1 ratio (χ2 = 0.51, P = 0.43). Thisindicated that a single dominant gene (Pita) estimated to bein IR56 governed the segregation.
In IR74 of VG 5, all F2 plants derived from a cross with
IR56 showed resistance to PO6-6 avirulent to Pik† and toBN111 avirulent to Pik† and Pi20, which confirmed thatIR74 has the same Pik† allele of IR56. On the other hand,segregation to IK81-25 avirulent to Pita fit the 3:1 ratio (χ2
= 0.82, P = 0.37) expected for single dominant gene control.The segregation was due to Pita in IR56.
In VG 6, IR56 was crossed with five DVs, C101PKTand Yashiromochi for Pita, Kanto 51 for Pik, Tsuyuake forPik-m, and IR70 for Pita and Pik†. Eleven kinds of segrega-tion analysis were carried out using three isolates, IK81-25avirulent to Pita, PO6-6 avirulent to Pik†, and BN111 aviru-lent to Pik† and Pi20. Of these, two F
2 populations derived
from crosses with C101PKT and Yashiromochi showedsingle-gene segregation to PO6-6. The other nine popula-tions did not segregate any susceptible plants, which con-firmed that the same gene controlled the resistance. It wasestimated that the segregation to PO6-6 was due to Pik† inIR56. Since the blast isolates from the Philippines couldnot classify the Pik alleles except Pik-s, no susceptible plantswere obtained from the populations derived from the com-binations among Kanto 51 for Pik, Tsuyuake for Pik-m, andIR56 for Pik‡. These results confirmed that Pita and Pik†
were included in IR56.In VG 7a, the F
2 populations derived from the crosses
between IR64 and DVs C105TTP2L9 and C101PKT forPita, Toride 1 for Piz-t, and IR24 for Pi20 did not show anysegregants susceptible to IK81-25, M39-1-3-8-1, M64-1-3-9-1, and BN111, respectively. These results indicated thatIR64 had the same alleles of Pita, Piz-t, and Pi20. A similarreaction was shown to IK81-25 in the F
2 plants from a cross

49
Table 2. Allelism test using an F2 population derived from the cross between an IRRI-bred and differential variety.
Cultivar Cross combination No. of plants (lines)a χ2 Identified
(group) (expected gene) Isolate P gene
R S Total (3:1)
IR34 Toride 1 / IR34 M39-1-3-8-1 94 0 94 – – Piz-t
(CG 1b) (Piz-t) (Pia, Pib, Piz-t, Pik-s) M64-1-3-9-1 84 0 84 – – Piz-t
BL1 (Pib) IR34 BN209 437 0 437 – – Pib
IR24 BL1 / IR24 BN209 161 0 161 – – Pib
(V 2b) (Pib) (Pia, Pib, Pik-s, Pi20)
IR36 IR36 / C105TTP2L9 IK81-25 468 0 468 – – Pita
(CG 3) (Pib, Pita, Pik-s) (Pita)
IR36 / C101PKT (Pita) IK81-25 167 0 167 – – Pita
Toride 1 IR36 M39-1-3-8-1 184 0 184 – – Piz-t
M64-1-3-9-1 168 0 168 – – Piz-t
BL1 / IR36 BN209 420 0 420 – – Pib
IR34 / IR36 M39-1-3-8-1 467 0 467 – – Piz-t
M64-1-3-9-1 516 0 516 – – Piz-t
IR24 / IR36 BN209 287 0 287 – – Pib
V850196 295 0 295 – – Pik-s
IR60 IR34 / IR60 M39-1-3-8-1 302 0 302 – – Piz-t
(CG 3) (Pib, Pita, Piz-t, Pik-s) M64-1-3-9-1 303 0 303 – – Piz-t
IR24 / IR60 BN209 360 0 360 – – Pib
V850196 235 0 235 – – Pik-s
PSBRc1 IR56 / PSBRc1 PO6-6 531 0 531 – – Pik†
(CG 4) (Pita, Pik‡) (Pik†) BN111 526 0 526 – – Pik†
IK81-25 406 126 532 0.51 0.43 Pita in IR56
IR74 IR46 / IR74 PO6-6 560 0 560 – – Pik†
(CG 5) (Pita, Pik‡) (Pi20, Pik†) BN111 585 0 585 – – Pik†
IK81-25 442 135 577 0.82 0.37 Pita in IR56
IR56 C101PKT / IR56 IK81-25 469 0 469 – – Pita
(CG 6) (Pita) (Pita, Pik†) PO6-6 358 85 443 7.98 0.005 Pik† in IR56
Yashiromochi / IR56 IK81-25 463 0 163 – – Pita
(Pita) PO6-6 370 127 497 0.08 0.78 Pik† in IR56
IR56 / Kanto 51 (Pik) PO6-6 440 0 440 – – Pik†
BN111 407 0 407 – – Pik†
IR56 / Tsuyuake (Pik-m) PO6-6 498 0 498 – – Pik†
BN111 496 0 496 – – Pik†
IR70 IR56 / IR70 (Pita, Pik†) PO6-6 577 0 577 – – Pik†
(CG 6) BN111 558 0 558 – – Pik†
IK81-25 567 0 567 – – Pita
IR64 IR64 / C105TTP2L9 IK81-25 274 0 274 – – Pita
(CG 7a) (Pib, Pi20, Pita) (Pita) – –
IR64 / C101PKT IK81-25 132 0 132 – – Pita
Toride 1 / IR64 M39-1-3-8-1 124 0 124 – – Piz-t
M64-1-3-9-1 133 0 133 – – Piz-t
IR56 / IR64 IK81-25 296 0 296 – – Pita
PO6-6 193 60 253 0.22 0.64 Pik†
IR24 / IR64 BN209 222 0 222 – – Pib
V850196 227 0 227 – – Pik†
BN111 302 0 302 – – Pi20
aR = resistant, S = susceptible.
between IR64 and IR56. However, there was single-genesegregation (χ2 = 0.22, P = 0.64) to PO6-6 due to Pik† inIR56. Against V850196 and BN209, the F
2 population of a
cross of IR64 with IR24 did not segregate any susceptibleplants, indicating that the same genes (Pik-s and Pib) con-ferred resistance to both isolates. These results confirmedthat Pik-s and Pib were also included in IR64.
The six resistance genes, Pita, Pib, Pik-s, Piz-t, Pi20,and Pik, were confirmed in the nine IRRI varieties by allel-ism tests.
Discussion
In a previous study, Ebron et al (submitted) have estimatedat least seven blast resistance genes, Pib, Pik-s, Piz-t, Pi20,Pita, Pik, and Pii or Pi3(t), in 42 rice cultivars. Through twokinds of genetic analysis, we have confirmed seven blastresistance genes, Pia, Pib, Pik-s, Piz-t, Pi20, Pita, and Pik.Four of these genes, Pia, Pib, Pik-s, and Piz-t, were identi-fied in some varieties but were not previously estimated byreaction patterns (Table 3).

50
Among the seven blast resistance genes, Pib and onePik allele were identified in almost all the cultivars tested inprevious research, and this was confirmed again in this study.Pib was previously estimated in variety groups (VG) 1, 2, 3,and 7. It was confirmed in the varieties IR34 (VG 1), IR24(VG 2), IR36 and IR60 (VG 3), and IR46, IR60, and IR64(VG 7) through genetic analysis. Other than these varieties,IR74 (VG 5) was similarly identified with Pib, whose pres-ence was not previously expected. The genes Pik-s and Pik†
were confirmed in VGs 1 and 2, and VGs 4, 5, and 6, respec-tively, based on genetic analysis of IR34, IR24, PSBRc1,IR74, and IR56. Additionally, Pik-s was identified in IR36and IR60 of VG 3, and in IR46 and IR64 of VG 7a. Theapparent wide distribution of these genes may be correlatedwith the breeding method for which these varieties had IR8,IR24, and IR36, or their hybrid progenies in the pedigreesas parental varieties. IR8 was bred from a cross betweenIndonesian variety Peta and Dee-geo-woo-gen from Taiwan.Peta and Dee-geo-woo-gen were estimated to be carrying
Pib and Pik-s for Philippine isolates, respectively (unpub-lished data). IR8 and its progenies were included in thepedigrees of IR24 and IR36. Three varieties, Dawn, Tadukan,and Tetep, could also be found in the pedigrees of IRRIcultivars. They were estimated to have a Pik allele (otherthan Pik-s) (unpublished data). Kiyosawa (1981) reportedthat Pik-h was identified in these varieties. On the basis ofthese findings, Dee-geo-woo-gen, and the three varieties,Dawn, Tadukan, and Tetep, could be the sources of Pik-sand Pik-h, respectively. These results suggest that most IRRIvarieties have Pik-s or Pik-h. It will be necessary to confirmthe genotype of Pik† using effective blast isolates, whichcan classify the four kinds of Pik alleles, Pik, Pik-h, Pik-m,and Pik-p.
Estimating Pib, Pik-s, Piz-t, and Pia was not easy when-ever Pi20, Pita, and Pik† were carried in the varieties. Thethree genes, Pik-s, Piz-t, and Pia, showed a relatively widespectrum of resistance, and they could mask the reactions ofthe other narrow-spectrum genes. Segregation analysis us-
Table 3. Resistance genes identified in IRRI-bred rice varieties.
Cultivar Resistance genes
groupa Variety
Reaction patternb BC1F2 analysis Allelism test
VG 1 a IR20, IR28, IR30, Pib, Pik-s – –
IR45, IR66
b IR29 Pib, Pik-s, Piz-t – –
IR34 Pia, Pib, Pik-s, Piz-t, Pib, Piz-t
one unknown
VG 2 a IR8, IR22, IR26, PSBRc30 Pi20, Pib, Pik-s – –
IR24 Pi20b, Piab, Piba, Pik-sb Pib, Pi20b, Pik-sb
b IR43 Pi20, Pib – –
c PSBRc2 Pi20, Pib, Pik-s, – –
Piz-t
VG 3 IR5, IR32, IR38,
IR40, IR42, IR44,
IR50, IR52, IR54, Pita, Pib
IR58, IR62, IR65,
IR68, IR72, IR52,
PSBRc4 – –
IR36 Pita, Pib, Pik-s, Pib, Pita, Pik-s,
one unknown Piz-t
IR60 Pita, Pib, Pik-s, Piz-t, Pib, Piz-t
two unknown
VG 4 PSBRc1 Pik† – Pik†
VG 5 IR74 Pi20, Pik† Pi20, Pik†, Pia, Pib Pik†
VG 6 IR56 Pita, Pik† – Pita, Pik†
IR70 – –
VG 7 a IR46, IR48, PSBRc28 – –
IR46 Pi20, Pita, Pib Pi20, Pita, Pib, Pik-s, –
one unknown
IR60 Pi20, Pita, Pib, Piz-t, –
one unknown
IR64 – Pib, Pita, Pik-s,
Piz-t, Pi20
b PSBRc10, PSBRc18, Pi20, Pita, Pib, – –
PSBRc20 Pii (or Pi3)
aClassification was carried out based on the presence of the three genes, Pi20, Pita, and Pik†, and resistance genes were estimated by the reaction
patterns based on a differential system using 14 blast isolates from the Philippines (Ebron et al, submitted).bThe data of Imbe et al (1997) were modified.

51
ing backcross populations (BC1F
2 family lines) and an al-
lelism test are necessary and effective in identifying thesegenes. For instance, Pib and Piz-t were confirmed from thesegregation of F
2 plants derived from crosses with DVs BL1
for Pib and Toride 1 for Piz-t. The use of BC1F
2 analysis has
been demonstrated in identifying Pik-s and Piz-t in IR36and IR60 of VG 3 and IR46 and IR64 of VG 7, using isolateswith specific avirulence to these genes.
Another gene, Pia, was also identified in IR34 in VG1b and IR74 in VG 5. Imbe et al (1997) have already re-ported the presence of Pia in IR24. Many IRRI varietiesincluded IR24 or its hybrid progenies as a parental varietyin their pedigrees. The source of Pia was estimated to comefrom Blue Bonnet, which was one of the parental varietiesfor IR24 and was previously identified with Pia (Kiyosawa1972). Pia may also be included in many IRRI varieties.
Previous genetic studies on blast resistance in someIRRI cultivars and lines were limited to the inheritance ofresistance to particular isolates (Dekuku 1982, Flores-Gaxiola et al 1983, Yu et al 1987). The number of genes wasestimated against specific blast isolates by segregation ra-tios, but these genotypes were not known. Apparently, thepresence of several resistance genes in indica-type cultivarsand the lack of a suitable differential system could havecontributed to limited genetic studies in the tropics. Wedemonstrated the utility of the differential system for thegene analysis of indica-type rice cultivars bred at IRRI. Theuse of the differential system based on the selected isolateswith known virulence genotypes could clarify and confirmseveral blast resistance genes in IRRI varieties. This infor-mation on the resistance genes in IRRI varieties should beimportant in breeding for a durable type of resistance.
References
Bonman JM, Vergel de Dios TI, Khin MM. 1986. Physiologicspecialization of Pyricularia oryzae in the Philippines. PlantDis. 70:767-769.
Dekuku RC. 1982. Inheritance of resistance to leaf blastPyricularia oryzae (Cavara) in four rice selections. M.S.thesis. University of the Philippines, Los Baños, Philippines.74 p.
Flores-Gaxiola JA, Nuque FL, Crill JP, Khush GS. 1983. Inherit-ance of blast Pyricularia oryzae resistance in rice. Intl. RiceRes. Newsl. 8:5-6.
Imbe T, Oba S, Yanoria MJT, Tsunematsu H. 1997. A new genefor blast resistance in rice cultivar IR24. Rice Genet. Newsl.14:60-62.
Kiyosawa S. 1972. Genetics of blast resistance. In: Rice breed-ing. Manila (Philippines): International Rice Research Insti-tute. p 203-225.
Kiyosawa S. 1981. Gene analysis for blast resistance. Oryza18:196-203.
Kiyosawa S. 1984. Establishment of differential varieties for patho-genicity of rice blast fungus. Rice Genet. Newsl. 1:95-96.
Mackill DJ, Bonman JM, Suh HS, Srilingam R. 1985. Genes forresistance to Philippine isolates of the rice blast pathogen.Rice Genet. Newsl. 2:80-81.
Mackill DJ, Bonman JM. 1992. Inheritance of blast resistance innear-isogenic lines of rice. Phytopathology 82:746-749.
Noda T, Nagao H, Du PV, Dinh HD, LVE. 1999. Distribution ofpathogenic races of rice blast fungus in Vietnam. Ann.Phytopathol. Soc. Jpn. 65:526-530.
Ou SH. 1985. Rice diseases. 2nd ed. Kew, Surrey (England):Commonwealth Mycological Institute. 380 p.
Silue D, Notteghem JL, Tharreau D. 1992. Evidence of a gene-for-gene relationship in the Oryza sativa-Magnaporthe griseapathosystem. Phytopathology 82:577-580.
Toriyama K, Ezuka A, Asaga K, Yokoo M. 1986. A method forestimating true resistance genes to blast in rice varieties. In:Rice genetics. Los Baños (Philippines): International RiceResearch Institute. p 441-449.
Tsunematsu H, Yanoria MJT, Ebron LA, Hayashi N, Ando I,Kato H, Imbe T, Khush GS. 2000. Development of mono-genic lines of rice for blast resistance. Breed. Sci. 50:229-234.
Yamada M, Kiyosawa S, Yamaguchi T, Jirano T, Kobayashi T,Kushibuchi K, Watanabe S. 1976. Proposal of a new methodfor differentiating races of Pyricularia oryzae Vavara inJapan. Ann. Phytopathol. Soc. Jpn. 42:216-219.
Yanoria MJT, Imbe T, Tsunematsu H, Ebron LA, Mercado D,Kato H, Fukuta Y. 2000. Pathogenicity of IRRI blast isolateto rice blast resistance genes. 4th International Rice Genet-ics Symposium. Abstract 397.
Yu ZH, Mackill DJ, Bonman JM. 1987. Inheritance of resistanceto blast in some traditional and improved rice cultivars. Ge-netics 77:323-326.
Notes
Authors’ addresses: L.A. Ebron, M.J.T. Yanoria, and G.S. Khush,International Rice Research Institute, DAPO Box 7777,Metro Manila, Philippines; Y. Fukuta, Japan InternationalResearch Center for Agricultural Sciences (JIRCAS) 1-1,Ohwashi, Tsukuba, Ibaraki 305-8686, Japan; T. Imbe andH. Kato, National Institute of Crop Science, 2-1-18,Kannondai, Tsukuba, Ibaraki 305-8517, Japan; H.Tsunematsu, Japan International Research Center for Agri-cultural Sciences, 1-1, Ohwashi, Tsukuba, Ibaraki 325-8686,Japan; and M. Yokoo, Institute of Agriculture and Forestry,University of Tsukuba, Tennodai, Tsukuba, Ibaraki 305-8572,Japan.


53
The blast resistance genes in elite indica-type rice (Oryza sativa L.) varieties bred at the International
Rice Research Institute (IRRI) were estimated following a differential system using Philippine iso-
lates of the blast fungus Pyricularia grisea (Cooke) Sacc. based on the gene-for-gene theory. On the
basis of the presence of three genes, Pi20, Pita, and one of the Pik alleles (other than Pik-s), the 42
varieties were classified into seven varietal groups. A group without these three genes included
seven varieties that were bred from the progenies of the hybrids with IR24 as a parental variety. The
biggest group characterized by Pita consisted of 17 varieties, including IR36 and its sister lines or
progenies. The group characterized by Pi20 had seven varieties that included IR8, IR24, and their
hybrid progenies. Thus, most of the IRRI varieties were classified into these three groups that often
included IR8, IR24, IR36, or their hybrid progenies in their pedigrees. A total of seven resistance
genes—Pib, Pita, Piz-t, Pik-s, one of the Pik alleles (other than Pik-s), and one of the two genes, Pii or
Pi3—were estimated to be present in these varieties. On the basis of the varieties used as parents in
the ancestry of IRRI varieties identified to have one of the Pik alleles (other than Pik-s), the gene was
assumed to be Pik-h. In some cases, genes such as Pib, Pik-s, and Piz-t could not be estimated
because of the masking effect of Pita, the Pik allele, or Pi20. The number and kind of blast resistance
genes in IRRI varieties were limited in comparison with previously reported blast resistance genes.
Since Pik-s and another Pik allele were estimated in 17 varieties of five groups, and Pib in 38 varieties
of four groups, these genes were considered to be widely distributed in IRRI varieties.
Identifying blast resistance genes in eliteindica-type rice varieties bred at theInternational Rice Research InstituteL.A. Ebron, Y. Fukuta, T. Imbe, H. Kato, M.J.T. Yanoria, H. Tsunematsu, G. Khush, and M. Yokoo
Blast, caused by Pyricularia grisea (Cooke) Sacc. (P. oryzaeCavara), teleomorph Magnaporthe grisea (Hebert) Barr, isone of the most destructive diseases of rice (Oryza sativa L.)worldwide. The threat is especially serious in temperate andsubtropical rice production areas (Bonman 1992). In thetropics, blast is severe in upland and rainfed lowland envi-ronments. Susceptible varieties can be severely damagedby blast even under irrigated conditions (Bonman andMackill 1988). Control of blast disease can be achieved bygrowing resistant varieties (Yu et al 1991, Bonman et al1992). Hence, breeding for blast resistance is a major objec-tive in a rice improvement program.
Resistance to rice blast has been explained by the gene-to-gene theory between the resistance gene in the host andthe avirulence gene in P. grisea (Kiyosawa 1972, Silue et al1992). To date, around 40 blast resistance genes and theirchromosomal locations have already been reported (RGC1998). In spite of the wide distribution of many known genesin rice varieties grown in different countries, genetic stud-ies of blast resistance are limited in the tropics. This is partly
attributed to the lack of a suitable differential system for theefficient identification of those genes. Additionally, the pres-ence of several resistance genes in indica-type varieties makesgenetic studies of blast resistance genes difficult (Mackill etal 1985, Yu et al 1987).
The information regarding blast resistance genes in in-dica-type varieties has been limited as well in IRRI-bredvarieties and lines. Several resistance genes, such as Pita(Kiyosawa 1966), Pita-2 (Kiyosawa 1967), Pik-h (Kiyosawaand Murty 1969), Pik-p (Kiyosawa 1969), Piz-t (Yokoo andKiyosawa 1970), Pib and Pit (Yokoo et al 1978), Pi6(t) (Yu1991), Pi11(t)[Piz-h] (Zhu et al 1993), Pi8 (Pan et al 1996),Pi16(t) (Pan et al 1999), and Pi17(t) (RGC 1996), have beenidentified in indica-type varieties. Regarding IRRI-bredvarieties, Flores-Gaxiola et al (1983) reported two comple-mentary genes and one dominant gene in the genetic analy-sis using hybrid progenies derived from a cross between IR8and Tetep. Yu et al (1987) showed that the resistance in fivevarieties, IR36, IR46, IR54, IR56, and IR60, bred at the In-ternational Rice Research Institute (IRRI), and four tradi-

54
tional varieties, Carreon, Paikantao, Pankhari 203, and Tetep,was controlled by one or two dominant genes. These au-thors also recognized a recessive gene that controlled resis-tance in IR54 against one blast isolate, but the genotypes ineach variety were not clarified. Yamaguchi et al (1996) re-ported that IR50 had two resistance genes, Pia and Pib,from analysis using Japanese blast isolates. Imbe et al (1997)reported that four resistance genes, Pia, Pib, Pik-s, and Pi20,were included in IR24 based on genetic analysis using blastisolates from the Philippines. Genotypic information in IRRI-bred and indica-type varieties was quite limited.
The lack of a differential system for blast resistancegenes has been examined recently using blast isolates fromthe Philippines. Yanoria et al (2000) examined the patho-genicities of around 150 blast isolates from IRRI’s stockcollection using differential varieties and lines. Several iso-lates showed distinct reaction patterns to known resistancegenes, and these were selected for use in a differential sys-tem. Moreover, Tsunematsu et al (2000) studied in detailthe pathogenicities of 12 isolates, which were selected byYanoria et al (2000), using 29 monogenic lines that weretargeting 23 known blast resistance genes and containing asingle gene in each genetic background. The set of mono-genic lines and selected blast isolates from the Philippinescan be used as a differential system to clarify the pathoge-nicity of the isolates and genotype of the rice varieties.
IRRI-bred varieties have been distributed worldwideand used by farmers and breeders as important parental va-rieties in breeding programs. One IRRI variety, IR8, releasedin 1966, triggered the Green Revolution in tropical coun-tries of Asia (Hossain 1995). IR36 once dominated rice pro-duction in several Asian countries in the 1970s (IRRI 1982).Released in 1985, IR64 has been widely accepted as a high-quality rice variety in many countries because of its desir-able combination of intermediate amylose content and in-termediate gelatinization temperature (Khush 1987). A morerecent variety, IR72, has high yield potential, shorter growthduration, and improved resistance to several diseases andinsect pests (Kropff et al 1990). Other than these outstand-ing traits, IRRI-bred varieties may be carrying importantblast resistance genes useful for deployment in blast-proneenvironments or for breeding blast-resistant rice varieties.However, this has not been well understood. For the effec-tive use of these genes, it is necessary to elucidate the ge-netic constitution for blast resistance of these varieties. Thisstudy tried to identify the kinds of blast resistance genes inIRRI-bred varieties using a differential system developedby Yanoria et al (2000) and Tsunematsu et al (2000).
Materials and methods
IRRI-bred varieties
A total of 42 indica-type varieties bred at IRRI were used forestimating blast resistance genes. These included, amongothers, IR8, IR24, IR36, IR64, and IR72, which have beenwidely distributed and used in many countries because oftheir outstanding traits. Eight varieties—PSBRc1, PSBRc2,
PSBRc4, PSBRc10, PSBRc18, PSBRc20, PSBRc28, andPSBRc30—developed by IRRI and designated by the Phil-ippine Seed Board were also included.
Inoculation and evaluation
Pregerminated seeds were sown in a 20 × 35-cm plastic tray,with seven seedlings for each variety replicated two times.Ten grams of ammonium sulfate was applied to each tray asbasal fertilizer and 1 g was added 1 week before inocula-tion. In all cases, two susceptible varieties, CO39 andLijiangxintuanheigu (LTH), were included in each tray tocheck the success of inoculation and virulence of the Phil-ippine blast isolates used.
Fourteen blast isolates previously selected by Yanoriaet al (2000) were used for inoculation. Virulence genotypesof these isolates have been confirmed and diverse pathoge-nicities have been shown. At the fourth-leaf stage, each trayof seedlings was sprayed with 40–50 mL of spore suspen-sion adjusted to 1015 spores mL–1. Trays were placed insidewet jute sacks for 18–24 h and transferred to an air-condi-tioned glasshouse room with 23 ± 3 °C/30 ± 5 °C night andday temperature. Blast incidence on each seedling was ex-amined 6–7 days after inoculation. The reaction was evalu-ated using a 0–5 scale with slight modification as describedby Mackill and Bonman (1992). The values 0 to 2, 3–, 3+,and 5 were evaluated as resistant (R), moderately resistant(MR), moderately susceptible (MS), and susceptible (S), re-spectively.
Estimation of the genotype of the resistance gene
The genotype of the blast resistance gene in the IRRI vari-ety was estimated based on the differential system devel-oped by Yanoria et al (2000) and Tsunematsu et al (2000).The estimation was carried out based on the reaction pat-terns of nine kinds of monogenic lines to 14 blast isolatesfrom the Philippines (Table 1). Each monogenic line car-ried a different single resistance gene—Pi20, Pita, Pik-s,Pia, Pib, Piz-t, Pii, Pi3, and one of the Pik alleles (other thanPik-s). In the pathogenicity test of blast isolates, Pik-s couldbe distinguished from the other four Pik alleles, Pik, Pik-h,Pik-m, and Pik-p. However, no isolates were available toclassify the four alleles (Tsunematsu et al 2000, Yanoria etal 2000). The four alleles were designated tentatively asPik† in this study.
The IRRI varieties were classified into seven varietygroups with distinct reaction patterns. The differences inreaction patterns of the groups were based mainly on thepresence of three genes—Pi20, Pita, and Pik†. These threegenes showed a relatively wider spectrum of resistance thanthe other estimated genes. These demonstrated incompat-ibilities with several blast isolates but were easily deter-mined by reactions to three isolates, M36-1-3-10-1, IK81-25, and PO6-6. Each of these isolates was known to possessavirulence to only one of these three genes, that is, M36-1-3-10-1 (avirulent to Pi20), IK81-25 (avirulent to Pita), andPO6-6 (avirulent to Pik†). Hence, the presence or absence ofthe genes Pi20, Pita, and Pik† was estimated by an R (resis-

55
Ta
ble
1.
Cla
ss
ific
ati
on
of
IRR
I ri
ce
cu
ltiv
ars
an
d t
he
es
tim
ate
d b
las
t re
sis
tan
ce
ge
ne
s f
or
ea
ch
cu
ltiv
ar
gro
up
fo
llo
win
g t
he
re
ac
tio
n p
att
ern
s o
f th
e m
on
og
en
ic l
ine
s t
o P
hil
ipp
ine
bla
st
iso
late
s
of
Pyri
cu
lari
a g
rise
a S
ac
c.
Mo
no
ge
nic
lin
eV
ari
ety
gro
up
(V
G)
Iso
late
IRB
L2
0-
IRB
Lta
-IR
BLk
-IR
BLk
s-IR
BLa
-IR
BLb
-IR
BLzt
-IR
BLi-
IRB
L3
-
1
23
45
6
7
IR2
4C
P1
Ka
F5
AB
TF
5C
P4
(Pi20
)(Pita
)(Pik†)d
(Pik-s
)(Pia
)(Pib
)(Piz-t
)(Pii
)(Pi3
)a
ba
bc
(–,Pita
,–)
(–,–
,Pik*
)(Pi20
,–,Pik
*)
(–,Pita
,Pik
*)
ab
(
–,–
,–)e
(Pi20
,–,–
)
(Pi20
, Pita
,–)
PO
6-6a
SS
RS
SS
SRc
RS
SS
SS
SR
RR
SR
IK8
1-2
5a
SR
SS
SS
Sc
R-M
RS
R-M
SS
SR
SS
RR
R
M3
6-1
-3-1
0-1a
RS
SS
SS
SS
SS
SR
RR
SM
RS
RR
IK8
1-3b
SR
RS
SS
SR
-MM
SR
-MS
SS
RM
RR
RR
BN
11
1a
RS
RS
SS
SR
RS
SR
RR
SR
RR
RR
Ca
89a
SS
RS
SS
SS
SS
SS
SS
SR
RR
SS
V8
50
25
6b
SR
RS
SS
SS
SS
SS
SS
MR
RR
RM
M3
9-1
-3-8
-1b
SR
SS
SS
RM
R-M
SR
SR
RR
SS
RR
R
M6
4-1
-3-9
-1a
SR
-MS
SS
SR
SS
SR
SM
RR
SS
RR
R
M3
9-1
-2-2
1-2b
RS
SS
SS
SR
-MR
SS
RR
RS
SR
SR
R-M
BN
20
9a
SS
RS
SR
-MS
SS
RR
RR
RR
RR
RR
R
V8
50
19
6a
SR
RR
SS
SR
RR
RR
MR
RR
RR
RR
B9
00
02a
RR
RS
RR
RS
SR
RR
RR
RR
RR
RR
C9
23
-49a
RS
RS
RR
RS
SR
RR
RR
RR
RR
RR
Va
rie
tyIR
20
IR2
9 I
R3
4IR
8IR
43
PS
BR
c2
IR5
, IR
32
PS
BR
c4
IR74
IR5
6IR
46
PS
BR
c1
0
IR2
8IR
22
IR3
6, I
R3
8IR
70
IR4
8P
SB
Rc1
8
IR3
0IR
24
IR4
0, I
R4
2IR
64
PS
BR
c2
0
IR4
5IR
26
IR4
4, I
R5
0P
SB
Rc2
8
IR5
5P
SB
Rc3
0IR
52
, IR
54
IR5
8, I
R6
0
IR6
2, I
R6
5
IR6
8, I
R7
2
PS
BR
c4
Ad
dit
ion
al
Pib
Pib
Pib
e
sti
ma
ted
ge
ne
Pib
Pik-s
Pib
Pik-s
Pib
Un
kn
ow
n–
–Pib
Pib
Pik-s
Piz-t
Pik-s
Un
kn
ow
nPiz-t
Pii o
r Pi3
Un
kn
ow
n
aTsu
ne
ma
tsu
et
al
(20
00
). b
Ad
dit
ion
al
bla
st
iso
late
s u
se
d b
y o
ur
gro
up
. cN
ew
da
ta o
bta
ine
d u
sin
g a
dva
nc
ed
ge
ne
rati
on
of
the
ma
teri
als
. R
= r
es
ista
nt,
S =
su
sc
ep
tib
le,
M =
mo
de
rate
ly r
es
ista
nt,
R-M
= r
es
ista
nt
to m
od
era
tely
re
sis
tan
t. d
Als
o i
nclu
de
s m
on
oge
nic
lin
es c
arr
yin
g
oth
er Pik
all
ele
s, Pik-p
, Pik-h
, a
nd
Pik-m
, sh
ow
ing s
imila
r re
acti
on
pa
tte
rn w
ith
IR
BLk
-Ka
. eG
en
oty
pe
of
thre
e k
ind
s o
f b
last
resis
tan
ce
ge
ne
s, Pi20
, Pita
, a
nd
Pik*
.

56
tant) or S (susceptible) reaction to M36-1-3-10-1, IK81-25,and PO6-6 in a particular variety. The other isolates used inthe study possessed different combinations of avirulence toknown blast resistance genes other than Pi20, Pita, and Pik†.
Reclassification of the groups into subgroups was basedon the presence of Pib, Pik-s, Piz-t, and Pii or Pi3. IsolatesM36-1-3-10-1, IK81-25, and PO6-6 were virulent to Pib,Pik-s, and Piz-t; hence, reactions to other isolates were ana-lyzed to estimate these genes; this included resistance toBN209, V850196, B90002, C923-49, M39-1-3-8-1, andM64-1-3-9-1. One of the two genes, Pii or Pi3, was esti-mated based on the reaction to PO6-6 and Ca89. Both iso-lates had similar pathogenicities, except virulence to Piiand Pi3.
Results
Seven variety groups, VG 1 to VG 7, were formed in classi-fying the 42 IRRI rice varieties. In some cases, subgroupswithin a group were also formed whenever the variety re-acted differently to a particular isolate. Three variety groups,VG 1, VG 2, and VG 7, were subdivided into two, three, andtwo subgroups, respectively. The number of varieties in eachgroup varied from 1 to 17 (Table 1).
VG 1
This group was characterized by the absence of the threegenes, Pi20, Pita, and Pik†. Seven varieties, which showedan S reaction to M36-1-3-10-1 and PO6-6, were included inthis group. Except for IR29 and IR34, the other five variet-ies also showed susceptibility to IK81-25. The R reaction ofIR29 and IR34 to IK81-25 was estimated to be conferred byan unknown gene. Other than with IK81-25, Pita is alsoincompatible with IK81-3 and V850256. IR29 and IR34showed an R-M reaction to IK81-3 but an S reaction toV850256, indicating the absence of Pita. In addition, threegenes, Pib, Pik-s, and Piz-t, were included in this group andthe varieties were reclassified into two subgroups, VG 1aand VG 1b. Two genes, Pib and Pik-s, were estimated to becommon in both subgroups based on their resistance toBN209, BN90002, C923-49, and V850196. Although Pitaand Pik† were also incompatible among these four isolates,resistance to BN209, B90002, and C923-49 was otherwiseestimated to be due to Pib, and Pik-s was incompatible toV850196. Five varieties, IR20, IR28, IR30, IR45, and IR66,in VG 1a showed an S reaction to two blast isolates, M39-1-3-8-1 and M64-1-3-9-1, whereas IR29 and IR34 in VG 1bwere resistant. Based on the reaction pattern, Piz-t and Pitawere incompatible with these isolates. Since Pita was ab-sent in this group, resistance to M39-1-3-8-1 and M64-1-3-9-1 was estimated to be due to Piz-t.
VG 2
Seven varieties, IR8, IR22, IR24, IR26, PSBRc30, IR43,and PSBRc2, were included in this group characterized byPi20. These showed R and S reactions to isolate M36-1-3-10-1, which is avirulent to Pi20, and to two isolates, IK81-
25 and PO6-6, which were virulent to Pi20. Additionally,all varieties showed an R reaction to three isolates, BN209,B90002, and C923-49, that were avirulent to Pib. Theseresults indicated that all varieties in VG 2 probably had Pib.
VG 2 was divided into three subgroups, VG 2a, VG 2b,and VG 2c, differentiated by reactions to three isolates, M39-1-3-8-1, M64-1-3-9-1, and V850196. Two subgroups, VG2a and VG 2c, showed resistance to V850196 and VG 2bwas moderately resistant to it. Pita and Pik† were not in-cluded among VG 2’s varieties, and the R reaction toV850196 was estimated to be due to Pik-s. The moderateresistance to the same isolate in VG 2b could be due to anunknown gene. Variety PSBRc2 in VG 2c was resistant toboth isolates, M39-1-3-8-1 and M64-1-3-9-1, and was esti-mated to have Piz-t. VG 2b showed resistance to only M39-1-3-8-1 and moderate resistance to M64-1-3-9-1. These kindsof resistance could not be associated with the reaction pat-terns in the differential system using the 14 isolates.
VG3
This group had the largest number of varieties character-ized by the presence of Pita. Seventeen varieties, IR5, IR32,IR36, IR38, IR40, IR42, IR44, IR50, IR52, IR54, IR58, IR60,IR62, IR65, IR68, IR72, and PSBRc4, were included. Inaddition to resistance to IK81-25, the presence of Pita inVG 3 varieties was supported by resistance to isolates M39-1-3-8-1, M64-1-3-9-1, and IK81-3. All varieties in this groupalso showed an R reaction to two isolates, BN209 and C923-49. Since these isolates were avirulent to Pib, this gene wasalso estimated to be VG 3.
VG 4
This group was characterized by Pik† and only one variety,PSBRc1, was classified. PSBRc1 was moderately resistantto M36-1-3-10-1 but was susceptible to M39-1-2-21-2 andIK81-25, indicating that PSBRc1 did not carry the othergenes, Pi20 and Pita. It also showed moderate resistance toisolate IK81-3. It was estimated that additional unknowngene(s) conferred the moderate resistance in this variety.
VG 5
Only IR74 was included in this group, which was estimatedto have two genes, Pik† and Pi20. Its S reaction to IK81-25indicated tha absence of Pita in the variety.
VG 6
This group was characterized by Pita and Pik† and includedtwo varieties, IR56 and IR70. Although the resistance ofIR56 and IR70 corresponded approximately to the reactionpatterns of Pita and Pik†, the reaction among the varieties toisolate V850256 ranged from M to R.
VG 7
This group, characterized by Pi20 and Pita, was dividedinto two groups, VG 7a and VG 7b. All seven varieties alsoshowed an R reaction to isolate BN209, suggesting that VG7 varieties had Pib. The two subgroups were differentiated

57
by the reaction to isolate PO6-6. VG 7a was susceptible andVG 7b was resistant to the isolate. The R reaction was esti-mated to be due to one of the two genes, Pii or Pi.
Discussion
The 42 IRRI rice varieties were classified into seven groupsbased on the estimated presence of three resistance genes,Pi20, Pita, and Pik†. Moreover, the presence of other addi-tional genes, Pib, Pik-s, Pik-t, and Pii or Pi3, was estimatedaccording to the differential system by using the reactionpatterns of the monogenic lines to blast isolates from thePhilippines.
Among them, 15 varieties with Pi20 were classifiedinto three groups, VG 2, VG 5, and VG 7. IR8 and its derivedprogeny IR24 were included in VG 2. All the other varietiesin VG 2 were bred from the crosses with IR8, IR24, or Peta.In the other groups, IR8, IR24, and Peta and their progenieswere similarly found in the pedigrees of the varieties. Otherthan Peta, variety Sigadis was also included in the pedigreeof IR24. Peta and Sigadis were estimated to carry Pi20, basedon an analysis using the differential system with the Philip-pine blast isolates (unpublished data). Moreover, Imbe et al(1997) found Pi20 in IR24. These results suggested thatPi20 was introduced from Peta or Sigadis in the early stageof IRRI breeding activities.
Pita was included in the largest group of varieties, VG3. IR36, once the most popular semidwarf variety (IRRI1982), and its sister lines were found in the pedigrees ofthese varieties. IR36 was selected from the progeny of IRRIbreeding line IR2071, derived from crosses of the progeniesof IR24 and IR8. The five varieties (IR32, IR38, IR40, IR42,and IR44) were also selected from IR2071 and IR2070 thathad the same parental line, CR94-13. The other varieties,IR50, IR52, IR54, IR58, IR60, IR62, IR65, IR68, and IR72,have IR36, IR2071, or IR36 hybrid progenies in their pedi-grees. Several more recent varieties from other groups con-taining Pita, such as IR56 and IR70 in VG 6, and IR64,PSBRc10, PSBRc18, PSBRc20, and PSBRc28 in VG7, alsohave IR36 or its progenies in their pedigrees. IR36 was prob-ably responsible for transmitting Pita into these varieties.CR94-13 was believed to carry Pita, which is effectiveagainst Philippine blast isolates (unpublished data).Kiyosawa (1966) reported that a rice variety from the Phil-ippines, Tadukan, had Pita. Tadukan was also included inthe breeding of IR36. From these findings, CR94-13 orTadukan could be the source of Pita in IRRI varieties.
Kiyosawa (1972) and Kiyosawa and Ando (1997) re-ported that five alleles, Pik, Pik-h, Pik-m, Pik-p, and Pik-s,were found in the Pik locus. Although Pik, Pik-h, Pik-m, andPik-p could not be distinguished from each other using blastisolates from the Philippines, one of them was found inPSBRc1 of VG 4, IR74 of CG 5, and IR56 and IR70 of CG6.Dawn, Tadukan, and Tetep were included in the pedigreesof these IRRI varieties. Kiyosawa (1981) reported that Pik-h was identified in Dawn, Tadukan, and Tetep. On the basisof this, the gene of the Pik allele in VGs 4, 5, and 6 was
estimated to be Pik-h.In the development of IRRI rice varieties, Peta was used
in a cross with semidwarf variety Dee-geo-woo-gen (DGWG),from which IR8 was selected. Peta and its derivatives suchas IR8 were used in the subsequent development of manyIRRI varieties. With the use of blast isolates from the Philip-pines, Peta and DGWG were estimated to carry Pib and Pik-s, respectively (unpublished data). These findings suggestedthat Peta and DGWG were the sources of Pib and Pik-s ofIRRI varieties.
Yokoo and Kiyosawa (1970) reported that Piz-t showeda broad resistance spectrum against the races of blast fungusand was transmitted by an Indian variety, TKM1. With theuse of blast isolates from the Philippines, Piz-t was esti-mated in TKM6, which was one of the lines in the TKMbreeding series (unpublished data). The presence of Piz-twas estimated to be in IR29 and IR34 of VG 1b and PSBRc2of VG 2c. These three varieties have TKM6 and its progenyin their pedigrees. Although IR28 of VG 1a is a sister vari-ety of IR29 and IR34, it failed to inherit Piz-t. Thus, TKM6was etimated to be a source of Piz-t of these varieties.
Among the seven resistance genes, two genes, Pib andone of the Pik alleles, Pik-s or Pik-h, were included in al-most all varieties. The genes of the Pik allele were estimatedin 17 varieties of five groups and those of Pib in 38 varietiesof four groups. These results indicate that the Pib and Pikalleles’ genes are commonly included in IRRI-bred variet-ies.
The gene Pia may also be included, as shown by theresistance of the varieties to avirulent blast isolates B90002and C923-49. However, Pia was masked by the presence ofPik†, Pi20, or Pita in the varieties. Blue Bonnet, a varietyfrom the United States, was introduced in the developmentof IR24 and was identified to carry Pia (Kiyosawa 1972).IR24 could have inherited Pia from Blue Bonnet and likelytransmitted the gene to its progenies. Although Pib waspostulated in the varieties in VGs 1, 2, 3, and 7, it may alsobe included in VGs 4, 5, and 6. Pik-h and Pi20 in the variet-ies might have masked the effect of Pib; this gene was thusnot estimated. Pik-s was included in VGs 1 and 2, whereasthe other Pik alleles were postulated in VGs 4, 5, and 6. Pik-s was also possibly included in VGs 3 and 7 for the samereason that Pib was included. In our study based on thedifferential system using blast isolates from the Philippines,the existence of these genes in IRRI varieties could not beconfirmed.
Around 40 blast resistance genes have already beenreported (RGC 1998). Comparatively, we could postulate alimited number of blast resistance genes in the IRRI variet-ies probably because of the genetic relatedness among thesevarieties. In the development of IRRI varieties, IR8, IR24,and IR36 or their progenies were often included. Because ofthis breeding methodology, many IRRI varieties showedsimilar reaction patterns to the blast isolates. This study isthe first in elucidating the genetic constitution for blastresistance of important indica-type rice varieties in the trop-ics. Previous studies on a few IRRI varieties and lines fo-

58
cused on the inheritance of resistance to particular blastisolates from the Philippines. The number of genes confer-ring the resistance to the isolates was determined by segre-gation ratios. However, the genotypes of the blast resistancegenes were unknown. In our study, at least seven kinds ofblast resistance genes were estimated in the varieties byanalyzing the reaction patterns to well-characterized blastisolates. We could also demonstrate the ability of the differ-ential system to estimate the genotypes of multiple genesfor blast resistance carried in a variety. Using reaction pat-tern data, on the other hand, we faced limitations becauseresistance may result from the masking of some genes.Masked genes in some varieties are difficult to infer by re-action patterns and will require genetic analysis to clarifythem. However, their genotypes in a variety may be pre-sumed by examining the avirulence genotypes of the iso-lates used. In this study, we used isolates that have beenclarified for their avirulence genotypes, thus revealing thekinds of blast resistance genes to which they exhibited in-compatible reactions. We also examined the pedigrees ofthe varieties to relate the estimated genes (masked genesincluded) to the parental varieties involved in developingthese varieties. Although pedigree data may not be conclu-sive evidence, nevertheless, they are also important in in-ferring the presence and the kind of genes in the varieties.Genetic analysis on the basis of segregation and allelismanalyses will be necessary to confirm the presence of esti-mated and masked gene(s). Wang et al (1999) and Jia et al(2002) published the sequence information of two genes,Pib and Pita, and molecular markers that can directly detectthese genes have been developed. These molecular markerswill also be useful for confirming and identifying the resis-tance genes. The reaction patterns to well-characterized blastisolates from the Philippines were particularly useful in es-timating blast resistance genes in the varieties. More impor-tantly, the information produced from this study should alsobe quite useful in rice blast resistance breeding using IRRI-bred rice varieties.
References
Bonman JM, Mackill DJ. 1998. Durable resistance to rice blastdisease. Oryza 25:102-110.
Bonman JM, Khush GS, Nelson RJ. 1992. Breeding rice for re-sistance to pests. Annu. Rev. Phytopathol. 30:507-528.
Bonman JM. 1992. Durable resistance to rice blast disease: envi-ronmental influences. Euphytica 63:115-123.
Flores-Gaxiola JA, Nuque FL, Crill JP, Khush GS. 1983. Inherit-ance of blast (Pyricularia oryzae) resistance in rice. Int.Rice Res. Newsl. 8:5-6.
Hossain M. 1995. Sustaining food security for fragile environ-ments in Asia: achievements, challenges, and implicationsfor rice research. Proceedings of the International Rice Re-search Conference. Manila (Philippines): International RiceResearch Institute. p 3-23.
Imbe T, Oba S, Yanoria MJT, Tsunematsu H. 1997. A new genefor blast resistance in rice cultivar IR24. Rice Genet. Newsl.14:60-62.
IRRI (International Rice Research Institute). 1982. IR36, theworld’s most popular rice. Manila (Philippines): IRRI.
Jia Y, Wang Z, Singh P. 2002. Development of dominant riceblast Pi-ta resistance gene markers. Crop Sci. 42:2145-2149.
Khush GS. 1987. Rice breeding: past, present, and future. J. Genet.66(3):195-216.
Kiyosawa S. 1966. Studies in inheritance of resistance of ricevarieties to blast. 3. Inheritance of a rice variety Pi No. 1 tothe blast fungus. Jpn. J. Breed. 16(2):31-38.
Kiyosawa S. 1967. Inheritance of resistance of the rice variety PiNo. 4 to blast. Jpn. J. Breed. 17:165-172.
Kiyosawa S, Murty VVS. 1969. The inheritance of blast resis-tance in Indian rice variety HR-22. Jpn. J. Breed. 4:269-276.
Kiyosawa S. 1969. Inheritance of resistance of rice varieties to aPhilippine fungus strain of Pyricularia grisea. Jpn. J. Breed.2:61-73.
Kiyosawa S. 1972. Genetics of blast resistance. In: Rice breed-ing. Manila (Philippines): International Rice Research Insti-tute. p 203-225.
Kiyosawa S. 1981. Gene analysis for blast resistance. Oryza18:196-203.
Kiyosawa S, Ando I. 1997. Inheritance of resistance. In: MatsuoT, Futsuhara Y, Kikuchi F, Yamaguchi, editors. Science ofthe rice plant. Vol. 3. Genetics. Tokyo (Japan): NosanGyoson Bunka Kyokai (Nobunkyo). p 470-506.
Kropff MJ, Cassman KG, Peng S, Matthews RB, Setter TL.1990. Quantitative understanding of yield potential. Proceed-ings of a workshop on rice yield potential in favorable envi-ronments. Manila (Philippines): International Rice ResearchInstitute. p 21-38.
Mackill DJ, Bonman JM, Suh HS, Srilingam R. 1985. Genes forresistance to Philippine isolates of the rice blast pathogen.Rice Genet. Newsl. 2:80-81.
Mackill DJ, Bonman JM. 1992. Inheritance of blast resistance innear-isogenic lines of rice. Phytopathology 82(7):746-748.
Pan QH, Wang L, Ikehashi H, Tanisaka. 1996. Identification of anew blast resistance gene in the indica rice cultivar Kasalathusing Japanese differential cultivars and isozyme markers.Genetics 86(10):1071-1075.
Pan QH, Wang L, Tanisaka. 1999. A new blast resistance geneidentified in the Indian native rice cultivar Aus373 throughallelism and linkage tests. Plant Pathol. 42:288-293.
RGC (Rice Genetics Cooperative). 1996b. Report of the Commit-tee on Gene Symbolization, Nomenclature and LinkageGroups. Rice Genet. Newsl. 13:12-26.
RGC (Rice Genetics Cooperative). 1998b. Report of the Commit-tee on Gene Symbolization, Nomenclature and LinkageGroups. Rice Genet. Newsl. 15:13-76.
Silue D, Notteghem JL, Tharreau D. 1992. Evidence of a gene-for-gene relationship in the Oryza sativa-Magnaporthe griseapathosystem. Phytopathology 82:577-580.
Tsunematsu H, Yanoria MJT, Ebron LA, Hayashi N, Ando I,Kato H, Imbe T, Khush GS. 2000. Development of mono-genic lines of rice for blast resistance. Breed. Sci. 50:229-234.

59
Wang ZX, Yano M, Yamanaouchi U, Iwamoto M, Monna L,Hayasaka H, Katayose Y, Sasaki T. 1999. The Pib gene forrice blast resistance belongs to the nucleotide binding andleucine-rich repeat class of plant disease resistance genes.Plant J. 19:55-74.
Yamaguchi M, Saitoh H, Yaegashi H, Ikeda R, Higashi T. 1996.Genetic analysis for true resistance to blast in rice varieties.Int. Rice Res. Notes 21:2-3.
Yanoria MJT, Imbe T, Tsunematsu H, Ebron LA, Mercado D,Kato H, Fukuta Y. 2000. Pathogenicity of IRRI blast isolatesto rice blast resistance genes. Poster presented at the 4thInternational Rice Genetics Symposium, 22-27 October 2000,International Rice Research Institute, Manila, Philippines.
Yokoo M, Kiyosawa S. 1970. Inheritance of blast resistance ofthe rice variety, Toride 1, selected from the cross Norin 8 ×TKM1. Jpn. J. Breed. 3:129-132.
Yokoo M, Kikuchi F, Fujimaka H, Nagai K. 1978. Breeding ofblast-resistant lines (BL1 to 7) from indica-japonica crossesof rice. Jpn. J. Breed. 28(4):359-365.
Yu ZH, Mackill DJ, Bonman JM. 1987. Inheritance of resistanceto blast in some traditional and improved rice cultivars. Ge-netics 77(2):323-326.
Yu ZH, Mackill DJ, Bonman JM, Tanksley SD. 1991. Tagginggenes for blast resistance in rice via linkage to RFLP mark-ers. Theor. Appl. Genet. 81:471-476.
Yu ZH. 1991. Molecular mapping of rice (Oryza sativa L.) genesvia linkage to restriction fragment length polymorphism(RFLP) markers. PhD dissertation. Cornell University, Ithaca,N.Y., USA. 102 p.
Zhu LY, Chen Y, Xu Y, Xu J, Cai H, Ling Z. 1993. Constructionof a molecular map of rice and gene mapping using a doublehaploid population of a cross between indica and japonicavarieties. Rice Genet. Newsl. 10:132-135.
Notes
Authors’ addresses: L.A. Ebron, J.M.T. Yanoria, G. Khush, In-ternational Rice Research Institute, DAPO Box 7777, MetroManila, Philippines; Y. Fukuta, Japan International ResearchCenter for Agricultural Sciences (JIRCAS) 1-1, Ohwashi,Tsukuba, Ibaraki 305-8686, Japan; T. Imbe, National Insti-tute of Crop Science, 2-1-18, Kannondai, Tsukuba, Ibaraki,305-8517, Japan; H. Kato, Miyazaki Agricultural Experi-ment Station, Minemae 5851, Shimonaka, Sadowara,Miyazaki, 880-0212, Japan; H. Tsunematsu, Japan Interna-tional Research Center for Agricultural Sciences, 1-1,Ohwashi, Tsukuba, Ibaraki, 305-8686, Japan; and M. Yokoo,Institute of Agriculture and Forestry, University of Tsukuba,Tennodai, Tsukuba, Ibaraki, 305-8572, Japan.
Acknowledgments: We thank the Entomology and Plant Pathol-ogy Division of the International Rice Research Institute forproviding us with the blast isolates. This research was fundedby the IRRI-Japan Collaborative Research Project.

61
Heading date is a most important trait for adaptation to different cultivation regions and croppingseasons. Quantitative trait loci (QTL) analysis for heading date in rice (Oryza sativa L.) has been doneusing recombinant inbred (RI) lines in Japan and the Philippines. We tried to identify chromosomalregions associated with heading date and to investigate genotype by environment interactions atindividual QTLs under different conditions from temperate to tropical regions. A total of 190 RI linesthat were developed from a cross between indica-type Milyang 23 (M23) and japonica-type Akihikari(AK) by the single-seed descent (SSD) method were used. The RI populations were cultivated at ninesites in Japan from 1995 to 2000 and at Los Baños in five dry and wet seasons from 2000 to 2002,and a total of 33 replications were carried out. The RI population at each site showed a widevariation in days to heading, including transgressive segregation in late heading. The averages anddistributions of RI segregation varied depending on the differences in cultivated site and season(year, dry and wet). A total of 216 QTLs were detected on all chromosomes of rice except forchromosomes 5 and 8. Some 143 and 70 QTLs showed late heading with M23 and AK homozygousgenotypes, respectively. Two QTLs, in R7 and R11-2, were particularly characterized by the stronginfluence of and a conflicting relationship with heading date depending on the cropping conditionsas one of the typical cases of QTL reactions. In the investigations at nine sites of Japan in 1999 andat Los Baños in the dry and wet season of 2000, the higher-latitude site showed a later heading datein the average value and distribution of RI segregation. Two QTLs, in R7 and R11-2, showed a uniquereaction depending on the latitude. In the temperate region, the effect of the QTL in R7 indicated thatthe lower-latitude site showed a higher LOD and phenotypic variance explained (R2, %). The QTL inR11-2 indicated the opposite effect, that is, the higher-latitude site showed a higher LOD value. InLos Baños, these QTLs in R7 and R11-2 were detected only in the wet season of 2002 and dryseason of 2002, respectively. Eight other QTLs were detected in different dry seasons. These resultssuggest that heading date is controlled mainly by two QTLs in R7 and R11-2, with a contrastingrelationship in the temperate region, and the reaction patterns of QTLs in the tropical zone werecompletely different from those found in the temperate zone. The QTL reaction of the dry season wasunique in comparison with the wet season at Los Baños and at the temperate sites.
The reaction pattern of quantitative trait locifor agronomic traits under different regionsfor temperate and tropical riceY. Fukuta, E. Araki, S. Kobayashi, L.A. Ebron, T. Umemoto, S. Morita, K. Nagata, T. Sato,T. Nagamine, T. Fukuyama, H. Sasahara, H. Nemoto, H. Maeda, K. Hamamura, T. Ogata,Y. Matsue, K. Ichitani, A. Takagi, K. Tamura, and G.S. Khush
Heading date is an important agronomic trait and it isstrongly associated with the regional adaptability of rice(Oryza sativa L.) cultivation (Kikuchi 1979). Genetic analy-sis for heading date of rice has been carried out and manygenes have been identified. At present, 23 major genes con-trolling heading date have been reported in rice, and 13 ofthem were determined to be located on the chromosome(Ichitani et al 1998a, Kinoshita 1998).
Recently, many chromosome regions affecting head-ing date have been reported using the genetic analysis ofquantitative trait loci (QTL) with molecular markers (Li etal 1995, 2003, Lin et al 1995, 1998, Xiao et al 1995, 1996,
1998, Prince et al 1997, Yano et al 1997, Lu et al 1997, Doiet al 1998).
Yano et al (1997) found five putative QTLs, Hd1, Hd2,Hd3, Hd4, and Hd5, for heading date on the centromericregions of chromosome 6, the long arm of chromosome 7,the short arm of chromosome 6, the centromeric regions ofchromosome 7, and the short arm of chromosome 8, respec-tively, using an F
2 population derived from the cross be-
tween japonica variety Nipponbare and indica varietyKasalath. Yamamoto et al (1998) confirmed that Hd1 inher-ited as a Mendelian factor based on segregation analysisusing chromosome segment substitution lines developed
62
by backcross breeding and marker-aided selection (MAS)with DNA markers. Ichitani et al (1998b) suggested thatHd1 and Hd4 corresponded with Se1 and E1, respectively,from the results of allelism analysis using the hybrid popu-lations derived from the crosses between Kasalath and 11tester lines with different genotypes of four photoperiod-sensitivity loci, E1, E2, E3, and Se1. Yokoo et al (1980) andIchitani et al (1998b) suggested that Se1 and E1 loci werestrongly associated with the regional differentiation of ricecultivars because Se1 had been known to have multiplealleles (Yokoo and Kikuchi 1977) and these two loci hadstrong effects when compared with the other photoperiod-sensitivity loci.
Lu et al (1997) detected four QTLs, hd-1, hd-8, hd-10a,and hd-10b, on the long arm of chromosome 1, short arm ofchromosome 8, and centromeric region and long arm of chro-mosome 10, respectively, using a doubled-haploid (DH)population established from a cross between indica varietyZhai-Ye-Qing 8 and japonica variety Jing-Xi 17. They triedto evaluate the interactions between genotype and environ-ment (G × E), that is, the phenotypic expression level ofQTLs in different environments based on investigations atthree sites with different degrees of northern latitude inChina, and suggested that environmental factors such asdaylength and temperature might affect the phenotypic ex-pression of heading date. On the basis of QTL analysis, Li etal (2003) also tried to reveal the G × E interactions of head-ing date in nine Asian environments using a DH populationwith indica variety IR64 crossed with Azucena. They coulddetect 20 QTLs for heading date on all 12 rice chromo-somes and indicated that the phenotypic expression of al-most all QTLs was influenced by environmental differences.These two studies were carried out under a restricted num-ber of investigation environments or replications at the samesite. However, although the existence of G × E interactionscould be proved, these did not explain the relationshipsbetween the genes (QTL) and environmental factors, andthe association of genes with the regional differentiation ofrice cultivars in detail.
Fukuta et al (1999) developed recombinant inbred (RI)lines derived from a cross between indica variety Milyang23 (M23) in Korea and japonica variety Akihikari (AK) inJapan. In this study, we try to identify the key gene(s) ofheading date for association with the regional differentia-tion of Asian rice cultivars, based on the reaction analysisfor the detected QTLs through various investigations underdifferent environments, geographical sites, cultivation yearsor seasons, and fertility conditions in the field, using M23and AK cross RI lines.
Materials and methods
Investigation of RI populations
A total of 190 RI lines that were developed from a crossbetween indica variety Milyang 23 (M23) and japonicavariety Akihikari (AK) by the single-seed descent (SSD)
method were used to investigate days to heading (DTH)(Fukuta et al 1999).
The RI populations were cultivated in irrigated fieldconditions (Table 1). A total of 33 replicated investigationswere carried out at nine different sites, Ohmagari (39°N,140°E) in 1999; Sendai (38°N, 140°E) in 1996, 1997, 1998,and 1999; Niigata (37°N, 138°E) in 1996 and 1999; Joetsu(37°N, 138°E) in 1995, 1996, 1997, 1998, 1999, and 2000;Tsukuba (36°N, 140°E) in 1997, 1998, and 1999; Tottori(35°N, 134°E) in 1999; Fukuyama (34°N, 133°E) in 1997and 1999; Fukuoka (33°N, 130°E) in 1997, 1998, and 1999;and Kagoshima (31°N, 130°E) in 1999 during the normalJapanese cropping season, May to October, and at IRRI,Los Baños (14°N, 121°E), Laguna, Philippines, in the dryseason from January to April of 2000, 2001, and 2002, andin the wet season from June to October of 2000 and 2001.This was done continually at five sites, Joetsu, Sendai,Tsukuba, Fukuoka, and Los Baños, and at all nine Japanesesites in 1999. Additionally, the RI population was culti-vated under different field conditions (no fertilizer and nor-mal fertilizer according to each site’s original method) atJoetsu and Sendai. At Joetsu and Sendai, fertilizer was ap-plied as 70 kg N ha–1 in 1996, 1997, and 1998, and as 100kg N ha–1 in 1997 and 1999.
Days to heading (DTH) after transplanting in irrigatedpaddy fields was investigated at each site and in each sea-son. DTH was defined as the time when 50% of the plants ina plot exserted at least one spikelet.
QTL analysis
Based on the genotypic data and a linkage map consistingof 182 restriction fragment length polymorphism (RFLP)markers (Fukuta et al 1999), QTLs for heading date wereestimated by interval mapping with a 1.0 cM interval in thecomputer program Qgene (Nelson 1997). An LOD score of2.0 was used as the threshold for detecting QTL locations inthe program, and the peak of the LOD score indicated theposition of the QTL.
Results
Segregation of days to heading
The RI population at each site showed a wide variation,including the transgressive segregation in late heading. Theaverages and distributions of RI segregation varied depend-ing on the differences of the cultivated site, season (year,dry and wet), and fertilization conditions (Table 1).
The higher-latitude site showed a later heading date inthe average value of RI segregation at nine sites in 1999and at Los Baños in the dry and wet season of 2000. Thesegregation at Sendai, Tsukuba, Tottori, Fukuyama, andFukuoka, and in the wet season of Los Baños showed distri-butions with two peaks (Fig. 1). These results suggestedthat DTH of the RI population changed dramatically ac-cording to the cropping sites, and few genes played an im-portant role in this segregation. In addition, the effects of

63
Table 1. Segregation of days to heading in Milyang 23/Akihikari recombinant inbred lines.
Site (latitude, Research conditions No. of lines Days to heading
longitude) used
Year or N fertilizer Milyang Akihikari Minimum Maximum Av Standard
season (kg ha–1) 23 deviation
Ohmagari 1999 190 81.0 65.0 65.0 95.0 74.7 5.2
(39°N, 140°E)
Sendai 1996 100 164 101.0 78.0 77.0 108.0 91.8 6.6
(38°N, 140°E) 1997 100 191 98.0 75.0 77.0 127.0 93.0 7.1
1997 0 190 97.0 75.0 76.0 113.0 89.5 6.4
1998 100 191 97.0 75.0 76.0 113.0 89.5 6.4
1999 100 190 93.0 70.0 70.0 102.0 83.7 5.4
1999 0 190 90.0 70.0 73.0 109.0 85.5 6.2
Average Normal 97.3 74.5 75.0 112.5 89.5
None 93.5 72.5 74.5 111.0 87.5
Niigata 1996 153 93.0 67.0 69.0 99.0 85.2 6.7
(37°N, 138°E) 1999 187 97.0 84.0 84.0 109.0 94.6 4.3
Average 95.0 75.5 76.5 104.0 89.9
Joetsu
(37°N, 138°E) 1995 70 187 93.0 72.0 71.0 126.0 85.4 7.6
1996 70 187 88.0 73.0 70.0 119.0 82.3 7.9
1996 0 190 90.0 73.0 70.0 117.0 82.3 7.3
1997 70 190 84.0 66.0 69.0 102.0 77.1 4.9
1997 0 190 84.0 66.0 65.0 105.0 77.4 5.1
1998 70 190 82.0 65.0 62.0 89.0 74.9 5.3
1998 0 190 80.0 65.0 67.0 98.0 75.5 5.2
1999 70 188 85.0 68.0 68.0 98.0 77.3 4.4
2000 70 188 80.0 63.0 63.0 95.0 75.9 5.0
Average Normal 85.3 67.8 67.2 104.8 78.8
None 84.7 68.0 67.3 106.7 78.4
Tsukuba 1997 186 74.0 61.0 58.0 82.0 68.5 3.8
(36°N, 140°E) 1998 190 92.0 83.0 71.0 95.0 79.8 3.8
1999 185 75.0 62.0 62.0 89.0 71.6 4.2
Average 80.3 68.7 63.7 88.7 73.3
Tottori 1999 190 72.0 54.0 55.0 80.0 66.4 5.0
(35°N, 134°E)
Fukuyama
(34°N, 133°E) 1997 185 78.0 61.0 63.0 80.0 72.0 3.8
1999 187 76.0 58.0 59.0 90.0 70.4 5.0
Average 77.0 59.5 61.0 85.0 71.2
Fukuoka 1997 186 69.0 55.0 54.0 85.0 64.5 4.1
(33°N, 130°E) 1998 190 61.0 47.0 47.0 71.0 55.6 4.2
1999 190 67.0 52.0 51.0 75.0 59.2 4.4
Average 65.7 51.3 50.7 77.0 59.8
Kagoshima 1999 190 64.0 43.0 45.0 71.7 57.9 5.0
(31°N, 130°E)
Los Baños 2000 Dry 50 188 67.0 50.0 38.0 68.0 54.4 4.9
(14°N, 121°E) 2000 Wet 50 190 62.0 44.0 33.0 67.0 56.3 4.1
2001 Dry 50 190 59.0 29.0 26.0 63.0 46.5 7.4
2001 Wet 50 182 51.0 24.0 30.0 59.0 45.4 4.9
2002 Dry 50 182 60.0 28.0 28.0 69.0 50.8 7.7
Average Dry 62.0 35.7 30.7 66.7 50.6
Wet 56.5 34.0 31.5 63.0 50.9

64
genes for heading date were influenced by the croppingconditions.
The distributions of the RI population at Joetsu from1995 to 2000, at Sendai from 1996 to 1999, and at Tsukubaand Fukuoka from 1997 to 1999 showed significant differ-ences among the years studied at each site. The averagevalue and range of segregation in the RI population atSendai, Joetsu, Tsukuba, and Fukuoka were 89.5 and 83.7–93.0, 78.8 and 75.9–85.4, 73.3 and 68.5–79.8, and 59.8 and55.6–64.5, respectively, in normal soil conditions. Two orthree peaks of segregation were observed in many investi-gations, but the distribution patterns were not similar amongyears at each site.
The reactions of RI populations to different fertilityconditions were also investigated. In the two fertility con-ditions (0 kg N ha–1 and 70 or 100 kg N ha–1), the RI popula-tion was cultivated at Joetsu in 1997 and 1998, and at Sendaiin 1997 and 1999. The differences in average and ranges ofsegregation in the RI population were smaller than thoseamong sites and years.
Among the nine sites in Japan, the averages and rangesof DTH in RI segregation were 59.8–87.5 and 55.6–91.8,respectively. At Los Baños, the values for the dry and wetseason were 50.6 and 46.5–54.4, and 50.9 and 45.4–56.3,respectively, and significant differences between them werenot recognized. The values at Los Baños were remarkablylower than those at the Japanese sites. These results indi-cated that the conditions at Los Baños in the tropical zonewere completely different from those in Japan in the tem-perate zone, and the reaction of the RI population mighthave changed.
These investigations of site, year, and fertility condi-tions showed that DTH was changed conspicuously by crop-ping season and site, but not by field soil conditions. Theseresults suggested that the environmental conditions, tem-perature, and length of day during the time of RI cultivationmight influence most the segregation.
QTL analysis
From the results of 33 replications, a total of 213 QTLs weredetected on all chromosomes of rice except for chromo-somes 5 and 8. These QTLs were detected repeatedly in 13chromosome regions on the long arm of chromosome 1 (R1),near the centromere (R2-1) and long arm (R2-2) of chromo-some 2, on the short and long arm of chromosome 3 (R3),near the centromere (R4-1) and on the long arm (R4-2) ofchromosome 4, on the long arm of chromosome 6 (R6), nearthe centromere of chromosome 7 (R7), on the short arm ofchromosome 9 (R9), near the centromere of chromosome 10(R10), and on the short arm (R11-1) and near the centromere(R11-2) of chromosome 11. Among these 213 QTLs, 143and 70 showed late heading with the M23 and AK homozy-gous genotype, respectively. These QTLs in 10 chromo-some regions–—R2-1, R2-2, R3-1, R3-2, R4-1, R4-2, R6,R7, R9-1, and R9-2–—and four regions–—R1, R10, R11-1,and R11-2–—showed late heading with the M23 and AKalleles, respectively (Fig. 2).
Among the chromosome regions that detected QTLs,the two QTLs in R7 and R11-2 were characterized by astrong influence on and mutual relationship with DTH de-pending on the investigated conditions as one of the typi-cal cases of QTL reactions. The QTL in R7 was detectedbetween RFLP markers XNpb33 and XNpb91 near the cen-tromere, and the M23 allele showed late heading. The QTLin R11-2 was also located between two RFLP markers(XNpb202 and XNpb257) near the centromere, with the AKallele showing late heading. In the temperate region, thefunction of the QTL in R7 showed that the lower-latitudesite had a higher LOD value. The QTL in R11-2 indicatedthe opposite, that is, the higher-latitude site had a higher
�
����
�
�
�
�
�
�
���
�
�� �� �� �� ��
��
��
����
����
����
����
��
��
��
��
����
����
����
��
��
��
���������� !
�"#!�$��% "&��'
�� (��
(����
�� (��
�� (��
�� (��
�� (��
�� (��
�� (��
(����
�� (��
(����
Fig. 1. Segregation of days to heading in recombinant inbred lines
derived from a cross between Milyang 23 and Akihikari. Data are
collected at nine sites of Japan in 1999 and at Los Baños, in the
dry and wet season of 2000. A = Ohmagari, n = 190; B = Sendai, n
= 190; C = Niigata, n = 187; D = Joetsu, n = 188; E = Tsukuba, n =
185; F = Tottori, n = 190; G = Fukuyama, n = 188; H = Fukuoka, n =
190; I = Kagoshima, n = 190; J = Los Baños, dry season, n = 188; K
= Los Baños, wet season, n = 190.

65
Fig. 2. Putative QTLs for days to heading in Milyang 23/Akihikari cross recombinant inbred lines. Investigations were carried out at nine
sites of Japan from 1995 to 1999 and at Los Baños, Philippines, in the dry and wet season of 2000. Almost all QTLs were detected in
several chromosome regions repeatedly, which were designated by R followed by a number. Triangles and bars indicate the position of
peaks and the range of LOD scores over 2.0. Two kinds of triangles (� and �) indicate the effects on late heading of Milyang 23 and
Akihikari genotypes, respectively. 99OMG = Ohmagari in 1999, 96SEN = Sendai in 1996, 97SEN = Sendai (100 kg N ha–1) in 1997, 97SEN
= Sendai (0 kg N ha–1) in 1997, 99SEN = Sendai (0 kg N ha–1) in 1999, 99SEN = Sendai (100 kg N ha–1) in 1999, 96NIG = Niigata in 1996,
99NIG = Niigata in 1999, 95JET = Joetsu in 1995, 96JET = Joetsu in 1996, 97JET = Joetsu (70 kg N ha–1) in 1997, 97JET = Joetsu (0 kg N ha–
1) in 1997, 98JET = Joetsu (70 kg N ha–1) in 1998, 98JET = Joetsu (0 kg N ha–1) in 1998, 99JET = Joetsu in 1999, 00JET = Joetsu in 2000, 97TSU
= Tsukuba in 1997, 98TSU = Tsukuba in 1998, 99TSU = Tsukuba in 1999, 97FYM = Fukuyama in 1997, 99FYM = Fukuyama in 1999, 97FOK
= Fukuoka in 1997, 98FOK = Fukuoka in 1998, 99FOK = Fukuoka in 1999, 99TTR = Tottori in 1999, 99KAG = Kagoshima in 1999, 00LBD
= Los Baños in 2000 dry, 00LBW = Los Baños in 2000 wet, 01LBD = Los Baños in 2001 dry, 01LBW = Los Baños in 2001 wet, 02LBD = Los
Baños in 2002 dry. The RFLP linkage map (Fukuta et al 1999) was modified and used.

66
LOD value. In Los Baños, the QTL in R7 wasdetected only in the wet season of 2000, and theQTL in R11-2 could not be detected in both thedry and wet seasons except for the dry season of2002. The two QTLs in R7 and R11-2 showed amutual relationship, but any tendency or relation-ship among QTLs in the other chromosome re-gions was not recognized according to the lati-tude (Fig. 3). The effects of R7 and R11-2 changedaccording to the geographical differences. Theserelationships between the QTLs of R7 and R11-2were detected only in Japan (temperate zone) andnot in Los Baños (tropical zone).
These effects of QTLs in R7 and R11-2 alsoshowed wide variations among years or seasonsat each site (Table 2). In the normal fertility con-ditions of four sites, Sendai from 1996 to 1999,Joetsu from 1995 to 2000, Tsukuba from 1997 to1999, and Fukuoka from 1997 to 1999, the LODscores of the QTL in R7 were 2.9–4.2, 3.0–13.1,8.7–11.6, and 8.7–12.1, respectively. The pheno-typic variance explained (R2, %) of the QTLs atSendai, Joetsu, Tsukuba, and Fukuoka also rangedwidely (6.8–17.5, 7.1–27.2, 19.3–24.4, and 19.4–25.3), respectively. The LOD scores and R2 (%) ofthe QTL in R11-2 at Sendai, Joetsu, Tsukuba, andFukuoka were in the ranges of 1.5–6.9 and 4.2–15.3, 2.3–9.2 and 5.5–20.2, 3.8–4.7 and 9.0–10.7,and 2.0–3.9 and 4.8–9.0, respectively. These re-sults suggested that the effects of the QTLs in R7and R11-2 were changed by the cropping year orseason. These effects of detected QTLs in the otherchromosome regions also showed remarkablechanges depending on years and seasons. In otherwords, segregation in the RI population and QTLeffects changed dramatically depending on envi-ronmental conditions such as temperature ordaylength during the growth stage.
In Los Baños, the QTLs in R7 and R11-2 weredetected only in the wet season of 2000 and dryseason of 2002, respectively. The QTL effects ofR7 and R11-1 were also not so high (LOD = 4.3and R2 = 9.9 %, and LOD = 2.0 and R2 = 5.0 %),respectively, compared with those of Japan. Eightspecific QTLs were detected only in the dry sea-son of Los Baños in three chromosome regions–—R2-2 (two QTLs), R4-1 (two), and R9-2 (two)–—and on the long arms of chromosomes 4 (flank-ing markers XNpb331–XNpb235) and 10 (C16–XNpb127). These results indicated that the reac-tion patterns of QTLs in Los Baños (tropical zone) werecompletely different from those found in Japan (temperatezone), and the dry season’s reactions were unique in com-parison with the wet season of Los Baños and the temperatezone.
These patterns and LOD scores and R2 (%) in intervalmapping analysis were not so different between the normal
and nonfertility conditions compared to those of years andsites. These results indicate that the influence of fertilityconditions on QTL reaction is smaller than that of site andseason.
These results suggest that the heading date in the RIpopulation was strongly influenced by environmental fac-tors (temperature and daylength), and two QTLs in R7 and
Fig. 3. Interval mapping of days to heading on chromosomes 7 and 11 on
the basis of data obtained at nine sites of Japan in 1999 and at Los Baños
in the dry and wet seasons of 2000. Upper and lower LOD scores from
horizontal bars indicate the positive effects for late heading in Milyang
23 and Akihikari alleles, respectively. The peak values of LOD scores are
indicated on each interval map. A = Ohmagari, B = Sendai, C = Niigata, D
= Joetsu, E = Tsukuba, F = Tottori, G = Fukuyama, H = Fukuoka, I =
Kagoshima, J = dry season at Los Baños, K = wet season at Los Baños.
�
�
�
�
�
�
�
�
�
�
�
�
�
�
�
�
����)
*�+,���
������-.���
*�+,���
*�+,���
����*�
+,��*�
+,��/���,
/����
*�+,���0
�����������/
*�+,��
*�+,��,
*�+,���,
*�+,����"
*�+,���"
�--�
�������*�
+,���
����0*�
+,��������
*�+,����
*�+,����
������������"*�
+,����������"
���
���
���
���
���
����
���
���
���
���
���
���
���
������
���
���
���
���
���
���
���
���
���
���
���
���
���
���
���
���
���
���
���
���
���
���
���
���
���
���
���
���
���
���
���
���
���
���
���
���
���
���
���
���
���
���
���
���
���

67
R11-2 played the most important roles in segregation in theRI population, with a contrasting relationship in the tem-perate zone. Completely different QTL sets were functionalbetween Los Baños (tropical zone) and Japan (temperatezone), and the dry and wet season in the tropical zone.
Discussion
A total of 213 QTLs for heading date were detected, but theQTL corresponding to a photoperiod-sensitive gene, Se1,on chromosome 6 (Yano 1997, Yamamoto 1998) was notdetected in this study. It was estimated that these two par-ents have the same allele on the locus. This means that theQTL analyses were carried out without the influence of astrong photoperiod-sensitive gene, Se1, and we could effi-ciently detect other QTLs for heading date.
The results of QTL analyses indicate that two QTLs inR7 and R11-2 controlled segregation of the RI population
in the temperate region. Instead of these two QTLs, the otherQTL sets controlled segregation in the tropical zone. An-other eight QTLs were detected in R2-2, R9-2, and the longarm of chromosomes 4 and 10 in the dry season of Los Baños.This means that heading date in a tropical zone, especiallyin the dry season, is controlled by a completely differentgenetic mechanism.
The QTLs in R7 and R11-2 had important roles in con-trolling days to heading in the temperate zone especially.The QTL in R7 may correspond to a photoperiod-sensitivegene, E1, because the detected QTL was located in the samechromosome region where Ichitani et al (1998a,b) found it.Yokoo et al (1980) and Ichitani et al (1998b) suggested thatthe two photoperiod-sensitivity loci, Se1 and E1, were highlyassociated with the regional differentiation of rice cultivarsbecause Se1 had been known to have multiple alleles(Yokoo and Kikuchi 1977) and these two, Se1 and E1, hadstrong effects compared with other genes. Both the QTL in
Table 2. Two putative QTLs for days to heading on chromosomes 7 and 11.
Cultivation conditions Chr 7 (R7, XNpb33–XNpb91a) Chr 11 (R11-2, XNpb202–XNpb257a)
Site Season and Distance from R2b LOD Ac Distance from R2b LOD Ac
amount of short-arm (%) short-arm (%)
N (kg ha–1) terminal (cM) terminal (cM)
Sendai 1996 36 15.1 5.8 2.7 34 4.2 1.5 –1.5
1997 34 17.5 7.9 3.2 34 9.5 4.1 –2.3
1997 (0) 36 16.1 7.2 2.7 34 11.0 4.8 –2.2
1998 36 16.1 7.2 2.7 34 11.0 4.8 –2.2
1999 38 6.8 2.9 1.5 34 15.3 6.9 –2.2
1999 (0) 38 9.5 4.1 1.9 34 11.6 5.1 –2.2
Joetsu 1995 34 9.6 4.1 2.6 34 11.7 5.1 –2.7
1996 39 7.1 3.0 2.2 34 20.2 9.2 –3.7
1996 (0) 36 8.2 3.5 2.2 34 17.9 8.2 –3.3
1997 36 8.2 3.5 2.2 34 13.2 5.9 –1.9
1997 (0) 41 10.1 4.4 1.7 34 8.8 3.8 –1.6
1998 40 27.2 13.1 3.0 34 5.5 2.3 –1.3
1998 (0) 35 24.8 11.8 2.8 34 9.4 4.1 –1.7
1999 38 8.2 3.5 1.3 34 15.8 7.0 –1.9
2000 36 12.1 5.3 1.9 34 15.0 6.6 –2.1
Tsukuba 1997 35 19.3 8.7 1.8 34 9.0 3.8 –1.2
1998 35 24.4 11.6 2.0 34 10.7 4.7 –1.3
1999 36 21.1 9.5 2.1 34 9.1 3.8 –1.3
Fukuoka 1997 38 19.4 8.7 1.8 34 4.8 2.0 –0.9
1998 36 25.3 12.1 2.2 35 7.1 3.0 –1.2
1999 36 19.9 9.2 2.1 35 9.0 3.9 –1.4
Los Baños 2000 Dry 36 0.6 0.3 0.4 34 2.5 1.1 –0.8
2000 Wet 37 9.9 4.3 1.3 34 2.8 1.2 –0.7
2001 Dry 36 1.1 0.4 0.8 34 4.1 1.7 –1.6
2001 Wet 36 1.4 0.6 0.6 34 0.1 0.0 –0.6
2002 Dry 36 1.7 0.7 1.1 34 5.0 2.0 –1.8
aMarkers flanking the detected QTL. bPhenotypic variance explained by each QTL. cAdditive effect of the allele from Milyang 23 compared with that of Akihikari. R7 and R11-
2 are chromosome regions where QTLs were detected.

68
R11-2 and the QTL in R7 had a strong effect and mutualrelationship. We conclude that the QTL in R7 might also beassociated with the regional differentiation and adaptationof Asian rice cultivars. In the same chromosome region ofR11-2, no QTL had been detected in almost all QTL analy-ses (Li et al 1995, Lin HX et al 1995, Xiao et al 1995, 1996,1998, Prince et al 1997, Yano et al 1997, Lu et al 1997, Doiet al 1998, Lin SY et al 1998) because these investigationswere carried out in a limited area, with no replications, orcross combination of hybrid populations. Li et al (2003)could detect only one QTL from the analyses using the IR64/Azucena DH population in the Indian environment, but themutual relationship with E1 on chromosome 7 was notshown. In our investigations through a wide latitude fromsouth to north, the effects of the QTL in R11-2 in a higherlatitude were stronger than those of the lower latitude. Inreplications at Sendai from 1996 to 1999, at Joetsu from1995 to 2000, at Tsukuba from 1997 to 1999, and at Fukuokafrom 1996 to 1991, the effect of the QTL in R11-2 at eachsite, where the same daylength occurred, had a mutual rela-tionship with the QTL in R7 among years. From these re-sults, it can be hypothesized that the QTL in R11-2 is not aphotoperiod-sensitive gene and the other genetic factor isrelated to vegetative growth.
Lin et al (1995) identified seven QTLs on chromosomes1, 3, 6, (two), 8 (two), and 12 using two kinds of F
2 popula-
tions developed by indica and japonica line crosses. Li et al(1995) detected three QTLs, QHd3a, QHd8a, and QH9a, forheading date on chromosomes 3, 8, and 9, respectively, us-ing hybrid progenies derived from tropical japonica varietyLemont, and indica variety Teqing. Prince et al (1997) foundthree QTLs on the short arm of chromosome 3, the distalregion on the short arm of chromosome 8, and the centro-meric region of chromosome 10 using the F
2 population
derived from a cross between upland japonica varietyAzucena and indica variety Bala. Lu et al (1997) detectedfour QTLs, hd-1, hd-8, hd-10a, and hd-10b, on the long armof chromosome 1, the short arm of chromosome 8, and thecentromeric region and long arm of chromosome 10, re-spectively, using a DH population established from a crossbetween indica variety Zhai-Ye-Qing 8 and japonica vari-ety Jing-Xi 17. In previous reports, several QTLs were de-tected commonly on the same chromosome: the long arm ofchromosome 1, the short arm of chromosomes 3 and 8, andthe centromeric region of chromosome 10. In our analyses,QTLs for heading date were also detected in these chromo-some regions, except for chromosome 8. These findings sug-gest that some genes with important roles for controllingheading date in Asian rice cultivars are located on thesechromosome regions.
Yano et al (1997) and Lin et al (1998) detected fiveputative QTLs, Hd1, Hd2, Hd3, Hd4, and Hd5, and anotherthree QTLs, Hd6, Hd7, and Hd8, by using the hybrid popu-lations derived from crosses between Kasalath andNipponbare. Yamamoto et al (1998, 2000, respectively)
confirmed the single-gene segregation and these detailedeffects of Hd1 and two QTLs, Hd6 and Hd7, as Mendelianfactors using chromosome segment substitution lines (CSSL)developed by backcross breeding and marker-aided selec-tion (MAS) with DNA markers. These CSSL or near-isogeniclines for targeting the detected QTLs are useful for clarify-ing the detailed characters of the QTLs. We need to charac-terize the QTLs detected in detail and clarify the relation-ships between QTLs for heading date and other traits byusing these CSSL or isogenic lines developed by backcrossbreeding using MAS.
References
Doi K, Yoshimura A, Iwata N. 1998. RFLP mapping and QTLanalysis of heading date and pollen sterility using backcrosspopulation between Oryza sativa L. and Oryza glaberrimaSteud. Breed. Sci. 48:395-399.
Fukuta Y, Tamura T, Sasahara H, Fukuyama T. 1999. Geneticand breeding analysis using molecular markers. 18. Varia-tions of gene frequency and the RFLP map of the hybridpopulation derived from the cross between the rice varietyMilyang 23 and Akihikari. Breed. Res. 1(Suppl.2):176.
Ichitani K, Okumoto Y, Tanisaka T. 1998a. Genetic analyses oflow photoperiod sensitivity of rice cultivars from the north-ern-most regions of Japan. Plant Breed. 117:543-547.
Ichitani K, Okumoto Y, Tanisaka T. 1998b. Genetic analysis ofthe rice cultivar Kasalath with special reference to two pho-toperiod sensitivity loci, E1 and Se1. Breed. Sci. 48:51-57.
Kikuchi F. 1979. Adaptive changes in rice hybrid populations inresponse to different environments. Bull. Natl. Inst. Agric.Sci. D30:69-179. (In Japanese with English summary.)
Kinoshita T. 1998. Report of the committee on gene symboliza-tion, nomenclature and linkage groups. II. Linkage mappingusing mutant genes in rice. Rice Genet. Newsl. 15:13-74.
Li Z, Oinson SRM, Stansel JW, Oark D. 1995. Identification ofquantitative trait loci (QTLs) for heading date and plant heightin cultivated rice (Oryza sativa L.). Theor. Appl. Genet.91:374-381.
Li ZK, Yu SB, Lafitte HR, Huang N, Courtois B, Hittalmani S,Vijayakumar CHM, Liu GF, Wang GC, Shashidhar HE,Zhuang JY, Zheng KL, Singh VP, Sidhu JS, SrivantaneeyakulS, Khush GS. 2003. QTL × environment interactions in rice.I. Heading date and plant height. Theor. Appl. Genet. 108:141-153.
Lin HX, Qian HR, Zhuang JY, Lu J, Xiong ZM, Min SK. 1995.RFLP mapping of major genes for heading date in rice. RiceGenet. Newsl. 12:253-255.
Lin SY, Sasaki T, Yano M. 1998. Mapping quantitative trait locicontrolling seed dormancy and heading date in rice, Oryzasativa L., using backcross inbred lines. Theor. Appl. Genet.96:997-1003.
Lu C, Shen L, Tan Z, Xu Y, He P, Chen Y, Zhu L. 1997. Com-parative mapping of QTLs for agronomic traits of rice acrossenvironments by using a doubled-haploid population. Theor.Appl. Genet. 94:145-150.
Nelson J. 1997. QGENE: software for marker-based genomicanalysis and breeding. Mol. Breed. 3:239-245.

69
Prince AH, Young EM, Tomos AD. 1997. Quantitative trait lociassociated with stomatal conductance, leaf rolling and headingdate mapped in upland rice (Oryza sativa). New Phytol.137:83-91.
Xiao J, Li J, Yuan L, Tanksley SD. 1995. Dominance is themajor genetic basis of heterosis in rice as revealed by QTLanalysis using molecular markers. Genetics 140:745-754.
Xiao J, Li J, Yuan L, Tanksley SD. 1996. Identification of QTLsaffecting traits of agronomic importance in a recombinantinbred population derived from a subspecific rice cross.Theor. Appl. Genet. 92:230-244.
Xiao J, Li J, Grandillo S, Ahn SH, Yuan L, Tanksley SD, McCouchSR. 1998. Identification of trait-improving quantitative traitloci allele from a wild rice relative, Oryza rufipogon. Genet-ics 150:899-909.
Yamamoto T, Kuboki Y, Lin SY, Sasaki T, Yano M. 1998. Finemapping of quantitative trait loci Hd-1, Hd-2 and Hd-3, con-trolling heading date of rice, as single Mendelian factors.Theor. Appl. Genet. 97:37-44.
Yamamoto T, Lin H, Sasaki T, Yano M. 2000. Identification ofheading date quantitative trait locus Hd6 and characteriza-tion of its epistatic interactions with Hd2 in rice using ad-vanced backcross progeny. Genetics 154:885-891.
Yano M, Harushima Y, Nagamura Y, Kurata N, Minobe Y, SasakiT. 1997. Identification of quantitative trait loci controllingheading date in rice using a high-density linkage map. Theor.Appl. Genet. 95:1025-1032.
Yokoo M, Kikuchi F. 1977. Multiple allelism of the locus control-ling heading time of rice, detected using the close linkagewith blast-resistance. Jpn. J. Breed. 27:123-130. (In Japa-nese with English summary.)
Yokoo M, Kikuchi F, Nakane A, Fujimaki H. 1980. Genetic analy-sis of heading time by aid of linkage with blast resistance inrice. Bull. Natl. Inst. Agric. Sci. D31:95-126. (In Japanesewith English summary.)
Notes
Authors’ addresses: Y. Fukuta, Japan International ResearchCenter for Agricultural Sciences (JIRCAS) 1-1, Ohwashi,Tsukuba, Ibaraki 305-8686, Japan; S. Kobayashi, L.A.Ebron, and Y. Fukuta, Japan International Center for Agri-cultural Sciences, 1-1 Ohwashi, Tsukuba, Ibaraki, 305; E.Araki, H. Nemoto, and H. Maeda, National AgriculturalResearch Center for Western Region, Fukuyama, Hiroshima,721-8514; S. Kobayashi, National Agricultural ResearchCenter for Hokkaido Region, Hitsujigaoka, Toyohira-ku,Sapporo 062-8555; G.S. Khush, Plant Breeding, Genetics,and Biochemistry Division, IRRI, DAPO Box 7777, MetroManila, Philippines; T. Umemoto and H. Nemoto, NationalInstitute of Crop Science, Tsukuba, Ibaraki, 305-8518; T.Umemoto, S. Morita, and K. Nagata, National AgriculturalResearch Center for Tohoku Region, Morioka, Iwate, 020-0198; S. Morita and K. Tamura, National Agricultural Re-search Center for Kyushu Okinawa Region, Chikugo,Fukuoka, 833-0041; K. Nagata, H. Sasahara, and K. Tamura,Hokuriku Research Center, National Agricultural ResearchCenter, Joetsu, Niigata, 943-0193; T. Sato, Graduate Schoolof Life Science, Tohoku University, Sendai, Miyagi, 980-8577; T. Nagamine, National Institute of AgrobiologicalSciences, Tsukuba, Ibaraki, 305-8602; T. Fukuyama, Gradu-ate School of Science and Technology, Niigata University,Niigata, Niigata, 950-2181; K. Hamamura, Arid Land Re-search Center, Tottori University, Hamasaki, Tottori, 680-0001; T. Ogata and Y. Matsue, Agricultural Research Cen-ter, Fukuoka, Fukuoka, 818-8549; K. Ichitani and A. Takagi,Kagoshima University, Kagoshima, 890-8580, Japan.

Crop management

73
Variation in nitrogen uptake pattern under different cultural practices and the varietal response of
nitrogen were investigated for low to moderate nitrogen levels. IR varieties with different growth
duration (GD) were evaluated in terms of N uptake and N-use efficiency.
The amount of N in the plant increased exponentially (y = abx) at the early growth stage and
linearly (y = a + bx) at the middle and late growth stage. The crossing point of two equations coincided
with the maximum-tillering stage (MT). No varietal difference was observed in nitrogen absorption
pattern. Narrow spacing shortened the exponential phase and increased N uptake at the early
growth stage (NAE). A higher basal N application increased N uptake at the early growth stage, but
did not increase N uptake after MT. Parameter b in the linear phase was not affected by spacing and
rate of fertilizer application, but it varied with the kind of basal fertilizer and soil fertility. Substantial
differences occurred in total N in the plant at 5 weeks after transplanting, but not after MT. Generally,
test varieties had consistent N absorption characteristics at different growth stages regardless of N
level and cropping season.
Total N in the plant at the critical growth stage increased with GD, which can be attributed to N
absorption pattern. Potential sink size (PS) was correlated with plant N at the late stage of spikelet
initiation and with GD. Diminished sink size and unripened grains were correlated with GD. Therefore,
sink size and yield were explained by a quadratic function of GD.
Total N in the plant at 30 days after transplanting (DAT) was positively correlated with PS, sink
size, grain yield, contribution of plant N to sink formation, and N harvest index (NHI), but not with
spikelet reduction or ripening percentage of short- and medium-duration varieties. The contribution
of plant N to sink formation and yield is increased by higher basal N and narrow spacing for the short-
duration varieties used. This suggests that NAE is an important determinant of sink size and grain
yield of short- and medium-duration varieties.
Nutritional aspects of rice grain yieldG. Wada, P.C. Sta. Cruz, and H. Ando
Yield and yield-determining processes are markedly affectedby the amount of nitrogen (N) absorption at each growthstage. In contrast with phosphorus and potassium, even asmall excess of N immediately decreases ripening percent-age and grain yield (Matsushima 1976). The rice plant re-quires 1.5 to 1.7 kg of N to produce 100 kg of paddy (Wadaet al 1986).
Recently, the remarkable increase in rice yield has beenattributed to high-yielding varieties, the use of N in com-mercial forms, and better cultural practices. However, thenatural soil fertility of paddy fields is sometimes ignoredby farmers, who prefer to use chemical fertilizers in largequantities, forgetting that a large amount of N absorbed bythe plant is derived from the soil. Therefore, to obtain higheryield, how to increase the amount of N absorption by theplant without disturbing growth and how to increase plant
N-use efficiency are of utmost importance. This paper willdeal with the nutritional aspects of yield and yield-deter-mining processes as worked out in research from 1985 to1989.
Nitrogen absorption pattern
The nitrogen absorption pattern of rice varieties grown un-der different cultural practices and different cropping sea-sons was investigated. In both the dry and wet season (DSand WS), the amount of N in the plants was closely related tothe number of days after transplanting (DAT). Exponentialequations (y = abx) were obtained during the early growthstage and linear equations (y = a + bx) during the middle andlate growth stages (Figs. 1, 2, and 3). There was no differencein N absorption pattern between short- and medium-dura-

74
tion varieties. Exponential equations were obtained duringthe period when NH
4-N was found in the plow layer. Linear
equations were observed when the NH4-N concentration in
the plow layer was constantly low (Fig. 4). Earlier findingsshowed a similar trend of N absorption on accumulated ef-fective thermal index (AETI) (Hanyu and Uchijima 1962,Takahasi et al 1973). In the tropics, there is no great differ-ence in temperature during the period from transplanting tomaturity. Hence, DAT is equivalent to AETI in the temper-ate area. The crossing point of the exponential equationand linear one generally coincided with the maximum-tillering stage (MT). The absorption of basal N usually ter-minated at MT.
The exponential phase was shortened by narrow spac-ing but not affected by the rate of N. Parameter b in theexponential equation was affected by spacing and rate ofbasal N. The application of slow-release fertilizer (urea coatedwith plastic resin) compared with ammonium sulfate resulted
in a longer duration of the exponential phase. Varietal dif-ferences in N absorption were observed only during the ex-ponential phase. Parameter b in the linear equation did notdiffer with a varying rate of basal N and plant spacing. How-ever, it was affected by soil chemical characteristics andkind of fertilizer. Slow-release fertilizer increased the rate ofN uptake during the linear phase. The amount of N absorbedduring the linear phase was correlated with the amount ofmineralized N in fresh soil calculated by Michaelis Menten’sequation. Ando and Shoji (1986) obtained exponential equa-tions for the mineralization of soil organic N compounds,which consist of rapidly and slowly mineralizable soil or-ganic compounds. Rapidly mineralizable soil N compoundswere mineralized at the early growth stage of the plant. Thesoil condition before transplanting affected the mineraliza-tion of soil organic N compounds. The longer the durationof drying, the greater the amount of soil organic N com-pounds that was mineralized irrespective of the soil’s par-
��
�
�
�� �� �� �� ��
��� ��������
���������� �
���������� �
� ����������
� ���������
������������
����� �������
����� �������
������������������������������ ��������������������
���������������
�������
������
������������� �
��
������ !�!���"#���$��
Fig. 1. Nitrogen absorption pattern of rice plants grown under different cultural practices (experimental fields, IR64, 1986 wet season).

75
ent materials (dry effect). The dry effect of soil on the miner-alization of soil organic N compounds was limited duringthe early growth stage of the plant (Ando et al 1989).
At the early growth stage, plants absorbed mainly basalN and rapidly mineralizable organic N and partly absorbedslowly mineralizable organic N (Table 1). At the middleand late growth stages, plants absorbed slowly mineraliz-able organic N and topdressed N. After topdressing, the rateof N absorption increased rapidly. When the NH
4-N derived
from topdressed fertilizer was no longer available in theplow layer, the N absorption rate returned to the normal ratebefore topdressing (Wada et al 1986). No varietal differencein N absorption of soil N and topdressed N during the linearphase was observed.
During the exponential phase, the absorption of basalN and rapidly mineralizable soil N can be increased by ahigher dose of basal N and narrow spacing. In contrast, there
is a very limited chance to increase the absorption of slowlymineralizable soil N by cultural practices.
Panicle primordia initiation (PI) is observed almost onthe same day in identical varieties within a cropping sea-son. Therefore, the duration of the vegetative lag phase (VLP)of the plant was affected by plant spacing and growth dura-tion of the plant. Varietal difference in the N absorptionpattern based on the DAT was not apparent. Based on thegrowth stage, however, varietal difference in the N absorp-tion pattern was noted between short- and long-durationvarieties. Within a variety, the N absorption pattern wasaffected by plant spacing. Subsequent N-use efficiency wasaffected by VLP. The contribution of plant N to sink size (S/N) and potential sink size (PS/N) increased with an increasein VLP for short-duration varieties; however, there was norelationship among VLP and S/N and PS/N in the case oflong-duration varieties. Narrow spacing and higher basal N
� ����������
������������
������������
������������
������������
�������������
�������������
�������������
%&��
%& ����'�� '�'�'�'�
�����������������
��
��
�
�
�
�
��� �� �� �� �� �� ��
�����
��� �
()
������ !�!���"#���$��
Fig. 2. Nitrogen absorption pattern of rice plants grown under different soils (1986 wet season). Note: M and E are experimental fields.

76
application increase the contribution of plant N to PS/Nand S/N, particularly for short-duration varieties (Table 2).
Varietal differences in N response
Recent studies pointed out the importance of varietal dif-ferences in N absorption and the contribution of plant N toyield-determining processes (Broadbent et al 1987, Creganet al 1984, Miyagawa 1981). To determine the effect ofgrowth duration (GD) and N uptake on yield-determiningprocesses, 60 IR varieties and lines were planted under twoN levels. The amount of N in the plant at critical growthstages was positively correlated with GD (Fig. 5). Varietaldifferences in N absorption were apparent during the tilleringstage, whereas insignificant differences were noted after MT(Table 3). Since the MT stage occurs simultaneously in allthe varieties grown under the same cultural conditions, the
amount of N in the plant at the critical growth stages in-creases with an increase in GD. Potential sink size was cor-related with GD (Fig. 6) and amount of N in the plant atflowering (r = 0.76**, y = –511 + 180x). The contribution ofN in the plant at flowering to PS (PS/N) was explained bythe quadratic function of GD (Fig. 7). PS/N increased withGD up to 125 days (equivalent to an increase in VLP up to15 days). The low contribution of plant N of short-durationvarieties can be explained by the contribution of N absorbedat different growth stages and N absorption patterns. The PIof short-duration varieties occurred before or simultaneouslywith the MT stage. Therefore, a large amount of N is stillabsorbed from PI to the late stage of spikelet initiation. TheN absorbed after PI until the late stage of spikelet initiationhas less effect on differentiation of spikelets than before PI(Wada 1969). The coefficient of variance (CV) of PS/N de-creased with an increase in GD.
���������� ���������������
����� ��������������������
�����������
��� �������
� �����������
� ����������
��������*��������( $�� !�
�����������
��
�
�
���������������
��������*��������( $�� !�
����������
�� �� �� �� ��
�+���
���
���
������$## !������
������ !�!���"#���$��
Fig. 3. Nitrogen absorption pattern and pattern of tillering of rice plants grown under different kinds of nitrogen fertilizer (experimental
fields, IR64, 1986 wet season). AS = ammonium sulfate.

77
Diminished sink size was positively correlated with GD(Fig. 8). Variations in diminished sink size were smaller inshort-duration varieties than in long-duration varieties. Therate of diminished sink size increased with a decrease in Ncontent in laminae during the reduction division stage ofPMC (Wada 1969). Sink reduction can be overcome byshortening the GD in the field, excluding the nursery (Wada1985b).
Sink size (S) was determined by the relationship be-tween PS and diminished sink size and was represented as aquadratic function of GD (Fig. 9). Sink size was also posi-tively correlated with the amount of N in the plant at flow-ering (r = 0.822**, y = –97 + 99x). However, the contribu-tion of N to sink formation (S/N) differed with GD. Maxi-mum sink size was associated with specific GD. The aver-age optimum GD for sink size was 127 days (CV = 8.7% for3 seasons and 2 N levels, 20 × 20 cm spacing). Variation inoptimum GD between the DS and WS was 2–3 days, with 7days between N levels. Optimum GD was shorter in the DSand had a high N level compared with the WS and its low Nlevel. When GD was shorter than optimum, the low sink sizewas mainly due to low PS caused by a low amount of N atthe late stage of spikelet initiation. Another possible causeis the low PS/N and S/N. In this case, it is important to in-crease N absorption at the early growth stage and to inducelonger VLP by manipulating some cultural practices to in-crease the contribution of plant N to spikelet differentia-tion. When GD was longer than optimum, low sink size wasattributed to more diminished spikelets. To increase sinksize, it is necessary to prevent spikelet reduction by en-hancing N absorption from the late stage of spikelet initia-tion to flowering (Wada 1969).
Grain yield was positively correlated with sink size,and was a quadratic function of GD (Figs. 10 and 11). Theoptimum GD for grain yield was 122 days (CV = 9% for 3seasons and 2 N levels, 20 × 20 cm spacing). Variation inoptimum GD between the DS and WS was 6 days, with 5days between N levels. The optimum GD for grain yield wasFig. 4. Behavior of NH
4-N in plow layer (1986 wet season, 1987 dry
season).
Table 1. Amount of N (g m–2) in plant from different origins.
5 WATa Flowering
Season Field Spacing
(cm) Basal Soil Nb Basal Soil Nb
N N
R S R S
1986 WS E 20 × 10 1.9 4.4 0.5 1.9 4.4 3.2
20 × 20 1.7 3.8 0.4 1.8 3.8 3.2
20 × 20c – 3.2 0.3 – 3.2 3.1
M 20 × 10 1.8 3.9 0.4 1.8 3.9 2.5
20 × 20 1.7 3.0 0.3 1.8 3.0 2.5
20 × 20c – 2.2 0.2 – 2.2 2.2
1987 DS E 20 × 10 1.7 4.0 0.4 1.7 4.0 3.0
20 × 20 1.5 2.5 0.3 1.7 2.5 3.2
20 × 20c – 2.0 0.2 – 2.0 3.1
a5 weeks after transplanting. Rate of basal N = 6 g 15N m–2. bR = rapidly mineralizable soil N, S = slowly mineralizable soil N. The
amounts of R and S are roughly estimated by the equation of mineralization of organic N (Ando and Shoji 1986). cNo nitrogen.
�� �� �� ��
��
��
�
�
�
�!� ����
��
��
�
�
�
, �� ����
���������-�������������
�������
������
������ !�!���"#���$��

78
Table 2. Effect of spacing and N level on the contribution to sink (1986 wet season).
Variety N level Spacing Vegetative PSa/Nb Sc/N
(g m–2) (cm) lag phase (d)
IR64 0 20 × 10 10 96 79
20 × 20 5 85 70
20 × 30 –1 77 66
6 20 × 10 10 100 76
20 × 20 5 97 73
20 × 30 –2 90 70
IR36892-163-1-2-2-1 0 20 × 10 31 115 76
20 × 20 26 117 77
20 × 30 20 123 77
6 20 × 10 31 117 76
20 × 20 26 115 75
20 × 30 20 115 78
aPS = potential sink size. bN = amount of N in plant at flowering stage. cS = sink size.
��
��
�
�
�
�$�"#���������
��� ��� ���
��
��
!������..������������
!������..������������
/!�0�12�!��$���2�
Fig. 5. Relationship between the amount of N in the plant at flowering and growth duration (1987 dry
season).

79
Table 3. Varietal differences in nitrogen absorption of short-duration varieties/lines at different growth stages (1986 dry season).a
Amount of nitrogen absorbed (g m–2)
Variety/line
Active dN1 Maximum dN2 Flowering dN3 Maturity
tillering (N1) (N2 – N1) tillers (N2) (N3 – N2) (N3) (N4 – N3) (N4)
IR36 1.4 bc 1.2 c 2.6 c 7.3 ab 9.9 bc 2.7 a 12.6 bc
IR25588-7-3-1 1.6 b 1.6 b 3.2 b 7.2 ab 10.4 b 2.8 a 13.2 b
IR25261-135-1-1 2.0 a 2.4 a 4.4 a 7.5 a 11.9 a 2.5 a 14.4 a
IR29658-69-2-1-2 1.5 b 1.3 bc 2.8 bc 7.2 ab 10.0 bc 2.4 ab 12.4 c
IR29692-94-2-1-3 1.4 bc 1.1 cd 2.5 cd 7.2 ab 9.7 c 2.6 a 11.3 d
IR29725-109-1-2-1 1.3 c 1.3 bc 2.6 c 7.3 ab 9.9 c 2.7 a 12.6 bc
IR31868-64-2-3-3-3 1.3 c 1.2 c 2.5 cd 7.3 ab 9.8 c 2.7 a 12.5 c
IR32419-81-2-3-3 1.2 c 0.9 d 2.1 e 7.1 b 9.2 d 2.4 ab 11.6 cd
IR32429-47-3-2 1.3 c 0.9 d 2.2 de 7.6 a 9.8 c 2.2 b 12.0 c
IR32429-122-3-1-2 1.5 b 1.1 cd 2.6 c 7.4 ab 10.0 bc 2.4 ab 12.4 c
aGrowth duration = 111 days. Numbers followed by common letters are not significantly different by Duncan’s multiple range test at P = 0.05.
!������..��������������
��� ��� ���
��
��
��
�
�
3�� ��$�#�$�4������
��� � �/!�0�12�!��$���2�
Fig. 6. Relationship between potential sink and growth duration, 1987 dry season.
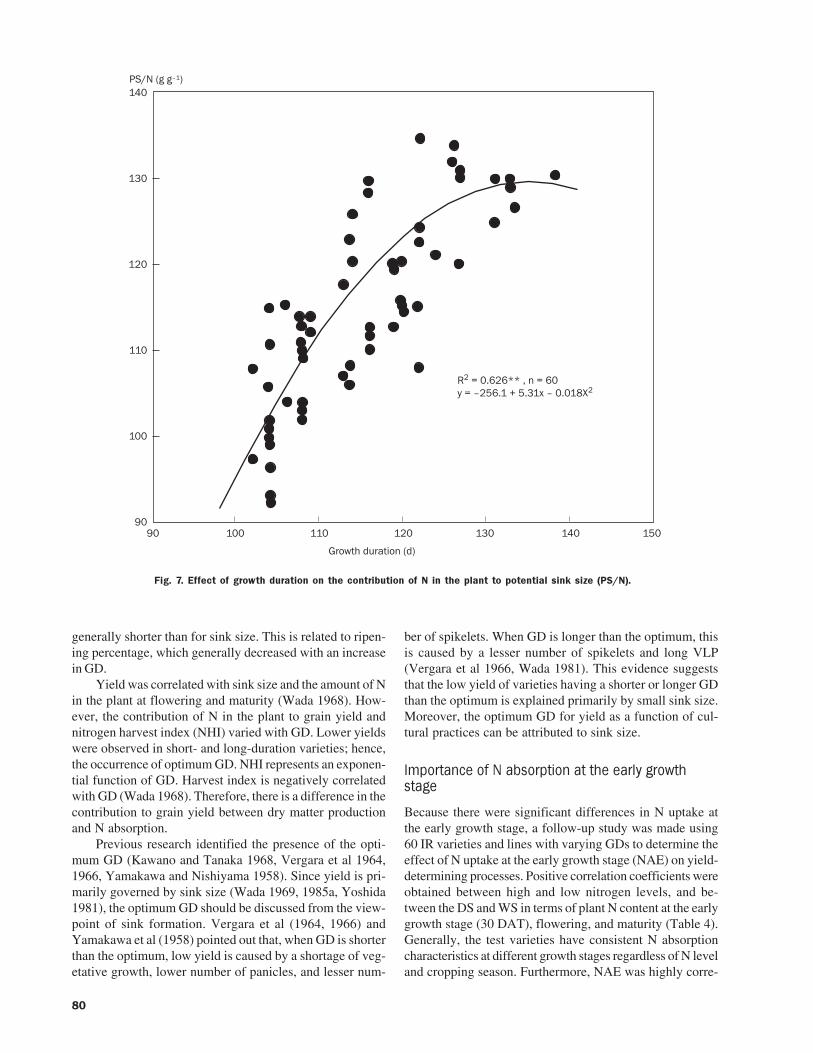
80
generally shorter than for sink size. This is related to ripen-ing percentage, which generally decreased with an increasein GD.
Yield was correlated with sink size and the amount of Nin the plant at flowering and maturity (Wada 1968). How-ever, the contribution of N in the plant to grain yield andnitrogen harvest index (NHI) varied with GD. Lower yieldswere observed in short- and long-duration varieties; hence,the occurrence of optimum GD. NHI represents an exponen-tial function of GD. Harvest index is negatively correlatedwith GD (Wada 1968). Therefore, there is a difference in thecontribution to grain yield between dry matter productionand N absorption.
Previous research identified the presence of the opti-mum GD (Kawano and Tanaka 1968, Vergara et al 1964,1966, Yamakawa and Nishiyama 1958). Since yield is pri-marily governed by sink size (Wada 1969, 1985a, Yoshida1981), the optimum GD should be discussed from the view-point of sink formation. Vergara et al (1964, 1966) andYamakawa et al (1958) pointed out that, when GD is shorterthan the optimum, low yield is caused by a shortage of veg-etative growth, lower number of panicles, and lesser num-
ber of spikelets. When GD is longer than the optimum, thisis caused by a lesser number of spikelets and long VLP(Vergara et al 1966, Wada 1981). This evidence suggeststhat the low yield of varieties having a shorter or longer GDthan the optimum is explained primarily by small sink size.Moreover, the optimum GD for yield as a function of cul-tural practices can be attributed to sink size.
Importance of N absorption at the early growthstage
Because there were significant differences in N uptake atthe early growth stage, a follow-up study was made using60 IR varieties and lines with varying GDs to determine theeffect of N uptake at the early growth stage (NAE) on yield-determining processes. Positive correlation coefficients wereobtained between high and low nitrogen levels, and be-tween the DS and WS in terms of plant N content at the earlygrowth stage (30 DAT), flowering, and maturity (Table 4).Generally, the test varieties have consistent N absorptioncharacteristics at different growth stages regardless of N leveland cropping season. Furthermore, NAE was highly corre-
&�������..+�������������� ��������5�
���
� �
���
���
���
����� ��� ������ � �
/!�0�12�!��$���2�
�����
3*6�������
Fig. 7. Effect of growth duration on the contribution of N in the plant to potential sink size (PS/N).

81
lated with the amount of N in the plant at flowering andmaturity in varieties classified under the same GD group(Table 5). These results suggested that N absorption abilityof varieties is a genetically stable characteristic (Miyagawa1981).
Similarly, yield and sink size of tested varieties wereconsistent under different N levels and cropping seasons.This was demonstrated by the positive correlations betweenhigh and low levels, and between the DS and WS croppingin terms of yield and sink size (Table 4). These results implythat varietal differences in yield and sink size are stable atdifferent N levels and in different cropping seasons.
The contribution of N in the plant at flowering to sinksize and yield is affected by GD. Likewise, the contributionof N in the plant to yield and yield components varied withdifferent growth stages. Therefore, the effect of NAE on yieldand yield components may vary with GD, cultural prac-tices, and cropping season.
Potential sink size was correlated with NAE in all GDgroups under DS and WS cropping. Sink reduction, how-ever, was correlated with GD in medium- and long-durationgroups only. Sink size was correlated with NAE in short-
duration varieties. No significant relationship was observedbetween ripening percentage and NAE in any GD group.Since grain yield is highly associated with sink size, sig-nificant correlation coefficients between grain yield andNAE in short-duration varieties are logical (Table 5). Fromthese observations, we can infer that NAE is an importantfactor in yield, sink size, and PS formation, particularly inshort-duration varieties. Sink reduction and the occurrenceof unripened grains disturbed the NAE-yield relationshipof long-duration varieties.
From this study and previous reports, the effect of GDon yield-determining processes is schematically presentedin Figure 12. Potential sink size is a linear function of GD,whereas sink size and yield are a quadratic function of GD.The optimum GD for sink size is longer than for yield. WhenGD is less than optimum, NAE is highly associated withgrain yield. On the other hand, when GD is more than opti-mum, the association of NAE with grain yield is relativelylow because other factors, such as sink reduction and ripen-ing, which are highly affected by N nutrition during themiddle and late growth stage (Wada 1969), have a greatereffect on yield-determining processes.
��� ��� ������ � �
/!�0�12�!��$���2�
���
���
��
���
���
!������..����������� ��
� � ! ��� 2�$�4������
Fig. 8. Relationship between degenerated sink and growth duration, 1987 dry season.

82
Nitrogen harvest index (NHI) and yield were correlatedwith NAE in short-duration varieties. Therefore, NAE is animportant characteristic in increasing the yield and N-useefficiency of short-duration varieties.
The effects of spacing and N level on N absorption andthe contribution of plant N to sink size and yield are shownin Table 6. The amount of N absorbed by the plant at theearly growth stage is affected by the dose of basal fertilizerand plant spacing. Higher basal dressing and higher plantdensity resulted in higher N absorption at the early growthstage. The S/N, PS/N, NHI, and N absorption rate increasedwith higher basal N and plant density by affecting VLP andNAE in short-duration varieties. In long-duration varieties,the N-use efficiency parameters were also affected by basalN level and spacing, but at a relatively lower magnitude.Therefore, aside from high N absorption ability of a variety,NAE could be compensated by narrow spacing and a high Nlevel.
Physiological aspects of short-duration varieties
From the abovementioned evidence, the low yield of short-duration varieties has been attributed to the low amount of
N in the plant at the late stage of spikelet initiation andlower contribution of N in the plant to sink formation. Toevaluate a response of short-duration varieties to culturalpractices and N level, field trials were carried out using sixshort-duration varieties and one each of medium- and long-duration varieties as a control. Under narrow spacing, higherplant N was obtained at panicle primordial initiation (PI),flowering, and maturity; however, under wider spacing, alarger amount of N was absorbed during the period from PIto the late stage of spikelet initiation or flowering. After thelate stage of spikelet initiation, there was no difference in Nabsorption under different spacing (Table 7).
Potential sink size was correlated with the amount of Nin the plant at PI. Therefore, PS was higher in narrow-spac-ing plants than in wide-spacing plants, and higher in a long-duration variety than in a short-duration one. The percent-age of sink reduction was very low and was not affected byspacing, in spite of a big difference in PS. Since the dimin-ished sink was very small compared with PS, sink size wascorrelated with the amount of N at PI and flowering (Fig.13).
Ripening percentage was always higher in low-N ap-plication than in high-N application because of a big differ-
&����������+����������������5�
���
���
���
���
��� ��� ���
/!�0�12�!��$���2�
*$�4������
Fig. 9. Relationship between sink size and growth duration (1987 dry season).

83
ence in sink size between them. However, very little differ-ence in ripening percentage in different plant spacing wasnoted, in spite of a big difference in sink size. A higherripening percentage was observed in panicle number typethan in panicle weight type (Table 8). One reason why thelower ripening percentage was in panicle weight type andwhy the ripening percentage of narrow spacing did not de-crease can be explained by the difference in panicle charac-teristics (Wada 1968).
Yield was correlated with PS and sink size; however,the contribution of sink size or PS to yield varied with veg-etative growth duration and cropping season. The contribu-tion of PS to yield was much higher in short-duration variet-ies than in long-duration varieties and was also higher inthe DS than in the WS.
Yield was correlated with the amount of plant N at ma-turity (Fig. 14). However, three linear equations explainedthe relationship of yield with the amount of plant N at matu-rity. The first one was on topdressed plots at the late stage ofspikelet initiation and the second one was on nontopdressedplots in the 1986 DS. The third one was on both the 1986WS and 1987 DS. The two differing equations in the 1986DS have a similar trend for the relationship between sink
size and the amount of N in the plant at the late stage ofspikelet initiation. In the 1986 DS, a higher amount of Nwas absorbed during the ripening period. The effect of higherN absorption of short-duration varieties during the periodfrom the late stage of spikelet initiation to flowering andduring the ripening period on yield was very small. Thecontribution of plant N at maturity was the lowest in thefirst group and highest in the third group. Therefore, sinceshort-duration varieties are characterized by lower poten-tial sink reduction and relatively high ripening percentage,increasing N absorption at the early growth stage and in-creasing the contribution of plant N to PS are the most im-portant considerations for increasing grain yield. The coef-ficient of variation (CV) of yield and sink size was higher inshort-duration varieties than in long-duration varieties(Table 8). Within the short-duration varieties, the CV washigher in the panicle weight type than in the panicle num-ber type.
Response to plant spacing
Since yield-determining processes are affected by plant spac-ing as reported, field experiments were carried out with a
!������..��� ����������
���
���
���
���
��
������ ��� ���
7$ #2������
�� ��� ��� ���
!������..��� ���� ��
�!� ����������, �� ����������
*$�4������
Fig. 10. Relationship between yield and sink.

84
wider range of plant spacing and by using different ages ofseedlings. Under extremely narrow spacing, the exponen-tial phase of N absorption was shortened markedly (Aragonesand Wada 1989). Narrow spacing and younger seedling ageat transplanting (or seeding) decreased FLW (number of daysfrom seeding to 50% flowering), promoted tillering, anddecreased the number of days from seeding to the MT stage(Table 9, Fig. 15). As a result, narrow spacing and youngerseedlings brought about longer VLP. Longer VLP decreasedthe percentage of bearing tillers. VLP was lengthened bynarrow spacing, and by the use of younger-aged seedlings.
Narrow spacing increased in both varieties; the effectwas higher in the short-duration varieties than in the long-duration varieties. Seedling age at planting also affectedyield, particularly under extremely narrow spacing, whereyoung seedlings decreased yield. There was a small differ-ence in ripening among treatments within the same variety;hence, yield was governed by sink size. Under extremelynarrow spacing, young seedlings reduced sink size by in-creasing degenerated spikelets and nonbearing tillers, es-pecially in long-duration varieties. The large number ofdegenerated spikelets and nonbearing tillers is caused by a
long VLP and low N content (dry basis) in the plant (Wada1968, Wada et al 1986).
PS is generally correlated with GD of plants grown un-der the same cultural conditions and amount of plant N atthe flowering stage; however, under direct seeding (highplant density, 400 hills m–2), no relationship between PSand GD was observed. The GD-PS relationship under directseeding can be assumed to be disturbed by the uncountedreduced sink size because of a large number of nonbearingtillers. Under direct-seeding conditions, grain yield washigher for short-duration varieties than for long-durationvarieties. Optimum GD for grain yield was observed at 95days (Aragones and Wada 1989).
The yield ratio of narrow spacing (20 × 10 cm) to widerspacing (20 × 20 cm) decreased with an increase in GD.Similar trends were observed in sink size ratio and PS ratio.This decreasing trend of ratio with GD was attributed to thedifference in N absorption pattern and plant N-use efficiencycaused by a difference in VLP. The optimum GD for grainyield was shorter for narrow spacing than for wider spacing(Sta. Cruz 1990).
&���������+������������������5�
�
�
�
�
/!�0�12�!��$���2�
7$ #2���������
��� ��� ��� � � ���
&���������+������� ������ ��5�
�!� ����������
, �� ����������
Fig. 11. Relationship between yield and growth duration.

85
Table 4. Correlation coefficients for yield, sink size, and amount of N in the plant in N0 and N9 treatments, and dry season (DS) and wet
season (WS) croppings (n = 60, average of two replications).a
Yield Sink NAE N1 N2
N0:N9 DS WS DS WS DS WS DS WS DS WS
0.611 0.827 0.783 0.872 0.835 0.850 0.905 0.889 0.887 0.781
DS:WS N0 N9 N0 N9 N0 N9 N0 N9 N0 N9
0.553 0.556 0.640 0.614 0.830 0.815 0.880 0.771 0.883 0.841
aNAE = amount of N in plant at 30 DAT. N1 = amount of N in plant at flowering. N2 = amount of N in plant at maturity. N0 = no nitrogen. N9 = 90 kg N ha–1. All values are significant
at 1% level.
Table 5. Correlation coefficients for NAEa and yield-determining factors.
GrowthYb S PS Red. S S/N1 PS/N1 R N1 N2 NHI
duration (d)
Dry season
102–104 0.551** 0.858** 0.905** 0.696** 0.728** 0.850** –0.264 ns 0.834** 0.850** 0.841**
108–109 0.580** 0.723** 0.730** 0.299 ns 0.716** 0.704* –0.449 ns 0.865** 0.785** 0.831**
113–116 0.600** 0.897** 0.922** 0.593 ns 0.862** 0.722* –0.394 ns 0.957** 0.940** 0.938**
119–122 0.708 ns 0.920** 0.839** 0.669 ns 0.593 ns 0.728* –0.529 ns 0.859** 0.905** 0.972**
124–127 0.660 ns 0.839** 0.927** 0.936** 0.422 ns 0.736* –0.170 ns 0.970** 0.965** 0.040 ns
>130 0.528 ns 0.534 ns 0.971** 0.885** 0.387 ns 0.472 ns –0.538 ns 0.946** 0.950** 0.041 ns
Wet season
104 0.726** 0.817** 0.751** 0.339 ns 0.760** 0.778** –0.319 ns 0.833** 0.845** 0.796**
111–118 0.685* 0.894** 0.811** 0.428 ns 0.765* 0.765* –0.665 ns 0.858** 0.825** 0.894**
117–122 0.948** 0.849** 0.920** 0.288 ns 0.773* 0.969** –0.483 ns 0.940** 0.850** 0.839**
125–127 0.499 ns 0.623 ns 0.904** 0.725* 0.341 ns 0.864** –0.361 ns 0.942** 0.930** 0.532 ns
>130 0.269 ns 0.291 ns 0.843* 0.849** 0.358 ns 0.314 ns –0.073 ns 0.849** 0.858** –0.283 ns
aNAE = amount of N absorbed by plant from transplanting to 30 days after transplanting. bY = yield, S = sink, PS = potential sink, Red. S = reduced sink, R = percentage of ripened
grains, N1 = amount of N in plant at flowering, N2 = amount of N in plant at maturity, NHI = nitrogen harvest index. *,** = significant at 5% and 1% level, respectively. ns = not
statistically significant (P>0.05).
Fig. 12. Differences in grain yield, sink size, and potential sink
size of IR varieties and lines with varying growth duration, IRRI,
1987 dry season and wet season.
� ��� ��� ��� � � ���
�+���
�+���
�+���
���
���
���
�
3�� ��$�#�$�4�$8
7$ #2��2�$�4������
� � � !�� 2�"$4 # ��9��$## 2�"$4 # ��:$## 2�"$4 # ��
/!�0�12�!��$���2�
*$�4�$8
/!�$�$ #2

86
Table 7. Effect of spacing on N absorption and N-use efficiency.a
Variety N rate Spacing N1 N3 N4 PS/N3 S/N3 Y/N3 Y/N4
1986 DS
IR58 0 12 × 10 5.8 10.8 16.6 87.9 82.4 75.5 49.8
12 × 30 4.5 10.0 16.0 76.3 73.6 66.0 44.8
12 12 × 10 9.7 16.0 21.5 79.5 69.7 67.3 47.8
12 × 30 7.9 15.1 20.8 61.3 59.3 53.6 38.8
IR25588-1-3-1 0 12 × 10 6.7 11.0 16.8 99.8 85.6 79.2 49.8
12 × 30 5.1 10.6 16.5 93.0 83.2 75.0 45.9
12 12 × 10 10.1 16.5 22.3 84.9 74.7 62.8 44.4
12 × 30 8.2 15.5 21.5 72.3 64.6 52.2 37.6
Variety N rate Spacing N1 N2 N3 N4 PS/N1 PS/N3 S/N3 Y/N3 Y/N4
1987 DS
IR58 0 12 × 10 3.14 3.56 4.15 5.76 154.5 116.8 94.2 90.4 65.3
12 × 30 2.66 3.30 4.05 5.55 157.0 102.7 86.9 83.7 61.0
9 12 × 10 6.68 8.58 9.56 11.06 149.3 104.4 86.0 81.3 66.2
12 × 30 4.60 6.65 7.41 8.98 155.7 96.6 78.9 74.0 61.0
IR25588-7-3-1 0 12 × 10 4.02 4.48 5.09 6.78 177.1 139.3 96.9 91.7 68.8
12 × 30 3.26 4.02 4.81 6.54 179.7 121.8 93.7 87.9 64.5
9 12 × 10 7.17 9.06 9.70 11.18 177.0 130.8 85.3 77.5 67.2
12 × 30 6.12 8.48 9.17 10.62 182.4 119.2 82.4 74.7 63.5
IR36892-163-1-2-2-1 0 12 × 10 4.96 5.38 6.01 7.56 186.0 153.7 98.8 85.0 67.6
12 × 30 4.27 4.76 5.35 7.08 186.0 148.4 102.8 87.4 66.1
9 12 × 10 7.81 9.52 10.29 11.87 196.6 137.3 88.4 73.2 63.4
12 × 30 6.21 7.85 8.72 10.26 192.7 137.3 86.3 73.6 63.2
aN1 = amount of N in plant at PI, N2 = amount of N in plant at late stage of spikelet initiation, N3 = amount of N in plant at flowering, N4 = amount of N in plant at maturity,
PS = potential sink size, S = sink size, Y = yield.
Table 6. Effect of spacing and N level on the amount of N in plant, vegetative lag phase (VLP), and contribution of N in the plant at
flowering to potential sink size (PS/N), sink size (S/N), and nitrogen harvest index (NHI), 1987 dry season.
N level Spacing Amount of N (g m–2)
Variety (g m–2) (cm) PS/N S/N NHI
3 WATa 5 WAT Flowering VLP
IR64 0 20 × 10 1.8 3.7 7.0 10 79.8 65.2 60.6
20 × 30 0.6 2.7 6.7 –7 74.8 57.8 57.7
6 20 × 10 2.4 5.2 7.9 10 84.8 64.5 63.7
20 × 30 0.7 3.2 6.9 –7 78.8 62.6 59.0
12 20 × 10 3.0 8.4 10.8 10 93.2 76.3 70.2
20 × 30 0.9 5.0 8.5 –7 82.2 67.3 63.0
IR36892-163-1-2-2-1 0 20 × 10 1.8 3.9 8.4 31 124.4 83.4 57.4
20 × 30 0.7 2.4 7.9 20 124.7 81.8 57.8
6 20 × 10 2.2 6.1 10.6 31 128.3 79.4 64.0
20 × 30 0.6 3.2 9.0 20 125.6 76.4 62.0
12 20 × 10 3.3 8.6 13.7 31 129.1 79.9 64.0
20 × 30 1.0 5.2 10.0 20 124.7 77.6 62.3
aWAT = weeks after transplanting.

87
��
��
�
�
�
����� �� �� ��
!������..+����������!��������..+����������!5������..+������������
�����*��������*�������*;���2�!��$��*1�!�2�!��$��
*$�4���������
������������#�0 !$��������
��
��
�
�
�
������
!������..7����������
�����������3%������
Fig. 13. Relationship between sink size and the amount of N in the plant at panicle initiation and flowering
stages under different cropping seasons and N levels.

88
Ta
ble
8.
Eff
ec
t o
f s
pa
cin
g a
nd
N l
eve
l o
n y
ield
an
d y
ield
co
mp
on
en
ts o
f ri
ce
va
rie
tie
s a
nd
ad
va
nc
ed
lin
es
of
dif
fere
nt
typ
es
,a I
RR
I, 1
98
6 w
et
se
as
on
(W
S)
an
d 1
98
7 d
ry s
ea
so
n (
DS
).
Sp
ac
ing
Yie
ld (
g m
–2)
Sin
k (
g m
–2)
Po
ten
tia
l sin
k (
g m
–2)
Rip
en
ing
(%
)V
eg
eta
tive
la
g p
ha
se
(d
)
N l
ev
el
(cm
)
PN
IC
he
ck
PN
IC
he
ck
PN
IC
he
ck
PN
IC
he
ck
PN
IC
he
ck
02
0 ×
10
42
94
90
51
24
86
55
96
36
62
06
99
96
39
08
88
1
2 t
o 1
04
31
to
37
20
× 2
03
81
43
34
55
43
45
03
57
05
51
62
18
64
89
87
80
–2
to
5–
1 t
o 0
27
to
30
20
× 3
03
55
40
94
47
40
34
77
57
54
99
59
58
69
88
86
78
–4
to
3–
12
0 t
o 2
5
90
20
× 1
07
08
77
37
39
80
99
32
93
71
,05
71
,22
71
,34
48
97
97
9
2 t
o 1
04
32
to
37
20
× 2
06
20
64
96
30
72
17
83
80
89
21
1,0
35
1,2
41
86
78
78
–2
to
5–
1 t
o 0
27
to
30
20
× 3
05
68
60
55
92
68
274
07
66
87
61
,02
41
,20
78
47
87
8–
9 t
o 2
–9
to
–2
20
to
25
CV
to
tal
30
.03
4.1
19
.82
6.5
28
.61
8.6
29
.93
0.1
18
.69
.87
.87
.8
aP
an
icle
nu
mb
er
typ
e (P
N):
IR5
8 (1
00
–1
04
d in
WS
, 10
7–
10
8 d
in D
S),
IR6
4 (1
12
d in
WS
, 11
3–
11
8 d
in D
S).
Inte
rme
dia
te typ
e (I)
: IR
25
58
8-7
-3-1
, IR
29
26
2-6
5-2
-3-3
(1
04
–1
06
d in
WS
, 10
9–
11
2 d
in D
S).
Ch
eck
: IR
36
89
2-1
63
-1-2
-2-1
(1
30
d in
WS
,
13
5–
14
0 d
in D
S).
Under narrow spacing, the yield increase was higher forshort-duration varieties than for long-duration varieties (Fig.16). However, there was no identical trend in PS, which wasincreased by narrow spacing between short-duration andlong-duration varieties. Therefore, there was a big differ-ence in the effect of VLP, as increased by narrow spacing,on yield-determining processes between short-duration andlong-duration varieties.
Through all the experiments, the optimum VLP for grainyield was observed to be 15 days. When VLP is shorter than15 days, cultural practices that can increase VLP and PSshould be employed. On the other hand, when VLP is longerthan 15 days, cultural practices that will reduce sink sizebut increase ripening percentage are needed.
References
Ando H, Shoji S. 1986. Kinetic study on soil nitrogen mineral-ization and nitrogen immobilization. Jpn. J. Soil Sci. PlantNutr. 57:1-7.
Ando HR, Aragones C, Wada G. 1989. Effect of soil drying onthe mineralization of soil organic N in paddy soil. Abstr.1989 Meeting Jpn. Soc. Soil Sci. Plant Nutr. 35:117.
Aragones DV, Wada G. 1989. Physiological aspects of direct-seeded (broadcasting) cultivation. Jpn. J. Crop Sci. 58(Ex-tra)2:22-23.
Broadbent FE, De Datta SK, Laureles EV. 1987. Measurementof nitrogen utilization efficiency of rice genotypes. Agron.J. 79:786-791.
Cregan PB, Van Berkun P. 1984. Genetics of nitrogen metabo-lism and physiological/biochemical selection for increas-ing grain crop productivity. Theor. Appl. Genet. 67:97-111.
Hanyu J, Uchijima T. 1962. Studies on the relation of weatherconditions to the growth of crop. J. Agric Meteorol.18:109-118. (In Japanese.)
Kawano K, Tanaka A. 1968. Growth duration in relation toyield and nitrogen response in plant. Jpn. J. Breed. 18:46-61.
Matsushima S. 1976. High yielding rice cultivation. Tokyo (Ja-pan): University of Tokyo Press.
Miyagawa S. 1981. Nitrogen balance in paddy field plantedwith different indica varieties. Jpn. J. Trop. Agric. 25:107-114. (In Japanese.)
Sta. Cruz PC. 1990. Sink development in rice genotypes of dif-ferent growth durations as affected by nitrogen nutrition,plant spacing, and shading. Ph.D. dissertation. Universityof Philippines Los Baños, Laguna, Philippines.
Sta. Cruz PC, Aragones DV, Wada G. 1990. Response of IRvarieties and lines to plant density. Jpn. J. Crop Sci. 59(Ex-tra)1:45-46.
Takahashi J, Wada G, Shoji S. 1973. The fate of fertilizer nitro-gen in paddy field and its absorption by rice plant. VI. In-fluence of a thermal factor on soil ammonium nitrogenand absorption of nitrogen by rice plant and the growth ofplant. Proc. Crop Sci. Soc. Jpn. 45:220-225. (In Japanese.)
Vergara BS, Lilis R, Tanaka A. 1964. Relationship betweenlength of growth period and yield of rice plants under lim-ited nitrogen supply. Soil Sci. Plant Nutr. 10:59-65.

89
��
��
�
�
�
�������
���������������!$�������
��
�����*��������*�������*;���2�!��$��*1�!�2�!��$��
!����� ..+7� ���� ���
!������..+7���������
!������..+7�� ��������
!����� ..+7�����������
7$ #2���������
Fig. 14. Relationship between yield and the amount of N in the plant at maturity in short- and long-
duration varieties under different cropping seasons and N levels.
Table 9. Effect of seedling age and spacing on growth and yield of rice plants, IRRI, 1988 dry season.
Seedling Days from Vegetative Panicles Sink Potential Yielda
Spacing (cm) age (d) seeding to lag phase (no. m–2) (g m–2) sink (g m–2) (g m–2)
flowering (d)
IR66
5 × 5 6 75 20 1,507 1,360 1,865 1,202 b
14 79 14 1,160 1,528 2,031 1,293 b
25 79 4 1,240 1,549 1,991 1,366 a
20 × 10 6 75 15 548 903 1,248 770 d
14 79 11 547 901 1,260 743 d
25 79 4 565 848 1,239 741 d
20 × 30 6 83 13 444 795 1,136 660 de
14 83 9 382 785 1,110 645 de
25 86 4 362 712 949 624 de
IR36892-163-1-2-2-1
5 × 5 6 104 49 933 1,112 1,769 740 de
14 104 39 893 1,216 1,845 944 c
25 104 29 880 1,320 1,943 1,007 c
20 × 10 6 104 44 448 860 1,301 646 de
14 104 36 381 850 1,246 660 de
25 108 33 358 874 1,289 624 de
20 × 30 6 112 38 331 747 1,119 607 e
14 108 34 294 773 1,130 624 de
25 108 26 260 772 1,151 618 e
aNumbers followed by a common letter indicate no significant difference.

90
Vergara BS, Tanaka A, Lilis R, Puranabhavung S. 1966. Rela-tionship between growth duration and yield of rice plant.Soil Sci. Plant Nutr. 12:31-39.
Wada G. 1968. Distribution of photosynthate in rice plant. I.Distribution of dry matter between ear and shoot of severalvarieties grown under different time of cultivation. Proc.Crop Sci. Soc. Jpn. 47:394-398.
Wada G. 1969. The effect of nitrogenous nutrition on yield-determining process of rice plant. Bull. Natl. Inst. Agric.Sci. A16:27-157. (In Japanese.)
Wada M. 1981. Studies on the effect of nitrogenous nutrition atvegetative lag phase on growth and yield of rice plant inSouthern Japan. Bull. Kyushu Agric. Exp. Stn. 21:113-250.(In Japanese.)
Wada G. 1985a. Rice cultivation in Sabah, Malaysia. 1. Yieldand yield components in major paddy area. JARQ 18:331-335.
Wada G. 1985b. Rice cultivation in Sabah, Malaysia. 4. Effectof seedling age on the growth and yield of rice plant. 57thmeeting of the Tropical Agricultural Research Associationof Japan. Proceedings. p 60-61. (In Japanese with Englishsummary.)
Wada G, Shoji S, Mae T. 1986. Relationship between nitrogenabsorption and growth and yield of rice plant. JARQ20:135-145.
Yamakawa Y, Nishiyama H. 1958. Studies on the cultivationperiod of rice plant and its varietal differences. Saga Univ.Fac. Agric. Bull. 5:1-48. (In Japanese.)
Yoshida S. 1981. Fundamentals of rice crop science. LosBaños (Philippines): International Rice Research Institute.
Notes
Authors’ addresses: G. Wada, Tropical Agricultural ResearchCenter in Japan (JIRCAS); P.C. Sta. Cruz, Agronomy,University of the Philippines Los Baños (UPLB), LosBaños, Laguna; H. Ando, Faculty of Agriculture,Yamagata University, Tsuruoka 997-8555, Japan.
Fig. 15. Difference in tillering pattern among treatments, IRRI,
1988 dry season.
�
��
��
�
�
��
�
�
�
�
�
�� �� �� �� ��
������ !� 2$��
��� �<�
�����<�
���<�
3#��� 2��
�2��� !� 2$��
��2��� !� 2$��
��2��� !� 2$��
*1����������������

91
�+���
�+���
�+���
�+���
���
���
���
���
�
�+���
�+���
�+���
�+���
�+���
�+���
�+���
���
���
���
���
�
���2
���2
���2
���2
���2
���2���2
���2
���2
���2 ���2
���2
���2
���2
���2
���2
���2���2
���2���2
���2��2
��2
��2
%&�� %& �
3�� ��$�#�$8 *$�4�$8 /!�$�$ #2
� ��� ����� ��� � � ��� ������ ��� � � ��� ����� ��� �
%&�����'��' ' '�
%& ��� '��' '�'�
%& ����'�� '�'�'�'�
%&�����'�' '�
/!�$�$ #2+�$�4�$8 +��2"�� ��$�#�$�4�$8 ������
3#����"�<$���<��
� ��� ����� ��� � � ��� ������ ��� � � ��� ����� ��� �
Fig. 16. Grain yield, sink size, potential sink size, and growth duration of six IR varieties and
advanced lines under different plant spacings (1989 dry season).

93
Direct sowing is becoming popular among rice farmers in the tropics, but inconsistent seedling
establishment, susceptibility to lodging, and weed infestation constrain further adoption. Although
rice is a crop that can germinate and establish seedlings in flooded anaerobic soil, this character has
not been fully used in rice cultivation until now. We hypothesize that sowing rice seeds under the
surface of puddled soil where the oxygen supply is limited may help to overcome various constraints
associated with direct sowing. Screening germplasm that can establish seedlings in flooded soil was
conducted and it was found that 3% of 2,300 accessions tested were superior over controls com-
monly used for transplanting. The reason superior cultivars grow better in flooded soil than the
controls was that the coleoptile elongates faster and longer in hypoxia and is able to reach the soil
surface where O2 is available. The importance of seed vigor was demonstrated in achieving success-
ful seedling establishment in anaerobic soil. The selected cultivars performed better in anaerobic
broadcasting (sowing pregerminated seeds just after puddling) and with drill sowing (use of seeder
developed for drill sowing in puddled soil) in two locations each in the Philippines, Vietnam, and
Myanmar. Anaerobic drill sowing was suitable for increasing lodging resistance. A study under various
degrees of weed and water controls demonstrated that the technology would be useful for reducing
herbicide use and increasing water productivity.
Farmers in the tropics are shifting rice crop establishmentmethods from transplanting to wet direct sowing. Farmersprefer direct sowing because it requires less labor and timethan transplanting. The shift is prominent in Malaysia, Thai-land, Vietnam, the Philippines, and Myanmar. In wet directsowing, the land is puddled in the same way as in trans-planting culture, and, after 1–2 d, germinated seeds arebroadcast on the soil surface with (water sowing) or withoutstanding water (wet sowing). It is generally believed thatseeds covered by wet soil develop poorly or die. Therefore,farmers broadcast the seeds on the soil surface. Grain yieldof direct-seeded rice is reported to be the same as, or higherthan, that of transplanted rice.
Three major constraints, however, have to be overcomefor increasing the adoption of direct sowing.1. Seedling establishment is inconsistent (Hiraoka et al
1992). Causes include the destruction of seedlings bybirds and rats and the failure of rice seedling develop-ment because of factors associated with excess or defi-ciency of water. Because farmers sow seeds on the soilsurface, bird and rat damage is serious.
Ecophysiology of rice cultivationunder anaerobic direct sowingM. Yamauchi
2. Weed infestation is more pronounced in direct-seededrice fields than in transplanted fields (Moody 1993). Di-rect-seeded rice plants start to grow at the same time asthe weeds, being exposed to stronger weed competitionthan transplanted ones.
Herbicide use is most effective in weed control ofdirect-seeded rice fields. In addition, weed infestationcan be reduced by intensive land preparation before sow-ing, improvement of seedling establishment and watercontrol, an increase in seed rate, and the use of weed-competitive cultivars. Drill sowing instead of broadcastsowing provides the opportunity for mechanical andmanual weeding.
3. Lodging is more common in direct-seeded rice than intransplanted rice. Because farmers are sowing seeds onthe soil surface, plants are susceptible to culm-bottom-type lodging (Nishiyama 1985). In addition, a high seedrate leads to high plant density, which induces bending-type lodging. Deep sowing and a reduced seed rate arelikely to increase lodging resistance, but they make seed-ling establishment unstable.
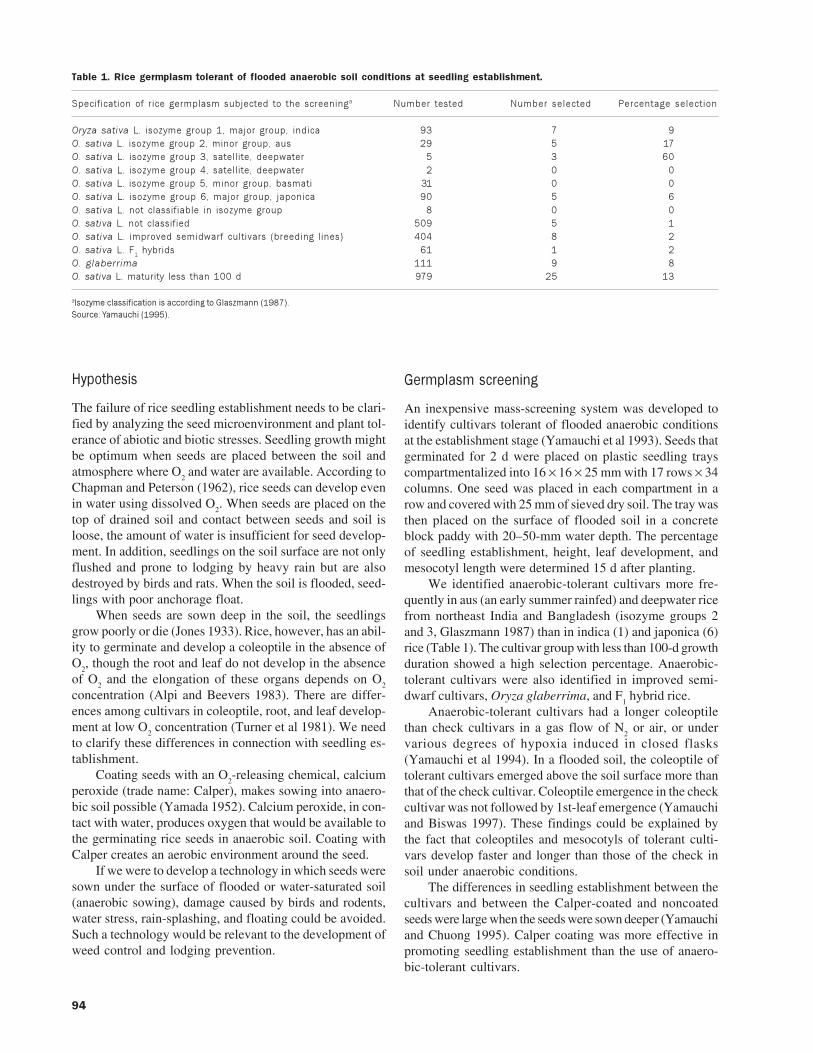
94
Hypothesis
The failure of rice seedling establishment needs to be clari-fied by analyzing the seed microenvironment and plant tol-erance of abiotic and biotic stresses. Seedling growth mightbe optimum when seeds are placed between the soil andatmosphere where O
2 and water are available. According to
Chapman and Peterson (1962), rice seeds can develop evenin water using dissolved O
2. When seeds are placed on the
top of drained soil and contact between seeds and soil isloose, the amount of water is insufficient for seed develop-ment. In addition, seedlings on the soil surface are not onlyflushed and prone to lodging by heavy rain but are alsodestroyed by birds and rats. When the soil is flooded, seed-lings with poor anchorage float.
When seeds are sown deep in the soil, the seedlingsgrow poorly or die (Jones 1933). Rice, however, has an abil-ity to germinate and develop a coleoptile in the absence ofO
2, though the root and leaf do not develop in the absence
of O2 and the elongation of these organs depends on O
2
concentration (Alpi and Beevers 1983). There are differ-ences among cultivars in coleoptile, root, and leaf develop-ment at low O
2 concentration (Turner et al 1981). We need
to clarify these differences in connection with seedling es-tablishment.
Coating seeds with an O2-releasing chemical, calcium
peroxide (trade name: Calper), makes sowing into anaero-bic soil possible (Yamada 1952). Calcium peroxide, in con-tact with water, produces oxygen that would be available tothe germinating rice seeds in anaerobic soil. Coating withCalper creates an aerobic environment around the seed.
If we were to develop a technology in which seeds weresown under the surface of flooded or water-saturated soil(anaerobic sowing), damage caused by birds and rodents,water stress, rain-splashing, and floating could be avoided.Such a technology would be relevant to the development ofweed control and lodging prevention.
Germplasm screening
An inexpensive mass-screening system was developed toidentify cultivars tolerant of flooded anaerobic conditionsat the establishment stage (Yamauchi et al 1993). Seeds thatgerminated for 2 d were placed on plastic seedling trayscompartmentalized into 16 × 16 × 25 mm with 17 rows × 34columns. One seed was placed in each compartment in arow and covered with 25 mm of sieved dry soil. The tray wasthen placed on the surface of flooded soil in a concreteblock paddy with 20–50-mm water depth. The percentageof seedling establishment, height, leaf development, andmesocotyl length were determined 15 d after planting.
We identified anaerobic-tolerant cultivars more fre-quently in aus (an early summer rainfed) and deepwater ricefrom northeast India and Bangladesh (isozyme groups 2and 3, Glaszmann 1987) than in indica (1) and japonica (6)rice (Table 1). The cultivar group with less than 100-d growthduration showed a high selection percentage. Anaerobic-tolerant cultivars were also identified in improved semi-dwarf cultivars, Oryza glaberrima, and F
1 hybrid rice.
Anaerobic-tolerant cultivars had a longer coleoptilethan check cultivars in a gas flow of N
2 or air, or under
various degrees of hypoxia induced in closed flasks(Yamauchi et al 1994). In a flooded soil, the coleoptile oftolerant cultivars emerged above the soil surface more thanthat of the check cultivar. Coleoptile emergence in the checkcultivar was not followed by 1st-leaf emergence (Yamauchiand Biswas 1997). These findings could be explained bythe fact that coleoptiles and mesocotyls of tolerant culti-vars develop faster and longer than those of the check insoil under anaerobic conditions.
The differences in seedling establishment between thecultivars and between the Calper-coated and noncoatedseeds were large when the seeds were sown deeper (Yamauchiand Chuong 1995). Calper coating was more effective inpromoting seedling establishment than the use of anaero-bic-tolerant cultivars.
Table 1. Rice germplasm tolerant of flooded anaerobic soil conditions at seedling establishment.
Specification of rice germplasm subjected to the screeninga Number tested Number selected Percentage selection
Oryza sativa L. isozyme group 1, major group, indica 93 7 9
O. sativa L. isozyme group 2, minor group, aus 29 5 17
O. sativa L. isozyme group 3, satellite, deepwater 5 3 60
O. sativa L. isozyme group 4, satellite, deepwater 2 0 0
O. sativa L. isozyme group 5, minor group, basmati 31 0 0
O. sativa L. isozyme group 6, major group, japonica 90 5 6
O. sativa L. not classifiable in isozyme group 8 0 0
O. sativa L. not classified 509 5 1
O. sativa L. improved semidwarf cultivars (breeding lines) 404 8 2
O. sativa L. F1 hybrids 61 1 2
O. glaberrima 111 9 8
O. sativa L. maturity less than 100 d 979 25 13
aIsozyme classification is according to Glaszmann (1987).
Source: Yamauchi (1995).

95
Seed vigor
Seed vigor, the potential for rapid uniform emergence, andthe development of normal seedlings under a wide range offield conditions (Association of Official Seed Analysts 1983)vary according to seed age, cultivar, time of harvest, weatherduring maturation, nutrition, position of seeds on thepanicle, specific gravity, mechanical integrity, and the pres-ence of pathogens (Seshu et al 1988). In screenings, we of-ten observed that the seed source changed the performanceof a cultivar.
Subjecting seeds to an accelerated aging treatment sig-nificantly reduced anaerobic seedling establishment(Yamauchi and Tun Winn 1996). When seeds were kept for0–9 d at 100% relative humidity at 43 ºC, IR36 (check) andJC178 (tolerant) showed a lower percentage of germinationand seedling establishment. A tolerant cultivar, ASD1, how-ever, did not deteriorate during the aging treatment andmaintained a high seedling establishment ability, suggest-ing that this cultivar is tolerant of seed aging as well. Be-cause production and postharvest conditions vary amongseed sources, seed vigor may differ even among the seedlots of an identical cultivar. The use of a cultivar tolerant ofboth seed aging and anaerobic conditions might be impor-tant to achieve consistent seedling establishment.
Sowing method
The methods of placing seeds under the surface of puddledsoil should be simple so that farmers can practice anaerobicsowing. The following methods were developed.1. Anaerobic broadcast sowing. Most farmers broadcast
germinated seeds when the soil surface becomes hard(1–2 d after land preparation). In anaerobic broadcastsowing, the seeds are broadcast before the soil surfacebecomes hard (mostly, on the day of land preparation) sothat a thin soil layer covers broadcast-sown seeds.
During the dry season, seedling establishment wasoptimum when seeds were sown 1 d after land prepara-tion (Yamauchi 1995) mainly because of the seed land-ing position: half of the seed body stays in the soil andthe remaining half in the atmosphere. When seeds weresown on the day of land preparation, seeds sank underthe soil surface and seedling establishment was reduced,resulting in a clear difference between cultivars. Sowingat 2–3 d after land preparation reduced seedling estab-lishment because of poor contact between seed and soil.
During the wet season, sowing at 0–2 d after landpreparation resulted in a similar level of seedling estab-lishment, regardless of the cultivars, at the two locationsin the Philippines (Yamauchi 1995). Because the seedswere splashed by rain, there was little difference in seed-ling establishment between the seeds sown on the day ofland preparation (covered by soil at sowing but exposedto the soil surface by rain-splashing later) and those sown2 d after land preparation (seeds stayed on the soil sur-
face at sowing but were covered by or mixed with soil byrain-splashing later).
In water sowing, farmers broadcast when the soil par-ticles settle and water becomes clear. Because of buoy-ancy, many seedlings are detached from the ground andfloat. This problem is particularly serious when it iswindy. Broadcasting seeds on the day of land prepara-tion and covering them with a thin layer of soil could beadvantageous in preventing the occurrence of floatingseedlings. The sowing depth, however, was significantlyaffected by the timing of sowing after land preparation,soil properties, and intensity of land preparation, result-ing in occasional failures of seedling establishment. Inaddition, the presence of snails in the standing waterdestroyed the seedlings. Thus, the technique of watersowing needs to be further developed.
2. Anaerobic drill sowing. Commercial seeders developedfor sowing Calper-coated seeds are useful for anaerobicdrill sowing. At IRRI, we modified the IRRI drum seeder(designed for surface drill sowing) into an anaerobicseeder by attaching buoyant flotation wheels and furrowopeners and closers (Borlagdan et al 1993, 1995). Thisseeder can be produced locally for about US$150 perunit. The seeder was successfully operated in Los Bañosand Muñoz, Philippines; Yezin and Kyaukse, Myanmar;and Hanoi, Vietnam.
Crop establishment
Anaerobic drill sowing was tested in Los Baños and Muñoz,Philippines, and anaerobic broadcast sowing in Muñoz inthe 1993 dry season (Yamauchi et al 2000). The percentageof seedling establishment, single-seedling weight, height,and biomass production of anaerobic-tolerant cultivars weresignificantly greater than those of the semidwarf high-yield-ing check cultivars. Cultivar performance varied betweenlocations but not between sowing methods. Biomass pro-duction was controlled not only by the percentage of seed-ling establishment but also by single-seedling weight. Toimprove crop establishment, it is first necessary to increasethe percentage of seedling establishment, and second to usecultivars with rapid initial seedling growth.
There was little difference in grain yield betweenanaerobic-tolerant and check cultivars at the two locationswhen cultivars of improved semidwarf plant type were com-pared. Although tolerance of anaerobic conditions was ob-served more often in traditional cultivars than in improvedsemidwarf cultivars (Table 1), a tolerance gene could beincorporated into semidwarf high-yielding plants.
Anaerobic broadcast and drill sowing were successfullytested also in the Mekong Delta (Chau and Yamauchi 1994)and Red River Delta (Chuong and Yamauchi 1994) in Viet-nam and in Myanmar (Tun Winn et al 1997), leading toimproved crop establishment and higher grain yield thanwith check cultivars. These experiments indicated that acultivar that performed well at a given location did not al-

96
ways perform well at other locations. It seems that the per-formance is influenced by the interaction between the seedand local conditions, particularly soil. The relationship ofseedling establishment between the local check and the best-performing anaerobic-tolerant cultivar was analyzed to un-derstand the potential to stabilize seedling establishmentwith the introduction of anaerobic tolerance (Fig. 1)(Yamauchi 1999). The regression curve indicated that theintroduction of an anaerobic-tolerant cultivar resulted inmore than 80% seedling establishment while the perfor-mance of the local check cultivar ranged from 20% to 100%.We conclude that anaerobic tolerance stabilizes seedlingestablishment in the tropics.
Weed control
The introduction of anaerobic drill sowing makes mechani-cal and manual weed control possible. This might be usefulwhen a herbicide is not available or its use has to be re-duced.
Crop establishment and weed control of anaerobic-tol-erant cultivar IR41996-50-2-1-3 were compared with thoseof check cultivar PSBRc 4 under various combinations ofsowing methods, water control, and weed control levels.IR41996-50-2-1-3 had higher yield across sowing methodsand water controls and competed better with weeds thanPSBRc 4 because of superior seedling establishment, initialgrowth, and panicle number (Pablico et al 1994).
The contamination of rice fields with noncultivatedrice plants (weedy rice) is becoming serious, reducing grainyield and market price. Weedy rice was found to be anaero-bic-tolerant (Yamauchi et al 1995). The introduction ofanaerobic-tolerant cultivars may reduce the infestation ofweedy rice.
Although herbicide application is an essential compo-nent of weed control in broadcast-sown rice fields, it mustbe reduced as much as possible through the integration ofwater control, tillage, and seedling establishment method.Anaerobic sowing with flooding 3 d after sowing allowedcultivars to sustain high yield and increased water produc-tivity without having to use herbicide or with only half ofthe recommended herbicide rate (Tuong et al 2000).
Lodging
We evaluated the lodging resistance of rice plants by visualobservation and by using a push-gauge. A gauge that mea-sures lodging resistance by evaluating a single hill wasmodified to determine the lodging resistance of a broad-cast-sown canopy. The force required for a canopy of 30-cmwidth to exhibit 45º lodging at 15-cm height was closelycorrelated with the visual observation (coefficient of simplelinear correlation –0.947, significant at the 1% level).
We evaluated the lodging resistance of transplanted,surface broadcast and drill-seeded, and anaerobic broadcastand drill-seeded rice at two locations in the Philippines(Yamauchi 1995). The lodging resistance of drill-seededrice was equivalent to or slightly lower than that of trans-planted rice, but significantly higher than that of broadcast-seeded rice. Anaerobic-tolerant cultivar IR52341-60-1-2-1showed greater resistance to lodging at Los Baños than theothers.
The analysis of interactions in lodging resistance amongplanting method, water management, and weed control sug-gested that weed infestation reduces lodging resistance themost (Yamauchi 1995). This was particularly true when wecompared the lodging resistance of rice crops grown with-out herbicide with those grown with herbicide. Anaerobicsowing followed by advanced flooding resulted in a reduc-tion in weed infestation and higher lodging resistance inthe plots without herbicide application (Pablico et al 1996).
Relevance to direct sowing in Japan
Rice has been produced in Japan by transplanting for morethan 2,000 years. After achieving rice self-sufficiency inrecent years, the government encouraged a shift from trans-planting to direct sowing when it foresaw the need to re-duce rice production costs. Although rice transplanting inJapan is well mechanized, the amount of labor and materi-als required for raising seedlings and transporting them fromthe nursery to fields is huge.
In the past, direct sowing was locally practiced in theform of water sowing in Japan. Pregerminated seeds weresown into the standing water after the settlement of soilparticles. Floating of seedlings was the major problem thatlimited adoption.
Yamada (1952) found that seed coating with calciumperoxide improves seedling establishment in floodedanaerobic soil. Rice scientists in Japan used this findingand established the technology of seed coating with oxy-
Fig. 1. Seedling establishment of anaerobic-tolerant cultivars
versus local check cultivars in the tropics. The data of 7
experiments conducted at 6 locations in 3 countries were analyzed.
Each experiment involved 2 check cultivars and 5 to 10 anaerobic-
tolerant cultivars. On the x axis, percentage establishment of the
best check cultivars is shown. The y axis indicates percentage
establishment of the best anaerobic-tolerant cultivar in the
experiment.
�
��
��
��
��
���
� �� �� �� �� ���
���� ���������������������� ��
��� �� �!"�#�$�%���� !�
&� � '' ���
( ���
)*���
���� ���������������������� ��

97
gen-release chemical Calper. The technology is popularamong rice scientists, extension workers, and policymakersin Japan. However, Japanese farmers have not yet adoptedthe technology as much as expected. Some farmers say thattransplanting with a machine is much more labor- and time-saving, resulting in more reliable crop establishment thandirect sowing with the seed-coating technology. Becausethe coating technology requires both labor for seed coatingand the purchase of chemicals and a coating machine, andbecause the coated seeds have to be sown on time (thus,farmers lose flexibility of farm operations), it might be diffi-cult to persuade farmers to adopt the technology.
This study emphasizes the importance of using the in-herent physiological character “anaerobic tolerance” in lieuof coating seeds with an oxygen-release chemical. Nowa-days, some studies in Japan demonstrate reducing the use ofseed-coating material from the originally recommended two-times seed weight to one time to zero use. Some breedingprograms propose germplasm screening for anaerobic toler-ance. It seems that research on direct sowing in Japan ischanging from depending on chemical use to depending ongermplasm use.
References
Alpi A, Beevers H. 1983. Effect of O2 concentration on riceseedlings. Plant Physiol. 71:30-34.
Association of Official Seed Analysts. 1983. Seed vigor testinghandbook. Contribution No. 32 to the handbook on seed test-ing. Association of Official Seed Analysts, Iowa, USA. p15-16.
Borlagdan PC, Yamauchi M, Quick GR, Aragones DV. 1993.Design and development of anaerobic seeder for direct seed-ing of rice. Philipp. Technol. J. 18(3):77-95.
Borlagdan PC, Yamauchi M, Aragones DV, Quick GR. 1995.Seeder developed for direct sowing of rice under the puddledsoil surface. Int. Rice Res. Notes 20(1):29-30.
Chapman AL, Peterson ML. 1962. The seedling establishmentof rice under water in relation to temperature and dissolvedoxygen. Crop Sci. 2:391-395.
Chau NM, Yamauchi M. 1994. Performance of anaerobicallydirect-seeded rice plants in the Mekong Delta, Vietnam. Int.Rice Res. Notes 19(2):6-7.
Chuong PV, Yamauchi M. 1994. Anaerobic direct seeding ofrice in northern Vietnam. In: Moody K, editor. Paper pre-sented at a workshop on “Constraints, opportunities, and in-novations for wet-seeded rice,” 31 May-3 June 1994,Bangkok, Thailand. IRRI Discussion Paper Series No. 10.Los Baños (Philippines): International Rice Research Insti-tute. p 186-198.
Glaszmann JC. 1987. Isozymes and classification of Asian ricevarieties. Theor. Appl. Genet. 74:21-30.
Hiraoka H, Ho NK, Wada G. 1992. Development of direct sow-ing rice culture in the Muda Irrigation Scheme, Malaysia. 2.Survey of farm operations and seedling establishment inwet-seeding rice culture in the Muda area. Jpn. J. Trop.Agric. 36:211-220.
Jones JW. 1933. Effect of reduced oxygen pressure on rice ger-mination. J. Am. Soc. Agron. 25:69-81.
Moody K. 1993. Weed control in wet-seeded rice. Exp. Agric.29:393-403.
Nishiyama I. 1985. Lodging of rice plants and countermeasures.International seminar on plant growth regulators in agricul-ture. FFTC for the Asia and Pacific Region, Taiwan. p 150-163.
Pablico PP, Yamauchi M, Tuong TP, Cabangon RJ, Moody K.1994. Crop establishment and weed competitiveness of di-rect-seeded anaerobic rice cultivars as influenced by seed-ing and water management systems. In: Moody K, editor.Paper presented at a workshop on “Constraints, opportuni-ties, and innovations for wet-seeded rice,” 31 May-3 June1994, Bangkok, Thailand. IRRI Discussion Paper Series No.10. Los Baños (Philippines): International Rice ResearchInstitute. p 156-170.
Pablico PP, Yamauchi M, Tuong TP, Confessor RB, Moody K.1996. Performance of anaerobic direct-seeding techniqueunder different water and tillage systems. In: Ishii R, HorieT, editors. Crop research in Asia: achievements and per-spectives. Proceedings of the 2nd Asian Crop Science Con-ference “Toward the Improvement of Food Production un-der Steep Population Increase and Global EnvironmentalChange,” 21-23 August 1995, the Fukui Prefectural Univer-sity, Fukui, Japan. p 216-219.
Seshu DV, Krishnasamy V, Siddique SB. 1988. Seed vigor inrice. In: Rice seed health. Manila (Philippines): InternationalRice Research Institute. p 315-329.
Tun Winn, Yamauchi M, Than Than Soe, Sein Ni, San Thein,Garcia AG. 1997. Rice (Oryza sativa L.) cultivars suitablefor direct seeding in Myanmar. Jpn. J. Trop. Agric. 41:66-73.
Tuong TP, Pablico PP, Yamauchi M, Confesor R, Moody K.2000. Increasing water productivity and weed suppressionof wet-seeded rice: effect of water management and ricegenotypes. Exp. Agric. 36:71-89.
Turner FT, Chen C-C, McCauley GN. 1981. Morphological de-velopment of rice seedlings in water at controlled oxygenlevels. Agron. J. 73:566-570.
Yamada N. 1952. Calcium peroxide as an oxygen supplier forcrop plants. Proc. Crop Sci. Soc. Jpn. 21:65-66.
Yamauchi M. 1995. Anaerobic direct seeding of rice in the trop-ics. JIRCAS J. 2:65-78.
Yamauchi M. 1999. Stabilization of rice seedling establishmentin wet direct sowing in temperate and tropical regions withemphasis on anaerobic seedling growth. In: Horie T, GengS, Amano T, Inamura T, Shiraiwa T, editors. Proceedingsof the International Symposium “World Food Security andCrop Production Technologies for Tomorrow,” 8-9 October1998, Kyoto, Japan, organized by the Crop Science Societyof Japan. Published by Kyoto University, Japan. p 261-264.
Yamauchi M, Aguilar AM, Vaughan DA, Seshu DV. 1993. Rice(Oryza sativa L.) germplasm suitable for direct sowing un-der flooded soil surface. Euphytica 67:177-184.
Yamauchi M, Herradura PS, Aguilar AM. 1994. Genotype dif-ference in rice postgermination growth under hypoxia. PlantSci. 100:105-113.

98
Yamauchi M, Chuong PV. 1995. Rice seedling establishment asaffected by cultivar, seed coating with calcium peroxide,sowing depth, and water level. Field Crops Res. 41:123-134.
Yamauchi M, Chuong PV, Chau NM. 1995. Ecophysiology ofrice-crop establishment in wet direct seeding in Vietnamwith emphasis on anaerobic seedling growth. In: DenningGL, Xuan V-T, editors. Vietnam and IRRI: a partnership inrice research. Manila (Philippines): International Rice Re-search Institute, and Ministry of Agriculture and Food Indus-try, Hanoi, Vietnam. p 89-95.
Yamauchi M, Tun Winn. 1996. Rice seed vigor and seedlingestablishment in anaerobic soil. Crop Sci. 36:680-686.
Yamauchi M, Biswas JK. 1997. Rice cultivar difference in seed-ling establishment in flooded soil. Plant Soil 189:145-153.
Yamauchi M, Aragones DV, Casayuran PR, Sta. Cruz PC, AsisCA, Cruz RT. 2000. Seedling establishment and grain yieldof tropical rice sown in puddled soil. Agron. J. 92:275-282.
Notes
Author’s address: National Agricultural Research Center forWestern Region, Fukuyama 721-8514, Japan.

99
In the face of global water scarcity, improvement of upland rice production under water-limited
conditions is crucial for maintaining food security in the tropics. The major abiotic constraints that
limit the productivity of upland rice are unstable water availability and low nutrient supply. To seek
possible management options to overcome these two constraints, this study aimed to analyze
water-nutrient interactions related to (1) soil N dynamics, (2) N-use efficiency for yield, and (3) water
uptake by the plant, with particular emphasis on the morphology and functions of the root system.
Field studies in diverse uplands in the Philippines, Thailand, and India showed that the causes of
limited yield response to N inputs were a low N recovery because of high N leaching and/or low
internal N-use efficiency because of water stress. A large amount of soil indigenous N was generally
found in the early growth period, but the soil was subject to N leaching brought about by intensive
rainfall. NO3-absorbing capacity of the acidic Ultisols retarded N leaching. The use of controlled-
release N was useful for improving N recovery. Internal N-use efficiency often decreased in uplands
because of limited water uptake. Limited water capture by rice was first attributed to the plant’s
shallow root distribution. An adequate nutrient supply, particularly of P, in the surface layer had a
significant effect on improving the water-capturing capacity from the layers below the surface by
enhancing deep-root development. Strong environmental effects and genotype × environment inter-
actions in rooting depth indicated that it is important to optimize a combination of genotype and soil
conditions to improve the deep-root system. A QTL analysis on root morphology showed the impor-
tance of phenotyping conditions and also suggested a possibility of marker-aided selection for deep-
root traits. The water uptake rate decreased rapidly with decreasing soil water because of reduced
root growth and limited water uptake rate per unit root length, which implied the possibility that a
lower root conductance for water is responsible for the limited water capture by rice under the stress.
Genotypic variations in the structures of sclerenchyma and xylems were found among the genotypes
of tropical origin, which might be related to the water uptake ability under the stress.
Stabilizing rice production under water stress inrainfed and upland croppingM. Kondo, M.V.R. Murty, P.P. Pablico, D.V. Aragones, A. Aguilar, R. Agbisit,K.S. Kwak, T. Winn, K. Okada, and Ki-Do Park
Because of the global water scarcity, the improvement ofrice productivity under water-limited conditions, such as inuplands, is becoming more important. To improve currentlow yield levels, we need to identify the constraints to yieldand develop strategies and technologies for aerobic soilconditions. For abiotic stress, low nutrient supply, espe-cially of N, and the high sensitivity of rice to drought arethe critical constraints in most upland areas (Yoshida 1975,Widawsky and O’Toole 1996). To develop efficient N man-agement options, it is important to identify the critical pro-cesses in the determination of a yield response to N inputs,which includes N supply from soil, N uptake by roots, andN-use efficiency for yield. Drought tolerance of the plant isa complex character consisting of physiological and mor-phological traits that confer three mechanisms, escape,
avoidance, and tolerance (Levitt 1980). Past research clari-fied that maintenance of high water potential in the shootsupported by water capture from deep soils is related togrowth during the stress period in rice genotypes, whichindicated significant genetic variation in avoidance ability(Yoshida and Hasegawa 1982, Liley and Fukai 1994). Thegenetic diversity and genetic control in root morphology,especially in the nodal root system, have been studied ex-tensively since the 1970s for the genetic improvement of alarge and deep root system (for example, Chang et al 1982,Yoshida and Hasegawa 1982, Yadav et al 1997). Comparedto this progress in genetic aspects, the understanding of en-vironmental effects and genotype × environment interac-tions (G × E interactions) on root development, which isessential for maximizing the expression of genetic poten-

100
tial, has been limited. In addition, the adaptive traits underlower soil water should be further clarified to identify thecritical plant traits for improving water-capturing capacityand water-use efficiency. On the basis of this background,this project focused on1. An evaluation of the effects of nutrient and water stress
on yield and characterization of the dynamics of N in thesoil in upland rice.
2. The root system as affected by the environment and ge-netic factors.
3. The characteristics of root growth and water uptake un-der water stress.
4. Genetic and environmental effects on the variation incarbon isotope discrimination and water-use efficiency.
Evaluating the effects of nutrient and water stresson yield and characterizing N dynamics in uplandrice soil
Effects of nutrient and water stress on yield and
nitrogen-use efficiency
Final grain yield can be considered as a function of uptakeof soil-N and applied-N and the internal N-use efficiencyfor grain production, both of which could be affected bywater regimes. Therefore, to overcome the problems respon-sible for an unstable yield response to N, it is important todevelop improved N and crop management (Kondo et al1998, 2002a). To identify the critical factors for determin-ing yield in diverse upland conditions, field experimentswere conducted in major upland rice areas in India, Thai-land, and the Philippines. To analyze the movement of wa-ter and N in soil profiles, a simulation model for the waterbalance and N leaching in the soil was developed using asimple one-dimensional model (Murty and Kondo 2001).
Yield without N application ranged from 0.85 to 1.92 tha–1 without irrigation, indicating a low yield potential with-out nutrient input. The yield gain from N application variedmarkedly among sites, years, and application methods for Nand P. A large response to N was obtained in Hazaribag,India (1.48 t ha–1 on average), whereas a limited yield gain(0.13 t ha–1) was obtained in Fang, Thailand. The variableresponse to N was attributed to the variation in N recoveryand/or internal N-use efficiency among the sites. N recov-ery mainly determined the agronomic N-use efficiency (yieldgain from N input) in Hazaribag, indicating the importanceof improving N recovery (Fig. 1). On the other hand, inMatalom, Philippines, agronomic N-use efficiency increasedas N recovery increased, but it remained at a relatively lowlevel compared with the value obtained in flooded condi-tions without water stress. Agronomic N-use efficiency wasquite variable against N recovery and low in Fang. Theselow and variable agronomic N-use efficiencies were mainlycaused by water stress. The results across sites implied thatthe prioritized strategy to improve yield should differ amongsites. The simulation on N movement in the soil in Hazaribagsuggested that one factor for variable N recovery was con-sidered to be N leaching as affected by rainfall. To improve
N recovery, the use of controlled-release urea was found tobe effective compared with four split applications of solubleurea, especially under high rainfall.
On the other hand, in the areas where the internal N-useefficiency was low and/or variable because of water stress,such as Fang and Matalom, nutrient input combined withgenetic/cultural improvement in water-capturing capacityby the roots is needed to increase the efficiency expectedfrom nutrient input. In this connection, improvement of rootdevelopment in genetic factors and soil environmental fac-tors will be sought.
N dynamics in upland soil as affected by rainfall and
soil NO3 absorption
To establish an N application method to meet the N demandof the crop, a proper understanding of the dynamics of soilN availability and an ideal pattern of plant N accumulationfor maximum yield is essential. In upland rice soils in Cale(Haplustalfs, pH (H
2O) 5.18) and Siniloan (Palehumults, pH
(H2O) 4.50) in the Philippines, a large amount of available
NO3 (KCl-extractable), higher than 120 kg ha–1 in 0–80-cm
depth, was detected during the crop establishment period atboth sites, which was probably due to mineralization at theonset of the wet season (Kondo et al 1998). Thereafter, NO
3
disappeared from the surface, then from the deeper layer.NO
3 decreased markedly, especially after the heavy rain in
Cale, which indicated N loss by leaching. On the other hand,available NO
3 to 80-cm depth decreased only slowly with
increases in the 40–80-cm layer during the crop season inSiniloan, which was at least partly due to retardation of Nleaching by the NO
3 absorption capacity of the soil. Field
experiments using 15N showed that the different N-supply-ing patterns from the soils among the sites affected the opti-mum timing of N application. In the soil without NO
3 ab-
������������� ����� � �
������������ ������
�������������������������
���������
�������
����
�������������
�����!""
����!���#
������""
$%
%
�
�%
!
!%
&���'�(�����)
*&+,�����$�
! - .
Fig 1. Relationship between N recovery from N application and
agronomic N-use efficiency (ANUE) in Hazaribag, Matalom, and
Fang under upland conditions and at IRRI under flooded conditions.

101
sorption, the use of N from the soil N pool at the early stagewas important together with the application of a topdressingat later growth stages to supplement the decreasing soilavailable-N. In contrast, there was less difference in N re-covery among the timing of N application in the acidicUltisol because a large portion of applied 15N remained inthe rooting zone until maturity. These results suggested thatsite-specific N management is necessary with considerationof the soil type as well as rainfall pattern to improve N re-covery.
The root system as affected by environmental andgenetic factors in upland rice
Although the importance of a deep rooting zone to ensurewater capture under drought is established in upland rice ingeneral, progress in developing a genotype possessing anefficient root system for water uptake has been relativelylimited. The reasons for limited progress can be attributedto (1) a lack of knowledge on environmental factors thatcomplicate varietal evaluation in root morphology, (2) thetedious screening procedure for root morphology, (3) aninsufficient understanding of the genetic control of roottraits, and (4) insufficient information on the value of roottraits for different types of water stress. Considering thisbackground, in this section we examine the emphasis onenvironmental (soil, water, nutrient management) and ge-netic factors and their interactions for root morphology be-cause this is needed to develop genotypes adapted to thetarget environment and to identify suitable managementfor the expression of the potential of genotypes.
Developing linkage maps and identifying QTLs asso-ciated with root morphology help to develop marker-aidedselection for better selection efficiency for root morphol-ogy and drought tolerance, and to understand the geneticcontrol of root traits. To enhance this progress, further un-derstanding is needed on the environmental effects on varia-tions of QTLs associated with the deep root system trait andthe underlying mechanisms.
Characteristics of the root system and nutrient
effects on root development in upland rice
The field data from the IRRI upland field showed that maxi-mum rooting depth was attained at the early tillering stage.The rooting zone expanded both vertically and horizon-tally from crop establishment to the tillering stage andslightly more horizontally from tillering to panicle initia-tion. The change in root distribution was possibly related tothe increase in shallower nodal roots emerging from latestems. The close linkage between the development of thestem and nodal roots is reflected in the spatial expansion ofthe rooting zone.
Root length density usually decreases exponentiallyalong the depth. On average across experimental sites andmanagement, 22% of the root was distributed below 30-cmdepth in terms of length, indicating a general feature ofshallow root distribution in rice, though considerable varia-
tion occurred (Kondo et al 1999a, 2001a). The results onthe effect of nutrients on root growth and water uptakeshowed that an adequate nutrient supply, particularly of P,in the surface layer significantly improved the water-cap-turing capacity from the layers below the surface by en-hancing deep-root development. The application of P ledto deeper root distribution in P-deficient acidic soils (Fig.2) because the nodal roots from lower internodes in earlystems increased with a higher P level. Phosphorus status inthe plant at the early stage affects root growth and distribu-tion after the reproductive stage. It was found that a mediumlevel of N (90 kg ha–1) generally increased root length den-sity without a significant change in root distribution (Fig.2). This is different from the case in submerged conditions,in which N application substantially inhibits the elonga-tion of nodal roots to form a shallow root system (Kawata etat 1977). Regarding the timing of N, basal N enhanced rootgrowth from early stems, which led to deeper distribution atthe reproductive stage (Winn 1999).
Effect of nitrogen-catch crops on root growth and
nitrogen use in rice in rainfed lowland ecosystems
In rice-based rainfed lowland ecosystems in northeastLuzon, Philippines, intensive cropping systems with rice inthe wet season and a cash crop in the dry season are com-monly adopted. The introduction of an N-catch crop duringthe dry-to-wet transition period is expected to reduce Npollution of the groundwater that resulted from excessive Napplication for cash crop cultivation (Kondo et al 1999b).Planting of an N-catch crop may affect the root develop-ment of rice as well as scavenging soil N, which would af-fect water uptake.
In field experiments conducted in farmers’ fields(Inceptisol) in Batac, Ilocos Norte, Philippines, N-catch
� ! �
/�%
�%/�
�/-%
-%/.
./0%
0%/1
2�3�4��'�
&��&5
�&�1
�5�.
��&1���5.
����������4����#�����'��'�/�
Fig 2. Effect of N (90 kg ha–1) and P (60 kg ha–1) on root development
at flowering stage, Siniloan, 1996.

102
crops (indigo and maize) showed an almost uniform rootlength density along the depth below 20 cm and down to 70cm, reflecting the high capacity to trap NO
3 leaching from
the deep soil layer as N-catch crops (Shrestha 1997). Theroot system in rice after N-catch crops was larger and deeperwith a higher root/shoot ratio compared with that with chemi-cal N fertilizer after fallow. N supplied gradually from theresidue of N-catch crops and physical amelioration of thesoil may have enhanced root growth. The efficient rootingcharacteristics of indigo and maize for trapping NO
3 and
enhancing root growth of rice in the succeeding crop sug-gested the advantage of N-catch crops over the fallow sys-tem. The results signified that the underground root interac-tions between rice and other component crops must be con-sidered when selecting cropping systems and residue man-agement in rainfed lowland rice.
Genotypic variation and genotype ××××× soil and N interac-
tions in root development
Genotypic variation in root traits related to the size anddistribution of the root system was examined with particu-lar interest in the interaction with soil and N levels (0 and90 kg N ha–1) using 11 rice genotypes grown in three differ-ent soils, Cale (Haplustalfs), Siniloan (Palehumults), andthe experimental field of IRRI in Los Baños (Tropudalfs), inthe Philippines, in the 1997 wet season. G × E interactionswere analyzed by additive main effects and multiplicativeinteraction (AMMI).
Upland rice varieties tended to have a deeper root dis-tribution than lowland rice varieties (Kondo et al 2001a).While deep distribution was commonly found among up-land varieties, there were differences in root morphologyamong genetic groups. Japonica upland varieties had a largeroot dry weight associated with a high root/shoot ratio, highspecific root weight, and a low number of nodal roots andstems. On the other hand, aus (Dular) and indica (Vandana)varieties showed deep root distribution with a medium root/shoot ratio and low specific root weight. It would be inter-esting to consider the possibility that those characters con-
tribute to the efficient exploitation of the rooting zone withthe use of limited biomass because of a short growing pe-riod in the major cropping areas in eastern India andBangladesh (Courtois and Lafitte 1999), where the dura-tion of the cropping season is restricted by the limited rainyseason. The variation in root thickness among the varietiestested raised the need to verify the significance of root thick-ness in water uptake. The thick root trait was suggested as avaluable root trait for drought tolerance to reduce axial re-sistance for water transport (Richards and Passioura 1981).However, a rigid evaluation of the significance of this traitfor drought tolerance seems to be unavailable in rice(Yambao et al 1992).
Among root traits, the ones related to root size (root dryweight, root/shoot ratio, number of nodal roots) and thick-ness (specific root weight) had a larger effect with varietythan with G × E interactions, indicting the dominance ofgenetic factors in those traits (Table 1). The number of nodalroots in particular had a high stability across environments,which was probably linked with the stable number of stemsthrough the formation of phytomers. The larger effect ofvariety in root/shoot ratio than in root dry weight suggestedthat root/shoot ratio is regulated by genetic factors to a largerextent than root dry weight.
On the other hand, root depth was highly affected bysite, but not by N level, indicating high sensitivity toedaphic conditions (Table 1). The difference in soil waterconditions among the sites was possibly one factor that af-fected root depth because the growth of rice roots is verysensitive to soil water conditions (Fukai and Inthapan 1988).In addition, the results that root depth was closely corre-lated with stem size signified the involvement of a develop-mental factor in determining root distribution. The limitedsupply of carbon per root axis might have limited root elon-gation. High N increased root dry weight without a substan-tial change in the root/shoot ratio and root distribution, andthe interaction of variety × N was relatively small in allexamined root traits.
Table 1. AMMI analysis of variance for total root dry weight (TRM), root depth as root length depth index (RLDI), root/shoot ratio (R/S
ratio), number of nodal roots, and specific root weight (SRW).
df TRM RLDI R/S ratio Root number SRW
(g m–2) (cm) (g g–1) (no. hill–1) (mg cm–1)
Source
Sum of (%) Sum of (%) Sum of (%) Sum of (%) Sum of (%)
square square square square square
Variety (G) 10 28,182 34.2 17.9 1.8 0.076 39.1 134,417 75.7 0.110 63.8
Environment (E) 5 41,705 50.6 884.1 90.3 0.058 29.9 10,750 6.1 0.010 5.7
G × E 50 12,546 15.2 77.1 7.9 0.061 31.1 32,492 18.3 0.053 30.6
IPCA 1 14 9,566 76.2 34.4 44.6 0.040 66.2 11,493 35.4 0.029 53.9
IPCA 2 12 1,531 12.2 17.7 23.0 0.011 18.7 8,505 26.2 0.011 19.8
IPCA 3 10 907 7.2 16.4 21.3 0.006 10.1 7,975 24.5 0.007 12.9
IPCA 4 8 346 2.8 5.9 7.6 0.002 3.6 3,363 10.3 0.006 10.6
Residual 6 196 1.6 2.7 3.5 0.001 1.4 1,156 3.6 0.001 2.8
Total 65 82,434 100.0 979.1 100.00 0.195 100.0 177,658 100.00 0.173 100.0

103
Relatively large G × E interactions in root dry weight,which accounted for 44% of variety factors, indicated theimportance of understanding G × E interactions in rootgrowth. Analysis of adaptation to environments (site and N)by AMMI analysis showed that genetic groups had differ-ent patterns of adaptation to the soil. Japonica upland vari-eties displayed a positive interaction with the Siniloan site,an acidic soil under wet conditions, while Vandana andDular showed a positive interaction with Cale, where thesoil had a slightly acidic reaction with a deep profile. Edaphicfactors such as available-P, exchangeable-Al, pH, bulk den-sity, and soil water regime were suggested as being deter-mining factors for observed variety ´ site interactions.
The results of the variety ´ site interactions in rootgrowth implied that it is important to define the key soilcharacteristics for root development in the target area tooptimize the deployment of genotypes for better rootgrowth. The strong effect of soils on root distribution sug-gested the importance of edaphic factors and soil manage-ment to maximize rooting depth, together with genotypeselection. Molecular markers would be a useful tool for help-ing to clarify the genetic factors and physiological mecha-nisms involved in responses of roots to soil environments.
Genetic control of root morphology by QTL analysis
under different N supply
In most previous studies in QTLs associated with nodal rootmorphology, not enough attention has been paid to pheno-type conditions and developmental interactions betweenroot and shoot traits (Kondo et al 2001b). In this study, rootsystem morphology in 101 doubled-haploid lines derivedfrom parents having a contrasting root system—IR64, a low-land indica variety, and Azucena, an upland tropicaljaponica variety—was investigated and QTLs associatedwith root morphological traits, especially those related to adeep root system, were located under different N conditions(NH
4, 20 mg N L–1; NO
3, 20 mg N L–1; NO
3, 2 mg N L–1) in
hydroponic culture. QTL analysis was performed on rootand shoot traits in the plant grown for 38–40 days aftergermination in three different seasons.
For the average population, total dry weight and stemnumber were highest with NH
4 at 20 mg L–1 than with NO
3,
but the average nodal root length and maximum root lengthwere smaller by 20–27% in NH
4 at 20 mg L–1 than in NO
3 at
20 mg L–1 and a strong inhibition of root elongation oc-curred under NH
4. Treatment × line interaction was signifi-
cant for maximum root length, root dry weight, and rootnumber. This indicated the importance of the interaction ofgenetic and N factors in root morphology.
QTLs were commonly detected across the treatmentsand only in specific N treatments. For plant height, mostQTLs were commonly detected in more than two treatments.On the other hand, QTLs commonly detected across treat-ments were rather limited in root and shoot-root traits. Thenumber of QTLs commonly detected across different sea-sons was also rather limited in root and shoot-root traits. Formaximum root length, 3–5 QTLs were detected in individual
N treatments, of which one was commonly detected acrosstreatments. Common QTLs explained 11.7–25.3% of thephenotypic variation. For average root nodal length, onecommon QTL was found across N treatments, which ex-plained 14.6–29.1% of phenotypic variation.
Several QTLs were associated with plural traits. QTLswere associated with related traits such as number of nodalroots and average nodal root length with which the nega-tive relationship was seen in phenotypic correlation. Weneed to confirm whether those QTLs affected root lengthdirectly or indirectly through the effect on number of roots.
The results here in hydroponic culture showed somesimilarities with the results on QTLs that were detected inthe soil culture in the same population (Yadav et al 1997).QTLs associated with depth of the root system were com-monly found in similar regions on chromosomes 2 and 9.QTLs on the short arm of chromosome 2 from Azucena in-creased root length, whereas QTLs on chromosome 9 hadthe opposite effect. QTLs associated with root size weredetected on chromosomes 1 and 8 in both hydroponic andsoil culture. The presence of those QTLs commonly foundunder various growing conditions signified the possibilityfor marker-aided selection for a deep and large root system.On the other hand, the diverse QTLs among N-supply con-ditions and growing seasons indicated the importance ofselecting phenotyping environments for QTL analysis ofroot traits.
Characteristics of water uptakeunder water stress in rice
Water uptake under water stress
Root length density at depth is the primary factor that deter-mines water uptake from the soil layer; hence, rooting depthis considered to be an important criterion for water captureunder drought stress. However, past studies indicated thatwater uptake rate per unit root length is not simply deter-mined by soil water (matric) potential in a given soil layerin rice and other crops when water stress is imposed(Hasegawa and Yoshida 1982). Understanding on the mor-phological and physiological adaptation of the root todrought stress may lead to more effective selection traits forbreeding programs and strategies for better cultural man-agement.
The field study showed that water extraction patternswere similar in rice and maize under mild stress conditions(Fig. 3). The most water was extracted from the 0–20-cmlayer because of high root length density and possibly be-cause of the lower axial resistance in the shallower layer.Under severe stress, rice showed a much larger suppressionof dry matter production in the shoot compared with maizebecause of limited water uptake from the deep layers (Kondoet al 2000a). The difference in water uptake between maizeand rice was attributed to (1) the low morphological re-sponse to the stress in increasing root density, especially indeep layers, and (2) the decreasing and limited specific wa-ter absorption rate per root length in the deep soil layer in

104
rice. The specific water absorption rate per root length in-creased temporarily below 20-cm depth as the water poten-tial in the surface 0–20-cm layer decreased. However, thespecific water absorption rate decreased markedly when thesoil water potential became lower than –0.04 to –0.05 MPain the layers below 20-cm depth in rice. A detailed study onthe change in water potentials in the soil and plant sug-gested that the limited water uptake rate in the deeper layerunder severe stress was probably caused by the decreasedconductance for water in the root. It would be valuable toexplore the genetic variation in morphological growth andconductivity and to verify the traits critical to improvingwater capture under drying soil.
Diversity in the anatomy of nodal roots
in tropical rice varieties
As discussed in a previous section, the maintenance of rootactivity for water absorption and transport is an importanttrait for improving water uptake under drying soil condi-tions. The axial conductance is possibly related to xylemstructure in the number and size of xylem vessels. The riceroot system possesses several traits that are related to itssemiaquatic nature such as developed sclerenchyma andaerenchyma. However, information is lacking on the role ofthose structures in the radial and axial transport of water.Genetic diversity for those traits and the advantages anddrawbacks for water uptake and transport will be evaluated.
A comparison of 12 lowland and upland genotypesshowed that traditional upland japonica varieties had thelargest diameter of root, stele, and xylem vessel, followedby modern upland varieties (Okada et al 2002). The varietaldifference in the ratio of stele to root diameter was associ-ated with the genetic group with the highest value found injaponica varieties, rather than with the ecosystem. Axialconductance is proportional to equivalent xylem vessel di-ameter (De4), assuming that the water flow through the xy-lem vessel simply follows the Hagen-Poisseulle flow. Thelargest De4 was found in Moroberekan, which was 22.3 timeslarger than in IR20 with the smallest De4 in the roots on themain stem. The relatively consistent relationship betweenDe and stele diameter across varieties, portion of root, andenvironments indicated that stele diameter would be moreappropriate than root diameter for estimating conductance.
The larger stele relative to the root diameter resulted in alarger De/root ratio in japonica than in indica and aus.
Four distinctly different types of sclerenchyma anatomywere identified among the varieties (Fig. 4; Kondo et al2000b). The japonica varieties had a higher frequency ofthe types that have a doubled cell layer in the sclerenchymawith a thick cell wall (types III and IV) than indica and aus.The difference among the genetic groups was nearly consis-tent across soil water regimes and aerobic and submergedsoils, which implied that sclerenchyma development ismainly controlled by a genetic factor. Morphological dif-ferences in the sclerenchyma might be interesting when itsfunction is considered. Prevention of apoplastic water move-ment, an increase in physical strength (Feldman 1984), andprotection of the root from pest infection are based on thelignification or the suberization in the cell wall. The thicksclerenchyma might reduce water permeability of the rootsand prevent collapse of the cortex when the soil is drying.Further study is desired to clarify the value of the traitsfound in traditional upland japonica varieties, which arethe larger root and stele diameter, and De and thickenedsclerenchymatous tissue, to improve their adaptability toupland conditions.
Genetic and environmental effectson variation in carbon isotopediscrimination and water-use efficiency
Genotypic variations in water-use efficiency and carbon iso-tope discrimination (∆) have been reported in rice (Dingkuhnet al 1991). Also, varietal differences in stomatal responseto decreasing leaf water potentials have been indicated(Dingkuhn et al 1989). However, information on the link-age among water-use efficiency, stomatal response, and bio-mass productivity under various water regimes has beenlimited, but it is needed to clarify the value of ∆ for use as an
��'��������#���##
������������#���##
��'���6�(����#���##
�������6�(����#���##
! - . � �
, ���'��������������3�����$�
$!�'�!$��'�-$.�'�.$��'��$��'�
Fig 3. Water extraction from soil layers under mild water stress
and severe water stress in rice and maize.
Fig. 4. Different types of sclerenchyma in terms of thickening of
cell wall in the outer cortical parenchyma and the number of
sclerenchymatous cell layers.

105
index for improvement of productivity in or adaptability towater-limited conditions. A field study was conducted (1)to assess the relative magnitude of environmental and ge-notypic variation in ∆ among rice genotypes and (2) to ana-lyze the relationship among ∆, gas exchange, stomatal be-havior, single-leaf transpiration efficiency, and biomass pro-duction, using 11 rice genotypes grown in three differentwater regimes—flooded soil, aerobic soil without stress, andaerobic soil with stress—at the IRRI experimental farm dur-ing the 1997 dry season (potential evaporation 939 mm).
The genotypic mean of ∆ in the whole plant variedfrom 19.9‰ in IR65598-112-2 to 21.7‰ in IR20. Japonicagenotypes tended to have a lower ∆. Water regime signifi-cantly affected ∆, with a higher ∆ under a higher water sup-ply. For total biomass, genotypic factors were more domi-nant for the variation in ∆ across water regimes with a smallergenotype × water interaction.
Genotypic and environmental variations in ∆ were ex-plained by the changes in Ci/Ca and were positively relatedto single-leaf transpiration efficiency. Lower Ci/Ca or ∆ mayresult from either lower stomatal conductance (gs) or greaternet photosynthetic rate (A). ∆ had a positive correlationwith gs across genotypes in general, which indicated thatgenotypic variation in Ci/Ca was mainly related to gs. Thetendency of a lower gs in japonica genotypes was consis-tent with other reports (Dighkuhn et al 1989). In aerobicsoil conditions, A seemed to be also related to the geno-typic variation in Ci/Ca and ∆ at late growth stages.
N application (90 kg ha–1) slightly but significantlylowered ∆ by 0.2‰ to 0.3‰ compared with no N with nosignificant N × water or N × genotype interaction. The lowerCi/Ca at higher N was mainly due to the higher A in floodedsoil, which was probably caused by higher Rubisco activ-ity. In aerobic soils, in contrast, the lower Ci/Ca was relatedto lower gs, possibly resulting from magnified water stresscaused by larger biomass production under aerobic soil con-ditions.
A consistent genotypic variation in ∆ across environ-ments and its linkage with transpiration efficiency suggestedthat ∆ will be useful for screening genotypes that differ inwater-use efficiency. On the other hand, the relationshipbetween ∆ and biomass productivity is more complex. Therewas a positive relationship between biomass and ∆ inflooded conditions, whereas no positive relationship be-tween biomass and ∆ was found in aerobic conditions. Arather negative relationship was found in aerobic condi-tions when one genotype was excluded. The associationbetween lower ∆ and lower biomass indicated the drawbackof higher water-use efficiency for productivity under favor-able water supply, possibly because of limited stomatal con-ductance. On the other hand, the absence of a positive rela-tionship between ∆ and biomass in aerobic soils signifiedthe possibility for the simultaneous improvement of water-use efficiency and productivity. Genotypes that exhibitedlow gs under flooded conditions tended to have low gs and/or high A under aerobic soils, resulting in the consistent
genotypic ranking of ∆ across water regimes. A was notrelated to gs at the flowering stage under aerobic soils, indi-cating that nonstomatal factors affected genotypic varia-tion in A in later growth stages under water-limited condi-tions. The factors affecting genotypic variations in A andCi/Ca, especially in later stages, should be further clarifiedunder water-limited conditions.
Future research
• Modeling on crop-growth-water-N will be necessary forthe quantitative evaluation of the beneficial effects ofimproved N management for stabilizing and increasingrice productivity.
• Genetic variation in adaptation to severe water stressshould be clarified, especially regarding water flow inthe soil-root-shoot system, to identify valuable plant traitsfor enhancing the capture of water.
• Considering the limits of genetic diversity of rice in theputative traits for drought tolerance, valuable root andshoot traits, such as osmotic adjustment and stomatalresponse, should be combined and accumulated in ge-netic resources.
References
Chang TT, Loresto GC, O’Toole JC, Armenta-Sato JL. 1982.Strategy and methodology of breeding rice for drought-proneareas. In: Drought resistance in crops with emphasis on rice.Los Baños (Philippines): International Rice Research Insti-tute. p 217-244.
Courtois B, Lafitte R. 1999. Improving rice for drought-proneupland environments. In: Ito O, O’Toole J, Hardy B, editors.Genetic improvement of rice for water-limited environments.Proceedings of the Workshop on Genetic Improvement ofRice for Water-Limited Environments, 1-3 December 1998,Los Baños, Philippines. Los Baños (Philippines): Interna-tional Rice Research Institute. p 35-56.
Dingkuhn M, Cruz RT, O’Toole JC, Dorffling K. 1989. Net pho-tosynthesis, water use efficiency, leaf water potential andleaf rolling as affected by water deficit in tropical uplandrice. Aust. J. Agric. Res. 40:1171-1181.
Dingkuhn M, Farquhar GD, De Datta SK, O’Toole JC. 1991.Discrimination of 13C among upland rices having differentwater use efficiency. Aust. J. Agric. Res. 42:1123-1131.
Feldman LJ. 1984. Regulation of root development. Annu. Rev.Plant Physiol. 35:223-242.
Fukai S, Inthapan P. 1988. Growth and yield of rice cultivarsunder sprinkler irrigation in south-eastern Queensland. 3.Water extraction and plant water relations—comparison withmaize and grain sorghum. Aust. J. Exp. Agric. 28:249-252.
Hasegawa S, Yoshida S. 1982. Water uptake by dryland rice rootsystem during soil drying cycle. Soil Sci. Plant Nutri. 28:191-204
Kawata S, Maruyama, Soejima M. 1977. Root formation in riceplant and levels of nitrogen supply. Jpn. J. Crop Sci. 46:193-198. (In Japanese with English summary.)

106
Kondo M, Aragones DV, Pablico PP, Murty MVR, Okada K,Abe J, Morita S. 1998 Approaches in plant-soil interaction toimprove upland rice production. In: Proceedings of the Inter-national Symposium on World Food Security and Crop Pro-duction Technologies for Tomorrow. p 221-224.
Kondo M, Murty MVR, Aragones DV, Okada K, Kwak KS.1999a. Characteristics of the root system and water uptakein upland rice. In: Ito O, O’Toole J, Hardy B, editors. Ge-netic improvement of rice for water-limited environments.Los Baños (Philippines): International Rice Research Insti-tute. p 117-131.
Kondo M, Shrestha RK, Aragones DV, Ladha JK. 1999b. Effectof indigo and maize as nitrogen catch crops on root growthand nitrogen use in rice in rainfed lowland ecosystems innorthern Philippines. Jpn. J. Trop. Agric. 44:12-19.
Kondo M, Murty MVR, Aragones DV. 2000a. Characteristics ofroot growth and water uptake from soil in upland rice andmaize under water stress. Soil Sci. Plant Nutri. 46:721-732.
Kondo M, Aguilar A, Abe J, Morita S. 2000b. Anatomy of nodalroots in tropical upland and lowland rice varieties. Plant Prod.Sci. 3:437-445.
Kondo M, Abe J, Morita S, Courtois B. 2001a. Improvement ofupland rice production through particular attention to rootsystem development. Proceedings of the 6th Symposium ofthe International Society of Root Research. p 160-161.
Kondo M, Courtois B, Aguilar A, Abe J, Morita S. 2001b. Mor-phology of root system as affected by N supply conditionsand QTL analysis in a double-haploid rice population. Jpn. J.Crop Sci. 70(Extra issue)2:229-230.
Kondo M, Murty MVR, Agsibit R, Reoma V, Singh S, ChaitepW. 2002a. Evaluation of nutrient and water stress on yieldand nitrogen use efficiency in upland rice in Fang in Thai-land and Hazaribag in India. Jpn. J. Trop. Agric. 46(Extraissue)1:13-14.
Kondo M, Pablico PP, Aragones DV, Agbisit R. 2002b. Effect ofgenotype, soil water, and N on the variation in 13C discrimi-nation in tropical rice varieties. Jpn. J. Crop Sci. 71(Extraissue)2:164-165.
Levitt J. 1980. Water stress. In: Kozlowski TT, editor. Responseof plants to environmental stresses. II. Water, radiation, salt,and other stresses. New York City (USA): Academic Press.
Lilley JM, Fukai S. 1994. Effect of timing and severity of waterdeficit on four diverse rice cultivars. I. Rooting patterns andsoil water extraction. Field Crops Res. 37:205-214.
Murty MVR, Kondo M. 2001. Upland: a simulation model forwater balance in upland soils. Technical Bulletin No. 7. LosBaños (Philippines): International Rice Research Institute.42 p.
Okada K, Kondo M, Ando H, Kakuda K. 2002. Water uptakeunder water stress at panicle initiation stage in upland rice asaffected by previous soil water regimes. Soil Sci. Plant Nutri.48:151-158.
Richards RA, Passioura JB. 1981. Seminal root morphology andwater use of wheat. I. Environmental effects. Crop Sci.21:249-252.
Shrestha RK. 1997. Nitrogen conservation and recycling, andcarbon management for sustainability of intensive rice-basedcropping system. PhD thesis. University of the PhilippinesLos Baños, Los Baños, Philippines.
Widawsky DA, O’Toole JC. 1996. Prioritizing the rice researchagenda for eastern India. In: Evenson RE, Herdt RW, HossainM, editors. Rice research in Asia: progress and priorities.Wallingford (UK): CAB International. p 109-130.
Winn T. 1999. Nitrogen and phosphorus fertilizer managementand the dynamics of root architecture of upland rice (Oryzasativa L.). PhD thesis. University of the Philippines LosBaños, Los Baños, Philippines.
Yadav R, Courtois B, Huang N, McLaren G. 1997. Mappinggenes controlling root morphology and root distribution in adouble-haploid population of rice. Theor. Appl. Genet.94:619-632.
Yambao EB, Ingram KT, Real JG. 1992. Root xylem influenceon the water relations and drought resistance of rice. J. Exp.Bot. 43:925-932.
Yoshida S. 1975. Factors that limit the growth and yield of uplandrice. In: Major research in upland rice. Los Baños (Philip-pines): International Rice Research Institute. p 46-71.
Yoshida S, Hasegawa S. 1982. The rice root system: its develop-ment and function. In: Drought resistance in crops with em-phasis on rice. Manila (Philippines): International Rice Re-search Institute. p 97-114.
Notes
Acknowledgments: We greatly appreciate the Government ofJapan, IRRI, and JIRCAS for their consistent support to con-duct this project. The Upland Rice Research Consortium(URRC) and IRRI-Japan Shuttle Research Project also sup-ported the project.

107
The relationship between characteristics of rice roots and nitrogen-use efficiency of basal and
topdressed N was examined under the flooded soil system. Treatments in this study consisted of the
control (IR72 with 25 hills m–2, CTR), high hill density (IR72 with 50 hills m–2, HHD), and new plant
type (IR68544-29-2-1-3-1-2 with 25 hills m–2, NPT). Fertilizer-N recovery efficiency was investigated
for basal N and topdressed N applied at midtillering (MT) and panicle initiation (PI) by using 15N-
labeled urea. The cultivar used in the NPT had a longer growth duration and vegetative phase than
IR72. Shoot dry weight and total N in plants at PI were the highest in the NPT among the treatments.
However, in the NPT, the recovery rate of basal N was the lowest among the treatments though no
difference in recovery rate of topdressed N was observed. In the HHD, the recovery rate of basal and
topdressed N was comparable with the CTR. Root dry weight density in the plow layer was higher in
the HHD and NPT than in the CTR. The average uptake rate (AUR) of basal N per unit root dry weight
was comparable between the HDD and CTR, and the AUR of basal N in the NPT was one-third of that
in the CTR. Results obtained in this experiment suggest that N recovery efficiency of basal N can be
improved by increasing N absorption ability in roots, though the environmental factors associated
with N-loss mechanisms in the flooded soil system are more important for the recovery efficiency of
topdressed N than morphological and physiological characteristics of rice roots.
Nitrogen-use efficiency as affected by culturaland varietal differences under flooded soil conditionsK. Kakuda and T. Nozoe
The rice plant must absorb a high amount of nitrogen (N) toobtain high yield. Assuming a target yield to be 10 t ha–1,biomass production of rice must be 20 t ha–1 unless theharvest index declines. Therefore, a higher amount of ab-sorbed N (ranging from 200 to 300 kg ha–1) might be re-quired to obtain the target yield. Since mineralized N fromthe soil is not sufficient to meet the demand under normalcropping conditions, application of fertilizer nitrogen isrequired. In the flooded soil system, however, the recoveryrate of fertilizer N is 20–40% for basal N (Savant and DeDatta 1980) and 40–70% for topdressed N (Craswell andVelk 1979, Savant and De Datta 1982). Losses of fertilizerN from the flooded soil system are mainly caused by deni-trification and NH
3 volatilization (Keeney and Sahrawat
1986). One of the by-products in the denitrification reac-tion is nitrous oxide, which is considered to affect globalwarming (Mosier 1994). It is important to improve the re-covery rate of fertilizer N to both increase economic effi-ciency and control global warming. In previous reports, itwas observed that some methods of fertilizer applicationwere effective for increasing the recovery rate of fertilizer Nunder flooded conditions, such as split applications (Norman
et al 1992, Peng and Cassman 1998), deep placement (Sa-vant and De Datta 1980, Eriksen et al 1985), chemical appli-cation for suppressing nitrification (Minami 1994, Saad etal 1996), and the use of urea granules (Wilson et al 1994) orslow-release fertilizer (Kamekawa et al 1990, Wada et al1991). However, these methods require additional labor costand other expenses so that they may restrict the extension ofthese methods to farmers.
The new plant type (NPT) has been bred as a high-yield-ing variety at IRRI since the end of the 20th century. TheNPT lines have short stature; a sturdy stem; dark green, thick,and erect leaves; reduced tillering; large panicles; and avigorous root system (IRRI 1995). The bigger and deeperroot system in upland crops has an advantage for water andN uptake (Garwood and Williams 1967, Fukai and Cooper1995). Therefore, it is expected that cultivars with a vigor-ous root system have the ability to improve the recoveryrate of fertilizer N under flooded conditions without anyadditional expenses. However, information is limited onapplied N absorption associated with root characteristicsunder the flooded soil system. The objective of this study isto clarify the relationship between morphological and physi-

108
ological traits of rice roots and the nitrogen-use efficiencyof basal and topdressed N under the flooded soil systemusing an NPT line.
Materials and methods
A field experiment was conducted at the International RiceResearch Institute (IRRI) farm, Los Baños, Laguna, in thedry season (DS, January-May) in 2002. The soil at IRRI wasan Andaqueptic Haplaquoll with pH 6.1.
A semidwarf indica cultivar, IR72, and NPT breedingline that was established as a high-yielding variety (HYV)at IRRI, IR68544-29-2-1-3-1-2, were used in this experi-ment. Treatments in this study consisted of two rice culti-vars and two hill spacings, the control (IR72 with 25 hillsm–2, CTR), the treatment of high hill density (IR72 with 50hills m–2, HHD), and the treatment of new plant type(IR68544-29-2-1-3-1-2 with 25 hills m–2, NPT), as shown inTable 1. Fourteen-day-old seedlings were transplanted withtwo seedlings per hill on 29 January 2002. Hill spacing was20 by 20 cm and 10 by 20 cm, equivalent to 25 and 50 hillsm–2, respectively. Nitrogen (40 kg ha–1 as urea), phosphorus(60 kg ha–1 as single superphosphate), and potassium (60 kgha–1 as KCl) were incorporated to a depth of 15 cm 3 daysbefore transplanting. The experimental field was floodedjust after transplanting and the conditions were maintainedthroughout the experimental period. Pest and disease con-trol were used as necessary. The experiment was carried out
in a randomized complete block design with four replica-tions.
Fertilizer-N recovery efficiency was investigated forbasal N and topdressed N by using 15N-labeled urea. Threemicroplots (0.8 × 0.4 m) were established in each main plot(9 × 8 m) prior to the growing season for the evaluation offertilizer-N recovery efficiency for basal N. To reduce lat-eral flow and dilution of the applied fertilizer N, woodenbarriers with a depth of 30 cm were set up for each microplot.Enriched urea fertilizer (3.06% 15N-atom excess) was uni-formly incorporated into the microplots with a depth of 15cm at 40 kg N ha–1 prior to transplanting. All plants insidethe microplot (8 or 16 hills) were collected from each plot atmidtillering (MT), panicle initiation (PI), and flowering (FL)for the evaluation of the fertilizer-N recovery efficiency forbasal N. Topdressed N was applied at the MT and PI stages.Two quadrate boxes with no bottom (0.2 × 0.2 m) wereplaced on the hill (or hills) having an average number ofstems 1 week before MT and PI in each main plot. The en-riched urea fertilizer mentioned above dissolved with waterwas topdressed in the quadrate box at 40 kg N ha–1 at MTand PI. Plants inside the quadrate box were collected twotimes after the topdressing to evaluate the fertilizer-N re-covery efficiency of topdressed N. The dates of topdressingand plant collection were different among the treatments(Table 2) since the two cultivars used in this experimentdiffered in growth duration.
Table 2. Timetable of N application and plant collection for the evaluation of nitrogen-use efficiency.
Plant collection
Cultivar and 15N
fertilizer application 1st 2nd 3rd
(days after transplanting)a
IR72
Basal N 0 23 (23) 44 (44) 72 (72)
Topdressed at MTb 23 44 (21) 72 (49) –
Topdressed at PI 44 51 (7) 72 (18) –
IR68544-29-2-1-3-1-2
Basal N 0 23 (23) 56 (56) 86 (86)
Topdressed at MT 23 56 (33) 86 (63) –
Topdressed at PI 56 63 (7) 86 (20) –
aNumbers in parentheses represent the duration from 15N application to plant collection. bMT = midtillering, PI = panicle initiation.
Table 1. Rice cultivars and plant hill density in three treatments.
TreatmentCultivar Plant hill density
(breeding line) (hills m–2)
Control IR72 25
HHDa IR72 50
NPTb IR68544-29-2-1-3-1-2 25
aHHD = high hill density. bNPT = new plant type.

109
Four hills having an average number of tillers were col-lected from each main plot for the evaluation of total N inplants. Two soil blocks including rice roots with a depth of15 cm were collected by using a quadrate core with no bot-tom (20 × 20 × 15 cm) 23, 44, 58, 72, and 86 days aftertransplanting (DAT). The soil blocks were divided into twosoil layers (depth of 0–7.5 and 7.5–15 cm) and roots insidethe soil blocks were washed with tap water. Dry weight ofshoots and roots was measured after oven-drying at 70 ºC.Shoots were digested in sulfuric acid and total N was deter-mined by the indo-phenol method (Scheiner 1976). Atom% of 15N in plants was determined by mass spectrometry.
Results and discussion
Growth duration and timing of topdressed N
No difference in the date of FL was observed between thecontrol (CTR) and the treatment of high hill density (HHD)since IR72 was used in both treatments. However, IR68544-29-2-1-3-1-2 used in the NPT treatment had a 2-week delayin FL vis-à-vis IR72 (Figs. 1, 2, 3, and 5). This means thatthe cultivar used in the NPT had a longer growth durationand vegetative phase than IR72. The timing of N topdressingfor the reproductive phase is commonly decided by physi-ological plant growth stages. In this experiment, N wastopdressed at MT and PI. For topdressing at MT, N wasapplied at the same time (23 DAT) in all the treatments.However, N at PI was topdressed at 44 DAT in the CTR andHHD, and at 58 DAT in the NPT owing to the differentgrowth duration in the two cultivars used in this experi-ment.
Physiological conditions of plants during the
period of applied N absorption
Different hill densities and cultivars affected the number oftillers per unit area (Fig. 1). The number of tillers was thehighest in the HHD and lowest in the NPT throughout the
experimental period. At FL, the number of tillers was about25% higher in the HHD and about 50% lower in the NPTthan in the CTR. This result shows that the cultivar used inthe NPT had low tillering ability, which is a typical charac-teristic in NPT lines.
There was no big difference in shoot dry weight amongthe treatments throughout the experimental period (Fig. 2).The shoot dry weight in the HHD was slightly higher thanthat in the CTR. No significant difference in shoot dry weightbetween the CTR and NPT was observed after 44 DAT. How-ever, shoot dry weight at PI was the highest in the NPT
�����
���
���
���
�
�
�
�
��
�
���
� �� �� �� �� ��� ���������������������������
�� !���"���������� #�
��
� �� �� �� �� ��� ���������������������������
�����
�����
�����
���
���
�
$%""��&���'���%��(�� #�)
��
�
���
��
�
���
�
�
� �� �� �� �� ��� ���������������������������
�*
��
�*
��
*
�
�"����������������( �� #�)
Fig. 1. Tiller number as affected by different varieties and hill
densities. CTR = control, IR72 with 25 hills m–2; HHD = high hill
density, IR72 with 50 hills m–2; NPT = new plant type, IR68544-29-
2-1-3-1-2 with 25 hills m–2. Letters P and F indicate panicle initiation
and flowering. Bars represent standard error of the mean and are
smaller than the data points in some cases.
Fig. 2. Shoot dry weight as affected by different varieties and hill
densities. CTR = control, IR72 with 25 hills m–2; HHD = high hill
density, IR72 with 50 hills m–2; NPT = new plant type, IR68544-29-
2-1-3-1-2 with 25 hills m–2. Letters P and F indicate panicle initiation
and flowering. Bars represent standard error of the mean and are
smaller than the data points in some cases.
Fig. 3. Amounts of nitrogen in plants as affected by different
varieties and hill densities. CTR = control, IR72 with 25 hills m–2;
HHD = high hill density, IR72 with 50 hills m–2; NPT = new plant
type, IR68544-29-2-1-3-1-2 with 25 hills m–2. Letters P and F indicate
panicle initiation and flowering. Bars represent standard error of
the mean and are smaller than the data points in some cases.

110
among the treatments (Fig. 2 and Table 3). The period fromMT to PI was 21 days in the CTR and HHD, and 35 days inthe NPT. Crop growth rate (CGR) during this period was8.0, 10.2, and 9.5 g m–2 d–1 in the CTR, HHD, and NPT,respectively. The high level of dry matter accumulation atPI was attributed to the high CGR in the HHD. The high hilldensity and use of rice plants having longer growth dura-tion can be effective for obtaining a larger biomassaboveground at PI. At MT, however, the NPT had the lowestshoot dry weight among the treatments (Table 3). The dura-tion from transplanting to MT was 23 days in all the treat-ments. The low shoot dry weight of the NPT at MT could beattributed to the trait of low tillering ability of the cultivarused in the NPT.
No big difference in total N in plants was observedamong the treatments throughout this experimental period(Fig. 3). There was no significant difference in the total N inplants between the HHD and CTR after 44 DAT. The NPThad a slightly larger amount of total N in plants than theCTR after 65 DAT. At the same growth stage, however, sig-nificant differences in total N in plants were observed amongthe treatments (Fig. 3 and Table 3). At MT, the total N inplants was the highest in the HHD and lowest in the NPT.The increasing order of total N in plants was reflected by theincrease in shoot dry weight at MT. However, at PI, theamount of N in plants was the highest in the NPT and com-parable between the CTR and HHD. The total N in plantswas not reflected by the shoot dry weight at PI and MT. Therate of N absorption by plants during MT to PI was 0.34,0.27, and 0.34 g m–2 d–1 in the CTR, HHD, and NPT, respec-tively. Since the rate of N absorption in the HHD was lowerthan that in the CTR during MT to PI, the HHD did notsurpass the CTR in the total N at PI. Although the rate of Nabsorption in the NPT was comparable with that in the CTR,the longer vegetative phase of the cultivar used in the NPTreflected the larger amount of N in plants at PI.
Fertilizer-N recovery efficiency of basal
and topdressed N
Fertilizer-N recovery efficiency of basal N was evaluated atMT, PI, and FL in this experiment (Fig. 4A). In all the treat-ments, the recovery rate of basal N did not increase from PIto FL. This result indicates that the plants finished absorb-ing basal N before PI. At MT, the recovery rate of basal Nwas the highest in the HHD and lowest in the NPT amongthe treatments. No difference in the recovery rate of basal Nbetween the CTR and HHD was observed at PI and FL. Inthe NPT, the recovery rate of basal N at PI and FL was thelowest among the treatments though the NPT indicated thelargest shoot dry weight and total N in plants at PI and FL.These results suggest that the increase in biomass accumu-lation above the current level and adoption of cultivars hav-ing a longer growth duration have no effect on fertilizer-Nrecovery efficiency of basal N.
Fertilizer-N recovery efficiency of N topdressed at MTwas evaluated at PI and FL (Fig. 4B). In all the treatments,the recovery rate of N applied at MT did not increase after PIand ranged from 23% to 35% at FL. The HHD and NPT hadno difference in the recovery rate of N applied at MT withthe control at FL. Fertilizer-N recovery efficiency oftopdressed N applied at PI was evaluated 1 week after thetopdressing (PI + 1 wk) and at FL (Fig. 4C). In all the treat-ments, the recovery rate of N applied at PI did not increaseafter PI + 1 wk and ranged from 45% to 48% among thetreatments at FL. The HHD and NPT had no difference in therecovery rate of N applied at PI with the control at bothstages. These results indicate that the N uptake rate of plantsbecame higher with plant growth, and rapid N absorptiongave a higher recovery of applied N. Low N absorption abil-ity of plants in the early growth stage causes low fertilizer-N recovery and increases the potential for fertilizer-N losses(Peng and Cassman 1998). The recovery rate of basal N washigher than that of N topdressed at MT. In this experiment,
Table 3. Physiological conditions of rice plants at N topdressing.
Treatments
Item
Controla HHDb NPTc
Topdressing at MTd
Number of tillers (m–2) 301 ± 21f 571 ± 37 126 ± 8
Shoot dry weight (g m–2) 26.9 ± 0.7 59.9 ± 2.7 21.0 ± 0.3
Amount of N in plant (g m–2) 0.90 ± 0.03 2.03 ± 0.12 0.68 ± 0.03
Topdressing at PIe
Number of tillers (m–2) 784 ± 32 915 ± 59 316 ± 20
Shoot dry weight (g m–2) 367 ± 12.7 423 ± 5.3 613 ± 35
Amount of N in plant (g m–2) 8.01 ± 0.38 7.61 ± 0.09 11.76 ± 1.56
aIR72 with 25 hills m–2. bIR72 with 50 hills m–2. cIR68544-29-2-1-3-1-2 with 25 hills m–2. dMT = midtillering. ePI = panicle initiation.fStandard error of the mean.

111
the pH of irrigated water was above 8 at MT and PI. A highpH in flooded water (above 8) favors N loss by volatiliza-tion (Mikkelsen et al 1978). Therefore, the low N absorp-tion ability of plants and high pH in flooded water mighthave made the recovery of N applied at MT low in thisexperiment.
No difference in the recovery rate of topdressed N be-tween the HHD and the CTR was observed at MT and PI,though the HHD had a larger biomass than the CTR at MTand PI. In addition, the NPT had no difference in the recov-ery rate of N topdressed at MT and PI with the control, thoughthe NPT had a larger shoot dry weight than the CTR at PI.These results suggest that dry matter accumulation in shootsand the adoption of cultivars having a longer growth dura-tion had no effect on increasing the fertilizer-N use effi-ciency of topdressed N.
Root dry weight density and ability of N absorption
A deep and wide root system in upland crops is beneficialfor N uptake because the low water potential of surface soilrestricts water and N uptake under dry conditions (Garwoodand Williams 1967). In paddy soil, however, submergedconditions are maintained throughout the growing seasonexcept for the period of midseason drainage. In addition,ammonium N, which is the dominant form of inorganic Nunder anaerobic conditions, has a lower diffusion coeffi-cient than nitrate N (Reddy et al 1980). Therefore, the amountof N lost by leaching is negligible under the flooded soilsystem (Buresh and Austin 1988). These facts suggest thatflooded rice does not necessarily have a deep and wide rootsystem to absorb applied N efficiently.
In this experiment, root dry weight density was investi-gated in the plow layer of 0–7.5- and 7.5–15-cm depth (Fig.5). In the soil layer of 0–7.5 cm, root dry weight densityranged from 400 to 800 mg cm–3 (Fig. 5A). The NPT had a
larger root dry weight density than the CTR in the soil layer.No difference in root dry weight density between the CTRand HHD was observed in the soil layer. In the layer of 7.5–15 cm, root dry weight density ranged from 130 to 370 mgcm–3 (Fig. 5B). The HHD and NPT had a higher root dryweight density than the CTR in the soil layer.
Since the basal N was incorporated into the plow layerbefore transplanting in this experiment, all roots in the plowlayer of 0–15 cm would absorb basal N. On the premise thatroot dry weight increased linearly with time from transplant-ing to PI, the average uptake rate (AUR) of basal N per unitroot dry weight during the period of basal N absorption canbe estimated by the following equation:
AUR (mg N g–1 d–1) = Nb/[(R1 + R2) × Dp] × ½ (1)
where Nb is the amount of plant N derived from basal N at PI(mg m–2), R1 and R2 are the root dry weight in the soil depthof 0–7.5 cm and 7.5–15 cm at PI (g m–2), and Dp is days aftertransplanting at PI (d). Topdressed N is hard to diffuse fromsurface to subsurface soil under submerged conditions(Kakuda and Ando 1998). This fact suggests that the rootscontributing to the absorption of topdressed N existed onlyin the surface soil. On the premise that root dry weight in-creased linearly with time from MT to PI, the AUR of Ntopdressed at MT during the period of the topdressed Nabsorption can be estimated by the following equation:
AUR (mg N g–1 d–1) = Ntm/[(R1 + R1′) (2) × (Dp – Dm)] × ½
where Ntm is the amount of plant N derived from Ntopdressed at PI (mg m–2), R1′ is the root dry weight in thesoil depth of 0–7.5 cm at MT (g m–2), and Dm is days aftertransplanting at MT (d). Since the plants finished absorbing
+� �, - �, - �,�.���'/ -��������"'�%������
����"���#��������0���0��(1)��
*�
��
��
��
��
�
�� ����
2 3
Fig. 4. Nitrogen-use efficiency of basal and topdressed N at different
plant growth stages. A = basal N; B = topdressed N applied at midtillering;
C = topdressed N applied at panicle initiation. CTR = control, IR72 with
25 hills m–2; HHD = high hill density, IR72 with 50 hills m–2; NPT = new
plant type, IR68544-29-2-1-3-1-2 with 25 hills m–2. PI + 1 wk = 1 week
after N topdressed at PI. Bars represent standard error of the mean.

112
N applied at PI for 1 week following the N application, thechange in root dry weight would be negligible during theperiod. Therefore, the AUR of N topdressed at PI can beestimated by the following equation:
AUR (mg N g–1 d–1) = Ntp/(R1 × 7) (3)
where Ntp is the amount of plant N derived from thetopdressed N 1 week after the topdressing.
Table 4 shows the average uptake rate of fertilizer Ncalculated by equations 1, 2, and 3. In the basal-N absorp-tion, the AUR in the HHD was comparable with that in theCTR, and the AUR in the NPT was one-third of that in theCTR. Since the recovery rate of basal N increased with anincrease in AUR (Figs. 4 and 5A), N uptake ability per unitroot dry weight would play an important role in the recov-ery of basal N. We suspect that the improvement of N up-take ability in roots is more effective for improving the re-covery of basal N than increasing root dry weight in theplow layer and could become possible by adopting culti-vars having a higher N uptake ability. In the absorption of Ntopdressed at MT and PI, the AUR was the highest in theHHD and lowest in the NPT. There was no relation betweenthe AUR and recovery rate of topdressed N. These facts in-dicate that the increase in N uptake ability of roots had noeffect on the recovery of topdressed N.
The results obtained in this experiment suggest thatthe environmental factors associated with N-loss mecha-nisms in the flooded soil system are more important for therecovery efficiency of topdressed N than the morphologicaland physiological characteristics of rice roots. However, inthe case of basal N, N recovery efficiency can be improvedby increasing the N absorption ability in roots. Genetic se-
lection for high yield potential often takes place with ahigh fertilizer-N input. However, high-N input conditionscan mask efficiency differences among genotypes (Kamprathet al 1982). Information on physiological and morphologi-cal characteristics of rice roots involving N absorption un-der flooded soil conditions must be accumulated to make itpossible to breed cultivars that can achieve high yield un-der low inputs.
References
Buresh RJ, Austin ER. 1988. Direct measurement of dinitrogenand nitrous oxide flux in flooded rice fields. Soil Sci. Soc.Am. J. 52:681-688.
Craswell ET, Velk PLG. 1979. Greenhouse evaluation of nitro-gen fertilizers for rice. Soil Sci. Soc. Am. J. 43:1184-1188.
Eriksen AB, Kjeldby M, Nilsen S. 1985. The effect of intermit-tent flooding on the growth and yield of wetland rice andnitrogen-loss mechanism with surface-applied and deep-placed urea. Plant Soil 84:381-401.
Fukai S, Cooper S. 1995. Development of drought-resistantcultivars using physiomorphological traits in rice. FieldCrops Res. 40:67-86.
Garwood EA, Williams TE. 1967. Growth, water use and nutri-ent uptake from the subsoil by grass sward. J. Agric. Sci.69:125-130.
IRRI (International Rice Research Institute). 1995. Raising theyield plateau. In: Rockwood W, editor. Program report for1995. Manila (Philippines): IRRI. p 4-20.
Kakuda K, Ando H. 1998. Absorption of topdressed nitrogen byrice plant through mass flow under different relative hu-midities. Soil Sci. Plant Nutr. 44:115-123.
Kamekawa K, Nagai T, Sekiya S, Yoneyama T. 1990. Nitro-gen uptake by paddy rice from 15N labelled coated ureaand ammonium sulfate. Soil Sci. Plant Nutr. 36:333-336.
�����
���
���
���
���
�� �� �� �� �� ���
������������������������
��
�
���
�
�
�""��&���'���%��&�������(���0 4�)
�
�
� �� �� �� �� ���
2 3
Fig. 5. Root dry weight density in different soil layers as affected by different varieties
and hill densities. A = soil depth of 0–7.5 cm; B = soil depth of 7.5–15 cm. Letters P
and F indicate panicle initiation and flowering. Bars represent standard error of the
mean.

113
Kamprath EJ, Moll RH, Rodriguez N. 1982. Effect of nitrogenfertilization and recurrent selection on performance ofhybrid population of corn. Agron. J. 74:955-958.
Keeney DR, Sahrawat KL. 1986. Nitrogen transformations inflooded rice soils. Fert. Res. 9:15-38.
Minami K. 1994. Effect of nitrification inhibitors and slow-re-lease fertilizer on emission of nitrous oxide from fertilizedsoils. In: Minami K, Arvin M, Sass R, editors. CH4 andN2O, global emissions and controls from rice fields andother agricultural and industrial sources. Tsukuba (Japan):Yokendo. p 187-196.
Mikkelsen DS, De Datta SK, Obcemea WN. 1978. Ammoniavolatilization losses from flooded rice soils. Soil Sci. Soc.Am. J. 42:725-730.
Mosier AR. 1994. Nitrous oxide summary. In: Minami K, ArvinM, Sass R, editors. CH4 and N2O, global emissions andcontrols from rice fields and other agricultural and indus-trial sources. Tsukuba (Japan): Yokendo. p 135-140.
Norman RJ, Guindo D, Wells BR, Wilson Jr. CE. 1992. Sea-sonal accumulation and partitioning of nitrogen-15 in rice.Soil Sci. Soc. Am. J. 56:1521-1527.
Peng S, Cassman KG. 1998. Upper threshholds of nitrogen up-take rates and associated nitrogen fertilizer efficiencies inirrigated rice. Agron. J. 90:178-185.
Reddy KR, Patrick Jr. WH, Phillips RE. 1980. Evaluation ofselected processes controlling nitrogen loss in a floodedsoil. Soil Sci. Soc. Am. J. 44:1241-1246.
Saad OALO, Lehmann S, Conrad R. 1996. Influence of thio-sulfate on nitrification, denitrification, and production ofnitric oxide and nitrous oxide in soil. Biol. Fertil. Soils21:152-159.
Savant NK, De Datta SK. 1980. Movement and distribution ofammonium-N following deep placement of urea in a wet-land rice soil. Soil Sci. Soc. Am. J. 44:559-565.
Savant NK, De Datta SK. 1982. Nitrogen transformations inwetland rice soils. Adv. Agron. 35:241-302.
Scheiner D. 1976. Determination of ammonia and Kjeldahlnitrogen by indophenol method. Water Res. 10:31-36.
Wada G, Aragones RC, Ando H. 1991. Effect of slow-releasefertilizer (Meister) on the nitrogen uptake and yield of therice plant in the tropics. Jpn. J. Crop Sci. 60:101-106.
Wilson Jr. CE, Wells BR, Norman RJ. 1994. Fertilizer nitrogenuptake by rice from urea-ammonium nitrate solution vs.granular urea. Soil Sci. Soc. Am. J. 58:1825-1828.
Notes
Authors’ addresses: K. Kakuda, Faculty of Agriculture,Yamagata University, Tsuruoka 997-8555, Japan; T.Nozoe, Crop, Soil, and Water Sciences Division, Interna-tional Rice Research Institute, DAPO Box 7777, MetroManila, Philippines.


115
In a long-term rice cultivation experiment at the International Rice Research Institute (IRRI), water
drainage in the field during the fallow season suppressed the growth of paddy rice, especially during
the early stage of subsequent cultivation. This symptom became more prominent when no rice straw
was applied, and when the amount of fertilizer applied was small. This growth suppression, which
was observed in both the wet and dry seasons, was reduced by the application of a mixture of
nitrogen, phosphorus, and potassium fertilizers. The amount of phosphorus in the growth-suppressed
rice was smaller than that in rice without growth suppression. The findings suggest that one of the
factors that suppresses rice growth is phosphorus deficiency. Growth suppression was associated
with high soil pH and/or low Fe(II) content in the problem soil. The low Fe(II) content of the soil was
attributed to the high soil pH because there was negative correlation between soil pH and Fe(II)
content. Water drainage during fallow decreased the amount of Fe(II) in the soil because Fe(II) was
oxidized to Fe(III) under oxidative conditions. During the subsequent cultivation season, this low
Fe(II) content in the soil kept the soil pH high. The application of rice straw improved rice growth
because of the decrease in soil pH. The production of CO2, which was generated as the terminal
product of straw decomposition, presumably decreased the pH. The phosphorus deficiency of growth-
inhibited rice was associated with a small amount of available phosphorus because of the high soil
pH and/or low Fe(II) content in the soil.
Inhibition of rice growth in the fieldby water drainage in fallowT. Nozoe
The intensive rice ecosystem, producing two to three cropsof rice per year, is an important agricultural production sys-tem for improving rice yield in the tropics. Especially intropical Asia, irrigated lowland rice is the most importantagricultural ecosystem because yields are higher on irri-gated land than on rainfed and upland land. Soil submer-gence leads to unique biogeochemical processes, whichgovern the management of soil, water, and agricultural in-puts and further influence ecosystem sustainability and en-vironmental processes, such as carbon storage, nutrient cy-cling, and water quality. One of the characteristics of irri-gated rice cultivation is the difference in oxidation-reduc-tion status between fallow and cultivation periods. Whenthe fallow period is rainy, there are only short stages in thefield with the intensive rice-cropping system.
In the double-crop system in the tropics, there are twofallow seasons between cultivation in the wet season (WS)and dry season (DS). Each fallow season is around 2 to 3months. It can be estimated that the water conditions dur-ing the fallow seasons of the WS (mainly October and No-vember) and DS (mainly April and May) are different. After
the harvest, the field is generally plowed or left withoutintroduction of water. Therefore, only weather conditionsaffect the oxidation-reduction status of the soil. Soil dryingduring the fallow season usually has beneficial effects onthe following rice crop. Soil drying avoids excessive reduc-tion of soil and that increases available soil nitrogen (N) bythe air-drying effect on ammonification (Reichardt et al2000). Applying rice straw in the soil increases the uptakeof nutrient components by rice, which increases the amountof organic acids in the soil. The organic acids are toxins forrice growth (Tanaka et al 1990). Therefore, it is recommendedthat rice straw be decomposed in the previous fallow seasonunder oxidative conditions that can be obtained with soildrying (Olk et al 2000). It is generally accepted that soilmanagement to maintain oxidative status is preferable forrice cultivation. However, little research has been done onwater management and rainfall in the fallow season withregard to the following rice crop. In this study, water drain-age in the fallow season inhibited rice growth. In this report,first, the mechanisms of the inhibition were analyzed and,subsequently, the methods to improve this inhibition with

116
water, organic material, and fertilizer management were in-vestigated.
Materials and methods
IRRI has conducted a long-term experiment since 1972. Inthis field (field name: L2), the same water, organic material,and fertilizer management has been continued in each plotsince the beginning of this experiment. For the current ex-periment, shoots and soil were sampled periodically in boththe wet and dry season of 2001 and 2002. For all experi-ments of the 2001 wet season (WS), 2001 dry season (DS),2002 WS, and 2002 DS, pregerminated seeds of IR72 weresown on seedling trays to produce uniform seedlings. Four-teen-day-old seedlings were transplanted on 11 Jan 2001,26 Jun 2001, 8 Jan 2002, and 27 Jun 2002 as 2001 DS, 2001WS, 2002 DS, and 2002 WS cultivation, respectively. Spac-ing was at 20 × 20 cm with four seedlings per hill. Cultiva-tion periods in the 2001 DS, 2001 WS, 2002 DS, and 2002WS were 96, 91, 93, and 90 days, respectively. The mid-tillering stage was at 20 days after transplanting (DAT) irre-spective of season and amount of fertilizer. Panicle initia-tion (PI) stage in the F1 plot was at 44–46 DAT irrespectiveof season. This stage was 4 or 5 days earlier than that in theF0 plot. Flowering stage in the F1 plot was at 72–76 DATirrespective of season. This stage was 4 or 5 days earlierthan in the F0 plot. Groundwater was introduced to the fieldas irrigation water.
Eight plots (two for water management in fallow sea-son × two for management of organic material × two forfertilizer management) were laid out in a randomized com-plete block design with four replications. The size of eachplot was 5 × 6.5 m2. In the main plot of W0, irrigation waterwas not introduced to the field, whereas, in the W1 plot, thefield was flooded throughout the fallow season. To analyzethe effect of the application of organic materials, two plotswere set up as subplots. In S0, all rice straw was removedfrom the field after harvesting of the previous crop. In S1,the straw was spread on the field and incorporated into thesoil 1 month before transplanting. The average amount of
rice straw in the soil was approximately 150% of the grainyield. To analyze the effect of the amount of fertilizer, twoplots were set up as sub-subplots. In F0, 50 kg ha–1 of nitro-gen (N) was applied irrespective of season. Neither phos-phorus (P) nor potassium (K) was applied. In F1, 150, 30,and 40 kg ha-1 of N, P
2O
5, and K
2O were applied in the DS.
Those components in the WS were 80, 20, and 30 kg ha–1,respectively. All fertilizer was applied with puddling.
Roots of collected plant samples were removed andshoot dry matter was weighed after drying. For the analysis,a part of the dried shoot was separated into leaf (leaf bladeand sheath), stem, and panicle, which were ground. Theamount of N, P, K, and zinc (Zn) in the plant samples ob-tained in the 2001 WS and 2002 DS was analyzed. Theamount of N was determined with the Kjeldahl method andP, K, and Zn were analyzed with the Infra Analyzer 405(Braun+Lube, Norderstedt, Germany) (Jimenez and Ladha1995). In F0, soil was sampled by a core sampler (5 cmdiam) and the soil 2 cm from the surface was removed. Thissoil sample was transferred to the laboratory immediately.Ferrous iron was extracted by acetate buffer (pH 2.8) anddetermined by a colorimetric method using o-phenanthriline(Kumada and Asami 1958). The soil pH was determined bya conventional method (Thomas 1996).
Results
Figure 1 shows changes in dry weight in the 2001 WS and2002 DS. In both seasons, the dry weights in F1 tended to begreater than those in F0. In each season, the differences indry weight among the plots in F1 were smaller than those inF0. This tendency was observed in the 2001 DS and 2002WS (data not shown). To analyze the effect of the applica-tion of rice straw and water management in the fallow sea-son precisely, the changes in dry weight in F0 plots were re-plotted in Figure 2 on the basis of the data shown in Figure1. In W0, in which the irrigation water was not introduced tothe field during the fallow season, the dry weights weresmaller than those in W1 plots where the fields were floodedduring the fallow season. Especially in W0S0F0 plots, the
�
���
���
���
���
�����
�����
�����
�����
� �� �� �� �� ��� � �� �� �� �� ��� � �� �� �� �� ��� � �� �� �� �� ���
��� ������������
�� ��
������ ��� ���� �������� ����
��������� �������
������������������������
�� ��
������������������������
Fig. 1. Changes in dry weight. Vertical bars indicate standard deviation (as in Figs. 4 and 5).

117
dry weights tended to be lower than those in other F0 plots.This inhibition in W0S0F0 plots continued from the begin-ning of cultivation to 50 to 60 DAT, and recovered afterthat. The final dry weights in W0S0F0 plots were lower thanthose in W1S1F0 plots. In many cases in F0 plots, dry weightwas in the following order (Fig. 2): W1S1F0 > W1S0F0 >W0S1F0 > W0S0F0.
This phenomenon, which was also observed in the 2001DS and 2002 WS (data not shown), suggests first that eitherthe absence of straw or water drainage causes growth inhibi-tion, and subsequently the presence of both of these factorsmakes the inhibition serious. In W0S0F0 plots, tiller num-ber was low and leaf color was dark green, irrespective ofseason.
In the 2001 DS, 2001 WS, and 2002 DS, grain yields inF1 plots were greater than those in F0 plots because theamount of fertilizer in F1 plots was greater than that in F0plots (Fig. 3). In all cropping seasons of current experiments,grain yields in W0S0F0 plots were significantly lower thanin other F0 plots. In the 2001 WS and 2002 DS, the grainyields of W1S1F0 plots were significantly higher than thoseof other F0 plots. This finding indicates that the applicationof straw or flooded water in the fallow season caused growthinhibition to be overcome. In the 2001 DS and 2002 WS,this recovery was not observed.
Figure 4 shows the changes in nutrient concentrationof N, P, K, and Zn in the 2001 WS and 2002 DS. Tendencieswere the same in the nutrient concentration of stems (data
���!"
�#
��
�#
��
#
� $��!"
����������#������
$���#�����#����#��
���
���
���
���
�
�����
���
���
���
���
�%���!"##��!"����!"�%��!"
��
�#
��
#
�
����������#������
$���#�����#����#��
���
���
���
���
�
����������������������
�
�
&
''
�������� ����
������ ��� ����
%���!"#���!"$%��!"����!"
��� ������������
�
&&
&
�
'
&
' '
&&'
��
� �&
'
&&
��
' '
&
'
&&
�
&'
�
&
'
�
&'�&
'
������ ������ ������ ������
Fig. 2. Changes in dry weight in F0 plots. Symbols with different letters denote a
significant difference at the 5% level (DAT = days after transplanting).
�
�
�
�� � �
& &&
& & & & & & & & & &''
' ''
��
�
( (
�
���� ����
� ��� ����
'
��� ����
$
�
#
�
%
�
���
���
���
���
���
���
���
���
���
���
���
���
���
���
���
���
���
���
���
���
���
���
���
���
���
���
���
���
���
���
���
���
���
� ��� ������� ����
)����� *����������
Fig. 3. Grain yield. Data were converted to grain yield at 14% water content. W, S, and F
indicate plots.

118
not shown). The N concentration decreased gradually dur-ing the cultivation period, and differences among plots werebarely observed. The difference in the amount of fertilizerand rice straw barely affected the N content. The P concen-tration in F1 plots was greater than in F0 plots because Pfertilizer was applied in F1 plots. In both F0 and F1 plots,the P content in W0S0 plots was lower than in other plots.Although the K concentration was greater than in F0 plots,the effects of straw application and water management werenot clear. The Zn concentration in W0S0F0 and W0S0F1was higher than in other plots. The tendency of the changesin N, P, K, and Zn concentration in leaf was the same in the2002 WS (data not shown).
Figure 5 shows the changes in soil pH and Fe(II) con-tent in soil in the 2001 WS. This tendency was the same asin the 2002 WS (data not shown). The values of pH wentabove 7.0 except in the late stage of cultivation in the 2001WS and a part of W1S0F0, W0S1F0, and W1S1F0. In allcropping seasons, the pH of W0S0F0 plots was greater thanin other plots. Especially in the 2001 WS, the pH during theearly stage of cultivation surpassed 8.0. Those findings sug-gest that the drainage of water during the fallow seasonincreased the soil pH, while the application of rice strawdecreased it. Especially, the soil pH during the early stageof cultivation in the WS was higher than in the DS. Exceptfor the Fe(II) content in the 2001 DS, content in W0S0F0
Fig. 4. Changes in N, P, K, and Zn contents in leaf.
�
��
��
$�
��
#�
�
��
��
$�
��
#�
�+�
�+�
�+�
�+�
�+�
�+�
�
�
�
$
�
�+�
�+�
�+�
�+�
�+�
�+�
�
�
�
$
�
�
��
��
$�
�
��
��
$�
��
��
$�
�
��
��
$�
�� �� �� �� ����
��
��
$�
��
#�
�
��
��
$�
��
#�
� �� �� �� �� ��� �
��
��
��
� �� �� �� �� ���
��
���� ��
,�'��� ������-�.��
/�'��� ������-�.��
0��'��� ������-�.��
�
��
��
$�
��
#�
�
��
��
$�
��
#�
1�'��� ������-�.��
�
�
��
��
$�
��
#�
�� �� �� �� ���
������ ��� ���� �������� ����
��
��������� �������
������
������
������
������
������
������
������
������

119
was lower than in other plots. During cultivation, the soilpH tended to decrease, while Fe(II) content tended to in-crease.
Discussion
Growth inhibition of rice
Except for grain yield in the 2002 WS, yield of F1 washigher than that of F0 plots, suggesting that this differencewas caused by the greater amount of fertilizer in F1 plotsthan in F0 plots (Fig. 3). In the 2002 WS, the application offertilizer in F1 plots did not affect grain yield, presumablybecause of climatic factors. This remains to be analyzed. Inall cropping seasons, grain yield in W0S0F0 plots was lowerthan in other F0 plots, whereas no significant differencesoccurred among grain yield in F1 plots. Growth inhibitionin W0S0 plots was observed only in the F0 plots.
As shown in Figures 1 and 2, drainage of water duringthe fallow season inhibited rice growth during the cultiva-tion period. This inhibition was overcome by the applica-tion of sufficient fertilizer (F1), the application of rice straw(S1), or the flooded soil during the fallow season (W1) (Fig.2). In the W0S0F0 plots, although growth was recoveredduring the late stage of cultivation (Fig. 2), grain yield waslower than in other plots, especially in the 2001 WS and2002 DS (Fig. 3). These findings suggest that growth inhi-bition in the early stage of cultivation decreased grain yield.The differences in growth inhibition between the WS andDS were not clear. As mentioned above, flooded soil (W1),the application of rice straw (S1), and/or application of fer-tilizer (F1) helped overcome growth inhibition. The appli-
cation of a large amount of fertilizer (F1) improved ricegrowth irrespective of the presence or absence of floodedwater in the fallow season and the application of rice straw(Fig. 1). As shown in Figure 2, dry weight in F0 plots tendedto be W1S1F0 > W1S0F0 > W0S1F0 > W0S0F0.
These findings indicate first that the effect of theflooded soil in the fallow season (W1) to overcome growthinhibition was greater than that of the application of ricestraw (S1). Subsequently, the presence of both factors (W1and S1) made the improvement more efficient because ofthe interaction of two factors.
The relationship between nutrient
components and growth inhibition
Rice growth was not inhibited in the F1 plots (Fig. 1), indi-cating that N, P, and/or K was associated with the inhibi-tion. Dobermann and Fairhurst (2000a,b,c,d) show the criti-cal level of deficiency using the concentration of nutrientin the leaf. According to them, the critical level of N is 25 gkg–1 in midtillering and PI (Dobermann and Fairhurst2000a). In all cropping seasons of our study, the midtilleringstage was present at around 20 DAT irrespective of F0 andF1 plots. The PI stage of F1 plots at 44–46 DAT was 4–5 dearlier than that of F0 plots. The flowering stage of F1 plotsat 72–76 DAT was 4–5 d earlier than that of F0 plots. Espe-cially at the early stage of cultivation, in which growth wasinhibited, N content was higher than the critical level, andno difference between the plots could be observed. Thesefindings indicate that growth inhibition was not associatedwith N deficiency (Fig. 4). Phosphorus deficiency occurs inacidic or alkaline soil such as acidic latosol soil, acid sul-
Fig. 5. Changes in amounts of soil Fe(II) and pH values in F0 plots.
�+�
%+�
%+�
�+�
�+�
� �� �� �� �� ���
�+�
�+�
%+�
%+�
�+�
�+�
�+�
�+�
%+�
%+�
�+�
�+�
�
�
�
$
�
#
�
%
�
�
�
$
�
#
�
%
�
�
�
$
�
#
�
%
������ ��� ���� �������� ����
��������� �������
� �22�����-�
�������� �����3
�+�
������ ������ ������ ������
� �� �� �� �� ��� � �� �� �� �� ���

120
Table 1. Relationship between pH and Fe(II) in soil (y = pH; x =
amount of Fe(II) (g kg–1 soil).
Season n r2
2001 dry season 12 0.18
2001 wet season 28 0.87a
2002 dry season 20 0.67b
2002 wet season 28 0.76c
aSignificant at 1% level. Regression equation: y = –0.38x + 8.98.bSignificant at 1% level. Regression equation: y = –0.20x + 8.05.cSignificant at 1% level. Regression equation: y = –0.18x + 8.31.
fate-rich soil, and calcareous soil (Yoshida 1981).Dobermann and Fairhurst (2000b) reported that the optimallevel of leaf P concentration from midtillering to PI is 2–4 gkg–1, and the critical level for P deficiency is 1 g kg–1. In ourstudy, the leaf P concentration of W0S0F0 plots changedaround 1 g kg-1 in the early stage of cultivation. Therefore,growth inhibition in W0S0F0 plots was associated with Pdeficiency. In the early stage of cultivation of F0 plots, leafP concentration was in the following order: W1S1F0 =W1S0F0 > W0S1F0 > W0S0F0.
This finding indicates that the P content in W0 plotswas lower than in W1 plots. This tendency was similar tothat in dry weight (Fig. 2). In W0S0F0 plots, the leaf wasdark green and the number of stems tended to be small.Those symptoms corresponded to the characteristics of Pdeficiency. All of those tendencies support the presence ofP deficiency (Fageria et al 1988). Sasaki and Hirata (1995)reported that rice plants require the uptake of P, especiallyin the early stage of growth. When the amount of P in theplant is not sufficient, the plant moves P from old to newtissue. This means that the plant barely moves into P defi-ciency during the late stage of growth if P uptake duringearly growth is sufficient. In our study, rice growth inW0S0F0 plots was inhibited in the early stage of cropping(Fig. 2). That was attributed to P deficiency during the earlystage of cultivation.
Potassium deficiency occurs under a reduced condi-tion of soil (Dobermann and Fairhurst 2000c). It is reportedthat the optimum concentration in the leaf during mid-tillering and PI is 18–26 g kg–1, and that the critical level forK deficiency is 15 g kg–1. In our study, although the K con-tent in W0S0F0 plots was lower than in other plots, it changedaround 20 g kg–1. Therefore, the possibility of the presenceof K deficiency was small.
Zn deficiency occurred in alkaline soil, and that is oneof the most serious problems in tropical soils (Dobermannand Fairhurst 2000d). The optimal concentration of leaf Znis 25–50 mg kg–1, and the critical level of leaf Zn for defi-ciency is 20 mg kg–1 (Dobermann and Fairhurst 2000d). Inthese conditions, the Zn concentration in the leaf was over20 (mg kg–1), and the Zn concentration in W0S0F0 plotswas higher than in other plots. Therefore, Zn was not in-volved in growth inhibition. Based on the results discussedabove, growth inhibition, which was caused by the soil dry-ing in the fallow season, was associated with P deficiency.No N, K, and Zn were involved in the inhibition.
The relationship between soil pH
and growth inhibition
It is reported that rice has a comparatively high tolerance ofhigh pH (Ikehashi 1997), namely, a high soil pH barelyinhibits rice growth directly, although high pH changes thenutrient availability of soil. In our study, the values of soilpH in W0S0F0 plots were higher than those in other plots inall cropping seasons (Fig. 5). Especially in the 2001 WS,the initial pH in W0S0F0 plots was over 8.3. The values ofpH in W0S0F0 plots were high in the early stage of cultiva-
tion and decreased gradually (WS), or remained high dur-ing cultivation (DS). Rice growth in W0S0F0 plots wasstrongly inhibited during the early stage of cultivation (Fig.2). Those findings suggest that the high values of soil pH inW0S0F0 plots were related to growth inhibition. In the 2001DS, there were no differences in Fe(II) content in each plot(Fig. 5), whereas, in the 2002 DS, significant differences ineach plot were observed. In the previous fallow season ofthe 2001 DS, the effect of soil drying was small because ofrain. As a result of this insufficient soil drying, Fe(II) did notdecrease even in the W0 plots. The characteristics of thechanges in Fe(II) content were opposite to those in the val-ues of pH. The amounts of Fe(II) in W0S0F0 plots weresmaller than those in other plots except for those in the2001 DS. In many cases, like in the 2001 WS, pH valuesincreased, while the amount of Fe(II) decreased throughoutthe cultivation period.
To analyze the relationship between Fe(II) content andpH values, the data shown in Figure 5 and those of the 2002WS were re-plotted in another figure (data not shown). Thevalues of pH and Fe(II) content were plotted on the y and xaxis, respectively. Table 1 shows the coefficients of deter-mination (r2) and regression equations. On the basis of thisanalysis, there was a significant negative correlation be-tween the values of pH and Fe(II) content in the 2001 WS,2002 WS, and 2002 DS. Those findings indicate that, first,the amounts of Fe(II) affected the changes in pH, and subse-quently the high pH in the W0S0F0 plot was attributed tolow Fe(II) content. There was no significant correlation be-tween the values of pH and Fe(II) content in the 2001 DS. Inthis season, the soil pH was affected by a factor other thanFe(II) content. We still need to analyze what conditionsmake the relation of those factors significant.
In the 2001 WS and 2002 DS, it can be estimated thatthe low Fe(II) content in W0S0F0 plots affected the initialoxidation-reduction status of soil in the cropping season.The water was not supplied to the W0 field except for rain inthe fallow season, while the fields in W1 plots were floodedthroughout the fallow season. With that management, theinitial soil in the cropping season of W0 plots was reduc-tive, whereas that in W1 plots was oxidative, and it becamereductive during the cropping season. In a previous studyin relation to single, double, and triple rice cropping in thetropics, Nozoe et al (2003) reported that the pH of those

121
soils decreased with the increase in the annual number ofcroppings. This indicates that the pH value tended to behigh with the increase in the periods of fallow season, andwith the increase in the intensity of drying. The results ob-tained in our study support those results. Ponnamperuma etal (1966) reported a positive correlation between the partialpressure of soil CO
2 and the pH value when the soil pH was
high. Carbon dioxide is generated as a terminal product ofthe decomposition of organic materials and the soil organicmaterials serve as an electron donor for the soil reduction.As the soil reduction proceeds, the soil pH decreases be-cause the partial pressure of CO
2 increases. Therefore, the
partial pressure of CO2 in oxidative soil is low, and the pH
of this soil is high. In our study, the pH in F1 plots was low.This was presumably caused by the increase in CO
2 concen-
tration in the soil.In relation to the mechanism of the suppression of P
uptake under high pH conditions, the high concentration ofcalcium (Ca) in the soil decreases the amount of available P(Dobermann and Fairhurst 2000b). Phosphate is adsorbedto Fe(III) oxides and the Fe(II) is oxidized to Fe(III) duringthe fallow season (Kirk et al 1990). During the followingcropping season, the phosphate becomes available with thereduction of Fe(III) oxides to Fe(II). In our study, however,the mechanism of the P deficiency is not clear. The applica-tion of rice straw first increases the amount of P in rice fromthe rice straw, which subsequently improves the suppres-sion of P uptake by decreasing soil pH.
In our study, soil drying in the fallow season inhibitedthe following rice growth. The application of P or rice strawimproved the inhibition. Actually, the amount of P that isapplied in the tropics is small (Herdt and Stangel 1984,Maene 1990). Much rice straw is removed or burned (Flinnand Marciano 1984). Our study indicated that soil manage-ment in the fallow season inhibited the following growth,especially under high pH conditions. It remains to be con-firmed whether rice is inhibited outside of IRRI fields.
References
Dobermann A, Fairhurst T. 2000a. Nitrogen deficiency. In:Dobermann A, Fairhurst T, editors. Rice: nutrient disor-ders and nutrient management. Manila (Philippines): Inter-national Rice Research Institute. p 41-59.
Dobermann A, Fairhurst T. 2000b. Phosphorus deficiency. In:Dobermann A, Fairhurst T, editors. Rice: nutrient disor-ders and nutrient management. Manila (Philippines): Inter-national Rice Research Institute. p 60-71.
Dobermann A, Fairhurst T. 2000c. Potassium deficiency. In:Dobermann A, Fairhurst T, editors. Rice: nutrient disor-ders and nutrient management. Manila (Philippines): Inter-national Rice Research Institute. p 72-83.
Dobermann A, Fairhurst T. 2000d. Zinc deficiency. In:Dobermann A, Fairhurst T, editors. Rice: nutrient disor-ders and nutrient management. Manila (Philippines): Inter-national Rice Research Institute. p 84-89.
Fageria NK, Wright RJ, Baligar VC. 1988. Rice cultivar evalu-ation for phosphorus use efficiency. Plant Soil 111:105-109.
Flinn JC, Marciano VP. 1984. Rice straw and stubble manage-ment. In: Ponnamperuma ED, editor. Organic matter andrice. Manila (Philippines): International Rice ResearchInstitute. p 593-611.
Herdt RW, Stangel PJ. 1984. Population, rice production, andfertilizer outlook. In: Ponnamperuma ED, editor. Organicmatter and rice. Manila (Philippines): International RiceResearch Institute. p 1-34.
Ikehashi H. 1997. Tolerance to soil stress. In: Matsuo T et al,editors. Science of the rice plant. Volume three. Genetics.Tokyo (Japan): Food and Agriculture Policy ResearchCenter. p 586-697.
Jimenez RR, Ladha JK. 1995. Assessing the potential of thenear infrared reflectance (NIR) method for the reliableanalysis of nitrogen in rice tissues. In: Batten GD, FlinnPC, Welsh LA, Blakeney AB, editors. Leaping ahead withnear infrared spectroscopy. North Melbourne, Victoria(Australia): The NIR Spectroscopy Group. p 208-213.
Kirk GDJ, Tian-ren Y, Choudhury FA. 1990. Phosphorouschemistry in relation to water regime. In: Phosphorousrequirements for sustainable agriculture in Asia andOceania. Manila (Philippines): International Rice Re-search Institute. p 211-223.
Kumada K, Asami Y. 1958. A new method for determiningferrous iron in paddy soils. Soil Plant Food 3:187-193.
Maene LM. 1990. Fertilizer policies for agricultural develop-ment. In: Phosphorous requirements for sustainable agri-culture in Asia and Oceania. Manila (Philippines): Interna-tional Rice Research Institute. p 45-56.
Nozoe T, Rodriguez R, Agbisit R. 2003. Differences in thechanges of ferrous iron content and pH values in soils un-der single, double and triple rice cultivation systems intropical areas. Jpn. J. Soil Sci. Plant Nutr. 74:499-502. (InJapanese.)
Olk DC, van Kessel C, Bronson KF. 2000. Managing soil or-ganic matter in rice and nonrice soils: agronomic ques-tions. In: Kirk GJD, Olk DC, editors. Carbon and nitrogendynamics in flooded soils. Manila (Philippines): Interna-tional Rice Research Institute. p 27-47.
Ponnamperuma FN, Martinez E, Loy T. 1966. Influence ofredox potential and partial pressure of carbon dioxide onpH values and the suspension effect of flooded soils. SoilSci. 101:421-431.
Reichardt W, Inubushi K, Tiedje J. 2000. Microbial processesin C and N dynamics. In: Kirk GJD, Olk DC, editors. Car-bon and nitrogen dynamics in flooded soils. Manila (Philip-pines): International Rice Research Institute. p 101-146.
Sasaki Y, Hirata H. 1995. Absorption and mechanisms of phos-phate. In: Matsuo T, Kumazawa K, Ishii R, Ishihara K,Hirata H, editors. Science of the rice plant. Volume two.Physiology. Tokyo (Japan): Food and Agriculture PolicyResearch Center. p 368-383.
Tanaka F, Ono S, Hayasaka T. 1990. Identification and evalua-tion of toxicity of rice root elongation inhibitors in floodedsoil with added wheat straw. Soil Sci. Plant Nutr. 36:97-103.

122
Thomas WG. 1996. Soil pH and soil acidity. In: Sparks DL,Page AL, Helmke PA, Leoppert RH, Soltanpour PN,Tabatabai MA, Johnston CT, Sumner ME, editors. Meth-ods of soil analysis. Part 3. Chemical methods. Madison.Wis. (USA): Soil Science Society of America, AgronomySociety of America. p 475-490.
Yoshida S. 1981. Phosphorous. In: Fundamentals of rice cropscience. Manila (Philippines): International Rice ResearchInstitute. p 147-149.
Notes
Authors’ address: Crop, Soil, and Water Sciences Division,International Rice Research Institute, DAPO Box 7777,Metro Manila, Philippines.

No. 1 Kam SP, Hoanh CT, editors. 1999. Scaling Methodologies In Ecoregional Approaches for Natural Resources Management
No. 2 Baki BB, Chin DV, Mortimer M, editors. 2000. Wild and Weedy Rice in Rice Ecosystems in Asia—A Review
No. 3 Padolina W, editor. 2000. Plant Variety Protection for Rice in Developing Countries: Impacts on Research and Development
No. 4 de Padua D, Bell MA, Razote E, Billate R, editors. 2000. Philippine Rice Postproduction Systems (PPS)—Moving to a Brighter Future
No. 5 Pandey S, Barah BC, Villano RA, Pal S, editors. 2000. Risk Analysis and Management in Rainfed Rice Systems
No. 6 Mew TW, Cottyn B, editors. 2001. Seed Health and Seed-Associated Microorganisms for Rice Disease Management
No. 7 Kam SP, Hoanh CT, Trébuil G, Hardy B, editors. 2001. Natural Resource Management Issues in the Korat Basin of Northeast Thailand: An Overview
No. 8 Mew TW, editor. 2001. Planning Workshop on Red Stripe No. 9 Bakker R, Borlagdan P, Hardy B, editors. 2004. Partnerships for Modernizing the Grain
Postproduction Sector
DAPO Box 7777, Metro Manila, Philippines
L P