Iron Ore Seminar - riotinto.com · Iron Ore Seminar. 3 September 2015. Economics & Markets. Iron...
68
Iron Ore Seminar 3 September 2015 Economics & Markets Iron Ore Sales & Marketing Technology & Innovation
Transcript of Iron Ore Seminar - riotinto.com · Iron Ore Seminar. 3 September 2015. Economics & Markets. Iron...

Iron Ore Seminar
3 September 2015 Economics & Markets Iron Ore Sales & Marketing Technology & Innovation

©2015, Rio Tinto, All Rights Reserved
Cautionary statement
This presentation has been prepared by Rio Tinto plc and Rio Tinto Limited (“Rio Tinto”). By accessing/attending this presentation you acknowledge that you have read and understood the following statement.
Forward-looking statements
This document contains certain forward-looking statements with respect to the financial condition, results of operations and business of the Rio Tinto Group. These statements are forward-looking statements within the meaning of Section 27A of the US Securities Act of 1933, and Section 21E of the US Securities Exchange Act of 1934. The words “intend”, “aim”, “project”, “anticipate”, “estimate”, “plan”, “believes”, “expects”, “may”, “should”, “will”, “target”, “set to” or similar expressions, commonly identify such forward-looking statements.
Examples of forward-looking statements include those regarding estimated ore reserves, anticipated production or construction dates, costs, outputs and productive lives of assets or similar factors. Forward-looking statements involve known and unknown risks, uncertainties, assumptions and other factors set forth in this presentation.
For example, future ore reserves will be based in part on market prices that may vary significantly from current levels. These may materially affect the timing and feasibility of particular developments. Other factors include the ability to produce and transport products profitably, demand for our products, changes to the assumptions regarding the recoverable value of our tangible and intangible assets, the effect of foreign currency exchange rates on market prices and operating costs, and activities by governmental authorities, such as changes in taxation or regulation, and political uncertainty.
In light of these risks, uncertainties and assumptions, actual results could be materially different from projected future results expressed or implied by these forward-looking statements which speak only as to the date of this presentation. Except as required by applicable regulations or by law, the Rio Tinto Group does not undertake any obligation to publicly update or revise any forward-looking statements, whether as a result of new information or future events. The Group cannot guarantee that its forward-looking statements will not differ materially from actual results. In this presentation all figures are US dollars unless stated otherwise.
Disclaimer
Neither this presentation, nor the question and answer session, nor any part thereof, may be recorded, transcribed, distributed, published or reproduced in any form, except as permitted by Rio Tinto. By accessing/ attending this presentation, you agree with the foregoing and, upon request, you will promptly return any records or transcripts at the presentation without retaining any copies.
This presentation contains a number of non-IFRS financial measures. Rio Tinto management considers these to be key financial performance indicators of the business and they are defined and/or reconciled in Rio Tinto’s annual results press release and/or Annual report.
2

©2015, Rio Tinto, All Rights Reserved
JORC Code references are to the “Australasian Code for Reporting of Exploration Results, Minerals Resources and Ore Reserves, 2012 Edition.
Mineral Resources and Ore Reserves Details of the Pilbara Mineral Resource and Ore Reserve estimates from 2006 to 2014 which appear on slide 66 of this presentation are set out in the Rio Tinto Annual Reports for those years. The references in the chart on that slide to the 2014 estimate of Rio Tinto’s Mineral Resources and Ore Reserves base in the Pilbara are an aggregation of estimates as at 31 December 2014 that were previously reported in accordance with the JORC Code on pages 199 and 204 of the Rio Tinto 2014 Annual Report dated 4 March 2015 and released to ASX on 6 March 2015, and in respect of those Mineral Resources or Ore Reserves for which the information in relation to the relevant criteria in Table 1 of the JORC Code is required, this information is found at www.riotinto.com/JORC. Rio Tinto confirms that it is not aware of any new information or data that materially affects the Mineral Resource and Ore Reserve information on slide 66, that all material assumptions and technical parameters underpinning those estimates continue to apply and have not materially changed, and that the form and context of the Mineral Resources and Ore Reserves has not been materially modified. Details of the Competent Persons responsible for that previous reporting are set out below.
Competent Persons To the extent that information on slide 66 of this presentation relates to the Pilbara Mineral Resources, it was prepared by Mr Bruce Sommerville, a Competent Person who is a Fellow of the Australasian Institute of Mining and Metallurgy. To the extent that information on slide 66 of this presentation relates to the Pilbara Ore Reserves, it was prepared by Mr An Do, a Competent Person who is a Member of the Australasian Institute of Mining and Metallurgy. Mr Sommerville and Mr Do have overseen the aggregation of the Mineral Resources and Ore Reserves data for inclusion in this presentation. Messrs Sommerville and Do are full-time employees of Rio Tinto Iron Ore and have sufficient experience that is relevant to the style of mineralisation and type of deposits under consideration and to the activity which each has undertaken to qualify as a Competent Person as defined in the JORC Code. Messrs Sommerville and Do consent to the inclusion in the report of the matters based on their information in the form and context in which it appears.
3
©2015, Rio Tinto, All Rights Reserved
Production Targets Production targets for 2017 for our Pilbara operations and Iron Ore Company of Canada appear in this presentation. For our Pilbara operations, slide 25 states “Pilbara integrated production system is expected to deliver … 350 Mt in 2017”. This production target is underpinned as to 71% by proved ore reserves, and as to 25% by probable ore reserves, and as such 96% of the production target is based on ore reserves. The remaining 4% of the production target is sourced from identified inferred mineral resources within the detailed pit designs. There is a low level of geological confidence associated with inferred mineral resources and there is no certainty that further exploration work will result in the determination of indicated mineral resources or that the production target itself will be realised. For our Iron Ore Company of Canada operations, slide 35 states “Nameplate Capacity of 23 Mtpa concentrate to be achieved in 2017”. This production target is underpinned as to 61% by proved ore reserves, and 39% by probable ore reserves. The above 2017 production targets are based on internal modelling of integrated supply plans derived from the relevant estimates of mineral resources and ore reserves, which have been prepared by Competent Persons in accordance with the requirements of the JORC Code, scheduled from within the current pit designs. Pit design, ore scheduling and economic assessments, which form the basis of the production target are based on detailed studies using the actual operating performance of our existing mines, processing plants and infrastructure as the basis of the assumptions. These studies include assessment of mining, metallurgical, ore processing, marketing, government, legal, environmental, economic and social factors.
4

Introduction Andrew Harding, chief executive, Iron Ore
3 September 2015 Economics & Markets Iron Ore Sales & Marketing Technology & Innovation

Iron ore demand fundamentals Vivek Tulpule, head of Economics & Markets
3 September 2015 Economics & Markets Iron Ore Sales & Marketing Technology & Innovation

©2015, Rio Tinto, All Rights Reserved
7
Independent advice
Report to CFO
Independent from Product Groups
Extensive data collection
Primary research
Internal and external resources
Risk and scenario analysis
Rigorous testing of results
Understand and quantify uncertainty
Fundamental demand and supply analysis
Proprietary cost curves
Detailed sectoral country modelling
Rio Tinto Economics & Markets

©2015, Rio Tinto, All Rights Reserved
China’s transition toward high-income status involves a structural transition to slower growth
8
Demographic Transition
Slowing Urbanisation
Growth
Greater emphasis on services and consumption
Tapering of Capital
Intensive Investment
Higher Value Added
Production
China’s ‘New Normal’
Relationship between
China and other
Emerging Markets

©2015, Rio Tinto, All Rights Reserved
0
500
1,000
1,500
2,000
2,500
3,000
2010 2015 2020 2025 2030
Developed Economies
China
Other Emerging Markets
12.2%
0.1%
0.6%
3.4%
• Global steel demand grows by 2.5% pa, versus GDP growth of 3.0%
• Chinese steel demand is evolving with an increasing focus on exports
• Increasing importance of emerging markets beyond China, especially in Asia
• The world will need 3 billion tonnes of iron ore by 2030, that is a growth rate of 2%
• New supply will be required
• Over 50% of the additional supply will be delivered through the seaborne market
Continued global iron ore demand
Moderate growth in iron ore demand Total iron ore demand (million tonnes)
Source: Rio Tinto
2.0% CAGR
9

©2015, Rio Tinto, All Rights Reserved
0
250
500
750
1,000
1,250
1,500
1,750
2010 2015 2020 2025 2030
Other manufacturingOther transportShipbuildingMachineryAutomotiveConstruction
10
Robust growth in rest of world demand
Rest of World (ex-China) steel demand Crude steel production (million tonnes)
• Process of industrialisation and urbanisation in the rest of world will be highly steel intensive
• Rest of world steel demand to increase by 65% by 2030
• India’s share of rest of world demand will double from 10% by 2030
• In 2030, China remains the largest demand region, followed by India and then ASEAN
• Construction of commercial and residential buildings and infrastructure supports Chinese exports of finished steel and machinery
Note: Crude steel production basis and does includes steel trade
Sectors
OE
CD
E
cono
mie
s
Oth
er
Em
ergi
ng
Mar
kets
Em
ergi
ng A
sian
E
cono
mie
s
Regions
2030

©2015, Rio Tinto, All Rights Reserved
11
China steel growth will continue
Maturing domestic steel demand Crude steel production (million tonnes)
• Crude steel production expected to reach around 1 billion tonnes by 2030
• Growth in capital stock is slowing leading to a declining demand for steel to support growth
• Replacement of capital stock will maintain current levels of Chinese domestic consumption
• Growing global markets generate demand for manufactured exports containing steel (e.g. machinery, cars)
• Steel exports to be maintained at current levels – though with a declining global share (e.g. flat and long products)
Source: Rio Tinto
0
200
400
600
800
1,000
2000 2005 2010 2015 2020 2025 2030
Net Steel Exports Exports of Finished GoodsReplacement of Capital Stock Additional Capital Stock

©2015, Rio Tinto, All Rights Reserved
Chinese steel demand based on detailed analysis
Urban Residential Rural Residential
Non-Residential
Building
Finished Steel Consumption
12
Petrochemical Agricultural
Construction Mining Equipment
Power Generation
Machinery
Infrastructure Highways
Rail Subway
Public Facilities
Autos Shipping
Consumer Durables
Transport & Other
Other

©2015, Rio Tinto, All Rights Reserved
Case study I: Residential steel demand 13
Regulation
Seismic rating
Building height
Car penetration Prefabricated concrete
High strength rebar substitution
Superstructure
Basement Foundation
50 kg/sqm
175kg/sqm
120,000 sqm
50,000 sqm
Steel Intensity Floor Space
6,000 t
8,750 t
Steel Typical ~30 storey high rise
GDP per capita Population
Source: Rio Tinto

©2015, Rio Tinto, All Rights Reserved
14
Case study II: Residential replacement demand
0
50
100
Tier I Tier III2000 2015 2030
New-build urban residential intensity Kg / square metre
• By 2030, nearly 25% of the current urban residential building stock will be demolished and rebuilt
• The average life of an urban residential building in 1980 was 37 years
• In 1980, 65% of urban residential buildings completed were 1 storey and around 5% above 7 storeys
• By 2030, a third of the buildings completed will be above 7 storeys
• Newly built residential will be more steel intensive than those they replace
Source: Rio Tinto
©2015, Rio Tinto, All Rights Reserved
15
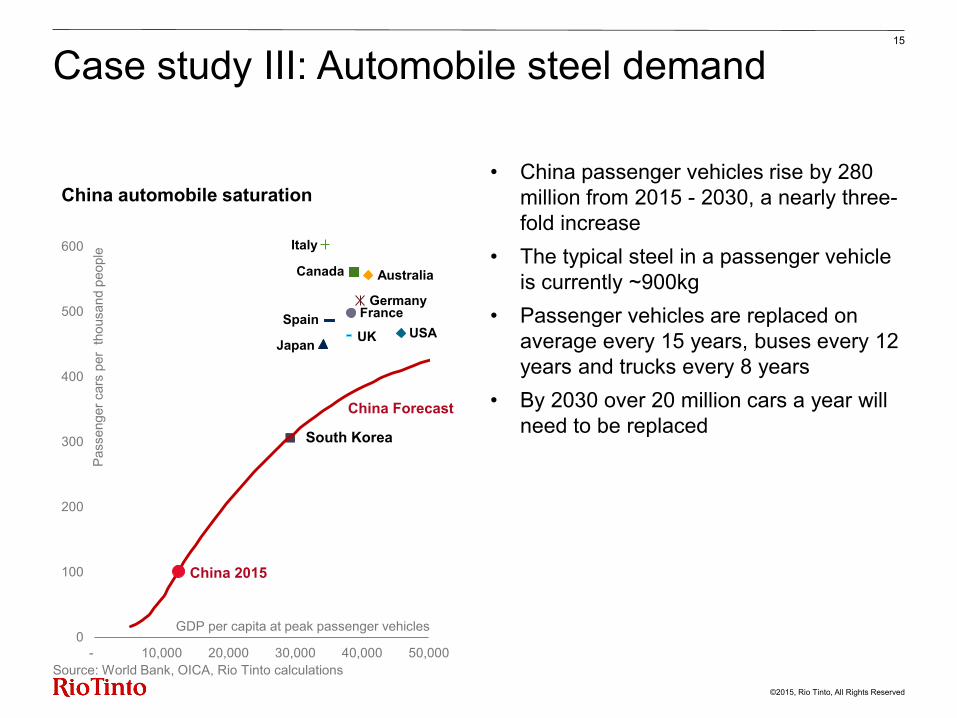
Case study III: Automobile steel demand
• China passenger vehicles rise by 280 million from 2015 - 2030, a nearly three-fold increase
• The typical steel in a passenger vehicle is currently ~900kg
• Passenger vehicles are replaced on average every 15 years, buses every 12 years and trucks every 8 years
• By 2030 over 20 million cars a year will need to be replaced
UK
0
100
200
300
400
500
600
- 10,000 20,000 30,000 40,000 50,000
Japan USA
South Korea
Canada Australia
Germany Spain
Italy
France
China Forecast
GDP per capita at peak passenger vehicles
Pass
enge
r car
s pe
r th
ousa
nd p
eopl
e
China 2015
Source: World Bank, OICA, Rio Tinto calculations
China automobile saturation

©2015, Rio Tinto, All Rights Reserved
Other
16
Obsolete Chinese scrap triples in fifteen years and will displace some iron ore requirements
0
50
100
150
200
250
2015 2020 2030
Home
Prompt
Obsolete
Autos
Power Generation Urban
Residential
Source: Rio Tinto
Scrap produced at mills
Offcuts from manufacturing
Chinese scrap supply Million tonnes

©2015, Rio Tinto, All Rights Reserved
0
200
400
600
800
1,000
1,200
0 5,000 10,000 15,000 20,000 25,000 30,000
GDP per capita
South Korea
Japan
Taiwan
Germany
United States
China
France India
Vietnam
Source: World Steel, Maddison, Correlates of War, E&M forecasts and calculations Source: World Steel, Maddison, Correlates of War, Global Insight, E&M China Forecasts Note: Stylised intensity curves
17
China steel demand growth consistent with international experience
0 5 10 15 20
PhilippinesIndonesia
VietnamIndia
ThailandMexico
MalaysiaBrazilChinaSpain
PolandFrance
NetherlandsAustralia
United KingdomItaly
CanadaUnited States
China 2030G7 Average
GermanyTaiwanRussiaJapan
South Korea
2014 Historical Peak
2030
Substantial steel potential for developing Asia Global steel stock per capita (tonne/capita)
China steel intensity to increase at slowing rate Global crude steel intensity per capita (Kg/capita)
Forecast

©2015, Rio Tinto, All Rights Reserved
Summary 18
The world will need increasing volumes of iron ore: 2.0% CAGR 2015-2030
Emerging markets, other than China, will play an increasingly significant role in the iron ore market with demand expected to increase by 65%
Continued modest Chinese steel production growth to 2030
Growing role for replacement of capital stock and exports to other emerging markets

Delivering value through the cycle Andrew Harding, chief executive, Iron Ore
3 September 2015 Economics & Markets Iron Ore Sales & Marketing Technology & Innovation

©2015, Rio Tinto, All Rights Reserved
The world’s best iron ore business
Underpinned by a comprehensive strategy that drives compelling value:
20
Value-driven growth Maximising portfolio value Production at the right cost
Safest and lowest cost production through unrivalled technology and high performing teams
Disciplined phasing and low cost quality growth options
Leveraging our portfolio of growth options, product strategy and sales and supply chain capabilities
Examples: • Operating excellence • Increasing automation
Examples: • Sales & marketing expertise • Product and development
synergies
Examples: • Benchmark product quality • System capacity creep

©2015, Rio Tinto, All Rights Reserved
Iron Ore all injury frequency rate Per 200,000 hours worked
0.0
0.2
0.4
0.6
0.8
1.0
1.2
1.4
1.6
1.8
2.0
'05 '06 '07 '08 '09 '10 '11 '12 '13 '14 YTD'15
Note: Year to date 2015 is January to end of July.
Personal safety, health and well-being is a fundamental business priority
21

©2015, Rio Tinto, All Rights Reserved
Maintaining the lowest first quartile cost position in the industry at US$16.20/t
Consistently delivering value 22
Operating costs have been reduced by almost $1 billion compared to 2012
Iron ore workforce +15,000 people delivering 1 million tonnes of ore per day
More than 400 million tonnes of material moved by autonomous trucks in the Pilbara
IOC concentrator expansion project complete – record concentrate run rate of 21.5 Mt/a in July 2015
Staged Pilbara infrastructure expansion completed at capital intensity of ~$105/t

©2015, Rio Tinto, All Rights Reserved
The Pilbara - a fully integrated system… 23
Leading edge technology ~30TB analysed by the OC per month
~5TB added by Library of Congress per month
Ship Load & Haul Process Drill & Blast Rail
> 300 million tonnes ore shipped annually
> 15,000 kilometres rail travel per day
~1 billion tonnes rock moved per year
> 12,000 kilometres drilled each year
1 2 3 4 5
Equivalent to the diameter of the earth
Almost a return trip on the Trans-Siberian railway
RUSSIA
Cargo shipped through the Panama Canal
Enough to fill the MCG every two days
> 400 kilometres of conveyors
across the Pilbara
8 times the length of the Channel Tunnel
Note: approximate comparative estimates based on publically available information

©2015, Rio Tinto, All Rights Reserved
…producing a suite of world-class iron ore products, including our flagship Pilbara Blend
24
Mines Ore-types
Ore group
Products
Lump (L) & Fines (F)
Ore-types B = Brockman Iron Formation MM = Marra Mamba Iron Formation PIS = Yandicoogina pisolite PIS = Robe Valley pisolite
Product Fe (dry basis) Moisture
Pilbara Blend Lump 62.5% 4.0%
Pilbara Blend Fines 61.5% 9.0%
Robe Valley Lump 57.5% 6.5%
Robe Valley Fines 57.0% 7.5%
Yandicoogina Fines (HIY) 58.5% 9.0%
HIY F
Robe Valley L & F
Yandicoogina
PIS
Mesa A&J
PIS
Channel Iron Deposits Banded Iron Formation derived Iron Deposits
Brockman 2
B
Paraburdoo (inc. Channar
Eastern Range)
B
Brockman 4
B
Nammuldi
MM
West Angelas
MM
Hope Downs 1
MM
Marandoo
MM
Mt Tom Price (Inc.
WTS) B
Hope Downs 4
B
Pilbara Blend (PB) L & F

©2015, Rio Tinto, All Rights Reserved
• 40 Mt of brownfields completed at average capital intensity of $9/t
• Debottlenecking and productivity improvements continue
• Pilbara integrated production system expected to deliver − 335 Mt in 2016 − 350 Mt in 20171
• Nammuldi incremental investment − 5 Mt/a, commencing 2015/16 − 5 Mt/a, commencing in 20172
− Access low phosphorous ore for Pilbara Blend at ~US$19/t capital intensity
25
Growth infrastructure complete, with brownfields continuing to supply near-term volume
Nammuldi feed bins
Nammuldi concentrator 1 This production target must be read in conjunction with the supporting information and cautionary statement that “there is a low level of geological confidence associated with inferred mineral resources and there is no certainty that further exploration work will result in the determination of indicated mineral resources or that the production target itself will be realised” set out on slide 4. 2 These 5 Mt are included in the 2017 production target of 350 Mt for the Pilbara referred to above.

©2015, Rio Tinto, All Rights Reserved
• Nammuldi incremental investment also allows for:
− Silvergrass dewatering infrastructure
− Nammuldi below water table plant expansion from 21- 42 Mt/a
• Full Silvergrass mine development:
− Remains subject to approval in 2016
− Additional mining capacity − Crusher and overland conveyor − Associated support infrastructure − Operating costs significantly
reduced
26
Further high value tonnes from Silvergrass

©2015, Rio Tinto, All Rights Reserved
Unlocking value 27
Releasing working capital
Reducing costs
Improving productivity
>20% reduction in mine stocks
Renegotiation with key suppliers
12% increase in labour productivity
Inventories at mines reduced by 4.5 Mt to 14.5 Mt, improving working capital
Contract renegotiations delivering savings and improved payment terms
Lower head count and increased volumes improved productivity
24% reduction in warehouse inventory
5% reduction in contractor and consultant spend
Improved maintenance tactics
Warehouse spares reduced by managing lead times and reducing bulk stocks Reduction saved A$32m
Resulted in higher asset availability delivering productivity improvements

©2015, Rio Tinto, All Rights Reserved
23.9
20.2 19.5
16.2
FY2012 FY2013 FY2014 H1 2015
28
Sustaining a competitive advantage
Pilbara cash unit cost US$ per tonne
• H1 2015 cash unit cost of US$16.2/t (13% lower than $18.7/t in H2 2014)
• Attractive FOB EBITDA margin at 61% in H1 2015
• Iron ore has delivered almost $1 billion in cost savings since 2012
Pilbara results
H1 2015 vs H1 2014
H1 2015 H1 2014 Change
Shipments (Million tonnes, 100%) 146.5 136.1 8%
FOB EBITDA margin (%) 61% 70% -9%
Underlying earnings (US$ million) 2,158 4,570 -53%
-32%

©2015, Rio Tinto, All Rights Reserved
29
Pilbara – H1 2015 financial summary
7,004
4,059
2,158
(353) (620)
(1,972) (846)
(1,055)
Revenue Freight expense Royalties Operating costs EBITDA Depreciation& amortisation
Tax & other Net earnings
Employee costs 36%
Contractor & external
services 21%
Materials 19%
Fuel & energy 13%
Other 11%
Pilbara net earnings reconciliation US$ million
Pilbara unit cash costs
Operating costs (US$ million) 1,972
Tonnes shipped2 (million tonnes) 122.0
Pilbara unit cash costs (US$/t)
16.2
1 Sales revenue of $7,004 million includes freight revenue of $372 million. 2 Pilbara unit cash costs $/tonne calculation is based on the equity share of tonnages of 122 Mt. Please see appendix for reconciliation to 100% production data.
1

©2015, Rio Tinto, All Rights Reserved
30
Reducing contractor and employee costs has delivered significant benefits in unit costs
(2.9) (1.2) (0.6)
20.4
17.5 0.5 16.2
H1 2014 FX Impact Restated H1 2014 Employee Costs Contractor Costs Other Costs H1 2015
Pilbara unit cost of $16.2/tonne shipped benefitted from: • Favourable exchange movement • Improved labour productivity by 12% in H1 2015 (shipped tonnes/FTE) • 5% reduction in contractor and consultant spend
Pilbara cash unit cost US$ per tonne

©2015, Rio Tinto, All Rights Reserved
Our Operations Centre enables us to optimise for tonnes, quality and value
31
Capability enables real-time visibility of entire value chain and powerful forward planning
Real time analytics reducing system
variability
Debottlenecking and rapid response to events
and disruptions
Ensuring a consistently high-quality product
Maximising the value of our assets

©2015, Rio Tinto, All Rights Reserved
Heavy Equipment Life Extension
$200 million in capital deferrals
HME contracts consolidation $55 million in rebates
Operational and commercial excellence is embedded across the business
32
FasTrack 35 35 hrs cycle time target Cycle time improvement to date ~11.0% & aiming for ~20%
Iron ore material Rehandle reduced by 16 Mt in 2014
Tyre management - $16 million tyre inventory reduction - $10 million supply volume reduction
Brockman train loading 100 minute reduction in train loading time at Brockman 2

©2015, Rio Tinto, All Rights Reserved
33
Autonomous fleet continues to expand bringing significant productivity improvements
Yandicoogina primary haul fleet now entirely autonomous
(22 trucks across 2 pits)
West Angelas first fully autonomous drilling site
Autonomous Haul Trucks Performance Effective utilisation indexed to all manned sites
Autonomous Drills Performance Use of availability versus manned fleet
80%
90%
100%
110%
120%
Jul-14 Oct-14 Jan-15 Apr-15 Jul-15
0.4
0.6
0.8
1.0
Jan-13 Jul-13 Jan-14 Jul-14 Jan-15 Jul-15

©2015, Rio Tinto, All Rights Reserved
Nearly 400 improvement initiatives underway
“Making it count” – Ensuring all work adds value through waste elimination
• Tom Price haul truck service kaizen reduced the 5.5 hour truck service time by 2 hours
• Rail track portable web grinders – 75% task time reduction reducing re-handling risk
Mindful spending and improvement culture
“Production at the right cost” – Improving the work place
• Operations centre upskilled themselves to enable ‘in-housing’ support of two radio platforms, avoiding a contractor cost of $365,000
• Paraburdoo employees challenged vendor tool allowance, realising a credit of $25,000 for Paraburdoo and $145,000 across the Pilbara
Work simplification
34

©2015, Rio Tinto, All Rights Reserved
Iron Ore Company of Canada continues to improve performance
• Monthly production record in July 2015, with 21.5 Mt/a concentrate run-rate
• Nameplate capacity of 23 Mt/a concentrate to be achieved in 20171
• Concentrate unit cash cost: − $39.2/t in H1 2015 − Down by 26% (H1 2015 vs. H1 2014) − 2016 target is $30/t
• Forecast to be cash positive in 2015
• IOC price premiums remained robust despite the decline in the fines price
35
1 This production target must be read in conjunction with the supporting information set out on slide 4.
Iron Ore Company of Canada production Million tonnes
4.6
+13%
4.0
Pellets (Mt)
7.6
+18%
8.9
Concentrate (Mt)
H1 2014 H1 2015 H1 2014 H1 2015

©2015, Rio Tinto, All Rights Reserved
• An unfaltering commitment to the local communities that host our operations
• Key initiatives in education, health, environment, culture and regional sustainability
• Partnering with State and local/ provincial government to enhance community infrastructure and services
• Direct employment of over 1,000 Indigenous Australians
• Sourcing a 1,000 strong regional workforce through fly-in/fly-out
36
Making a positive and lasting difference in our local communities
©2015, Rio Tinto, All Rights Reserved
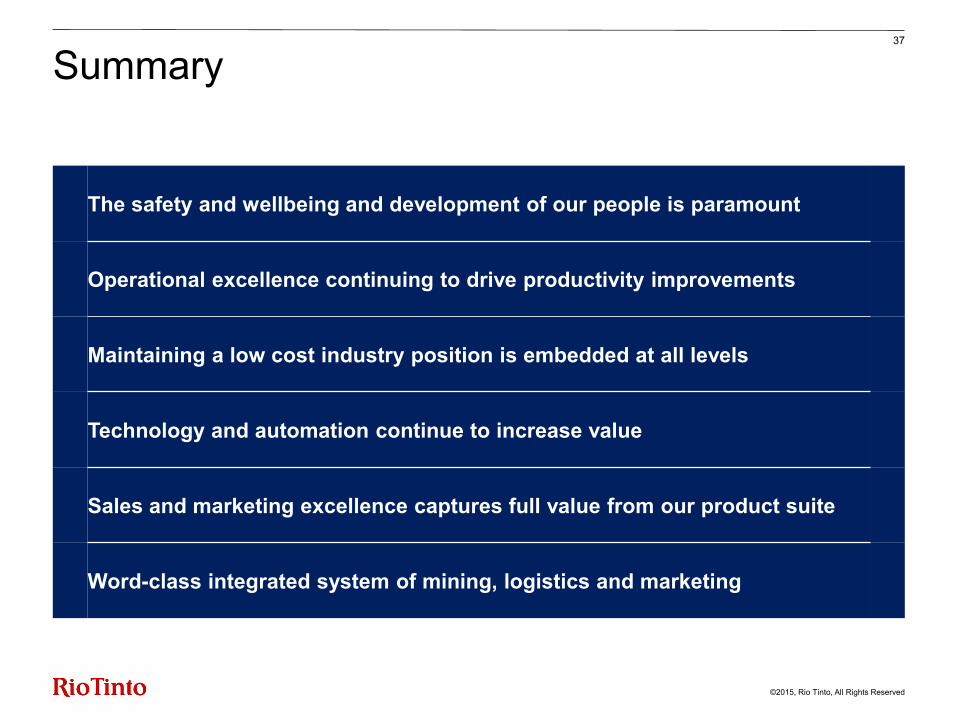
Summary 37
The safety and wellbeing and development of our people is paramount
Operational excellence continuing to drive productivity improvements
Maintaining a low cost industry position is embedded at all levels
Technology and automation continue to increase value
Sales and marketing excellence captures full value from our product suite
Word-class integrated system of mining, logistics and marketing

Maximising value Bold Baatar, managing director, Iron Ore Sales & Marketing and Marine
3 September 2015 Economics & Markets Iron Ore Sales & Marketing Technology & Innovation

©2015, Rio Tinto, All Rights Reserved
39
Our sales and marketing capabilities maximise the value of our products
• A deep understanding of markets and the steel industry
Industry knowledge
• Aligning our resource base with customer needs over the long term to maximise product value
• Continuous development of marketing strategy, competencies and excellence in tactical execution
• Maximising supply chain capacity utilisation and value
Supply chain optimisation
Product alignment
Strategic agility

©2015, Rio Tinto, All Rights Reserved
40
Global steel production is broadly flat Million tonnes annualised
China’s imported ore has remained steady Million tonnes annualised
1,600
1,620
1,640
1,660
1,680
1,700
1H14 2H14 Jan-15 Feb-15 Mar-15 Apr-15 May-15 Jun-15
China’s steel exports offsets domestic consumption Million tonnes annualised
* Total Iron ore requirements – imported ore consumption
0
200
400
600
800
1,000
1H14 2H14 Jan-15 Feb-15 Mar-15 Apr-15 May-15 Jun-15
China steel consumption China steel net exports
Steel production has been resilient in 2015
17%
14%
16% 9%
17%
7%
20%
~1.7 billion tonnes
Majors accounted for ~47% of 2014 supply Percentage of contestable iron ore market
= 47% Rio Tinto BHP Vale
= 53% China Non-traditionals 1
Rest of world 2
FMG
Source: Company reports, GTA, WSA, Mysteel and Rio Tinto analysis. 1 Non-traditionals include Russia, Malaysia, Iran, Mexico and Indonesia. 2 RoW includes Africa, South America, Europe, Canada and India.
H1-14 H2-14
H1-14 H2-14
0
0%
20%
40%
60%
80%
100%
0
400
800
1,200
1,600
Dec-13 Mar-14 Jun-14 Sep-14 Dec-14 Mar-15 Jun-15
Domestic ore consumption*Imported ore consumptionDomestic share (3MMA, RH axis)

©2015, Rio Tinto, All Rights Reserved
High-cost seaborne supply down ~75 Mt/a YoY Exits annualised by region
China domestic supply down ~45 Mt/a YoY Average annualised run rates (Mt/a)
We expect ~120 Mt/a of marginal iron ore supply to exit the market in 2015
Source: RTIO S&M Analysis, SMM, Mysteel, Company Reports
0
50
100
0
50
100
0
50
100
0
50
100
0
50
100
0
50
100
0
50
100
0
50
100
Liaoning
Southwest
Shanxi Inner
Mongolia
Shandong
Other Provinces
Anhui
Hebei
250
300
350National Total
2014 run rate (Mt/a)
H1 2015 run rate (Mt/a)
~110 Mt of low-cost supply expected to enter in 2015, offset by stock movements and exits: • ~45 Mt/a of exits from China: H1 2015 iron ore production ~280 Mt/a (325 Mt in 2014) • ~75 Mt/a of exits from high-cost seaborne supply • ~45 Mt/a of additional seaborne supply at risk
41
*2015 reflects seasonally adjusted H1-2015 delivered supply (annualised)
0
25
50
75
100
2014 2015*
RoW
CIS
Iran
India
Europe
Canada
West Africa
Brazil
Australia

©2015, Rio Tinto, All Rights Reserved
Customers value products differently 42
Technical • Type of steel product produced • Size of blast furnace or sinter plant • Quality of metallurgical coal • Stockpile and blending capacity • Mill flexibility to vary sinter, pellet
and lump charge
Geographical • Delivered costs and availability of
fuels and fluxes • Seasonal factors • Availability, cost and quality of
alternatives ores
Commercial Purchasing strategies including: • Security of supply (contract
duration, spot purchases) • Flexibility within quality, credit or
logistics constraints • Own iron ore investments
Regulatory • Environmental exposure • Energy caps/limitations • By-products value or disposal costs

©2015, Rio Tinto, All Rights Reserved
43
Our Pilbara products are aligned to our resource base and customer needs
Product Strengths
Pilbara Blend Fines
• The most traded iron ore product globally • Base load sinter blend in Asian markets
Pilbara Blend Lump
• Avoids the costs of sintering which will increase with increasing emissions legislation
HIY Fines • Ideal chemical composition for the Asian sinter blends, with low alumina and phosphorus
• Coarse sizing aids sinter granulation
Robe Valley Fines
• Coarse sizing aids sinter granulation • Low phosphorus
Robe Valley Lump
• Low phosphorus • Avoids the costs of sintering which will
increase with increasing emissions legislation 0%
20%
40%
60%
80%
100%
China Japan Korea,Taiwan
% of volume
PBF PBL RVF RVL HIY
H1 2015 shipments by product Percentage

©2015, Rio Tinto, All Rights Reserved
0
5
10
15
20
25
30
35
40
45
PBL
0
10
20
30
40
50
60
70
80
PBF
Pilbara Blend is the industry reference iron ore
Major iron ore fines products H1 2015 (million tonnes)
Major iron ore lump products H1 2015 (million tonnes)
Rio Tinto Peer 1 Peer 2 Peer 3 Rio Tinto Peer 1 Peer 4
44
HIY
RVF RVL
Source: RTIO S&M Analysis, Company Reports

©2015, Rio Tinto, All Rights Reserved
45
Lump is an important value driver for Rio Tinto
Ave, 60.4
Ave, 73.0
0
20
40
60
80
100
Platts 62% Fe fines Plus platts lumppremium
Lump is a higher value product US$ per dry metric tonne (CFR)
• Premium lump products remain in scarce supply
• Rio Tinto is the largest supplier of lump with 40 Mt of Pilbara Blend lump and Robe Valley lump shipped in H1 2015
• The Platts lump premium averaged ~$13/dmt above the 62% Fe index over H1 2015
• Lump demand in China should outperform iron ore growth due to:
− Exit of domestic concentrate − Evolving burden practises − Increased environmental regulation
Source: Platts - H1 2015 averages

©2015, Rio Tinto, All Rights Reserved
Blending significantly reduces variability 46
Product quality - variance from mean (2014)
Stockpile stacking and reclaiming
West Angelas
Hope Downs 1
Nammuldi
Marandoo
Brockman 4
Mt Tom Price
Paraburdoo
Hope Downs 4
Brockman 2
Parker Point
EII
Mines Port Terminals Products
Alumina Silica Phosphorus 66% improvement 70% improvement 80% improvement
Ship Mine/Rail
Marra Mamba Brockman
Yandicoogina
Mesa J
Mesa A
Cape Lambert B
Cape Lambert A
PBL
PBF
PBL
PBF
PBL
PBF
RVL
RVF
HIY
HIY
Pisolite

©2015, Rio Tinto, All Rights Reserved
0
250
500
750
Asia Europe/CIS Americas ROW
Consistent supply and quality supports our marketing strategy
• Portfolio focused on long-term contracts with the world’s top 50 steel companies
• Of our 2015 volume:
− ~85% sold under term contracts − ~15% sold into the spot market, in
support of robust and transparent indices
Steel production - world’s top 50 steel mills Million tonnes
2015 Pilbara off-take by pricing mechanism Percentage of total sales
Source: World Steel, Rio Tinto Fully automated iron ore port laboratory at Cape Lambert B ensures world class analysis and sampling
Monthly 60%
Q Lagged 21%
Q Actual 4%
Spot 15%
47
With Rio Tinto supply contracts Without Rio Tinto supply contracts

©2015, Rio Tinto, All Rights Reserved
48
Australia’s delivered cost advantage to China
81%
92%
19%
8%
60%
80%
100%
Brazil Australia
FOB Freight
• A standard vessel round trip of load port, to China, and back to load port is ~3 x longer for Brazil compared to Australia (~90 days compared ~30 days)
• Australia’s proximity advantage will be more significant as oil prices recover • Capesize bulkers continue to be the preferred vessel size by the industry with 20% of
Pilbara-suited vessels now with a capacity of >200,000 tonnes
H1 2015 freight component of the Platts 62% Fe price
Dry bulk shipments
Source: Platts, BCI
0%

©2015, Rio Tinto, All Rights Reserved
49
Delivering value through management of the port to customer supply chain
135 127 64
109 162
82
0
50
100
150
200
250
300
2013 2014 H1 2015
CFR
FOB
Rio Tinto Pilbara – Shipments Million tonnes
Period contract
31%
Term voyage charter
16% Own
vessels 7%
Spot 46%
Rio Tinto Pilbara – H1 2015 freight procurement Percentage of total
• Value created through
− Price maximisation
− Supply chain efficiency
− Product placement flexibility
• Located in Singapore
− Co-located with Rio Tinto marine and other product groups
− Close to proximity to markets
− World class logistics
• Close communications with:
− Account management
− Ship scheduling and chartering
− Operations

©2015, Rio Tinto, All Rights Reserved
vs Vale4
-7.1
1.8
-20.0
-15.0
-10.0
-5.0
-
5.0
Vale RTIO
vs FMG3
-12.4
2.0
-20.0
-15.0
-10.0
-5.0
-
5.0
FMG RTIO
vs BHP2
2.1 3.4
-20.0
-15.0
-10.0
-5.0
-
5.0
BHP RTIO
Commercial excellence captures full value
(US $/wmt FOB)
1 Source: Platts, The Baltic Exchange. For the BHP comparison, the index has been adjusted to FOB basis by assuming BCI C5 (WA-Qingdao) and 8% free moisture. 2 BHP Billiton Results For the Year ended June 30 2015, page 8. 3 Implied weighted average of FMG half yearly results (Full Year (YEJ): $57/dmt CFR; First Half: $66/dmt CFR). FMG 2015 Annual Report, page 29. FMG Financial Report for half year ended 31 December 2014, page 5, 6. 4 Weighted average of Vale Quarterly Financial Results. Iron Ore fines CFR/FOB realised price (ex-RoM & Pellets). Vale's Q2 2015 Earnings Release, page 25, 27.
(US$/dmt CFR)
50
(US $/wmt CFR)
H1 2015 absolute price comparison:
62%Fe index1

©2015, Rio Tinto, All Rights Reserved
Summary 51
Supplier of choice to the Asian steel industry
Full offtake and close management of credit exposures
Value-maximising mix, aligned to customer needs and our resource base
Optimising our market placement through segmentation
Delivering value through alignment between Marine and Iron Ore
Higher average FOB price than other Pilbara producers

Technology & Innovation
Advancing productivity at Rio Tinto Greg Lilleyman, group executive, Technology & Innovation
3 September 2015 Economics & Markets Iron Ore Sales & Marketing

©2015, Rio Tinto, All Rights Reserved
T&I delivers world-class projects and step change productivity World-class projects
• Project Shaping: project shaping and strategic production planning
• Major Project Delivery: delivery of
world class projects • Capital Effectiveness: optimising
portfolio and delivering best-in-class capital efficiency
• Technical Assurance:
independent technical reviews
World-class productivity
• Productivity Generation: productivity, innovation and analytics
• Technical Discipline Leadership:
global processes and strategic technical risk management
• Flagship Projects: Asset
Management, Energy Productivity, and Advanced Technology Deployment
53
©2015, Rio Tinto, All Rights Reserved
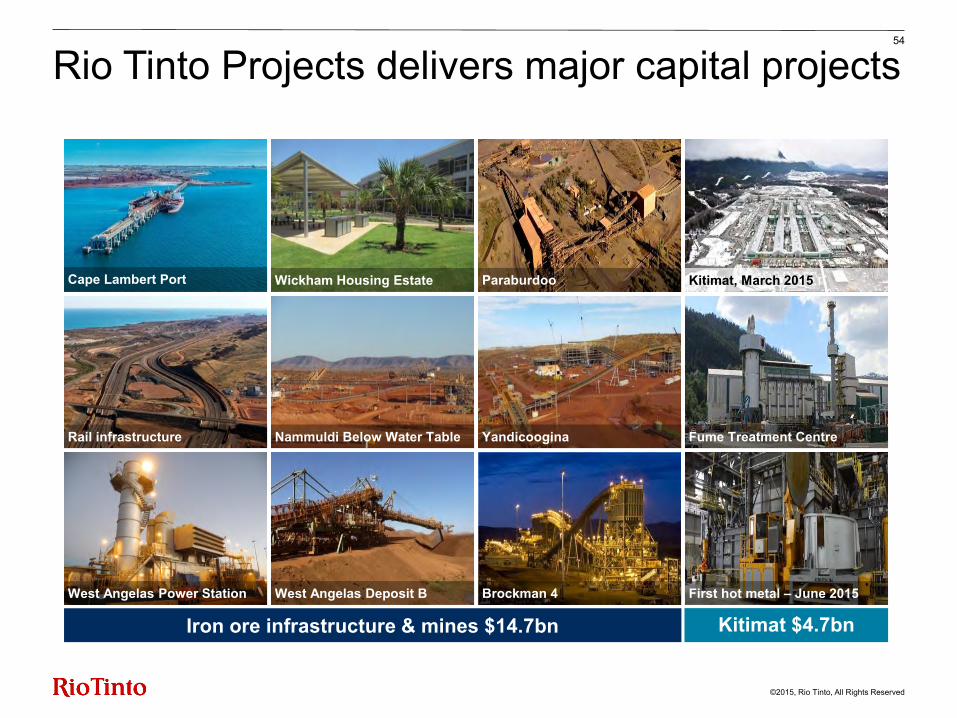
Rio Tinto Projects delivers major capital projects
Iron ore infrastructure & mines $14.7bn Kitimat $4.7bn
Cape Lambert Port
Rail infrastructure
West Angelas Power Station
Wickham Housing Estate
Nammuldi Below Water Table
West Angelas Deposit B
Paraburdoo
Yandicoogina
Kitimat, March 2015
Fume Treatment Centre
54
First hot metal – June 2015 Brockman 4

©2015, Rio Tinto, All Rights Reserved
50
75
100
125
150
175
2012 2013 2014 2015
Delivering value through optimising the Pilbara expansions
55
• Original 360 expansion included − Silvergrass − Koodaideri
• Optimised route relies on low-cost brownfield expansions - 40 Mt of brownfield mine
expansions at capital intensity of $9/t completed in 2015
• Lower capex pathway for Silvergrass
− Investment decision expected in 2016
Consistently improving capital efficiency (US$/t) Capital intensity of 220-360 Mt/a Pilbara expansion1
1 Mid-points of guidance ranges shown in graph. 2012 guidance was mid $150s/t. 2013 guidance reduced to $120-130/t which was further reduced in 2014 to $110-120/t. The latest guidance is ~$105/t.
19%
8%
5%

©2015, Rio Tinto, All Rights Reserved
Sustainable growth delivered for less
56
5.5 (0.5) (0.4) (0.3)
Original guidance Cost savings Deferrals FX Current guidance
<7.0
2015 capital expenditure guidance US$ billion

©2015, Rio Tinto, All Rights Reserved
57
Iron Ore
Pilbara mines
Push mine capacity through low-cost growth to fill expanded infrastructure
Aluminium
South of Embley
Feasibility study expected to complete towards end of 2015
Copper
OT Underground Mine
Over 80% of the value lies in the underground development
Current focus is: • Capital savings opportunities • Optimising construction
schedule
Current focus is: • Finalising the Feasibility Study • Re-stablishing Project
Financing • Obtaining final permits
Current focus is: • Completing the 360 growth
programme • Progressing AutoHaul®
• Assessing Silvergrass timing
Current focus is on three key growth projects

©2015, Rio Tinto, All Rights Reserved
Steady progress on AutoHaul® implementation
• World’s first fully autonomous long distance heavy haul railway
• Improves productivity & safety • Over 250 journeys completed in
automated mode • ~90% of locomotive modifications
complete • Wayside works are complete and
being commissioned • 86% software complete • Forecast project completion mid-
2016
58
Wayside system & communications
Autohaul® operation

©2015, Rio Tinto, All Rights Reserved
59
Delivering productivity improvements across the Group
Advanced technology deployment
World-class asset management Energy productivity
- Increased truck utilisation by 14%
- ADS availability +10% - RTVis reclassified 1 Mt
resources for blending
- Optimised asset servicing - Standardised
maintenance practice - Predictive asset health
- Transparent energy
measurement - Power optimisation - Diesel efficiencies
Reduced capital
Lower operating expenditures
Improved productivity and HSE performance
Target $200m per annum savings in the next 3 years
Targeting 2-3% energy savings
Potential value of opportunity

©2015, Rio Tinto, All Rights Reserved
Technologies developed include: • Autonomous trucks • AutoHaul®
• Advanced analytics • Resistate indicator minerals • RTVis™ / Mine Automation
System • Train load-out control system • Remote draft survey • Haul truck wheel changer • Drone applications
Advancing productivity through the Mine of the Future™ programme
60
RTVis™ Haul Truck Wheel Changer
Autonomous Haulage Truck
AutoHaul®
Drone operation
Haul Truck Wheel Changer

©2015, Rio Tinto, All Rights Reserved
Cloud based advanced neural networks
Predictive analytics
Benefits to the business
Big data analytics manages risk and reduces costs
61
900 haul trucks 4.9 Tb data per day
Target run-time (hrs)
Actual Run-time (hrs)
Deferred spend
Engine 1 RTIO 25,000 27,867 $61,927
Engine 2 RTIO 25,000 30,022 $108,475
Engine 3 RTIO 25,000 28,668 $79,228
Lower costs
Risk-based maintenance
Extends useful life
Detection of impending failure

©2015, Rio Tinto, All Rights Reserved
62
T&I delivers significant value
World-Class Projects
World-class projects
• Best-in-class project portfolio
• High-quality investment options
• Reduced capital intensity
• Strategic technical risk management
World-Class Productivity
World-class productivity
• Group-wide deployment of world class technologies and productivity platforms
• Leading the mining industry in step-change innovations
• Moving beyond industry norms

Summary Andrew Harding, chief executive, Iron Ore
3 September 2015 Economics & Markets Iron Ore Sales & Marketing Technology & Innovation

©2015, Rio Tinto, All Rights Reserved
Best performing iron ore business 64
Our priority is the safety and wellbeing of our people
Tier one assets and tier one people
Creating value through technology and innovation
Embedding a culture of constant improvement
Clear strategy that will deliver value through the cycle

Appendix
3 September 2015 Economics & Markets Iron Ore Sales & Marketing Technology & Innovation

©2015, Rio Tinto, All Rights Reserved
Mineral Resources and Ore Reserves 66
0
75
150
225
300
0
5,000
10,000
15,000
20,000
25,000
2006 2007 2008 2009 2010 2011 2012 2013 2014
Inferred Indicated Measured
Probable Proved
Production
Mineral Resources (LHS): Ore Reserves (LHS):
Production (RHS):
Pilbara resources, reserves and production
Million tonnes (LHS, dry; RHS, wet)
Mineral Resources and Ore Reserves are reported in dry metric tonnes and are reported on a 100% basis. Ownership percentages for each joint venture are provided in the Mineral Resource and Ore Reserve statements on pages 199 and 204 of the Rio Tinto 2014 Annual Report. Mineral Resources are reported exclusive of Ore Reserves. Ore Reserves are reported as product tonnes. Mineral Resources are reported on an in situ basis. Refer to the statements supporting the above estimates and relevant Competent Person references set out on slide 3 of this presentation.
• Mineral Resources position continues to support production growth
• Maintaining evaluation drilling and resource development programs
• Ore Reserves are being maintained in line with actual mine production
Drilling Metres
0
100,000
200,000
300,000
400,000
500,000
600,000
700,000
2006 2007 2008 2009 2010 2011 2012 2013 2014 2015
Actual Drill (m) Forecast Drill (m)

©2015, Rio Tinto, All Rights Reserved
67
The Pilbara - a fully integrated system • +12,500 workforce • 15 mines • 1,700kms rail • 4 port terminals • 3 power stations • 360 trucks • 39 production drills • 190 locomotives

©2015, Rio Tinto, All Rights Reserved
68
Rio Tinto share of shipments reconciliation
Calculation of Rio Tinto share of Pilbara shipments kt
Rio Tinto Iron Ore Global Sales 122,672 Less: IOC Concentrate (1,530) Less: IOC Pellets (2,806) Rio Tinto Iron Ore Pilbara Sales 118,336
Adjustment to increase Robe River Mines from 53% to 65% basis Robe River Sales - Pannawonica (Mesas J & A) 7,943 Robe River Production - West Angelas 8,272
16,215
Sales from Robe River mines (65% basis) 19,886 Adjustment to increase Robe River Mines from 53% to 65% basis 3,671
Rio Tinto Share of Pilbara Shipments (65% basis) 122,007
The Group recognises a 65 per cent share of the assets, liabilities, revenues and expenses of Robe River, with a 12 per cent non-controlling interest. The Group therefore has a
53 per cent beneficial interest in Robe River. Robe River (and therefore West Angelas and Pannawonica) is owned through two holding companies. One holding company is 100% owned, and owns 35% of Robe. The other
is 60% owned and owns 30% of Robe. Rio Tinto's effective ownership is therefore (100%*35%) + (60%*30%) or 53%. Each of the holding companies proportionally consolidates
for the part of Robe that it owns, i.e. holding company one consolidates 35% of Robe's revenue and cost; holding company two consolidates 30% of Robe's revenue and
cost. These holding companies are then fully consolidated in the Rio Tinto Group accounts, resulting in 65% of Robe's revenue, cost and assets being included in Rio Tinto's
revenue, cost, assets, etc. The 12% that is not owned by Rio Tinto is removed in the line attributable to non-controlling interests to get back to Rio's true share of 53%.