Iron Mountain Reports Fourth Quarter and Full Year...
70
FOR IMMEDIATE RELEASE Iron Mountain Reports Fourth Quarter and Full Year 2017 Results BOSTON – February 16, 2018 – Iron Mountain Incorporated (NYSE: IRM), the storage and information management services company, announces financial and operating results for the fourth quarter and full year 2017. The conference call / webcast details, earnings call presentation and supplemental financial information, which includes definitions of certain capitalized terms used in this release and reconciliations of non-GAAP measures to the appropriate GAAP measures, are available on Iron Mountain’s Investor Relations website at http://investors.ironmountain.com/company/for-investors/events-and-presentations/events/event-details/2018/Q4-2017-Iron- Mountain-Incorporated-Earnings-Conference-Call-/default.aspx or by clicking HERE. Financial Performance Highlights • Total Revenues, on a reported basis, for the fourth quarter of 2017 were $991 million, compared with $934 million in 2016. On a constant dollar (C$) basis, Total Revenues grew 4.1% compared to the prior year. For full year 2017, Total Revenues were $3.85 billion, compared with $3.51 billion in 2016, an increase of 9.0% on a C$ basis, reflecting the benefit from the acquisition of Recall Holdings Limited (“Recall”), which closed on May 2, 2016. • Income from Continuing Operations for the fourth quarter was $24 million, compared with $50 million in the fourth quarter of 2016. Income from Continuing Operations included $26 million of Recall Costs in the fourth quarter of 2017, compared with $29 million in the fourth quarter of 2016. In addition, Income from Continuing Operations in the fourth quarter of 2017included $30 million of debt extinguishment charges associated with refinancing of the company’s GBP notes. For the full year, Income from Continuing Operations was $192 million, compared with $104 million in 2016. For full year 2017, Recall Costs were $85 million in 2017 compared with $132 million in 2016 and debt extinguishment charges were $78 million in 2017 compared with $9 million in 2016. • Adjusted EBITDA, on a reported dollar basis, for the fourth quarter of 2017 was $327 million, compared with $297 million in 2016. On a C$ basis, Adjusted EBITDA increased by 8% reflecting higher margins associated with cost synergies from the Recall acquisition as well as the company’s Transformation Initiative. For the full year, Adjusted EBITDA was $1.26 billion, compared with $1.09 billion in 2016 or an increase of 15% on a C$ basis, reflecting the benefit from the Recall acquisition and Transformation Initiative. • Reported EPS - Fully Diluted from Continuing Operations for the fourth quarter was $0.09 compared with $0.19 for the fourth quarter of 2016. Reported EPS - Fully Diluted from Continuing Operations for the fourth quarter was impacted by the debt extinguishment charges referenced above. Full year, Reported EPS - Fully Diluted from Continuing Operations was $0.71 compared with $0.41 in 2016. The full year increase in Reported EPS was driven by improved margins and lower Recall Costs in 2017, partially offset by debt extinguishment charges. • Adjusted EPS for the fourth quarter was $0.29, compared with $0.26 in 2016, an increase of 12%. For full year 2017, Adjusted EPS was $1.16 compared with $1.07 in 2016. Adjusted EPS for the fourth quarter of 2017 reflects an amortization charge of approximately $0.02 per share associated with an adjustment to Recall customer relationship value. Prior to the amortization adjustment, Adjusted EPS for the fourth quarter of 2017 would have been $0.31. The structural tax rate was 19.7%, compared with 18.5% a year ago. • Net Income for the fourth quarter was $21 million compared with $50 million in 2016. For the full year, Net Income was $185 million compared with $107 million in 2016.
Transcript of Iron Mountain Reports Fourth Quarter and Full Year...

FOR IMMEDIATE RELEASE
Iron Mountain Reports Fourth Quarter and Full Year 2017 Results BOSTON – February 16, 2018 – Iron Mountain Incorporated (NYSE: IRM), the storage and information management services company, announces financial and operating results for the fourth quarter and full year 2017. The conference call / webcast details, earnings call presentation and supplemental financial information, which includes definitions of certain capitalized terms used in this release and reconciliations of non-GAAP measures to the appropriate GAAP measures, are available on Iron Mountain’s Investor Relations website at http://investors.ironmountain.com/company/for-investors/events-and-presentations/events/event-details/2018/Q4-2017-Iron-Mountain-Incorporated-Earnings-Conference-Call-/default.aspx or by clicking HERE. Financial Performance Highlights • Total Revenues, on a reported basis, for the fourth quarter of 2017 were $991 million, compared with $934
million in 2016. On a constant dollar (C$) basis, Total Revenues grew 4.1% compared to the prior year. For full year 2017, Total Revenues were $3.85 billion, compared with $3.51 billion in 2016, an increase of 9.0% on a C$ basis, reflecting the benefit from the acquisition of Recall Holdings Limited (“Recall”), which closed on May 2, 2016.
• Income from Continuing Operations for the fourth quarter was $24 million, compared with $50 million in the fourth quarter of 2016. Income from Continuing Operations included $26 million of Recall Costs in the fourth quarter of 2017, compared with $29 million in the fourth quarter of 2016. In addition, Income from Continuing Operations in the fourth quarter of 2017included $30 million of debt extinguishment charges associated with refinancing of the company’s GBP notes. For the full year, Income from Continuing Operations was $192 million, compared with $104 million in 2016. For full year 2017, Recall Costs were $85 million in 2017 compared with $132 million in 2016 and debt extinguishment charges were $78 million in 2017 compared with $9 million in 2016.
• Adjusted EBITDA, on a reported dollar basis, for the fourth quarter of 2017 was $327 million, compared with $297 million in 2016. On a C$ basis, Adjusted EBITDA increased by 8% reflecting higher margins associated with cost synergies from the Recall acquisition as well as the company’s Transformation Initiative. For the full year, Adjusted EBITDA was $1.26 billion, compared with $1.09 billion in 2016 or an increase of 15% on a C$ basis, reflecting the benefit from the Recall acquisition and Transformation Initiative.
• Reported EPS - Fully Diluted from Continuing Operations for the fourth quarter was $0.09 compared with $0.19 for the fourth quarter of 2016. Reported EPS - Fully Diluted from Continuing Operations for the fourth quarter was impacted by the debt extinguishment charges referenced above. Full year, Reported EPS - Fully Diluted from Continuing Operations was $0.71 compared with $0.41 in 2016. The full year increase in Reported EPS was driven by improved margins and lower Recall Costs in 2017, partially offset by debt extinguishment charges.
• Adjusted EPS for the fourth quarter was $0.29, compared with $0.26 in 2016, an increase of 12%. For full year 2017, Adjusted EPS was $1.16 compared with $1.07 in 2016. Adjusted EPS for the fourth quarter of 2017 reflects an amortization charge of approximately $0.02 per share associated with an adjustment to Recall customer relationship value. Prior to the amortization adjustment, Adjusted EPS for the fourth quarter of 2017 would have been $0.31. The structural tax rate was 19.7%, compared with 18.5% a year ago.
• Net Income for the fourth quarter was $21 million compared with $50 million in 2016. For the full year, Net Income was $185 million compared with $107 million in 2016.

• FFO (Normalized) per share was $0.53 for the fourth quarter, compared with $0.50 in 2016. For the full year, FFO (Normalized) per share was $2.13, compared with $1.98 in 2016.
• AFFO was $154 million for the fourth quarter compared with $170 million in 2016, a decrease of 9%. The decrease was primarily driven by timing of maintenance capital expenditures relative to the fourth quarter in 2016. For the full year, AFFO increased 12% to $752 million, compared with $669 million in 2016.
Guidance The company issued 2018 full-year guidance based on 2018 constant dollar budget rates; details are available on Page 7 of the Supplemental Financial Information. Forward Looking Statement Safe Harbor Statement Under the Private Securities Litigation Reform Act of 1995: This release contains certain forward-looking statements within the meaning of the Private Securities Litigation Reform Act of 1995 and other securities laws and is subject to the safe-harbor created by such Act. Forward-looking statements include, but are not, limited to, our financial performance outlook and statements concerning our operations, economic performance, financial condition, goals, beliefs, future growth strategies, investment objectives, plans and current expectations, such as 2018 guidance, and statements about our investment and other goals. These forward-looking statements are subject to various known and unknown risks, uncertainties and other factors. When we use words such as "believes," "expects," "anticipates," "estimates" or similar expressions, we are making forward-looking statements. Although we believe that our forward-looking statements are based on reasonable assumptions, our expected results may not be achieved, and actual results may differ materially from our expectations. In addition, important factors that could cause actual results to differ from expectations include, among others: (i) our ability to remain qualified for taxation as a real estate investment trust for U.S. federal income tax purposes; (ii) the adoption of alternative technologies and shifts by our customers to storage of data through non-paper based technologies; (iii) changes in customer preferences on and demand for our storage and information management services; (iv) the cost to comply with current and future laws, regulations and customer demands relating to data security and privacy issues, as well as fire and safety standards; (v) the impact of litigation or disputes that may arise in connection with incidents in which we fail to protect our customers' information and the cost of complying with and improving data security; (vi) changes in the political and economic environments in the countries in which our international subsidiaries operate and changes in the global political climate; (vii) our ability or inability to manage growth, expand internationally, complete acquisitions on satisfactory terms and to close pending acquisitions and to integrate acquired companies efficiently; (viii) the impact of service interruptions or equipment damage, and cost of power on our data center operations; (ix) our ability or inability to satisfy our debt obligations and restrictions in our debt instruments; (x) changes in the amount of our capital expenditures and our ability to invest in accordance with plan; (xi) changes in the cost of our debt; (xii) the impact of alternative, more attractive investments on dividends; (xiii) the cost or potential liabilities associated with real estate necessary for our business; (xiv) the performance of business partners upon whom we depend for technical assistance and shared services; (xv) other trends in competitive or economic conditions affecting our financial condition or results of operations not presently contemplated; and (xvi) other risks described more fully in our filings with the Securities and Exchange Commission, including under the caption “Risk Factors” in our periodic reports or incorporated therein. You should not rely upon forward-looking statements except as statements of our present intentions and of our present expectations, which may or may not occur. Except as required by law, we undertake no obligation to release publicly the result of any revision to these forward-looking statements that may be made to reflect events or circumstances after the date hereof or to reflect the occurrence of unanticipated events. About Iron Mountain Iron Mountain Incorporated (NYSE: IRM), founded in 1951, is the global leader for storage and information management services. Trusted by more than 225,000 organizations around the world, and with a real estate network of more than 85 million square feet across more than 1,400 facilities in over 50 countries, Iron Mountain stores and protects billions of valued assets, including critical business information, highly sensitive data, and cultural and historical artifacts. Providing solutions that include information management, digital transformation, secure storage, secure destruction, as well as data centers, cloud services and art storage and logistics, Iron Mountain helps customers lower cost and risk, comply with regulations, recover from disaster, and enable a more digital way of working. Visit www.ironmountain.com for more information.

Investor Relations Contacts: Melissa Marsden Faten Freiha Senior Vice President, Investor Relations Director, Investor Relations [email protected] [email protected] (617) 535-8595 (617) 535-8404
Media Contacts: Christian T. Potts Kaitlyn Rawlett Senior Manager, Corporate Communications Weber Shandwick [email protected] [email protected] (617) 535-8721 (212) 445-8082

Q4 and Full Year 2017Financial Results
February 16, 2018

Safe Harbor Language and Reconciliation of Non-GAAP Measures
2
This presentation contains certain forward-looking statements within the meaning of the Private Securities Litigation Reform Act of 1995 and other securities laws and is subject to the safe-harbor created by such Act. Forward-looking statements include, but are not limited to, our financial performance outlook and statements concerning our operations, economic performance, financial condition, goals, beliefs, future growth strategies, investment objectives, plans and current expectations such as 2018 guidance, and statements about our investment and other goals. These forward-looking statements are subject to various known and unknown risks, uncertainties and other factors. When we use words such as "believes," "expects," "anticipates," "estimates" or similar expressions, we are making forward-looking statements. Although we believe that our forward-looking statements are based on reasonable assumptions, our expected results may not be achieved, and actual results may differ materially from our expectations. In addition, important factors that could cause actual results to differ from expectations include, among others: (i) our ability to remain qualified for taxation as a real estate investment trust for U.S. federal income tax purposes ("REIT"); (ii) the adoption of alternative technologies and shifts by our customers to storage of data through non-paper based technologies; (iii) changes in customer preferences, and demand for our storage and information management services; (iv) the cost to comply with current and future laws, regulations and customer demands relating to data security and privacy issues, as well as fire and safety standards; (v) the impact of litigation or disputes that may arise in connection with incidents in which we fail to protect our customers' information; (vi) changes in the price for our storage and information management services relative to the cost of providing such storage and information management services; (vii) changes in the political and economic environments in the countries in which our international subsidiaries operate and changes in the global political climate; (viii) our ability or inability to manage growth, expand internationally, complete acquisitions on satisfactory terms, to close pending acquisitions and to integrate acquired companies efficiently; (ix) changes in the amount of our growth and maintenance capital expenditures and our ability to invest according to plan; (x) our ability to comply with our existing debt obligations and restrictions in our debt instruments or to obtain additional financing to meet our working capital needs; (xi) the impact of service interruptions or equipment damage and the cost of power on our data center operations; (xii) changes in the cost of our debt; (xiii) the impact of alternative, more attractive investments on dividends; (xiv) the cost or potential liabilities associated with real estate necessary for our business; (xv) the performance of business partners upon whom we depend for technical assistance or management expertise outside the United States; (xvi) other trends in competitive or economic conditions affecting our financial condition or results of operations not presently contemplated; and (xvii) other risks described more fully in our filings with the Securities and Exchange Commission, including under the caption “Risk Factors” in our periodic reports, or incorporated therein. You should not rely upon forward-looking statements except as statements of our present intentions and of our present expectations, which may or may not occur. Except as required by law, we undertake no obligation to release publicly the result of any revision to these forward-looking statements that may be made to reflect events or circumstances after the date hereof or to reflect the occurrence of unanticipated events.
Reconciliation of Non-GAAP Measures:
Throughout this presentation, Iron Mountain will discuss (1) Adjusted EBITDA, (2) Adjusted Earnings per Share (“Adjusted EPS”), (3) Funds from Operations (“FFO Nareit”), (4) FFO(Normalized) and (5) Adjusted Funds from Operations (“AFFO”). These measures do not conform to accounting principles generally accepted in the United States (“GAAP”). These non-GAAP measures are supplemental metrics designed to enhance our disclosure and to provide additional information that we believe to be important for investors to consider in addition to, butnot as a substitute for, other measures of financial performance reported in accordance with GAAP, such as operating income, income (loss) from continuing operations, net income (loss) orcash flows from operating activities from continuing operations (as determined in accordance with GAAP). The reconciliation of these measures to the appropriate GAAP measure, as requiredby Regulation G under the Securities Exchange Act of 1934, as amended, and the definitions are included in Supplemental Financial Information. Iron Mountain does not provide areconciliation of non-GAAP measures that it discusses as part of its annual guidance or long term outlook because certain significant information required for such reconciliation is not availablewithout unreasonable efforts or at all, including, most notably, the impact of exchange rates on Iron Mountain’s transactions, loss or gain related to the disposition property, plant andequipment (including of real estate) and other income or expense. Without this information, Iron Mountain does not believe that a reconciliation would be meaningful.
Selected metrics definitions are available in the Appendix.

Data Center Growth Enhances 2020 Plan and Accelerates Long-term Growth
3
80%
Developed PortfolioIncludes North America
And Western Europe
20%
Growth PortfolioEmerging Markets = 18%
Data Center = 1%
Adjacent Businesses = 1%
2% 10%
3.5%+ Average Internal Adj. EBITDA Growth
Q4’17 2020
Revenue Mix
Adjusted EBITDA Growth
70%
Developed PortfolioIncludes North America
And Western Europe
30%
Growth PortfolioEmerging Markets = 20%
Data Center = 7%
Adjacent Businesses = 3%
3% 10%
5%+ Average Internal Adj. EBITDA Growth
Revenue Mix
Adjusted EBITDA Growth
Note: Emerging Markets is Other International, excluding Australia and New Zealand

Full Year in Line with Expectations and Q4 Demonstrating Solid Momentum
4
2017 performance supported by storage rental durability and margin growth• 2017 Revenue, Adjusted EBITDA and AFFO in line with expectations • 2017 Adjusted EBITDA up 16% and 180 bps margin improvement, driven by Recall synergies and transformation • AFFO growth of 12% for 2017, supporting the dividend per share growth of 7% in Q4
2018 Guidance • Business fundamentals remain consistent; expecting 3% to 3.5% internal storage rental revenue growth • C$ Growth of: 7% to 9% Total Revenue; 12% to 16% Adjusted EBITDA; and 5% to 13% AFFO• Includes data center acquisitions closed or expected to close in Q1 2018 and new revenue recognition standards
Continued strength in operating metrics • Strong internal storage rental revenue growth of 4.2% in Q4 2017 and 3.9% for the year. • Total internal growth of 2.5% in Q4 2017, highest total internal growth reported in 12 quarters• Continued worldwide internal volume growth of 1.1% on TTM basis and improved pricing
Note: Definition of Non-GAAP and other measures and reconciliations of Non-GAAP to GAAP measures can be found in the Supplemental Financial Information

5Continued Execution of Strategic PlanDriving Growth and Enhancing Margins in Developed Markets • Achieved 3.4% internal storage rental revenue growth in Q4 with modest net internal volume growth• Enhanced revenue management efforts yielding higher margin
Continued Strong Internal Growth in Emerging Markets(1)
• Achieved 9.0% internal storage rental growth in Q4 2017 and 7.2% for the full year • 18%+ of total revenue(2) in Q4 2017; expanded presence through organic growth and acquisitions• Acquisitions closed during the year with purchase price >$87 mm and ~7x stabilized EBITDA
Invested in faster growing businesses: Data Centers and ABOs• Data center transactions expand existing platform – new reportable segment• Expanding entertainment services – now reported with art storage in Corporate & Other
(1) Emerging Markets is Other International, excluding Australia and New Zealand. (2) Percentage of total revenue is based on 2014 C$ foreign currency rates at time goal was established

Accelerating Growth through Data Center Expansion
6
Transformative Transaction: IO Data Centers Snapshot
• 62.4 MW of capacity (90% leased) with expansion potential of 77 MW
• Purchase price of $1.34B at closing, which includes $25mm of earn out for customer expansion• ~15x Adjusted EBITDA multiple on post-integration basis, including synergies of $9 mm
• 550+ customers, no single tenant represents more than 10% of revenue
• 3.1 years WALE(1) and ~98% annual customer retention rate
(1) Weighted Average Lease Expiration. Weighted by monthly recurring revenue as of 9/30/17(2) Pro forma pending acquisition of Credit Suisse data centers, which is expected to close in Q1 2018
Global Data Center Business(2)
• 90 MW+ global data center capacity with expansion potential of 160 MW+
• Data Center business expected to be ~10% of total EBITDA by 2020
• Expected to provide ~$200 mm of revenue and ~$100 mm of normalized EBITDA in 2018
Ohio
New Jersey Campus
Scottsdale
Phoenix Campus

Disciplined Capital Allocation Designed to Maximize Returns
Lease Adjusted Net Debt to EBITDAR(1)
7
Dividend as % of AFFO
6.0X 4.0X
4.5X
5.0X
85% 65%
70%75%
Optimal Range(2)
Sources of capital: • Growth in operating cash flow
• Secured and unsecured borrowings
• Real estate capital recycling
• ATM program or other equity
ROIC hurdle rate above WACC
5.0X
Optimal Range
4.5X
(1) See definition in the appendix of the Supplemental Financial Information (2) Most restrictive Credit Facility covenant is lease adjusted net debt/EBITDAR of 6.5x.
2020 Target
~73%
5.5X
81%
2018 Guidance

Strong 2017 Performance 8
$ in Millions 2017 Guidance Ranges
R$
2017
Actuals R$
2017
Actuals C$(1)
Revenue $3,750 - $3,840 $3,846 $3,788
Adjusted EBITDA(1) $1,250 - $1,280 $1,260 $1,240
AFFO(1) $715 - $760 $752 $740
• Revenue, Adjusted EBITDA and AFFO results in-line with guidance• ~0.5% FX benefit on Revenue and Adjusted EBITDA growth • Adjusted EBITDA on a C$ basis impacted by shared services costs, Russia and Ukraine
disposition, core M&A integration costs back-end loaded, and natural disasters
• Results driven by consistent trends in core business• Strong internal storage rental revenue – driven by revenue management • Adjusted SG&A as percentage of revenue improved to 23.9%, reflecting Recall synergies
and transformation savings
(1) Reconciliations for Adjusted EBITDA and AFFO to their respective GAAP measures can be found in the Supplemental Financial Information on Page 15 and Page 17, respectively

Solid Worldwide Financial Performance 9
$ in MM (R$) Q4-16 Q4-17 R$ C$ Internal Growth
FY 2016
FY 2017
R$ C$ Internal Growth
Revenue $934 $991 6.1% 4.1% 2.5% $3,511 $3,846 9.5% 9.0% 2.3%
Storage $567 $614 8.4% 6.5% 4.2% $2,143 $2,378 11.0% 10.5% 3.9%
Service $368 $377 2.6% 0.4% (0.1)% $1,369 $1,468 7.3% 6.6% (0.3)%
Adjusted Gross Profit(1) $525 $570 8.5% $1,956 $2,181 11.5%
Adjusted Gross Profit Margin(1) 56.2% 57.5% 130 bps 55.7% 56.7% 100 bps
Income from ContinuingOperations $50 $24 n/a $104 $192 84.6%
Adjusted EBITDA(2) $297 $327 10.1% 7.9% $1,087 $1,260 15.9% 15.3%
Adjusted EBITDA Margin 31.7% 32.9% 120 bps 31.0% 32.8% 180 bps
Net Income $50 $21 n/a $107 $185 72.9%
AFFO(2) $170 $154 (9.2)% $669 $752 12.4%
Dividend/Share $0.550 $0.5875 6.8% $2.005 $2.2375 11.6%
Fully Diluted Shares Outstanding 265 272 2.6% 247 267 7.9%
% Growth % Growth
(1) Reflects adjusted gross profit, excluding Recall Costs; reconciliation can be found in the Supplemental Financial Information on Page 5(2) Reconciliation for Adjusted EBITDA and AFFO to their respective GAAP measures can be found in the Supplemental Financial Information on Pages 15 and 17,
respectively

Steady Internal Growth in Q4 Developed
Markets(1)
Other
International(2) Total
Internal Growth
Storage 3.4% 6.8% 4.2%
Service 0.1% 0.2% (0.1)%
Total 2.1% 4.2% 2.5%
% of Total Revenue by Segment
Storage 46.1% 12.9% 61.9%
Service 29.7% 7.6% 38.1%
10
(1) Represents North America Records and Information Management, North America Data Management and Western Europe reporting segments(2) Other International represents emerging markets, Australia and New Zealand
Quarterly segment operating performance can be found on Page11 of the Supplemental Financial Information
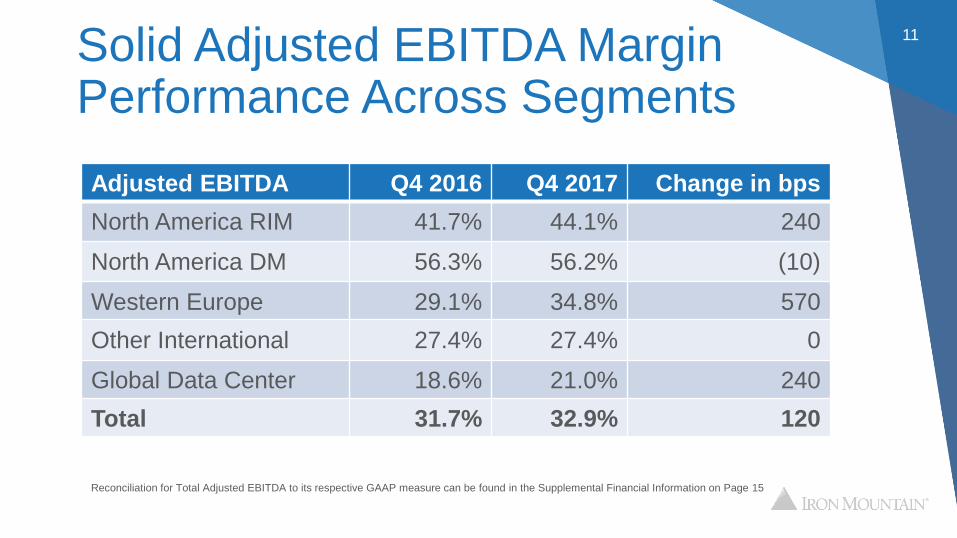
Solid Adjusted EBITDA Margin Performance Across Segments
11
Adjusted EBITDA Q4 2016 Q4 2017 Change in bps
North America RIM 41.7% 44.1% 240
North America DM 56.3% 56.2% (10)
Western Europe 29.1% 34.8% 570Other International 27.4% 27.4% 0
Global Data Center 18.6% 21.0% 240Total 31.7% 32.9% 120
Reconciliation for Total Adjusted EBITDA to its respective GAAP measure can be found in the Supplemental Financial Information on Page 15

2018 Guidance Demonstrates Drives Strong Cash Flow and Dividend Coverage
12
• Expected internal storage rental revenue growth of 3% - 3.5% and total internal revenue growth of 2% - 3% • Revenue recognition standards: expect to benefit Revenue by $7 mm and Adjusted EBITDA by $25 mm to $30 mm. No benefit is
expected for Adjusted EPS or AFFO. • Interest expense is expected to be $415 mm to $425 mm and cash taxes to be $65 mm to $75 mm• Expect structural tax rate in the range of 18% - 20%• Assumes full-year weighted average shares outstanding of 287 mm • Real Estate and Non-Real Estate maintenance CapEx and Non-Real Estate Investments expected to be $155 to $165 mm • Real Estate Investment and Innovation of $150 mm to $160 mm • Optimizing real estate portfolio through capital recycling opportunities • Business acquisitions (~$150 mm) plus acquisitions of customer relationships and inducements (~$60 mm) • Data Center growth investment expected to be ~$185 mm plus $100 mm for Credit Suisse
$ in MM except Earnings per Share
2018
C$ Guidance
2018
C$ Growth
Revenue $4,160 - $4,260 7% - 9%
Adjusted EBITDA $1,435 - $1,485 12% - 16%
Adjusted EPS Fully Diluted $1.00 - $1.20 (15)% - 2%
AFFO $805 - $865 5% - 13%
Note: Iron Mountain does not provide a reconciliation of non-GAAP measures that it discusses as part of its annual guidance or long term outlook because certain significant information required for such reconciliation is not available without unreasonable efforts or at all, including, most notably, the impact of exchange rates on Iron Mountain’s transactions, loss or gain related to the disposition of real estate and
other income or expense. Without this information, Iron Mountain does not believe that a reconciliation would be meaningful.

Increasing Cash Available for Dividends and Discretionary Investments
13
$155
$185
$100
$100
$490
$150
Real Estate, Growth,
and Innovation(2)
Data Center
Growth
Credit Suisse
Incremental
Capital
for
Discretionary
Investments
Growth
Investments(3)Sources(3)
(1) Customer inducements and acquisitions of customer relationships are not deducted from AFFO as they represent discretionary growth investment (2) Includes core growth racking and excludes Northern Virginia Data Center development under capital lease (3) Excludes the capital associated with IO Data Centers acquisition, which closed on January 10. Represents midpoint of ranges. Note: Iron Mountain does not provide a reconciliation of non-GAAP measures that it discusses as part of its annual guidance or long term outlook because certain significant information required for such reconciliation is not available without unreasonable efforts or at all, including, most notably, the impact of exchange rates on Iron Mountain’s transactions, loss or gain related to the
disposition of real estate and other income or expense. Without this information, Iron Mountain does not believe that a reconciliation would be meaningful.
Base Acquisitions
$ in MM
Adjusted EBITDA 1,435$ 1,485$
Non-cash stock compensation / other (including non-cash permanent withdrawal fees)
45 45
Adjusted EBITDA and non-cash expenses 1,480$ 1,530$
Less: Amortization of capitalized sales commissions 20 20 Cash interest and normalized cash taxes 500 480 Total maintenance CapEx and non-real estate investment 165 155 Customer inducements and acquisition of customer relationships (1) 60 60Cash available for dividends and investments 735$ 815$
Expected common dividend to be declared 675 675Cash available for core and discretionary investments 60$ 140$
2018E

2020 Plan(1): Profitable, Sustainable Growth14
(1) Updated to reflect 2017 actuals and 2018 Guidance, including adoption of revenue recognition standards and expansion of data center business. 2020 ranges at 2018 C$ rates. (2) Assumes Real Estate and Non-Real Estate Maintenance CapEx and Non-Real Estate Investment of 4% of Total Revenue for 2020.(3) Assumes 287 million shares outstanding for 2018 increasing to 295 to 300 million shares outstanding in 2020, reflecting long-term incentive comp and potential issuances under existing ATM program.
Lease Adjusted Leverage Ratio – Year-End
5.5x~5.0x
2018E 2020E
$1,260
$1,680 –$1,760
2017 Actual 2020E
$3,846
$4,600 –$4,750
2017 Actual 2020E
Worldwide Revenue ($ in MM)
Adjusted EBITDA ($ in MM)
$2.35$2.54
2018E 2020E
Projected Minimum Dividend per Share(3)
$752
$1,000 -$1,070
2017 Actual 2020E
AFFO Growth(2) ($ in MM)

Key Takeaways 15
Quarter punctuated by strong total revenue growth and 4.2% internal storage rental revenue growth
Driving continued improvement in Adjusted EBITDA margins
Continuing to execute against our strategic plan to shift revenue mix to faster growing businesses
On track with deleveraging and dividend payout ratio goals, while growing our dividend per share
Accelerating growth in Data Center enhances 2020 plan and creates long-term growth platform
Prudent capital management to drive further shareholder returns
Appendix

Storage Continues to Drive Growth 17
10.5% 1.2%
0.5%
49.1%
0.6%
18.7%
9.5%
0.4%
4.9%
0.1%
4.5%
Records Management
Secure Shredding
Adjacent Businesses
Data Management
Data Center
Digital Solutions
Q4’17
Service Revenue38% of total revenues28% gross profit margin
Q4’17
Storage Revenue62% of total revenues 76% gross profit margin
19% of adjusted gross profit
81% of adjusted gross profit

Developed and Other International RM Volume
Developed Markets
18
Other International
(1) Q2-17 cube growth has been adjusted to reflect required regulatory divestments in IRM’s legacy Australian business.(2) Represents CuFt acquired at close. CuFt activity post close flows through new sales, new volume from existing customers, destructions, outperms / terms as appropriate.
Acquisitions/ dispositions reflects business acquisition volume net of dispositions required by Recall transaction and sale of Russia / Ukraine business.(3) Acquisitions of customer relationships are included in new sales as the nature of these transactions is similar to new customer wins.
(2) (3)
10.5%
5.2%
80.4%
Q2-16
87.0%
-3.7%-4.3%
9.9%
4.8%
80.2%
Q1-16
14.6%
-3.3%-4.2%
9.5%
4.5%
8.2%
-3.5%-2.7%
7.8%
3.0%
-0.2%
Q2-17
3.0%
-3.6%-2.8%
7.6%
3.3%
-1.4%
Q1-17
61.7%
-5.3%
-4.2%
11.2%
5.4%
54.6%
Q4-16
11.4%
-5.3%
-4.4%
Q4-17
6.0%
-3.2%-2.8%
7.6%
2.6%
75.1%
Q3-17
4.3%5.9%
67.5%
Q3-16
86.9%
-4.5%
-4.6%
1.8%
Q2-17
4.4%
-4.5%
-1.6%
2.2%
0.3%
Q3-17
4.1%
-4.3%
-1.6%
0.5%
15.7%
-1.7%
-5.2%
5.2%
Q4-16
2.2% 2.1%
15.6%
17.1%
-1.7%
-5.0%
5.3%
Q3-16
16.0%
0.2%
2.0%
-4.3%
4.0%
-1.7%
Q4-17
0.3%
16.3%
Q2-16
2.4%2.1%
1.8%
Q1-17
5.2%
-5.2%
-1.7%
16.5%
2.0%0.3%
15.3%
-1.7%
-4.9%
5.2%
2.2%
14.6%
Q1-16
0.8%
-1.7%
-4.9%
5.0%
2.2%
(1)

www.ironmountain.com
Supplemental Financial Information
Fourth Quarter 2017Unaudited

www.ironmountain.com Selected metric definitions are available in the Appendix
Safe Harbor Statement
2
Safe Harbor Statement Under the Private Securities Litigation Reform Act of 1995:
This presentation contains certain forward-looking statements within the meaning of the Private Securities Litigation Reform Act of 1995 and other securities laws and is subject to the safe-harbor created by such Act. Forward-looking statements include, but are not limited to, our financial performance outlook and statements concerning our operations, economic performance, financial condition, goals, beliefs, future growth strategies, investment objectives, plans and current expectations such as 2018 guidance, and statements about our investment and other goals. These forward-looking statements are subject to various known and unknown risks, uncertainties and other factors. When we use words such as "believes," "expects," "anticipates," "estimates" or similar expressions, we are making forward-looking statements. Although we believe that our forward-looking statements are based on reasonable assumptions, our expected results may not be achieved, and actual results may differ materially from our expectations. In addition, important factors that could cause actual results to differ from expectations include, among others: (i) our ability to remain qualified for taxation as a real estate investment trust for U.S. federal income tax purposes ("REIT"); (ii) the adoption of alternative technologies and shifts by our customers to storage of data through non-paper based technologies; (iii) changes in customer preferences, and demand for our storage and information management services; (iv) the cost to comply with current and future laws, regulations and customer demands relating to data security and privacy issues, as well as fire and safety standards; (v) the impact of litigation or disputes that may arise in connection with incidents in which we fail to protect our customers' information; (vi) changes in the price for our storage and information management services relative to the cost of providing such storage and information management services; (vii) changes in the political and economic environments in the countries in which our international subsidiaries operate and changes in the global political climate; (viii) our ability or inability to manage growth, expand internationally, complete acquisitions on satisfactory terms, to close pending acquisitions and to integrate acquired companies efficiently; (ix) changes in the amount of our growth and maintenance capital expenditures and our ability to invest according to plan; (x) our ability to comply with our existing debt obligations and restrictions in our debt instruments or to obtain additional financing to meet our working capital needs; (xi) the impact of service interruptions or equipment damage and the cost of power on our data center operations; (xii) changes in the cost of our debt; (xiii) the impact of alternative, more attractive investments on dividends; (xiv) the cost or potential liabilities associated with real estate necessary for our business; (xv) the performance of business partners upon whom we depend for technical assistance or management expertise outside the United States; (xvi) other trends in competitive or economic conditions affecting our financial condition or results of operations not presently contemplated; and (xvii) other risks described more fully in our filings with the Securities and Exchange Commission, including under the caption “Risk Factors” in our periodic reports, or incorporated therein. You should not rely upon forward-looking statements except as statements of our present intentions and of our present expectations, which may or may not occur. Except as required by law, we undertake no obligation to release publicly the result of any revision to these forward-looking statements that may be made to reflect events or circumstances after the date hereof or to reflect the occurrence of unanticipated events.
Reconciliation of Non-GAAP Measures:
Throughout this presentation, Iron Mountain will discuss (1) Adjusted EBITDA, (2) Adjusted Earnings per Share (“Adjusted EPS”), (3) Funds from Operations (“FFO Nareit”), (4) FFO (Normalized) and (5) Adjusted Funds from Operations (“AFFO”). These measures do not conform to accounting principles generally accepted in the United States (“GAAP”). These non-GAAP measures are supplemental metrics designed to enhance our disclosure and to provide additional information that we believe to be important for investors to consider in addition to, but not as a substitute for, other measures of financial performance reported in accordance with GAAP, such as operating income, income (loss) from continuing operations, net income (loss) or cash flows from operating activities from continuing operations (as determined in accordance with GAAP). The reconciliation of these measures to the appropriate GAAP measure, as required by Regulation G under the Securities Exchange Act of 1934, as amended, and the definitions are included later in this document (see Table of Contents). Iron Mountain does not provide a reconciliation of non-GAAP measures that it discusses as part of its annual guidance or long term outlook because certain significant information required for such reconciliation is not available without unreasonable efforts or at all, including, most notably, the impact of exchange rates on Iron Mountain’s transactions, loss or gain related to the disposition property, plant and equipment (including of real estate) and other income or expense. Without this information, Iron Mountain does not believe that a reconciliation would be meaningful.

www.ironmountain.com Selected metric definitions are available in the Appendix
All figures except per share and facility counts in 000s unless noted
All figures in reported dollars unless noted
Figures may not foot due to rounding
Table of Contents
3
Investor Relations Contacts:
Faten Freiha, 617-535-8404Director, Investor [email protected]
Melissa Marsden, 617-535-8595Senior Vice President, Investor [email protected]
Section I - Company Profile 4
Section II - Financial Highlights and Guidance 5 - 7
Section III - Operating Metrics 8 - 12
Section IV - Balance Sheets, Statements of Operations and Reconciliations 13 - 20
Section V - Storage Net Operating Income and EBITDA, and Service Business EBITDA 21 - 23
Section VI - Real Estate Metrics 24 - 29
Section VII - Data Center Customer and Portfolio Metrics 30
Section VIII - Debt Schedule and Capitalization 31 - 32
Section IX - Capital Expenditures and Investments 33 - 35
Section X - Components of Value 37
Section XI - Appendix and Definitions 38 - 49

www.ironmountain.com Selected metric definitions are available in the Appendix
Product
Company Profile
Iron Mountain is a global leader in enterprise storage with a high-return, real estate-based business model, yielding annualized revenue of approximately $4.0 billion. The company provides storage and information management services to a high-quality, diversified customer base across numerous industries and government organizations. As of 12/31/17, Iron Mountain served more than 225,000 customers, including approximately 95% of the Fortune 1000, and no single customer accounted for more than 1% of revenues, or 2% of volume. Iron Mountain provides storage and information management services in 53 countries on six continents, storing approximately 680 million cubic feet of records in a portfolio of more than 1,400 facilities totaling more than 85 million square feet of space. The company employs more than 24,000 people.
Iron Mountain is organized as a REIT, and its financial model is based on the recurring nature of its storage rental revenues and resulting storage net operating income (NOI). Supported by consistent storage rental revenues, the company generates predictable, low-volatility growth in key metrics such as storage NOI and AFFO. This fundamental financial characteristic provides stability through economic cycles.
Iron Mountain has the opportunity to invest capital at attractive returns both domestically and internationally. The company believes that there remains a large un-vended opportunity that can support sustained storage volumes in developed markets such as North America and high growth opportunities in emerging markets where customers are in early stages of outsourcing their storage of physical documents.
Diversification of Total Revenues(For the Year Ended 12/31/2017)
4
Countries Served
(1) Includes South Africa and United Arab Emirates.(2) Includes Fulfillment Services, Information Governance and Digital Solutions, Technology
Escrow Services, Consulting, Entertainment Services, Fine Art Storage, Consumer Storage and other ancillary services.
7%8%
18%
66%1%
10%14%
66% 10%
Asia
Latin America
Europe
North America
Data Center
Shredding
Data Protection
Records Mgmt
Other
Strong Track Record of Storage Rental Revenue Growth $2,378
’04 ’16’05 ’06 ’08’07 ’15’14’10’09 ’11 ’12’03’02’01’00’99’98’97’96’95’94’93’92’91 `17’90’89 ’13
(2)
Region
(1)
28-year Compound Annual Growth Rate
16.3%
62%
38%
Storage
Service
Mix
M
Section
VIII
Section
IXSection
VII
Section
VISection
VSection
IVSection
IIISection
XSection
IISection
ISection
XI

www.ironmountain.com Selected metric definitions are available in the Appendix
Financial Highlights
5
(1) Please see slide 21 for Storage Net Operating Income reconciliation.(2) Q4 2016 AFFO has been revised to reflect the new AFFO definition introduced in the Q4 2016 Supplemental Financial Information.
Section
VIII
Section
IXSection
VII
Section
VISection
VSection
IVSection
IIISection
XSection
IISection
ISection
XI
Q4 2016 Q4 2017 % Change Full Year 2016 Full Year 2017 % Change
Storage Rental $566,547 $613,948 8.4% $2,142,905 $2,377,557 11.0%Service 367,646 377,287 2.6% 1,368,548 1,468,021 7.3%
Total Revenues $934,193 $991,235 6.1% $3,511,453 $3,845,578 9.5%
Gross Profit $517,978 $565,235 9.1% $1,943,676 $2,160,260 11.1%Gross Margin 55.4% 57.0% 160 bps 55.4% 56.2% 80 bps
Gross Profit $517,978 $565,234 9.1% $1,943,676 $2,160,260 11.1%Less: Recall Costs included in Cost of Sales 7,175 4,474 (37.6%) 11,963 20,493 71.3%Adjusted Gross Profit $525,153 $569,708 8.5% $1,955,639 $2,180,753 11.5%Adjusted Gross Profit Margin 56.2% 57.5% 130 bps 55.7% 56.7% 100 bps
Adjusted Storage and Service Profit and Margin
Adjusted Storage Gross Profit $424,478 $463,560 9.2% $1,605,665 $1,783,533 11.1%Adjusted Storage Gross Margin 74.9% 75.5% 60 bps 74.9% 75.0% 10 bpsAdjsuted Service Gross Profit $100,675 $106,148 5.4% $349,974 $397,220 13.5%Adjusted Service Gross Margin 27.4% 28.1% 70 bps 25.6% 27.1% 150 bps
Storage Net Operating Income (NOI)(1) $468,615 $506,422 8.1% $1,759,575 $1,967,866 11.8%
SG&A Costs $250,545 $264,997 5.8% $988,332 $984,965 (0.3%)Less: Recall Costs Included in SG&A $21,897 $21,833 (0.3%) $119,981 $64,408 (46.3%)Adjusted SG&A Costs $228,648 $243,164 6.3% $868,351 $920,557 6.0%Adjusted SG&A as a % of Revenue 24.5% 24.5% 0 bps 24.7% 23.9% -80 bps
Income (Loss) from Continuing Operations $49,800 $24,349 (51.1%) $103,880 $191,723 84.6%Adjusted EBITDA $296,505 $326,544 10.1% $1,087,288 $1,260,196 15.9%Adjusted EBITDA Margin 31.7% 32.9% 120 bps 31.0% 32.8% 180 bps
Reported EPS - Fully Diluted from Continuing Operations $0.19 $0.09 (51.6%) $0.41 $0.71 73.2%Adjusted EPS $0.26 $0.29 11.5% $1.07 $1.16 8.4%
Net Income (Loss) $49,525 $21,478 (56.6%) $107,233 $185,432 72.9%
AFFO(2) $169,848 $154,156 (9.2%) $669,242 $752,269 12.4%
Ordinary Dividends per Share $0.550 $0.588 6.8% $2.005 $2.238 11.6%
Weighted Average Fully-diluted Shares Outstanding 264,506 271,498 2.6% 247,267 266,845 7.9%

www.ironmountain.com Selected metric definitions are available in the Appendix
2017 Performance vs. Guidance
6
(1) Iron Mountain does not provide a reconciliation of non-GAAP measures that it discusses as part of its annual guidance or long term outlook because certain significant information required for such reconciliation is not available without unreasonable efforts or at all, including, most notably, the impact of exchange rates on Iron Mountain’s transactions, loss or gain related to the disposition of real estate and other income or expense. Without this information, Iron Mountain does not believe that a reconciliation would be meaningful.
(2) AFFO 2017 Guidance excludes capital expenditures associated with the integration of Recall.
Financial Performance Outlook$MM (except per share items)
Note: • Maintenance CapEx and non-real estate investment of ~$146mm, compared with our guidance of $150mm.• Business and acquisitions of customer relationships of ~$206mm, compared with our guidance of $210mm (excluding Data Center acquisitions).
Section
VIII
Section
IXSection
VII
Section
VISection
VSection
IVSection
IIISection
XSection
IISection
ISection
XI
2017 R$ GuidanceFY 2017 Results
Actual R$% Growth R$
2017 Actuals at 2017
C$ Rate% Growth C$
Revenue $3,750 - $3,840 $3,846 9.5% $3,788 9.0%
Adjusted EBITDA $1,250 -$1,280 $1,260 15.9% $1,240 15.3%Adjusted EPS $1.15 - $1.25 $1.16 8.4% $1.14 7.5%AFFO(2) $715 - $760 $752 12.4% $740 11.6%
www.ironmountain.com Selected metric definitions are available in the Appendix
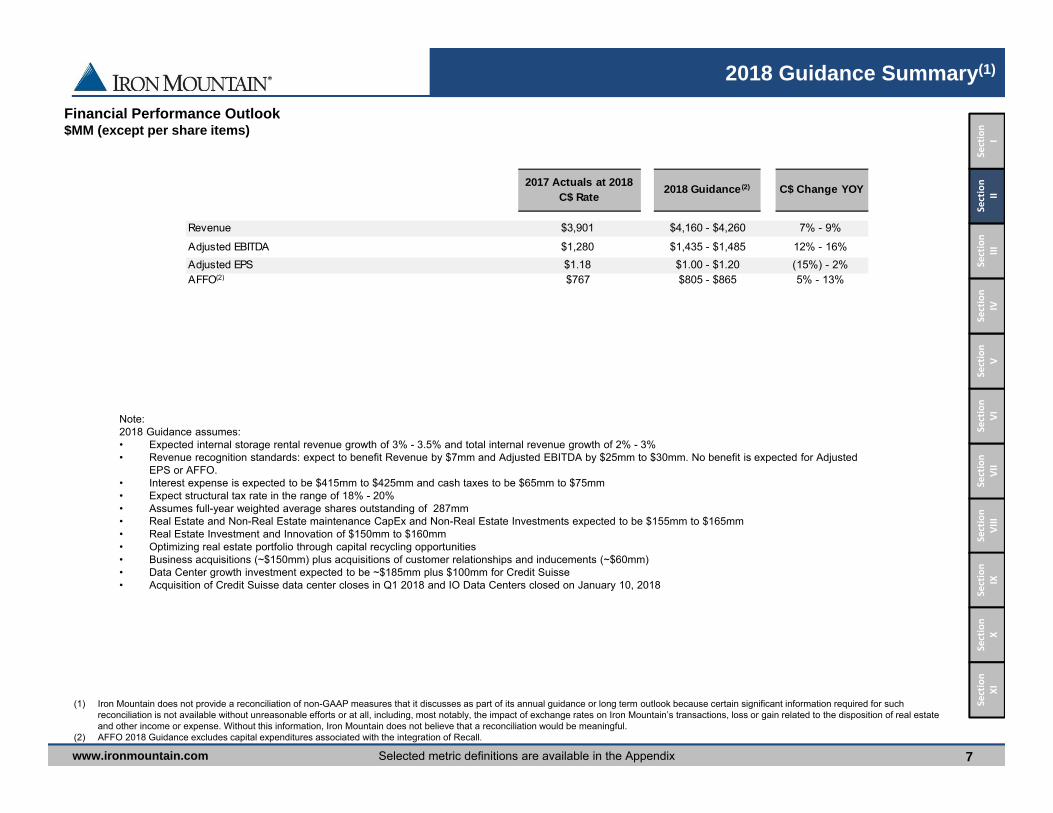
2018 Guidance Summary(1)
7
(1) Iron Mountain does not provide a reconciliation of non-GAAP measures that it discusses as part of its annual guidance or long term outlook because certain significant information required for such reconciliation is not available without unreasonable efforts or at all, including, most notably, the impact of exchange rates on Iron Mountain’s transactions, loss or gain related to the disposition of real estate and other income or expense. Without this information, Iron Mountain does not believe that a reconciliation would be meaningful.
(2) AFFO 2018 Guidance excludes capital expenditures associated with the integration of Recall.
Financial Performance Outlook$MM (except per share items)
Note: 2018 Guidance assumes:• Expected internal storage rental revenue growth of 3% - 3.5% and total internal revenue growth of 2% - 3% • Revenue recognition standards: expect to benefit Revenue by $7mm and Adjusted EBITDA by $25mm to $30mm. No benefit is expected for Adjusted
EPS or AFFO. • Interest expense is expected to be $415mm to $425mm and cash taxes to be $65mm to $75mm• Expect structural tax rate in the range of 18% - 20%• Assumes full-year weighted average shares outstanding of 287mm • Real Estate and Non-Real Estate maintenance CapEx and Non-Real Estate Investments expected to be $155mm to $165mm • Real Estate Investment and Innovation of $150mm to $160mm • Optimizing real estate portfolio through capital recycling opportunities • Business acquisitions (~$150mm) plus acquisitions of customer relationships and inducements (~$60mm) • Data Center growth investment expected to be ~$185mm plus $100mm for Credit Suisse • Acquisition of Credit Suisse data center closes in Q1 2018 and IO Data Centers closed on January 10, 2018
Section
VIII
Section
IXSection
VII
Section
VISection
VSection
IVSection
IIISection
XSection
IISection
ISection
XI
2017 Actuals at 2018
C$ Rate2018 Guidance(2) C$ Change YOY
Revenue $3,901 $4,160 - $4,260 7% - 9%
Adjusted EBITDA $1,280 $1,435 - $1,485 12% - 16% Adjusted EPS $1.18 $1.00 - $1.20 (15%) - 2% AFFO(2) $767 $805 - $865 5% - 13%

www.ironmountain.com Selected metric definitions are available in the Appendix
Year-over-Year Revenue Growth
8
Service
Storage Rental
18.2%
81.8%
Service
Storage Rental
Full Year 2017 RevenueFull Year 2017 Gross
Profit
61.8%
38.2%
Revenue Growth Rates
Reported 8.4% 2.6% 6.1% 11.0% 7.3% 9.5%
Less: Impact of FX Rate Changes and Adjustments 1.9% 2.2% 2.0% 0.5% 0.7% 0.5%
Constant Currency 6.5% 0.4% 4.1% 10.5% 6.6% 9.0%
Less: Impact of Acquisitions and Dispositions 2.3% 0.5% 1.6% 6.6% 6.9% 6.7%
Internal Revenue Growth Rate 4.2% (0.1)% 2.5% 3.9% (0.3)% 2.3%
Q4 2017 Full Year 2017
Storage Rental Revenue
Service Revenue
Total Revenue
Storage Rental Revenue
Service Revenue
Total Revenue
Section
VIII
Section
IXSection
VII
Section
VISection
VSection
IVSection
IIISection
XSection
IISection
ISection
XI

www.ironmountain.com Selected metric definitions are available in the Appendix
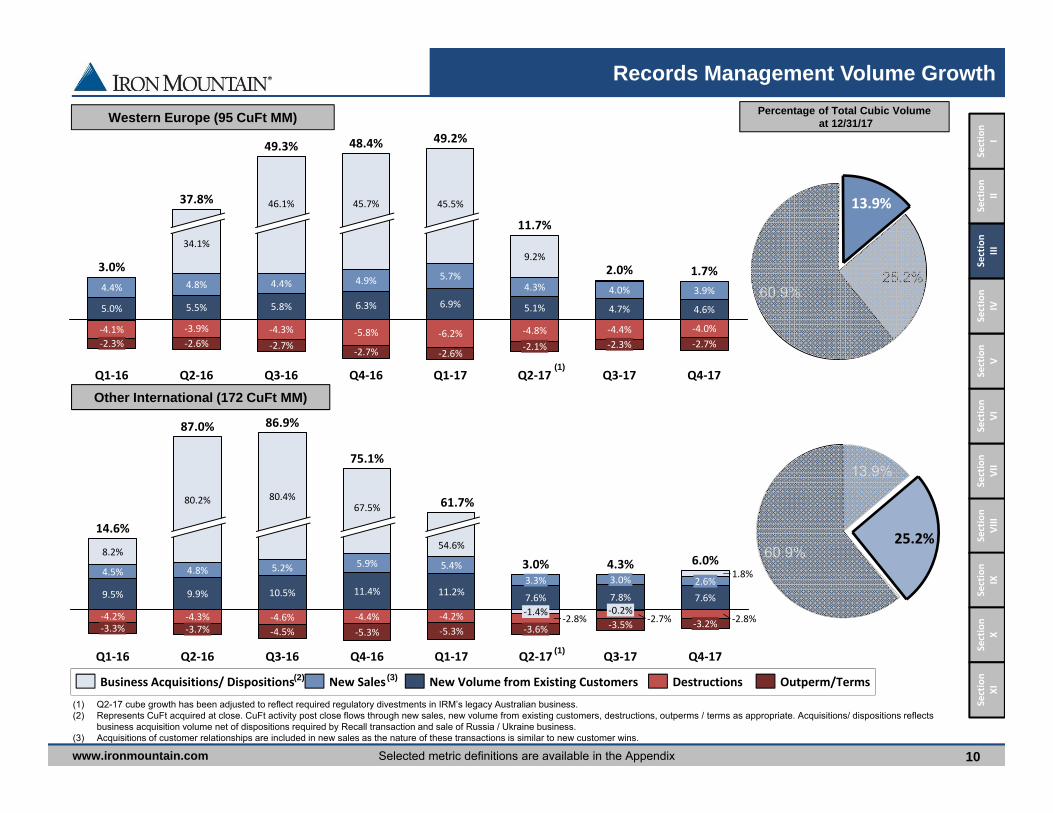
Records Management Volume Growth
9
‐4.8% ‐4.8% ‐4.9% ‐5.0% ‐5.0% ‐4.1% ‐4.0% ‐3.9%
‐2.0% ‐2.1% ‐2.2% ‐2.3% ‐2.4%‐2.1% ‐2.1% ‐2.1%
5.8% 6.0% 6.2% 6.3% 6.4% 5.2% 5.0% 4.9%
2.6% 2.6% 2.7% 2.8% 3.0%2.4% 2.3% 2.2%
0.1%
1.6% 1.7%0.6%
Q3‐17
1.4%
Q2‐17
2.4%
Q4‐17
1.0%
Q1‐17
25.0%
23.1%
Q4‐16
26.3%24.6%
Q3‐16
29.2%
27.4%
Q2‐16
27.6%
25.9%
Q1‐16
3.2%
Outperm/TermsDestructionsNew Volume from Existing CustomersNew Sales Business Acquisitions / Dispositions
Total Iron Mountain (684 CuFt MM)
North America (417 CuFt MM)
(3)
(1) Q2-17 cube growth has been adjusted to reflect required regulatory divestments in IRM’s legacy Australian business.(2) Represents CuFt acquired at close. CuFt activity post close flows through new sales, new volume from existing customers, destructions, outperms / terms as appropriate. Acquisitions/ dispositions reflects
business acquisition volume net of dispositions required by Recall transaction and sale of Russia / Ukraine business.(3) Acquisitions of customer relationships are included in new sales as the nature of these transactions is similar to new customer wins.
25.2%
13.9%
60.9%
(2)
Q4‐17
0.0%‐1.5%
‐4.3%
3.9%
1.6%0.3%
Q3‐17
‐1.5%
‐4.3%
4.0%
1.6%0.3%
Q2‐17
0.1%0.3%
‐1.5%
‐4.4%
4.2%
1.6%0.3%
Q1‐17
11.0%
‐1.6%
‐5.0%
5.0%
1.9%
10.7%
Q4‐16
10.6%
‐1.5%
‐5.1%
5.0%
1.6%10.5%
Q3‐16
11.8%
‐1.5%
‐5.1%
5.2%
1.9%
11.4%
Q2‐16
11.6%
‐1.6%
‐5.1%
5.1%
1.7%
11.5%
Q1‐16
0.5%
‐1.7%
‐5.0%
5.0%
1.8%0.3%
25.2%
13.9%
60.9%
Other International
Western Europe
North America
Percentage of Total Cubic Volume
at 12/31/17
1.6% 1.7% 1.8% 1.7% 1.9% 1.4% 1.3% 1.1%Internal Growth %
(1)
(1)
0.0%
Section
VIII
Section
IXSection
VII
Section
VISection
VSection
IVSection
IIISection
XSection
IISection
ISection
XI
www.ironmountain.com Selected metric definitions are available in the Appendix
Records Management Volume Growth
10
3.6%
49.3%
‐2.7%‐4.3%
5.8%
46.1%
Q2‐16
37.8%
‐2.6%‐3.9%
5.5%
4.8%
34.1%
Q1‐16
3.0%
‐2.3%‐4.1%
5.0%
4.4%
Q4‐17
1.7%4.4%
‐4.0%
4.6%
3.9%
Q3‐17
2.0%
‐2.3%
45.7%
‐2.7%
Q3‐16
‐4.4%
4.7%
4.0%
Q2‐17
11.7%
‐2.1%‐4.8%
5.1%
4.3%
9.2%
Q1‐17
49.2%
‐2.6%
‐6.2%
6.9%
5.7%
45.5%
Q4‐16
48.4%
‐2.7%
‐5.8%
6.3%
4.9%
Business Acquisitions/ Dispositions Outperm/TermsDestructionsNew Volume from Existing CustomersNew Sales
Western Europe (95 CuFt MM)
Other International (172 CuFt MM)
80.4%
86.9%
‐4.5%
10.5%
5.2%
Q2‐16
9.9%
4.8%
‐4.6%‐3.7%‐4.3%
87.0%
1.8%2.6%7.6%
‐2.8%‐3.2%
6.0%
Q4‐17Q3‐17
4.3%
‐3.5% ‐2.7%
7.8%
3.0%
‐0.2%
Q2‐17
3.0%
‐3.6%‐2.8%
7.6%
3.3%
‐1.4%
Q1‐17
61.7%
‐5.3%‐4.2%
11.2%
5.4%
54.6%
Q4‐16
75.1%
‐5.3%‐4.4%
11.4%
5.9%
67.5%
Q3‐16
80.2%
Q1‐16
14.6%
‐3.3%‐4.2%
9.5%
4.5%
8.2%
(3)
(1) Q2-17 cube growth has been adjusted to reflect required regulatory divestments in IRM’s legacy Australian business.(2) Represents CuFt acquired at close. CuFt activity post close flows through new sales, new volume from existing customers, destructions, outperms / terms as appropriate. Acquisitions/ dispositions reflects
business acquisition volume net of dispositions required by Recall transaction and sale of Russia / Ukraine business.(3) Acquisitions of customer relationships are included in new sales as the nature of these transactions is similar to new customer wins.
(2)
13.9%
60.9%25.2%
13.9%
60.9%25.2%
Percentage of Total Cubic Volume
at 12/31/17
(1)
(1)
Section
VIII
Section
IXSection
VII
Section
VISection
VSection
IVSection
IIISection
XSection
IISection
ISection
XI

www.ironmountain.com Selected metric definitions are available in the Appendix
Quarterly Operating Performance
11
Section
VIII
Section
IXSection
VII
Section
VISection
VSection
IVSection
IIISection
XSection
IISection
ISection
XI
Q4 Results % Growth
By Reporting Segment
Q4 2016 Q4 2017 Reported -Impact of FX Rate
Changes and
Adjustments
= Constant
Currency-
Impact of
Acquisitions and
Dispositions
= Internal
Growth
NA Records and Information Management Business
Storage Rental $297,463 $309,322 4.0% 0.5% 3.5% (0.2)% 3.7%Service 207,108 210,263 1.5% 0.6% 0.9% (0.1)% 1.0%
Total Revenues $504,571 $519,585 3.0% 0.6% 2.4% (0.2)% 2.6%Adjusted EBITDA & Margin 210,463 41.7% 228,978 44.1%
NA Data Management Business
Storage Rental $67,968 $68,782 1.2% (0.6)% 1.8% 0.0% 1.8%Service 32,483 31,117 (4.2)% 2.2% (6.4)% 0.0% (6.4)%
Total Revenues $100,451 $99,899 (0.6)% 0.3% (0.9)% 0.0% (0.9)%Adjusted EBITDA & Margin 56,534 56.3% 56,173 56.2%
Western European Business
Storage Rental $71,733 $79,091 10.3% 7.6% 2.7% 0.0% 2.7%Service 47,619 52,631 10.5% 8.2% 2.3% 0.0% 2.3%
Total Revenues $119,352 $131,722 10.4% 7.9% 2.5% 0.0% 2.5%Adjusted EBITDA & Margin 34,741 29.1% 45,890 34.8%
Other International Business
Storage Rental $114,098 $128,283 12.4% 3.3% 9.1% 2.3% 6.8%Service 74,324 75,228 1.2% 2.8% (1.6)% (1.8)% 0.2%
Total Revenues $188,422 $203,511 8.0% 3.1% 4.9% 0.7% 4.2%Adjusted EBITDA & Margin 51,691 27.4% 55,835 27.4%
Global Data Center Business
Storage Rental $5,510 $12,289 123.0% 0.0% 123.0% 102.5% 20.5%Service 649 573 (11.6)% (0.0)% (11.6)% 21.6% (33.2)%
Total Revenues $6,159 $12,862 108.8% 0.0% 108.8% 94.0% 14.8%Adjusted EBITDA & Margin 1,144 18.6% 2,701 21.0%
Corporate and Other Business
Storage Rental $9,775 $16,181 65.5% 0.0% 65.5% 59.2% 6.3%Service 5,463 7,475 36.8% 0.0% 36.8% 58.0% (21.2)%
Total Revenues $15,238 $23,656 55.2% 0.0% 55.2% 58.7% (3.5)%Adjusted EBITDA (58,068) (63,033)
Total
Storage Rental $566,547 $613,948 8.4% 1.9% 6.5% 2.3% 4.2%Service 367,646 377,287 2.6% 2.2% 0.4% 0.5% (0.1)%
Total Revenues $934,193 $991,235 6.1% 2.0% 4.1% 1.6% 2.5%Adjusted EBITDA & Margin 296,505 31.7% 326,544 32.9%

www.ironmountain.com Selected metric definitions are available in the Appendix
Full Year Operating Performance
12
Section
VIII
Section
IXSection
VII
Section
VISection
VSection
IVSection
IIISection
XSection
IISection
ISection
XI
Full Year Results % Growth
By Reporting Segment
Full Year 2016 Full Year 2017 Reported -Impact of FX Rate
Changes and
Adjustments
= Constant
Currency-
Impact of
Acquisitions and
Dispositions
= Internal
Growth
NA Records and Information Management Business
Storage Rental $1,150,646 $1,221,495 6.2% 0.2% 6.0% 2.8% 3.2%Service 780,053 828,851 6.3% 0.3% 6.0% 4.9% 1.1%
Total Revenues $1,930,699 $2,050,346 6.2% 0.2% 6.0% 3.6% 2.4%Adjusted EBITDA & Margin 775,717 40.2% 884,158 43.1%
NA Data Management Business
Storage Rental $264,148 $276,416 4.6% (0.2)% 4.8% 2.4% 2.4%Service 128,666 125,224 (2.7)% 0.6% (3.3)% 4.5% (7.8)%
Total Revenues $392,814 $401,640 2.2% 0.1% 2.1% 3.1% (1.0)%Adjusted EBITDA & Margin 224,522 57.2% 223,324 55.6%
Western European Business
Storage Rental $275,659 $303,205 10.0% (1.9)% 11.9% 9.6% 2.3%Service 178,552 198,537 11.2% (1.3)% 12.5% 11.1% 1.4%
Total Revenues $454,211 $501,742 10.5% (1.6)% 12.1% 10.1% 2.0%Adjusted EBITDA & Margin 137,506 30.3% 160,024 31.9%
Other International Business
Storage Rental $393,005 $493,118 25.5% 3.1% 22.4% 15.8% 6.6%Service 259,511 291,737 12.4% 2.8% 9.6% 10.3% (0.7)%
Total Revenues $652,516 $784,855 20.3% 3.0% 17.3% 13.6% 3.7%Adjusted EBITDA & Margin 169,042 25.9% 226,430 28.8%
Global Data Center Business
Storage Rental $22,026 $35,839 62.7% 0.0% 62.7% 33.7% 29.0%Service 2,223 1,855 (16.6)% 0.0% (16.6)% 8.2% (24.8)%
Total Revenues $24,249 $37,694 55.4% 0.0% 55.4% 31.4% 24.0%Adjusted EBITDA & Margin 6,212 25.6% 11,275 29.9%
Corporate and Other Business
Storage Rental $37,421 $47,484 26.9% 0.0% 26.9% 22.9% 4.0%Service 19,543 21,817 11.6% 0.0% 11.6% 20.3% (8.7)%
Total Revenues $56,964 $69,301 21.7% 0.0% 21.7% 22.0% (0.3)%Adjusted EBITDA (225,711) (245,015)
Total
Storage Rental $2,142,905 $2,377,557 11.0% 0.5% 10.5% 6.6% 3.9%Service 1,368,548 1,468,021 7.3% 0.7% 6.6% 6.9% (0.3)%
Total Revenues $3,511,453 $3,845,578 9.5% 0.5% 9.0% 6.7% 2.3%Adjusted EBITDA & Margin 1,087,288 31.0% 1,260,196 32.8%

www.ironmountain.com Selected metric definitions are available in the Appendix
Consolidated Balance Sheets
13
(1) Includes redeemable noncontrolling interests of $55mm and $91mm as of December 31, 2016 and December 31, 2017, respectively.
Section
VIII
Section
IXSection
VII
Section
VISection
VSection
IVSection
IIISection
XSection
IISection
ISection
XI
ASSETS 12/31/2016 12/31/2017
Current Assets:Cash and Cash Equivalents $236,484 $925,699Accounts Receivable, Net 691,249 835,742Other Current Assets 184,374 188,874
Total Current Assets 1,112,107 1,950,315Property, Plant and Equipment:
Property, Plant and Equipment 5,535,783 6,251,100Less: Accumulated Depreciation (2,452,457) (2,833,421)
Property, Plant and Equipment, Net 3,083,326 3,417,679Other Assets, Net:
Goodw ill 3,905,021 4,070,267Other Non-current Assets, Net: 1,386,346 1,534,141
Total Other Assets, Net 5,291,367 5,604,408Total Assets $9,486,800 $10,972,402
LIABILITIES AND EQUITY
Current Liabilities:Current Portion of Long-term Debt $172,975 $146,300Other Current Liabilities 873,582 1,183,873
Total Current Liabilities 1,046,557 1,330,173Long-term Debt, Net of Current Portion 6,078,206 6,896,971
Other Long-term Liabilities(1) 425,366 446,416Total Long-term Liabilities 6,503,572 7,343,387
Total Liabilities $7,550,129 $8,673,560
EquityTotal Stockholders' Equity $1,936,547 $2,297,438Noncontrolling Interests 124 1,404
Total Equity 1,936,671 2,298,842Total Liabilities and Equity $9,486,800 $10,972,402

www.ironmountain.com Selected metric definitions are available in the Appendix
Consolidated Statements of Operations
14
(1) Includes $7.2mm and $4.5mm of Recall Costs in Q4 2016 and Q4 2017, respectively, and $12.0mm and $20.5mm of Recall Costs in full year 2016 and full year 2017, respectively.(2) Includes $21.9mm and $21.8mm of Recall Costs in Q4 2016 and Q4 2017, respectively, and $120.0mm and $64.4mm of Recall Costs in full year 2016 and full year 2017, respectively.
Section
VIII
Section
IXSection
VII
Section
VISection
VSection
IVSection
IIISection
XSection
IISection
ISection
XI
Q4 2016 Q4 2017 % Change Full Year 2016 Full Year 2017 % Change
Revenues:
Storage Rental $566,547 $613,948 8.4% $2,142,905 $2,377,557 11.0%Service 367,646 377,287 2.6% 1,368,548 1,468,021 7.3%
Total Revenues $934,193 $991,235 6.1% $3,511,453 $3,845,578 9.5%
Operating Expenses:
Cost of Sales (excluding Depreciation and Amortization)(1) 416,215 426,000 2.4% 1,567,777 1,685,318 7.5%Selling, General and Administrative(2) 250,545 264,997 5.8% 988,332 984,965 (0.3)%Depreciation and Amortization 125,430 141,057 12.5% 452,326 522,376 15.5%Intangible Impairments - 3,011 n/a - 3,011 n/aLoss (Gain) on Disposal/Write-Dow n of PP&E (excluding Real Estate), Net 2,543 1,765 (30.6)% 1,412 799 (43.4)%
Total Operating Expenses 794,733 836,830 5.3% 3,009,847 3,196,469 6.2%
Operating Income (Loss) 139,460 154,405 10.7% 501,606 649,109 29.4%
Interest Expense, Net 85,434 88,565 3.7% 310,662 353,575 13.8%Foreign Currency Transaction (Gain) / Loss 5,077 15,348 n/a 20,413 43,248 n/aDebt Extinguishment Expense - 30,070 n/a 9,283 78,368 n/aOther Expense (Income), Net 2,217 263 (88.1%) 14,604 (42,187) n/a
Income (Loss) before Provision (Benefit) for Income Taxes and Gain on Sale of Real Estate 46,732 20,159 (56.9)% 146,644 216,105 47.4%
Provision (Benefit) for Income Taxes (1,213) (3,550) n/a 44,944 25,947 (42.3)%(Gain) Loss on Sale of Real Estate, Net of Tax (1,855) (640) (65.5)% (2,180) (1,565) (28.2)%Income (Loss) from Continuing Operations 49,800 24,349 (51.1)% 103,880 191,723 84.6%
Income (Loss) from Discontinued Operations, Net of Tax (275) (2,871) n/a 3,353 (6,291) n/aNet Income (Loss) 49,525 21,478 (56.6)% 107,233 185,432 72.9%
Less: Net Income (Loss) Attributable to Noncontrolling Interests 587 (1,242) n/a 2,409 1,611 (33.1)%Net Income (Loss) Attributable to Iron Mountain Incorporated $48,938 $22,720 (53.6)% $104,824 $183,821 75.4%
Earnings (Losses) per Share - Basic:
Income (Loss) from Continuing Operations $0.19 $0.09 (52.6)% $0.41 $0.71 73.2%Total Income (Loss) from Discontinued Operations $0.00 ($0.01) n/a $0.01 ($0.02) n/aNet Income (Loss) Attributable to Iron Mountain Incorporated $0.19 $0.08 (57.9)% $0.43 $0.69 60.5%
Earnings (Losses) per Share - Diluted:
Income (Loss) from Continuing Operations $0.19 $0.09 (52.6)% $0.41 $0.71 73.2%Total Income (Loss) from Discontinued Operations $0.00 ($0.01) n/a $0.01 ($0.02) n/aNet Income (Loss) Attributable to Iron Mountain Incorporated $0.19 $0.08 (57.9)% $0.42 $0.69 64.3%
Weighted Average Common Shares Outstanding - Basic 263,528 270,321 2.6% 246,178 265,898 8.0%Weighted Average Common Shares Outstanding - Diluted 264,506 271,498 2.6% 247,267 266,845 7.9%

www.ironmountain.com Selected metric definitions are available in the Appendix 15
Reconciliation of Income (Loss) from Continuing
Operations to Adjusted EBITDA
(1) Net of tax provision of $0.1mm and $(0.6)mm in Q4 2016 and Q4 2017, and includes $0.1mm and $0.0mm in full year 2016 and full year 2017, respectively.(2) Includes realized and unrealized FX (gains) losses.(3) Other Expense (Income), Net for full year 2017 includes a gain of approximately $38.9 million recognized in Q2 2017 associated with the sale of our business in Russia and Ukraine.
Section
VIII
Section
IXSection
VII
Section
VISection
VSection
IVSection
IIISection
XSection
IISection
ISection
XI
Q4 2016 Q4 2017 % Change Full Year 2016 Full Year 2017 % Change
Income from Continuing Operations $49,800 $24,349 (51.1)% $103,880 $191,723 84.6%
Add / (Deduct): Interest Expense, Net 85,434 88,565 3.7% 310,662 353,575 13.8%Provision (Benefit) for Income Taxes (1,213) (3,550) n/a 44,944 25,947 (42.3)%(Gain) Loss on Sale of Real Estate, Net of Tax(1) (1,855) (640) (65.5)% (2,180) (1,565) (28.2)%Debt Extinguishment Expense - 30,070 n/a 9,283 78,368 n/aForeign Currency Transaction Losses (Gains)(2) 5,077 15,348 n/a 20,413 43,248 n/aOther Expense (Income), Net(3) 2,217 263 (88.2)% 14,604 (42,187) n/aRecall Costs 29,072 26,307 (9.5)% 131,944 84,901 (35.7)%Intangible Impairments - 3,011 n/a - 3,011 n/aLoss (Gain) on Disposal/Write-Dow n of PP&E (excluding Real Estate), Net 2,543 1,765 (30.6)% 1,412 799 (43.4)%Depreciation and Amortization 125,430 141,057 12.5% 452,326 522,376 15.5%
Adjusted EBITDA $296,505 $326,544 10.1% $1,087,288 $1,260,196 15.9%

www.ironmountain.com Selected metric definitions are available in the Appendix 16
Reconciliation of Reported Earnings per Share to
Adjusted Earnings per Share
(1) The difference between our effective tax rate and our structural tax rate (or adjusted effective tax rate) for the three and twelve months ended December 31, 2016 and 2017, respectively, is primarily due to (i) the reconciling items above, which impact our reported income (loss) from continuing operations before provision (benefit) for income taxes but have an insignificant impact on our reported provision (benefit) for income taxes and (ii) other discrete tax items. Our structural tax rate for purposes of the calculation of Adjusted EPS was 18.5% for the three and twelve months ended December 31, 2016 and 19.7% for the three and twelve months ended December 31, 2017. The Tax Impact of Reconciling Items and Discrete Tax Items is calculated using the current quarter’s estimate of the annual structural tax rate for both the three and full year periods. This may result in the current period adjustment plus prior reported quarterly adjustments to not sum to the full year adjustment.
Section
VIII
Section
IXSection
VII
Section
VISection
VSection
IVSection
IIISection
XSection
IISection
ISection
XI
Q4 2016 Q4 2017 % Change Full Year 2016 Full Year 2017 % Change
Reported EPS - Fully Diluted from Continuing Operations $0.19 0.09$ (52.6)% 0.41$ 0.71$ 73.2%
Add (Deduct):Gain on Sale of Real Estate, Net of Tax (0.01) (0.00) (0.01) (0.01) Intangible Impairments - 0.01 - 0.01 Income (Loss) Attributable to Noncontrolling Interests - - 0.01 0.01 Debt Extinguishment Expense - 0.11 0.04 0.29 Foreign Currency Transaction Losses (Gains) 0.02 0.06 0.08 0.16 Other Expense (Income), Net 0.01 0.00 0.06 (0.16) Loss (Gain) on Disposal/Write-Dow n of PP&E (excluding Real Estate), Net 0.01 0.01 0.01 0.00 Recall Costs 0.11 0.10 0.53 0.32 Tax Impact of Reconciling Items and Discrete Tax Items(1) (0.06) (0.08) (0.06) (0.19)
Adjusted EPS - Fully Diluted from Continuing Operations 0.26$ 0.29$ 11.5% 1.07$ 1.16$ 8.4%

www.ironmountain.com Selected metric definitions are available in the Appendix 17
Reconciliation of Net Income to FFO & AFFO
(1) Includes realized and unrealized FX (gains) losses.(2) Calculated as actual cash taxes less current tax provision and other one-time cash tax items, to reflect actual cash tax (impact)/benefit to AFFO.(3) Our structural tax rate for purposes of calculation of Adjusted EPS and FFO (Normalized) was 19.7% for the three and twelve months ended December 31, 2017. For 2016, the structural tax rate was 18.5% for
the three and twelve months ended December 31, 2016. The Tax Impact of Reconciling Items and Discrete Tax Items is calculated using the current quarter’s estimate of the annual structural tax rate for both the three months and full year periods. This may result in the current period adjustment plus prior reported quarterly adjustments to not sum to the full year adjustment.
(4) Non-Real Estate Investment excludes Recall integration CapEx of $3.2mm and $3.7mm in Q4 2016 and Q4 2017, respectively, and Recall integration CapEx of $9.7mm and $18.6mm in full year 2016 and full year 2017, respectively. Includes Non-Real Estate Investment associated with data center business of $4.2mm in Q4 2017 and full year 2017.
(5) Maintenance CapEx excludes Recall integration maintenance expense of $0.8mm and $0.9mm in Q4 2016 and Q4 2017, respectively, and Recall integration maintenance expense of $1.2mm and $3.1mm in full year 2016 and full year 2017, respectively.
Section
VIII
Section
IXSection
VII
Section
VISection
VSection
IVSection
IIISection
XSection
IISection
ISection
XI
Q4 2016 Q4 2017 % Change Full Year 2016 Full Year 2017 % Change
Net Income $49,525 $21,478 (56.6)% $107,233 $185,432 72.9%
Add / (Deduct):Real Estate Depreciation 61,221 65,885 226,258 259,287(Gain) Loss on Sale of Real Estate, Net of Tax (1,855) (640) (2,180) (1,565)
FFO (Nareit) $108,891 $86,723 (20.4)% $331,311 $443,154 33.8%
Add / (Deduct):(Gain) Loss on Disposal/Write-Dow n of PP&E (excluding Real Estate), Net 2,543 1,765 1,412 799Foreign Currency Transaction (Gains) Losses(1) 5,077 15,348 20,413 43,248 Debt Extinguishment Expense - 30,070 9,283 78,368 (Income) Other Expense, Net 2,217 263 14,604 (42,187) Intangible Impairments - 3,011 - 3,011 Tax Impact of Reconciling Items and Discrete Tax Items(2) (17,049) (22,673) (15,019) (49,865) (Income) Loss from Discontinued Operations, Net of Tax 275 2,871 (3,353) 6,291 Recall Costs 29,072 26,307 131,944 84,901
FFO (Normalized) $131,026 $143,685 9.7% $490,595 $567,720 15.7%
Add / (Deduct):Non-Real Estate Depreciation 37,308 37,918 139,268 146,996Amortization of Customer Relationship Intangible Assets 26,899 37,265 86,800 116,093Amortization of Deferred Financing Costs 3,911 3,058 13,151 14,962Revenue Reduction Associated w ith Amortization of Permanent Withdraw al Fees 3,170 2,627 12,217 11,253Non-Cash Rent Expense (Income) (1,116) (245) (2,086) 5,239 Stock-based Compensation Expense 7,106 7,166 28,976 30,019 Reconciliation to Normalized Cash Taxes(3) 6,145 (5,060) 16,127 6,548
Less:Non-Real Estate Investment(4) 11,242 23,063 32,696 41,908Real Estate, Data Center and Non-Real Estate Maintenance CapEx(5) 33,359 49,195 83,110 104,653
AFFO $169,848 $154,156 (9.2)% $669,242 $752,269 12.4%
Per Share Amounts (Fully Diluted Shares)
FFO (Nareit) $0.41 $0.32 (22.0)% $1.34 $1.66 23.9%FFO (Normalized) $0.50 $0.53 6.0% $1.98 $2.13 7.6%
Weighted Average Common Shares Outstanding - Basic 263,528 270,321 2.6% 246,178 265,898 8.0%Weighted Average Common Shares Outstanding - Diluted 264,506 271,498 2.6% 247,267 266,845 7.9%

www.ironmountain.com Selected metric definitions are available in the Appendix 18
Reconciliation of Cash Flow from Operations to AFFO
(1) Calculated as actual cash taxes less current tax provision and other one-time cash tax items, to reflect actual cash tax (impact)/benefit to AFFO.(2) Working capital adjustments in Q4 2017 are driven primarily by changes in accounts receivables, accrued expenses, and dividends payable.(3) Non-Real Estate Investment CapEx excludes $3.2mm and $3.7mm of Recall integration CapEx in Q4 2016 and Q4 2017, respectively, and $9.7mm and $18.6mm of Recall integration CapEx in full
year 2016 and full year 2017, respectively. Includes Non-Real Estate Investment associated with data center business of $4.2mm in Q4 2017 and full year 2017.(4) Real Estate and Non-Real Estate Maintenance CapEx excludes $0.8mm and $0.9mm of Recall integration CapEx in Q4 2016 and Q4 2017, respectively, and $1.2mm and $3.1mm of Recall
integration CapEx in full year 2016 and full year 2017, respectively. (5) Includes Large Volume Accounts (“LVA”) amortization and foreign currency adjustments.
Section
VIII
Section
IXSection
VII
Section
VISection
VSection
IVSection
IIISection
XSection
IISection
ISection
XI
Q4 2016 Q4 2017 % Change Full Year 2016 Full Year 2017 % Change
Cash Flow from from Operating Activities-Continuing Operations 122,264 201,969 65.2% 541,216 724,259 33.8%
Adjust for: Tax on Gain from Disposition of Real Estate 95 (641) n/a 129 - n/aTax Impact of Reconciling Items and Discrete Tax Items Net of Deferred Tax 11,123 (14,522) n/a 35,349 (13,495) n/aReconciliation to Normalized Cash Taxes(1) 6,145 (5,060) n/a 16,127 6,548 (59.4%)Recall Costs 29,072 26,307 (9.5%) 131,944 84,901 (35.7%)Working Capital Adjustments(2) 44,075 17,865 (59.5%) 60,813 101,951 67.6%Non-Real Estate Investment CapEx(3) (11,242) (23,063) n/a (32,696) (41,908) 28.2%Real Estate, Data Center and Non-Real Estate Maintenance CapEx(4) (33,359) (49,195) 47.5% (83,110) (104,653) 25.9%Other and FX(5) 1,675 496 (70.4)% (530) (5,334) n/a
AFFO $169,848 $154,156 (9.2)% $669,242 $752,269 12.4%

www.ironmountain.com Selected metric definitions are available in the Appendix 19
Quarterly and Full Year Revenue Growth Bridge ($mm)
Fourth Quarter
6% Reported R$
4% C$
$39
$18
$991
Q4 2016 Revenue at Q4 2017 FX Rates
$934
Q4 2016 Revenue ‐Reported $
Revenue Growth Excluding FX Benefit
$952
FX Impact at Q4 2017 FX Rates
Q4 2017 Revenue ‐Reported $
$87
$228
FY 2016 Revenue at FY 2017 FX Rates
$3,531
FX Impact at FY 2017 FX Rates
FY 2016 Revenue ‐Reported $
$3,511
$3,846
Benefit from 4 Additional Months of Recall
$20
Revenue Growth Excluding FX Benefit
FY 2017 Revenue ‐Reported $
9% C$
Full Year
10% Reported R$
Section
VIII
Section
IXSection
VII
Section
VISection
VSection
IVSection
IIISection
XSection
IISection
ISection
XI

www.ironmountain.com Selected metric definitions are available in the Appendix 20
Quarterly and Full Year Adjusted EBITDA Bridge
($mm)
8% C$
$24
$6
Q4 2017 Adjusted EBITDA ‐ Reported $
Growth Excluding FX Benefit
$327
Q4 2016 Adjusted
EBITDA at Q4 2017 FX Rates
$303
FX Impact at Q4 2017 FX Rates
Q4 2016 Adjusted EBITDA ‐ Reported $
$297
Fourth Quarter
10% Reported R$
15% C$
$119
$48
FY 2017 Adjusted EBITDA ‐
Reported $
Growth Excluding FX Benefit
$1,260
$1,087
FY 2016 Adjusted EBITDA ‐
Reported $
$6
FX Impact at FY 2017 FX Rates
$1,093
FY 2016 Adjusted
EBITDA at FY 2017 FX Rates
Benefit from 4 Additional Months of Recall
Full Year
16% Reported R$
Section
VIII
Section
IXSection
VII
Section
VISection
VSection
IVSection
IIISection
XSection
IISection
ISection
XI

www.ironmountain.com Selected metric definitions are available in the Appendix 21
Storage and Service Reconciliation
Section
VIII
Section
IXSection
VII
Section
VISection
VSection
IVSection
IIISection
XSection
IISection
ISection
XI
Q4 2016 Q4 2017 % Change Full Year 2016 Full Year 2017 % Change
Total Storage Revenue $566,547 $613,948 8.4% $2,142,905 $2,377,557 11.0%
Add: Permanent Withdraw al Fees 5,682 6,537 15.0% 21,784 24,238 11.3%Adjusted Storage Revenue $572,229 $620,485 8.4% $2,164,689 $2,401,795 11.0%
Total Service Revenue $367,646 $377,287 2.6% $1,368,548 $1,468,021 7.3%
Less: Permanent Withdraw al Fees (5,682) (6,537) 15.0% (21,784) (24,238) 11.3%Adjusted Service Revenue $361,964 $370,750 2.4% $1,346,764 $1,443,783 7.2%
Storage Cost of Sales (COS)
Storage COS Excluding Rent 71,131 76,439 7.5% 274,913 299,317 8.9%Storage Rent 70,938 73,949 4.2% 262,327 294,707 12.3%
Total Storage COS 142,069 150,388 5.9% 537,240 594,024 10.6%
Service Cost of Sales (COS)
Service COS Excluding Rent 264,157 267,954 1.4% 1,005,865 1,058,018 5.2%Service Rent 2,814 3,185 13.2% 12,709 12,783 0.6%
Total Service COS 266,971 271,139 1.6% 1,018,574 1,070,801 5.1%
Recall Cost of Sales Expenses 7,175 4,474 (37.6%) 11,963 20,493 71.3%Total COS $416,215 $426,001 2.4% $1,567,777 $1,685,318 7.5%
SG&A Costs
Storage Overhead 32,483 37,624 15.8% 130,201 134,612 3.4%Service Overhead 23,161 24,909 7.5% 92,115 90,789 (1.4%)Corporate Overhead 110,158 114,393 3.8% 407,858 442,039 8.4%Recall Costs Included in SG&A 21,897 21,833 (0.3%) 119,981 64,408 (46.3%)Sales and Marketing 62,846 66,238 5.4% 238,177 253,117 6.3%
Total SG&A $250,545 $264,997 5.8% $988,332 $984,965 (0.3%)
Adjusted EBITDA
Total Storage Adjusted EBITDA 397,677 432,473 8.7% 1,497,248 1,673,159 11.7%Total Service Adjusted EBITDA 71,832 74,702 4.0% 236,075 282,193 19.5%Less: Corporate Overhead and Sales and Marketing (173,004) (180,631) 4.4% (646,035) (695,156) 7.6%
Total Adjusted EBITDA $296,505 $326,544 10.1% $1,087,288 $1,260,196 15.9%

www.ironmountain.com Selected metric definitions are available in the Appendix 22
Storage Net Operating Income (NOI)
(1) Includes Fine Art Storage, Consumer Storage, Technology Escrow Services, Digital Storage, Fulfillment Services, Information Governance and Digital Solutions, Entertainment Services and other ancillary storage revenues.
(2) Includes Rent Expense, Building Maintenance, Property Taxes, Utilities and Insurance costs.(3) Refer to page 21 and Appendix for overhead allocations and definitions.
Q4 2016 Q4 2017 % Change Full Year 2016 Full Year 2017 % Change
Revenue from Storage Rental Activities
Records Management $447,371 $476,653 6.5% $1,686,805 $1,863,447 10.5%
Data Protection 85,845 89,574 4.3% 329,585 355,821 8.0%
Data Center 5,510 12,289 n/a 22,026 35,839 62.7%
Other(1) 27,821 35,432 27.4% 104,489 122,450 17.2%
Total Storage Rental $566,547 $613,948 8.4% $2,142,905 $2,377,557 11.0%
Terminations/Permanent Withdraw al Fees 5,682 6,537 15.0% 21,784 24,238 11.3%
Total Revenue from Adjusted Storage Rental Activities $572,229 $620,485 8.4% $2,164,689 $2,401,795 11.0%
Less: Storage Rental Expenses
Facility Costs(2) 131,529 137,591 4.6% 492,685 548,371 11.3%
Storage Rental Labor 3,320 3,220 (3.0)% 15,472 12,918 (16.5)%
Other Storage Rental Expenses 7,220 9,577 32.6% 29,083 32,735 12.6%
Storage Cost of Sales 142,069 150,388 5.9% 537,240 594,024 10.6%
Allocated Overhead(3) 32,483 37,624 15.8% 130,201 134,612 3.4%Total Storage Rental Expenses 174,552 188,012 7.7% 667,441 728,636 9.2%
Total Storage Adjusted EBITDA $397,677 $432,473 8.7% $1,497,248 $1,673,159 11.7%
Total Storage Adjusted EBITDA Margin 69.5% 69.7% 20 bps 69.2% 69.7% 50 bpsStorage Rent 70,938 73,949 4.2% 262,327 294,707 12.3%
Storage Rental Expenses (excluding Storage Rent) $103,614 $114,063 10.1% $405,114 $433,929 7.1%
Storage Net Operating Income $468,615 $506,422 8.1% $1,759,575 $1,967,866 11.8%
Storage Net Operating Income Margin 81.9% 81.6% -30 bps 81.3% 81.9% 60 bps Section
VIII
Section
IXSection
VII
Section
VISection
VSection
IVSection
IIISection
XSection
IISection
ISection
XI

www.ironmountain.com Selected metric definitions are available in the Appendix
Service Business Detail
23
(1) Includes Fine Art Storage, Consumer Storage, Technology Escrow Services, Consulting, Fulfillment Services, Information Governance and Digital Solutions, Entertainment Services and other ancillary services.
(2) Includes Building Maintenance, Property Taxes, Utilities, Facility Rent and Insurance costs for shredding, imaging and other services.(3) Refer to page 21 and Appendix for overhead allocations and definitions.
Section
VIII
Section
IXSection
VII
Section
VISection
VSection
IVSection
IIISection
XSection
IISection
ISection
XI
Q4 2016 Q4 2017 % Change Full Year 2016 Full Year 2017 % Change
Service Operations Revenue by Product Line
Records Management $166,056 $174,264 4.9% $645,427 $671,195 4.0%Data Protection 42,882 41,046 (4.3)% 170,969 164,158 (4.0)%Shredding 89,524 94,346 5.4% 322,559 375,463 16.4%Data Center 649 573 (11.7)% 2,223 1,855 (16.6)%Other(1) 68,535 67,058 (2.2)% 227,370 255,350 12.3%
Total Service Revenue $367,646 $377,287 2.6% $1,368,548 $1,468,021 7.3%
Less: Terminations/Permanent Withdraw al Fees 5,682 6,537 15.0% 21,784 24,238 11.3%Adjusted Service Revenue $361,964 $370,750 2.4% $1,346,764 $1,443,783 7.2%
Less: Service Expenses
Facility Costs(2) 7,519 8,157 8.5% 30,010 32,742 9.1%Service Labor 192,150 194,568 1.3% 741,053 773,397 4.4%Other Service Expenses 67,302 68,414 1.7% 247,511 264,662 6.9%Service Cost of Sales 266,971 271,139 1.6% 1,018,574 1,070,801 5.1%
Allocated Overhead(3) 23,161 24,909 7.5% 92,115 90,789 (1.4)%Total Service Expenses 290,132 296,048 2.0% 1,110,689 1,161,590 4.6%
Total Service Adjusted EBITDA $71,832 $74,702 4.0% $236,075 $282,193 19.5%
Total Service Adjusted EBITDA Margin 19.8% 20.1% 30 bps 17.5% 19.5% 200 bps
Service Rent 2,814 3,185 13.2% 12,709 12,783 0.6%
Total Service Adjusted EBITDAR $74,646 $77,887 4.3% $248,784 $294,976 18.6%
Total Service Adjusted EBITDAR Margin 20.6% 21.0% 40 bps 18.5% 20.4% 200 bps

www.ironmountain.com Selected metric definitions are available in the Appendix
Gross Book Value of Real Estate Assets
24
(1) Includes warehouse equipment, vehicles, furniture, fixtures, computer hardware and software.
Real Estate Assets
Storage Operations
Land $305,794Buildings & Building Improvements 1,970,468 Leasehold Improvements 536,814 Racking 1,819,269 Construction In Progress 54,013 Total Storage Gross Book Value $4,686,358
Service Operations
Land $9,103Buildings & Building Improvements 68,692 Leasehold Improvements 55,886 Racking 177,325 Construction In Progress 1,962 Total Service Gross Book Value $312,968
Total Real Estate Gross Book Value $4,999,326
Non-Real Estate Assets
All Other Non-Real Estate Assets Gross Book Value(1) 1,251,775
Total PP&E Gross Book Value $6,251,100
As of 12/31/2017
Section
VIII
Section
IXSection
VII
Section
VISection
VSection
IVSection
IIISection
XSection
IISection
ISection
XI

www.ironmountain.com Selected metric definitions are available in the Appendix
Lease Obligations(1)
(1) Includes capital and operating lease obligations.(2) Reflects month to month leases and predominantly short term occupancies.
Weighted Average Remaining Lease Obligations (exercise of all extension options): 11.8 years
2027
4.1%
2026
3.1%
2025
5.3%
2024
3.9%
2023
2.7%
2022
3.5%
2021 Thereafter
54.5%
2028
2.8%
4.1%
2020
4.5%
2019
4.7%
2018
6.8%
Facility Lease Expirations(% of total square feet subject to lease)
12/31/2017Assuming Exercise of All Extension Options
25
(2)
Section
VIII
Section
IXSection
VII
Section
VISection
VSection
IVSection
IIISection
XSection
IISection
ISection
XI

www.ironmountain.com Selected metric definitions are available in the Appendix
Global Real Estate Portfolio(1)
26
(1) Includes real estate held in joint ventures.(2) Includes South Africa and United Arab Emirates.(3) Reflects adjustments to previous periods due to refinements to real estate basis.(4) Out of the 41 leased building additions and expansions, 20 were the result of acquiring leases in business acquisitions and leased buildings related to acquisitions of customer relationships.(5) Includes 3 owned facilities and 2 leased facilities with 534 Sq.Ft. and 218 Sq. Ft., respectively.
(000s, except for number of buildings)
Top Ten Markets Owned, United States Sq. Feet Owned
Northern New Jersey 2,099Boston 1,428Chicago 1,282Dallas 1,075Los Angeles 1,040Houston 923Philadelphia 858New York 825Baltimore / Washington 777San Francisco Bay Area 742
Top Ten Markets Owned, International Sq. Feet Owned
London, UK 1,102Paris, France 807Montreal, Canada 552Buenos Aires, Argentina 470Mexico City, Mexico 452Toronto, Canada 434Lima District, Peru 302Edinburgh, UK 289Singapore, Singapore 274Calgary, Canada 270
Section
VIII
Section
IXSection
VII
Section
VISection
VSection
IVSection
IIISection
XSection
IISection
ISection
XI
Total
Buildings Sq. Ft. Buildings Sq. Ft. Buildings Sq. Ft.
North America 201 21,972 556 34,658 757 56,630
Europe(2) 60 3,575 278 11,727 338 15,302 Latin America 36 1,914 98 5,017 134 6,932 Asia 8 455 194 7,476 202 7,931 International x 105 5,945 570 24,219 675 30,164
Total(3) 307 27,917 1,126 58,877 1,433 86,794
Total
Buildings Sq. Ft. Buildings Sq. Ft. Buildings Sq. Ft.
North America 2 18 7 178 9 195
Europe(2) - - 4 38 4 38 Latin America - - 4 238 4 238 Asia - - 26 1,274 26 1,274 International x - - 34 1,550 34 1,550
Total 2 18 41 1,728 43 1,745
Total
Buildings Sq. Ft. Buildings Sq. Ft. Buildings Sq. Ft.
North America - - (15) (656) (15) (656)
Europe(2) - - (13) (212) (13) (212) Latin America - - (3) (96) (3) (96) Asia - - (5) (90) (5) (90) International x - - (21) (398) (21) (398)
Total - - (36) (1,054) (36) (1,054)
Total
Buildings Sq. Ft. Buildings Sq. Ft. Buildings Sq. Ft.
North America(5) 203 21,990 548 34,180 751 56,170
Europe(2) 60 3,575 269 11,553 329 15,128 Latin America 36 1,914 99 5,159 135 7,074 Asia 8 455 215 8,659 223 9,114 International x 104 5,945 583 25,371 687 31,316
Total 307 27,935 1,131 59,551 1,438 87,486
Total % 21.3% 31.9% 78.7% 68.1%
As of 9/30/2017
Q4 2017 Additions & Expansions
Q4 2017 Dispositions & Move Outs
As of 12/31/2017
Owned Facilities Leased Facilities
Leased Facilities
Leased Facilities(4)
Owned Facilities
Owned Facilities
Owned Facilities
Leased Facilities

www.ironmountain.com Selected metric definitions are available in the Appendix
Revenue from Rental Activities and
Storage NOI per Racked Square Foot
27
(1) Includes South Africa and United Arab Emirates.(2) Includes loading docks, unracked space, office space, common areas, as well as space in service-related facilities.(3) Excludes Revenue and NOI associated with Technology Escrow Services, Fulfillment Services, Data Center, Entertainment Services, Fine Art Storage, Consumer Storage and other ancillary storage revenue.
Annualized Revenue from Rental Activities
and Storage NOI per Racked Square Foot(3)
Section
VIII
Section
IXSection
VII
Section
VISection
VSection
IVSection
IIISection
XSection
IISection
ISection
XI
Q4 2017 Annualized
Revenue NOI
North America
Records Management $ per Sq Ft $29.97 $24.78
Data Protection $ per Sq Ft $361.22 $329.22
Europe(1) $37.47 $32.71
Latin America $38.38 $33.72
Asia $38.26 $33.25
Total $36.48 $31.12
Square Footage by Region As of December 31, 2017
North
America Europe(1)
Latin
America Asia Total
Records Management Racked Space 40,278 11,066 5,025 5,482 61,851
Data Protection Racked Space 713 142 60 33 949
Other(2) 15,178 3,919 1,989 3,599 24,686
Total 56,170 15,128 7,074 9,114 87,486
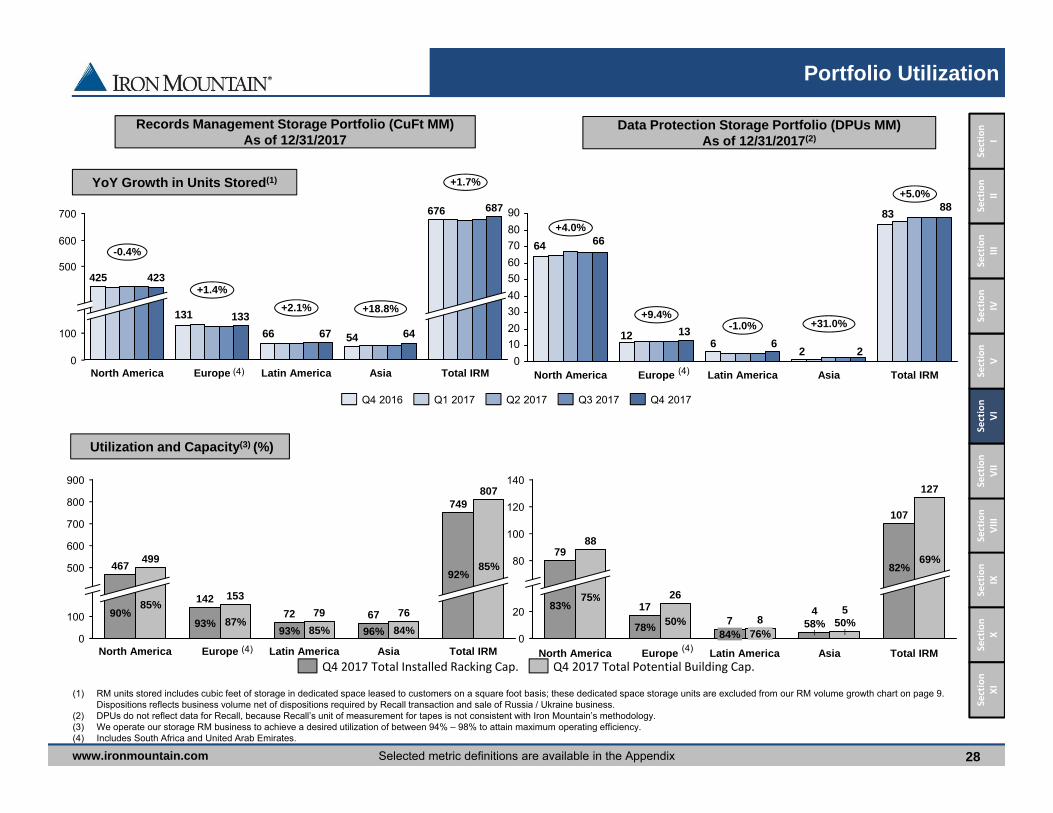
www.ironmountain.com Selected metric definitions are available in the Appendix
Portfolio Utilization
Records Management Storage Portfolio (CuFt MM)
As of 12/31/2017
5466
131
6467
133
700
100
0
600
500
Asia
-0.4%
687
Total IRM
+2.1%
+1.4%
+1.7%
+18.8%
423
North America
425
Latin America
676
Europe
600
700
500
800
900
0
100
807
Total IRMAsiaLatin America
76
92%
749
85% 84%
67
85%
96%
72 79
142
87%
153
North America
93%
85%
467499
90%
93%
Europe
Utilization and Capacity(3) (%)
83
26
12
64
88
26
13
66
0102030405060708090
Latin AmericaNorth America Europe
+5.0%
+31.0%-1.0%+9.4%
+4.0%
Total IRMAsia
120
20
0
100
140
80
127
Total IRMAsia
107
4
69%82%
5
50%58%
Latin America
87
76%84%
Europe
2617
50%78%
North America
8879
75%83%
Data Protection Storage Portfolio (DPUs MM)
As of 12/31/2017(2)
(1) RM units stored includes cubic feet of storage in dedicated space leased to customers on a square foot basis; these dedicated space storage units are excluded from our RM volume growth chart on page 9. Dispositions reflects business volume net of dispositions required by Recall transaction and sale of Russia / Ukraine business.
(2) DPUs do not reflect data for Recall, because Recall’s unit of measurement for tapes is not consistent with Iron Mountain’s methodology. (3) We operate our storage RM business to achieve a desired utilization of between 94% – 98% to attain maximum operating efficiency.(4) Includes South Africa and United Arab Emirates.
28
YoY Growth in Units Stored(1)
(4) (4)
(4) (4)
Q1 2017 Q2 2017 Q4 2017Q3 2017Q4 2016
Q4 2017 Total Installed Racking Cap. Q4 2017 Total Potential Building Cap.
Section
VIII
Section
IXSection
VII
Section
VISection
VSection
IVSection
IIISection
XSection
IISection
ISection
XI
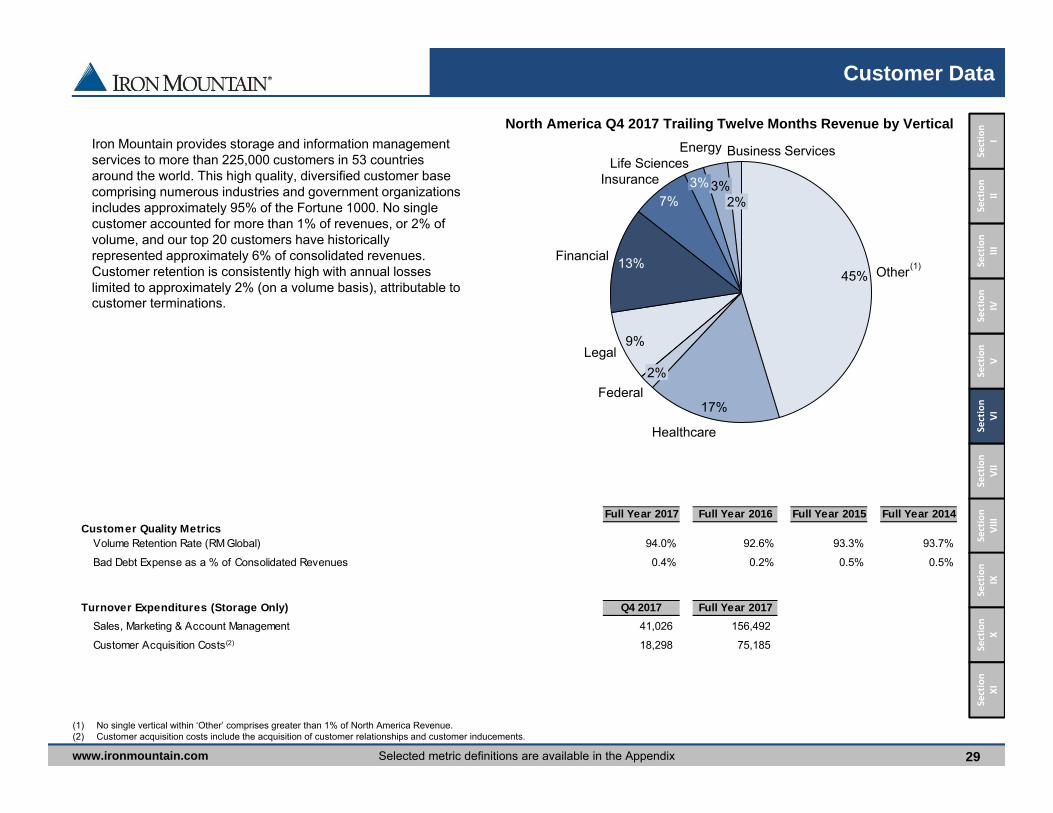
www.ironmountain.com Selected metric definitions are available in the Appendix
Customer Data
29
(1) No single vertical within ‘Other’ comprises greater than 1% of North America Revenue.(2) Customer acquisition costs include the acquisition of customer relationships and customer inducements.
Other45%
Business Services
2%
Energy
3%
Life Sciences3%Insurance
7%
Financial 13%
Legal9%
Federal2%
Healthcare
17%
North America Q4 2017 Trailing Twelve Months Revenue by Vertical
Iron Mountain provides storage and information management services to more than 225,000 customers in 53 countries around the world. This high quality, diversified customer base comprising numerous industries and government organizations includes approximately 95% of the Fortune 1000. No single customer accounted for more than 1% of revenues, or 2% of volume, and our top 20 customers have historically represented approximately 6% of consolidated revenues. Customer retention is consistently high with annual losses limited to approximately 2% (on a volume basis), attributable to customer terminations.
(1)
Section
VIII
Section
IXSection
VII
Section
VISection
VSection
IVSection
IIISection
XSection
IISection
ISection
XI
Full Year 2017 Full Year 2016 Full Year 2015 Full Year 2014
Customer Quality Metrics
Volume Retention Rate (RM Global) 94.0% 92.6% 93.3% 93.7%
Bad Debt Expense as a % of Consolidated Revenues 0.4% 0.2% 0.5% 0.5%
Turnover Expenditures (Storage Only) Q4 2017 Full Year 2017
Sales, Marketing & Account Management 41,026 156,492
Customer Acquisition Costs(2) 18,298 75,185
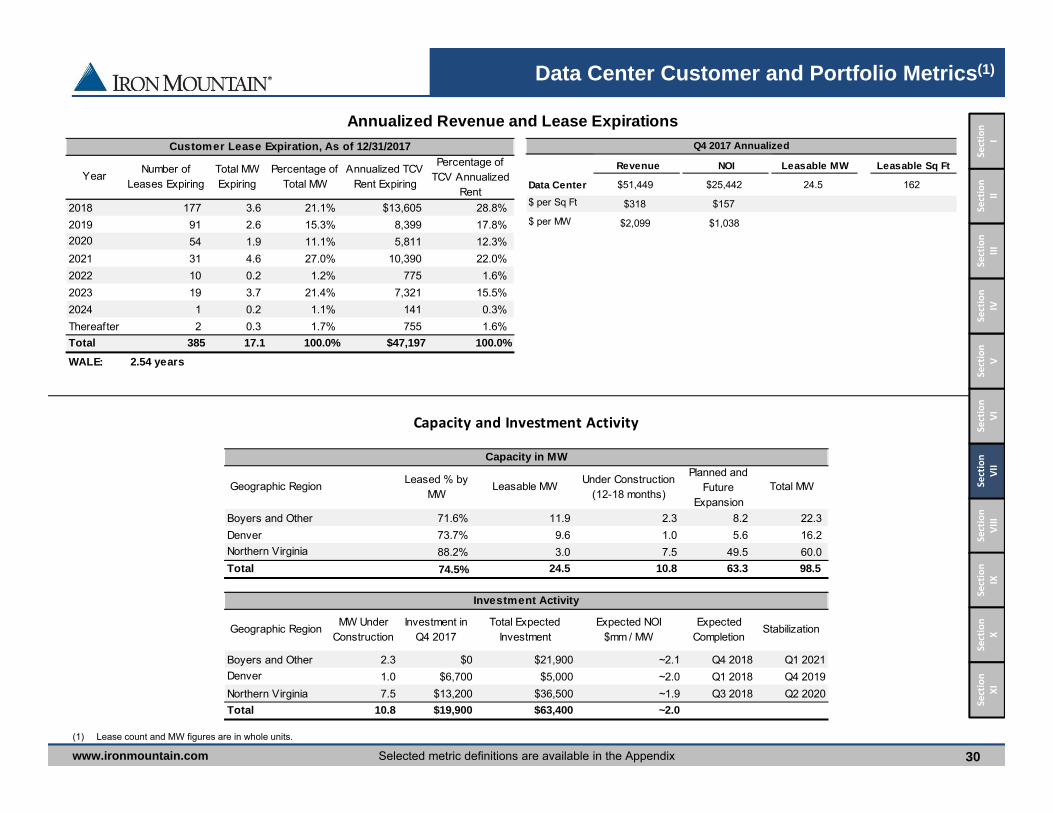
www.ironmountain.com Selected metric definitions are available in the Appendix
Data Center Customer and Portfolio Metrics(1)
30
Section
VIII
Section
IXSection
VII
Section
VISection
VSection
IVSection
IIISection
XSection
IISection
ISection
XI
Q4 2017 Annualized
Revenue NOI Leasable MW Leasable Sq Ft
Data Center $51,449 $25,442 24.5 162
$ per Sq Ft $318 $157
$ per MW $2,099 $1,038
Annualized Revenue and Lease Expirations
Customer Lease Expiration, As of 12/31/2017
Year Number of Leases Expiring
Total MW Expiring
Percentage of Total MW
Annualized TCV Rent Expiring
Percentage of TCV Annualized
Rent2018 177 3.6 21.1% $13,605 28.8%2019 91 2.6 15.3% 8,399 17.8%2020 54 1.9 11.1% 5,811 12.3%2021 31 4.6 27.0% 10,390 22.0%2022 10 0.2 1.2% 775 1.6%2023 19 3.7 21.4% 7,321 15.5%2024 1 0.2 1.1% 141 0.3%Thereafter 2 0.3 1.7% 755 1.6%Total 385 17.1 100.0% $47,197 100.0%
WALE: 2.54 years
(1) Lease count and MW figures are in whole units.
Capacity and Investment Activity
Capacity in MW
Geographic Region Leased % by MW
Leasable MW Under Construction (12-18 months)
Planned and Future
ExpansionTotal MW
Boyers and Other 71.6% 11.9 2.3 8.2 22.3 Denver 73.7% 9.6 1.0 5.6 16.2 Northern Virginia 88.2% 3.0 7.5 49.5 60.0 Total 74.5% 24.5 10.8 63.3 98.5
Investment Activity
Geographic Region MW Under Construction
Investment in Q4 2017
Total Expected Investment
Expected NOI$mm / MW
Expected Completion
Stabilization
Boyers and Other 2.3 $0 $21,900 ~2.1 Q4 2018 Q1 2021 Denver 1.0 $6,700 $5,000 ~2.0 Q1 2018 Q4 2019 Northern Virginia 7.5 $13,200 $36,500 ~1.9 Q3 2018 Q2 2020 Total 10.8 $19,900 $63,400 ~2.0

www.ironmountain.com Selected metric definitions are available in the Appendix
Debt Schedule
31
$259
$825
$1,000
Thereafter20272026
$300
2025
$899
2024
$1,000
2023
$799
2022
$898
2021
$500
2020
18%
82%
Fixed vs. Floating Rate Debt at 12/31/17(4)
Debt Maturity Schedule ($MM)
Floating Rate DebtFixed Rate Debt
(1) Accounts Receivable securitization.(2) Includes AUD Term Loan B of $188mm.(3) Includes $50mm of mortgage notes payable in 2026.(4) Adjusted to include capital lease and other international borrowings yields a ratio of 81% fixed and 19% floating. At December 31, 2017, the net proceeds from the 5 ¼% Notes, together with the net proceeds
of the Equity Offering, were used to temporarily pay down borrowings under our Revolving Credit Facility and invest in money market accounts.
Floating Rate Debt at 12/31/17Fixed Rate Debt at 12/31/17
(1)(3)
(2)
Section
VIII
Section
IXSection
VII
Section
VISection
VSection
IVSection
IIISection
XSection
IISection
ISection
XI

www.ironmountain.com Selected metric definitions are available in the Appendix
Capitalization
32
(1) Total debt net of cash is calculated as current portion of long-term debt of $146mm plus long-term debt net of current portion of $6,897mm plus $86mm of deferred financing costs less cash and cash equivalents of $926mm.
Senior Credit Facility (as of 12/31/2017)
Capacity $1,993,750Outstanding $710,417Letters of Credit $52,846Remaining Capacity $1,230,487Interest Rate Spread (Prime) 1.00%Interest Rate Spread (LIBOR) 2.00%Weighted Average Interest Rate 3.45%Maturity Date 8/21/22
Senior Credit Facility Debt Covenant Analysis (as of 12/31/2017)
Metric Limit Current
Fixed Charge Ratio ≥ 1.5x 2.1xNet Total Lease Adjusted Leverage Ratio ≤ 6.5x 5.0xNet Secured Lease Adjusted Leverage Ratio ≤ 4.0x 1.6x
Section
VIII
Section
IXSection
VII
Section
VISection
VSection
IVSection
IIISection
XSection
IISection
ISection
XI
Senior Subordinated and Senior Unsecured Notes (as of 12/31/2017)
Senior Senior Senior Senior Senior Senior Senior Senior SeniorType of Note Subordinated Unsecured Unsecured Unsecured Unsecured Unsecured Unsecured Unsecured UnsecuredIssuance Date 8/7/12 8/13/13 5/27/16 5/27/16 9/15/16 5/23/17 9/18/17 11/13/17 12/27/17Denomination USD USD USD USD CAD EUR USD GBP USDOriginal Principal Amount (FX Rate on Issue Date) $1,000,000 $600,000 $500,000 $250,000 $189,537 $336,894 $1,000,000 $535,904 $825,000Exchange Rate at 12/31/2017 1.0000 1.0000 1.0000 1.0000 0.7967 1.1980 1.0000 1.3493 1.0000Principal Amount at 12/31/2017 $1,000,000 $600,000 $500,000 $250,000 $199,171 $359,386 $1,000,000 $539,702 $825,000Yield (on Issue Date) 5.750% 6.000% 4.375% 5.375% 5.375% 3.000% 4.875% 3.875% 5.250%Maturity Date 8/15/24 8/15/23 6/1/21 6/1/26 9/15/23 1/15/25 9/15/27 11/15/25 3/15/28Current Call Price 102.875 N/A N/A N/A N/A N/A N/A N/A N/ANext Call Date 8/15/18 8/15/18 6/1/18 6/1/21 9/15/19 6/15/20 9/15/22 11/15/20 12/27/22Next Call Price 101.917 103.000 102.188 102.688 104.031 101.500 102.438 101.938 102.625

www.ironmountain.com Selected metric definitions are available in the Appendix
Capital Expenditures and Investments
33
(1) Includes Recall Integration CapEx of $10.0mm and $7.5mm in Q4 2016 and Q4 2017, respectively, and $18.3mm and $31.4mm in full year 2016 and full year 2017, respectively. (2) Includes Land, Buildings, Improvements, and Racking Structures.(3) Includes $10.9mm and $20.9mm (including $0.0mm and $13.8mm of capital lease associated with our Northern Virginia data center) for in Q4 2016 and Q4 2017, respectively. Also, includes $70.7mm and
$87.9mm (including $0.0mm and $66.8mm of capital lease associated with our Northern Virginia data center) in YTD 2016 and full year 2017, respectively. Includes Non-Real Estate Investment associated with data center business of $4.2mm in Q4 2017 and full year 2017.
Section
VIII
Section
IXSection
VII
Section
VISection
VSection
IVSection
IIISection
XSection
IISection
ISection
XI
Q4 2016 Q4 2017 % Change Full Year 2016 Full Year 2017 % Change
Capital Expenditures(1)
Real Estate:
Investment(2) $35,599 $31,061 (12.7)% $133,079 $139,822 5.1%Maintenance 27,932 39,503 41.4% 63,543 77,660 22.2%
$63,531 $70,564 11.1% $196,622 $217,482 10.6%Non-Real Estate:
Investment $14,204 $26,105 83.8% $40,509 $56,297 39.0%Maintenance 6,207 10,539 69.8% 20,642 29,721 44.0%
$20,411 $36,643 79.5% $61,151 $86,018 40.7%
Data Center Investment and Maintenance:(3) $11,145 $21,746 95.1% $72,729 $92,597 27.3%
Innovation and Growth Investment: $2,756 $5,158 87.1% $8,572 $20,583 n/a
Total Real Estate, Non-Real Estate and Data Center Capital Expenditures
and Innovation and Growth Investments $97,843 $134,111 37.1% $339,074 $416,680 22.9%
Net Change in Prepaid and Accrued Capital Expenditures and Capital Leases (15,269) (34,726) n/a (10,471) (73,549) n/a
Total Cash Paid for Real Estate, Non-Real Estate and Data Center Capital
Expenditures and Innovation and Growth Investments $82,574 $99,385 20.4% $328,603 $343,131 4.4%

www.ironmountain.com Selected metric definitions are available in the Appendix
Business and Customer Acquisitions
34
(1) Includes Fortrust non-cash consideration of $83.0mm in full year 2017.(2) Excludes accrual adjustments and customer inducements.
Section
VIII
Section
IXSection
VII
Section
VISection
VSection
IVSection
IIISection
XSection
IISection
ISection
XI
Q4 2016 Q4 2017 % Change Full Year 2016 Full Year 2017 % Change
Business Acquisitions
Business Acquisitions Excluding Data Centers $18,427 $36,395 97.5% $48,678 $161,718 n/aChange in Business Acquisition Accruals and Cash Acquired (2,765) (10,818) n/a (11,502) 3,459 n/a
Cash Paid for Acquisitions, Net of Cash Acquired, Excluding Data Centers & Recall $15,662 $25,577 63.3% $37,176 $165,177 n/a
Data Center Acquisitions Non-Cash Consideration(1) - - n/a - 83,014 n/aData Center Acquisitions Cash - - n/a - 54,528 n/a
Total Data Center Acquisition - - n/a - $137,542 n/a
Recall Acquisition Non-Cash Consideration - - n/a $1,835,027 - n/aRecall Acquisition Cash (68) - n/a 254,789 - n/a
Total Recall Acquisition ($68) - n/a $2,089,816 - n/a
Total Cash Paid for Acquisitions, Net of Cash Acquired $15,594 $25,577 64.0% $291,965 $219,705 (24.7)%
Q4 2016 Q4 2017 % Change Full Year 2016 Full Year 2017 % Change
Customer Acquisitions
Acquisition of Customer Relationships $3,769 6,279 66.6% $28,982 $54,046 86.5%Customer Inducements 3,106 3,960 27.5% 19,205 20,059 4.4%
Total Acquisition of Customer Relationships and Customer Inducements $6,875 $10,239 48.9% $48,187 $74,105 53.8%
Change in Customer Acquisition Accruals 3,036 8,059 n/a 2,579 1,080 (58.1)%
Total Cash Paid for Acquisition of Customer Relationships and
Customer Inducements $9,911 $18,298 84.6% $50,766 $75,185 48.1%

www.ironmountain.com Selected metric definitions are available in the Appendix
Real Estate Investments(1)
35
(1) Based on 2017 C$ Budgeted FX Rates.(2) Racking Installations exclude consolidation spend in Total Expected Investment, Investment in Current Period and Cumulative Investment to Date of $36.1mm, $6.7mm and $24.2mm, respectively.(3) Includes South Africa and United Arab Emirates.(4) In USD R$ calculated using a twelve month trailing historical average.(5) North America excludes racking investments for development projects that were initiated after 1/1/2017, racking investments associated with these projects are included in the table above.
Investment Reconciliation Q4 2017 Investments
Racking Installations $14,787Consolidation Related to Racking Installations 6,694Building Development Projects 4,545Total C$ Real Estate Investments 26,027Other Real Estate Investment 7,046Total FX Impact (2,011)Real Estate Investment $31,061
Section
VIII
Section
IXSection
VII
Section
VISection
VSection
IVSection
IIISection
XSection
IISection
ISection
XI
Real Estate Investment Activity
Total Expected Investment in Estimated Historical Average
Investment Q4 2017 CuFt / DPUs NOI/CuFt or DPU(4)
Racking Installations(2)
North America $24,908 $5,385 $17,583 7,186 $2.52
Europe(3) 39,709 1,884 33,917 10,092 $2.31
Latin America 10,948 2,912 8,366 2,522 $2.28
Asia 25,899 4,606 20,204 8,292 $2.69
Worldwide $101,464 $14,787 $80,070 28,092 $2.47 8 - 12 months
Total Expected Investment in Total Potential Historical Average
Investment Q4 2017 CuFt / DPUs NOI/CuFt or DPU(4)
Building Development Projects
North America(5) $19,593 $3,873 $12,804 - 441 $2.52
Europe(3) 2,954 - 2,738 368 22 $2.31
Latin America 22,411 672 12,648 5,196 222 $2.28
Asia - - - - - $2.69
Worldwide $44,958 $4,545 $28,190 5,564 684 $2.47 24 - 36 months
Purchase Expected Net
Price IRRs Proceeds
2017 Building Acquisitions 2017 Building Sales
North America $33,710 384 9% North America - -
Europe(2) - - - Europe - -
Latin America - - - Latin America - -
Asia - - - Asia Pacif ic - -
Worldwide $33,710 384 9% Worldwide - -
RegionCumulative
Investment to Date
Region
Total Sq Ft
Average Stabilization
Period
Total Sq FtAverage Stabilization
Period
Cumulative
Investment to Date
Region RegionTotal Sq Ft

www.ironmountain.com Selected metric definitions are available in the Appendix
Acquisitions and Disposals(1)
36
(1) Based on 2017 C$ Budgeted FX Rates.(2) Includes South Africa and United Arab Emirates.
Purchase Expected
Price IRRs
2017 Building Acquisitions
North America $33,710 384 9%
Europe(2) - - -
Latin America - - -
Asia - - -
Worldwide $33,710 384 9%
Region Total Sq Ft
Section
VIII
Section
IXSection
VII
Section
VISection
VSection
IVSection
IIISection
XSection
IISection
ISection
XI
Business Business
Investments Dispositions
Purchase Price $270,292 $0Non-Cash Consideration $83,014
Capital Consideration $45,103 -Stabilized Total Expected Investment $398,409 $0
Estimated Annual Revenues $119,000 -Expected IRR Range 11% - 14% -
2017 Data Centers, Business and Customer Acquisition and Disposition Activity

www.ironmountain.com Selected metric definitions are available in the Appendix
ComponentsQ4 2017 Annualized
NOI
North America
Records Management $998,248Data Protection 234,801Other 56,146
Europe(1) 389,410Latin America 170,412Asia 156,158Global Data Center 20,511Total Portfolio Storage NOI 2,025,686
Service Adjusted EBITDAR(2) $294,923
Balance at
12/31/2017
Cash, Cash Equivalents & Other Tangible Assets(3) $1,950,314Quarterly Building & Racking Investment, not reflected in NOI $19,333Data Center Investment, not reflected in NOI $19,900Customer Acquisition Consideration 6,279 Less:
Debt, Gross Book Value(4) $7,043,271Non-Controlling Interests $1,404Annualized Rental Expense $308,536Estimated Tax Liability $15,909
Q4 2017 Service
Adjusted EBITDAR
Components of Value
37
(1) Includes South Africa and United Arab Emirates. (2) Q4 2017 annualized.(3) Includes Cash, Cash Equivalents, Restricted Cash, Accounts Receivable, Other Tangible Current Assets and Prepaid Expenses.(4) Calculated as current portion of Long-Term Debt of $146mm plus Long-Term Debt Net of Current Portion of $6,897mm.
Section
VIII
Section
IXSection
VII
Section
VISection
VSection
IVSection
IIISection
XSection
IISection
ISection
XI

www.ironmountain.com Selected metric definitions are available in the Appendix
Appendix
38
Section
VIII
Section
IXSection
VII
Section
VISection
VSection
IVSection
IIISection
XSection
IISection
ISection
XI
2017 Quarterly Results Based on New Reporting Segments
By Reporting Segment
Q1 2017 Q2 2017 Q3 2017 Q4 2017 Full Year 2017
NA Records and Information Management Business
Storage Rental $298,183 $305,168 $308,822 $309,322 $1,221,495Service 209,414 204,429 204,745 210,263 828,851
Total Revenues $507,597 $509,597 $513,567 $519,585 $2,050,346Adjusted EBITDA & Margin 209,530 41.3% 220,768 43.3% 224,882 43.8% 228,978 44.1% 884,158 43.1%
NA Data Management Business
Storage Rental $68,824 $68,735 $70,075 $68,782 $276,416Service 32,010 30,942 31,155 31,117 125,224
Total Revenues $100,834 $99,677 $101,230 $99,899 $401,640Adjusted EBITDA & Margin 55,270 54.8% 55,448 55.6% 56,433 55.7% 56,173 56.2% 223,324 55.6%
Western European Business
Storage Rental $71,567 $74,535 $78,012 $79,091 $303,205Service 48,505 47,331 50,070 52,631 198,537
Total Revenues $120,072 $121,866 $128,082 $131,722 $501,742Adjusted EBITDA & Margin 34,142 28.4% 36,528 30.0% 43,464 33.9% 45,890 34.8% 160,024 31.9%
Other International Business
Storage Rental $117,615 $121,317 $125,903 $128,283 $493,118Service 71,626 71,088 73,795 75,228 291,737
Total Revenues $189,241 $192,405 $199,698 $203,511 $784,855Adjusted EBITDA & Margin 55,347 29.2% 56,166 29.2% 59,082 29.6% 55,835 27.4% 226,430 28.8%
Global Data Center Business
Storage Rental $5,858 $9,931 $7,761 $12,289 $35,839Service 365 429 488 573 1,855
Total Revenues $6,223 $10,360 $8,249 $12,862 $37,694Adjusted EBITDA & Margin 1,506 24.2% 5,991 57.8% 1,077 13.1% 2,701 21.0% 11,275 29.9%
Corporate and Other Business
Storage Rental $10,232 $10,554 $10,517 $16,181 $47,484Service 4,677 5,347 4,318 7,475 21,817
Total Revenues $14,909 $15,901 $14,835 $23,656 $69,301Adjusted EBITDA (63,221) (56,847) (61,914) (63,033) (245,015)
Total
Storage Rental $572,279 $590,240 $601,090 $613,948 $2,377,557Service 366,597 359,566 364,571 377,287 1,468,021
Total Revenues $938,876 $949,806 $965,661 $991,235 $3,845,578Adjusted EBITDA & Margin 292,574 31.2% 318,054 33.5% 323,024 33.5% 326,544 32.9% 1,260,196 32.8%

www.ironmountain.com Selected metric definitions are available in the Appendix
Appendix
39
Non-GAAP Measures and Definitions
Non-GAAP measures are supplemental metrics designed to enhance our disclosure and to provide additional information that we believe to be important for investors to consider when evaluating our financial performance. These non-GAAP measures should be considered in addition to, but not as a substitute for, other measures of financial performance reported in accordance with accounting principles generally accepted in the United States of America (“GAAP”), such as operating income, income (loss) from continuing operations, net income (loss) or cash flows from operating activities from continuing operations (as determined in accordance with GAAP).
Adjusted Earnings Per Share, or Adjusted EPS
Adjusted EPS is defined as reported earnings per share fully diluted from continuing operations excluding: (1) loss (gain) on disposal/write-down of property, plant and equipment (excluding real estate), net; (2) gain on sale of real estate, net of tax; (3) intangible impairments; (4) other expense (income), net; (5) Recall Costs (as defined below); and (6) the tax impact of reconciling items and discrete tax items. Adjusted EPS includes income (loss) attributable to noncontrolling interests. We do not believe these excluded items to be indicative of our ongoing operating results, and they are not considered when we are forecasting our future results. We believe Adjusted EPS is of value to our current and potential investors when comparing our results from past, present and future periods.
Adjusted Funds From Operations, or AFFO
AFFO is defined as FFO (Normalized) excluding non-cash rent expense or income, plus depreciation on non-real estate assets, amortization expense of customer relationship intangible assets, deferred financing costs and permanent withdrawal fees, stock-based compensation expense and the impact of reconciling to normalized cash taxes, less maintenance capital expenditures and non-real estate investments, excluding Recall integration capital expenditures. We believe AFFO is a useful measure in determining our ability to generate excess cash that may be used for reinvestment in the business, discretionary deployment in investments such as real estate or acquisition opportunities, returning capital to our stockholders and voluntary prepayments of indebtedness. Additionally AFFO is reconciled to cash flow from operations to adjust for real estate and REIT tax adjustments, Recall Costs and other non-cash expenses. AFFO does not include adjustments for customer inducements, acquisition of customer relationships and investment in innovation as we consider these expenditures to be growth related.
Section
VIII
Section
IXSection
VII
Section
VISection
VSection
IVSection
IIISection
XSection
IISection
ISection
XI

www.ironmountain.com Selected metric definitions are available in the Appendix
Appendix
Non-GAAP Measures and Definitions (continued)
Adjusted EBITDA and Adjusted EBITDA Margin
Adjusted EBITDA is defined as income (loss) from continuing operations before interest expense, net, provision (benefit) for income taxes, depreciation and amortization, and also excludes certain items that we believe are not indicative of our core operating results, specifically: (1) loss (gain) on disposal/write-down of property, plant and equipment (excluding real estate), net; (2) intangible impairments; (3) other expense (income), net; (4) gain on sale of real estate, net of tax; and (5) Recall Costs. Adjusted EBITDA Margin is calculated by dividing Adjusted EBITDA by total revenues. We use multiples of current or projected Adjusted EBITDA in conjunction with our discounted cash flow models to determine our estimated overall enterprise valuation and to evaluate acquisition targets. We believe Adjusted EBITDA and Adjusted EBITDA Margin provide our current and potential investors with relevant and useful information regarding our ability to generate cash flow to support business investment. These measures are an integral part of the internal reporting system we use to assess and evaluate the operating performance of our business.
Adjusted EBITDA excludes both interest expense, net and the provision (benefit) for income taxes. These expenses are associated with our capitalization and tax structures, which we do not consider when evaluating the operating profitability of our core operations. Finally, Adjusted EBITDA does not include depreciation and amortization expenses, in order to eliminate the impact of capital investments, which we evaluate by comparing capital expenditures to incremental revenue generated and as a percentage of total revenues. Adjusted EBITDA and Adjusted EBITDA Margin should be considered in addition to, but not as a substitute for, other measures of financial performance reported in accordance with GAAP,such as operating income, income (loss) from continuing operations, net income (loss) or cash flows from operating activities from continuing operations (as determined in accordance with GAAP).
Funds From Operations, or FFO (Nareit), and FFO (Normalized)
Funds from operations (“FFO”) is defined by the National Association of Real Estate Investment Trusts ("Nareit") and us as net income (loss) excluding depreciation on real estate assets and gain on sale of real estate, net of tax (“FFO (Nareit)”). FFO (Nareit) does not give effect to real estate depreciation because these amounts are computed, under GAAP, to allocate the cost of a property over its useful life. Because values for well-maintained real estate assets have historically increased or decreased based upon prevailing market conditions, we believe that FFO (Nareit) provides investors with a clearer view of our operating performance. Our most directly comparable GAAP measure to FFO (Nareit) is net income. Although Nareit has published a definition of FFO, modifications to FFO (Nareit) are common among REITs as companies seek to provide financial measures that most meaningfully reflect their particular business. Our definition of FFO (Normalized) excludes certain items included in FFO (Nareit) that we believe are not indicative of our core operating results, specifically: (1) loss (gain) on disposal/write-down of property, plant and equipment (excluding real estate), net; (2) intangible impairments; (3) other expense (income), net; (4) Recall Costs; (5) the tax impact of reconciling items and discrete tax items; (6) (income) loss from discontinued operations, net of tax; and (7) loss (gain) on sale of discontinued operations, net of tax.
40
Section
VIII
Section
IXSection
VII
Section
VISection
VSection
IVSection
IIISection
XSection
IISection
ISection
XI

www.ironmountain.com Selected metric definitions are available in the Appendix
Appendix
Non-GAAP Measures and Definitions (continued)
FFO (Normalized) per share
FFO (Normalized) divided by weighted average fully-diluted shares outstanding.
Service Adjusted EBITDA
Service Adjusted EBITDA is calculated by taking service revenues excluding terminations and permanent withdrawals less direct expenses and overhead allocated to the service business. Terminations and permanent withdrawals are excluded from this calculations as they are included in the Storage NOI calculation.
Service Adjusted EBITDAR
Service Adjusted EBITDA as defined above, excluding rent expense associated with the service business. This is provided to enable valuation of Service Adjusted EBITDA irrespective of whether the company’s properties are leased or owned. Related rent expense is provided in the Components of Value slide.
Storage Adjusted EBITDA
Storage Adjusted EBITDA is calculated by taking storage revenues including terminations and permanent withdrawal fees less direct expenses and overhead allocated to the storage business.
Storage Net Operating Income, or Storage NOI
Storage NOI is defined as revenue from rental activities (storage rental revenue, termination fees and permanent withdrawal fees) less storage rental costs. Storage rental costs include facility costs (excluding rent), storage rental labor, other storage costs and allocated overhead. Storage NOI is commonly used in the REIT industry and enables investors to understand and value the income generated from the company’s real estate. Rent expense is excluded to enable valuation of this income irrespective of whether the company’s properties are leased or owned. Related rent expense is provided in the Components of Value slide.
41
Section
VIII
Section
IXSection
VII
Section
VISection
VSection
IVSection
IIISection
XSection
IISection
ISection
XI

www.ironmountain.com Selected metric definitions are available in the Appendix
Appendix
Other Definitions
Average Stabilization Period – For racking projects, the stabilization period is 8 to 12 months. For new buildings it is 24 to 36 months, assumingphased racking installations over three years. For business acquisitions it is 12 to 24 months, depending on the size of the transaction.
Building Development Projects – The construction of new facilities, or three-wall additions.
Business Segments
North American Records and Information Management Business (“RIM”) – Our North American Records and Information Management Business segment provides records and information management services, including the storage of physical records, including media such as microfilm and microfiche, film, X-rays and blueprints, including healthcare information services, vital records services, service and courier operations, and the collection, handling and disposal of sensitive documents for corporate customers (“Records Management”); Destruction; and Information Governance and Digital Solutions throughout the United States and Canada; as well as fulfillment services and technology escrow services in the United States.
North American Data Management Business (“DM”) – Our North American Data Management Business segment provides storage and rotation of backup computer media as part of corporate disaster recovery plans, including service and courier operations (“Data Protection & Recovery”); server and computer backup services; and related services offerings, including our Iron Cloud solutions.
Western European Business – Our Western European Business segment provides records and information management services, including Records Management, Data Protection & Recovery and Information Governance and Digital Solutions throughout Austria, Belgium, France, Germany, Ireland, the Netherlands, Spain, Switzerland and the United Kingdom (consisting of our operations in England, Northern Ireland and Scotland), as well as Information Governance and Digital Solutions in Sweden (the remainder of our business in Sweden is included in the Other International Business segment described on the following page).
42
Section
VIII
Section
IXSection
VII
Section
VISection
VSection
IVSection
IIISection
XSection
IISection
ISection
XI

www.ironmountain.com Selected metric definitions are available in the Appendix
Appendix
Other Definitions (continued)
Other International Business – Our Other International Business segment provides records and information management services throughout the remaining European countries in which we operate, Latin America, Asia and Africa. Our European operations included in this segment provide records and information management services, including Records Management, Data Protection & Recovery and Information Governance and Digital Solutions throughout Cyprus, the Czech Republic, Denmark, Finland, Greece, Hungary, Norway, Poland, Romania, Serbia, Slovakia, and Turkey; Records Management and Information Governance and Digital Solutions in Estonia, Latvia and Lithuania; and Records Management in Sweden. Our Latin America operations provide records and information management services, including Records Management, Data Protection & Recovery, Destruction and Information Governance and Digital Solutions throughout Argentina, Brazil, Chile, Colombia, Mexico and Peru. Our Asia operations provide records and information management services, including Records Management, Data Protection & Recovery, Destruction and Information Governance and Digital Solutions throughout Australia and New Zealand, with Records Management and Data Protection & Recovery also provided in certain markets in China (including Taiwan and Macau), Hong Kong, India, Indonesia, Malaysia, the Philippines, Singapore, South Korea, Thailand and the United Arab Emirates. Our African operations provide Records Management, Data Protection & Recovery and Information Governance and Digital Solutions in South Africa.
Global Data Center Business – Our Global Data Center segment provides data center facilities to protect mission-critical assets and ensure the continued operation of our customers’ IT infrastructures, with secure and reliable colocation and wholesale options. As of December 31, 2017, we had data center operations in five U.S. markets in the United States including: Denver, Colorado; Kansas City, Missouri; Boston, Massachusetts; Boyers, Pennsylvania; and Manassas, Virginia and had binding agreements to acquire data center operations in Arizona, New Jersey and Ohio as well as London and Singapore.
Corporate and Other – Our Corporate and Other Business segment primarily consists of the storage, safeguarding and electronic or physical delivery of physical media of all types and digital content repository systems to house, distribute, and archive key media assets, primarily for entertainment and media industry clients (“Entertainment Services”), throughout the United States, Canada, France, Hong Kong, the Netherlands and the United Kingdom, as well as our fine art storage businesses and consumer storage businesses in the United States. These businesses, represent the primary product offerings of our Adjacent Businesses operating segment, costs related to executive and staff functions, including finance, human resources and IT, which benefit the enterprise as a whole. These costs are primarily related to the general management of these functions on a corporate level and the design and development of programs, policies and procedures that are then implemented in the individual segments, with each segment bearing its own cost of implementation. Our Corporate and Other Business segment also includes stock-based employee compensation expense associated with all stock options, restricted stock units, performance units and shares of stock issued under our employee stock purchase plan.
43
Section
VIII
Section
IXSection
VII
Section
VISection
VSection
IVSection
IIISection
XSection
IISection
ISection
XI

www.ironmountain.com Selected metric definitions are available in the Appendix
Appendix
44
Definitions (continued)
Capacity Measures
Building Capacity – The maximum number of cubic feet of records or standard DPUs that can be stored in a given facility.
Building Capacity Utilization – The number of cubic feet of records or standard DPUs in storage divided by the Building Capacity.
Installed Racking Capacity – The storage capacity of the racking installed in a given facility. Capacity is generally measured in cubic feet or standard DPUs.
Installed Racking Capacity Utilization – The number of cubic feet of records or standard DPUs in storage divided by the Installed Racking Capacity.
Capital Expenditures and Investments – Our business requires capital expenditures to support our expected storage rental revenue and service revenue growth and ongoing operations, new products and services and increased profitability. The majority of our capital goes to support business line growth and our ongoing operations. Additionally, we invest capital to acquire or construct real estate. We also expend capital to support the development and improvement of products and services and projects designed to increase our profitability. These expenditures are generally relatively small and discretionary in nature. We categorize our capital expenditures as follows:
Real Estate:
Investment – Real estate assets that support core business growth primarily related to investments in land, buildings, building improvements, leasehold improvements and racking structures that expand our revenue capacity in existing or new geographies, replace a long-term operational obligation or create operational efficiencies (“Real Estate Investment”).
Maintenance – Real estate assets necessary to maintain ongoing business operations primarily related to the repair or replacement of real estate assets such as buildings, building improvements, leasehold improvements and racking structures (“Real Estate Maintenance”).
Section
VIII
Section
IXSection
VII
Section
VISection
VSection
IVSection
IIISection
XSection
IISection
ISection
XI

www.ironmountain.com Selected metric definitions are available in the Appendix
Appendix
45
Definitions (continued)
Capital Expenditures and Investments (continued)
Non-Real Estate:
Investment – Non-real estate assets that either (i) support the growth of our business, and/or increase our profitability, such as customer-inventory technology systems, and technology service storage and processing capacity, or (ii) are directly related to the development of core products or services in support of our integrated value proposition and enhance our leadership position in the industry, including items such as increased feature functionality, security upgrades or system enhancements (“Non-Real Estate Investment”). Prior to Q1 2017, Innovation and Growth Investment was included in Non-Real Estate Investment.
Maintenance – Non-real estate assets necessary to maintain ongoing business operations primarily related to the repair or replacement of customer-facing assets such as containers and shred bins, warehouse equipment, fixtures, computer hardware, or third-party or internally-developed software assets. This category also includes capital to support initiatives such as sales and marketing and information technology projects to support infrastructure requirements (“Non-Real Estate Maintenance”).
Data Center Investment and Maintenance:
Capital expenditures that support data center business growth, primarily related to investments in new construction of data center facilities (including the acquisition of land and development of facilities) or capacity expansion in existing buildings, as well as capital expenditures that are expected to support incremental improvements to our data center business, through either increasing revenue, improving operating efficiency, or extending the useful life of our real estate operating assets. This also includes capital expenditures necessary to maintain ongoing business operations primarily related to the repair or maintenance of assets, as well as for the re-configuration of existing assets.
Innovation and Growth Investment:
Discretionary capital expenditures in significant new products and services in new, existing or adjacent business opportunities. Prior to Q1 2017, Innovation and Growth Investment was included in Non-Real Estate Investment.
Section
VIII
Section
IXSection
VII
Section
VISection
VSection
IVSection
IIISection
XSection
IISection
ISection
XI

www.ironmountain.com Selected metric definitions are available in the Appendix
Appendix
46
Other Definitions (continued)
Capital Expenditures and Investments (continued)
Components of Overhead
Allocated Overhead – Includes overhead expenses directly associated with storage and service business operations allocated as follows:
Field Operation Costs – Allocated to storage and service operations based on percent of revenue.
Bad Debt Expenses – Allocated to storage and service operations based on percent of revenue.
Transportation Costs – Allocated fully to service operations.
Corporate Overhead – Includes all other overhead expenses associated with business support functions, including: Executive, Legal, Real Estate/Facilities, Accounting, Financial Performance & Analysis, Treasury, Tax, Internal Audit, M&A, Security, Procurement, HR, REIT, Other G&A, Integration Costs, IT, Product Engineering and Product Management.
Customer Turnover Overhead – Overhead associated with customer acquisition and retention including Sales, Marketing and Account Management expenses.
Constant Dollar Growth (C$) – The year-over-year growth rate excluding the impact of changes to foreign currency exchange rates. Constant currency growth rates are a non-GAAP measure calculated by translating the 2016 results at the 2017 constant dollar budget rates.
Cumulative Investment to Date – Total spend to date since project approval.
Customer Inducements – Represents Move Costs and Permanent Withdrawal Fees.
Data Center Business Definitions
Leasable MW – Represents the amount of critical power capacity available for customer use, measured in megawatts.
Leasable Sq. Ft. – Represents the amount of space available for customer use, measured in square feet. Primarily includes raised floor area, office area and storage area. Excludes support spaces dedicated for mechanical and electrical infrastructure and common areas such as roadways in our underground locations, corridors, lobbies, and loading/unloading areas.
Leased % Calculation – Calculated as the megawatts under contract divided by the leasable megawatts.
.
Section
VIII
Section
IXSection
VII
Section
VISection
VSection
IVSection
IIISection
XSection
IISection
ISection
XI

www.ironmountain.com Selected metric definitions are available in the Appendix
Appendix
47
Other Definitions (continued)
Data Center Business Definitions (continued)
TCV – “Total Contract Value” represents total revenue contracted for active contracts through the contract term, not including renewals or extensions, but including fixed power charges.
Total MW - Total amount of existing and planned critical power capacity at full build-out, measured in megawatts.
WALE – “Weighted Average Lease Expiry” (in years) is calculated on a revenue basis, using annual GAAP revenue of all in-place contracts, excluding utility reimbursements.
Destruction Rate – Calculated by dividing the total number of cubic feet of records removed from inventory due to destructions in a one-year period divided by the total number of cubic feet of records in storage at the beginning of the period.
DPUs – Data protection units, a unit of measurement specific to our Data Protection storage services.
Estimated CuFt / DPUs – Estimated based on expected growth and consolidation, resulting from moving boxes from one facility to another.
Historical Average NOI / CF or DPU – The quarterly annualized Storage NOI for a specific region (NA, Europe, Africa, Latin America, Asia) and product (Records Management or Data Protection).
Internal Revenue Growth – Our internal revenue growth rate, which is a non-GAAP measure, represents the year-over-year growth rate of our revenues excluding the impact of business acquisitions, divestitures and foreign currency exchange rate fluctuations. The revenues generated by Recall have been integrated with our existing revenues and it is impracticable for us to determine actual Recall revenue contribution for the applicable periods. Therefore, our internal revenue growth rates exclude the impact of revenues associated with the Recall Transaction based upon forecasted or budgeted Recall revenues beginning in the third quarter of 2016 through the one-year anniversary of the Recall Transaction. Our internal revenue growth rate includes the impact of acquisitions of customer relationships.
Investment in Current Period – Spend within the quarter being reported.
Lease Adjusted Leverage Ratio – The calculation for this ratio is EBITDA plus rent expense divided by net debt including the capitalized value of lease obligations plus six times rent expense.
Net Volume Growth – New Records Management storage volume from existing customers, plus volume from new customers and volume from acquisitions, offset by volume related to destructions, permanent withdrawals and customer terminations. Quarterly percentages are calculated by dividing the trailing four quarters’ total activity by the ending balance of the same prior-year period.
Section
VIII
Section
IXSection
VII
Section
VISection
VSection
IVSection
IIISection
XSection
IISection
ISection
XI
www.ironmountain.com Selected metric definitions are available in the Appendix
Appendix
48
Other Definitions (continued)
Non-Cash Rent Expense – Calculated as rent expense less cash paid for rent.
Permanent Withdrawal Rate – Calculated by dividing the total number of cubic feet of records removed from inventory due to permanent withdrawals in a one-year period divided by the total number of cubic feet of records in storage at the beginning of the period. Permanent withdrawals occur when records are permanently removed from inventory by customers for reasons other than the customer terminating its relationship.
Racking Installations – Defined as any incremental racking spend on buildings constructed or operated prior to January 1, 2014. Racking projects are tracked from first dollar spent until completion, which is defined as when the first box is entered into storage. Racking spend on buildings constructed subsequent to January 1, 2014 is included in Building Development Projects.
Recall Costs – Represents operating expenditures associated with the Recall Transaction, including: (i) advisory and professional fees to complete the Recall Transaction; (ii) costs associated with the Divestments required in connection with receipt of regulatory approvals (including transitional services); and (iii) costs to integrate Recall with our existing operations, including moving, severance, facility upgrade, REIT conversion and system upgrade costs, as well as certain costs associated with our shared service center initiative for our finance, human resources and information technology functions.
REIT Countries – Countries where we operate that have been converted into a qualified REIT subsidiary and taxable REIT subsidiary structure, the group includes the following: Australia, Canada, Germany, Ireland, Mexico, Netherlands, Poland, Spain, United Kingdom and the United States.
Service Profit and Margin – The Gross Profit and Margin attributable to the worldwide service business. Calculated as follows:Services Adj. EBITDA
+ Allocated Overhead Expenses+ Termination and Permanent Withdrawal Fees= Service Profit ($)
/ Total Service Revenues (including Termination and Permanent Withdrawal Fees)= Service Margin (%)
Storage Profit and Margin – The Gross Profit and Margin attributable to the worldwide storage business. Calculated as follows:Storage Net Operating Income
+ Allocated Overhead Expenses- Storage Rent- Termination and Permanent Withdrawal Fees= Storage Profit ($)
/ Total Storage Revenues (excluding Termination and Permanent Withdrawal Fees)= Storage Margin (%)
Section
VIII
Section
IXSection
VII
Section
VISection
VSection
IVSection
IIISection
XSection
IISection
ISection
XI

www.ironmountain.com Selected metric definitions are available in the Appendix
Appendix
49
Other Definitions (continued)
Tangible Assets – Includes PP&E, cash and cash equivalents, restricted cash, accounts receivable, deferred income taxes, and prepaid expenses.
Tax Rates
Effective Tax Rate – GAAP tax rate for the period calculated as tax expense or benefit for the quarter (total of current and deferred tax provisions), including discrete items, and divided by profit before tax for the period.
Structural Tax Rate – Estimated tax rate for the full fiscal year based on forecasted ordinary income and forecasted tax expense/benefit excluding any significant unusual or infrequently occurring items (i.e., discrete items) and items recognized net of tax on the financials (i.e., discontinued operations).
Total Expected Investment – Is defined as follows:
Total Expected Investment for Racking Installations – The sum of expected investments for all approved racking projects, reported on a constant dollar basis.
Total Expected Investment for Building Development Projects – The sum of expected investments for all approved building projects, including the expected costs of approved racking installations, reported on a constant dollar basis.
Total Expected Investment for Data Center Business – Represents estimated amount of capital to be invested in data center development currently under construction measured in USD.
Transformation Initiative – During the third quarter of 2015, we implemented a plan that calls for certain organizational realignments to reduce our overhead costs, particularly in our developed markets, in order to optimize our selling, general and administrative cost structure and to support investments to advance our growth strategy, which is expected to be completed by the end of 2017.
Volume Retention Rate – One minus the result of dividing the total number of cubic feet of records removed from inventory due to customer terminations and destructions in a one-year period by the total number of cubic feet of records in storage at the beginning of the period.
Section
VIII
Section
IXSection
VII
Section
VISection
VSection
IVSection
IIISection
XSection
IISection
ISection
XI