Iron, magnesium, and titanium isotopic fractionations ...
28
Iron, magnesium, and titanium isotopic fractionations between garnet, ilmenite, fayalite, biotite, and tourmaline: Results from NRIXS, ab initio, and study of mineral separates from the Moosilauke metapelite Nicole X. Nie a,b,c,⇑ , Nicolas Dauphas a,b , Esen E. Alp d , Hao Zeng a,b , Corliss K. Sio e , Justin Y. Hu a,b , Xi Chen a,b , Sarah M. Aarons a,b,f , Zhe Zhang a,b , Heng-Ci Tian g,h , Da Wang c , Kelsey B. Prissel c,i , Jennika Greer b,j , Wenli Bi d , Michael Y. Hu d , Jiyong Zhao d , Anat Shahar c , Mathieu Roskosz k , Fang-Zhen Teng h , Michael J. Krawczynski i , Philipp R. Heck b,j , Frank S. Spear l a Origins Laboratory, Department of the Geophysical Sciences and Enrico Fermi Institute, The University of Chicago, Chicago, IL 60637, United States b Chicago Center for Cosmochemistry, The University of Chicago, Chicago, IL 60637, United States c Earth and Planets Laboratory, Carnegie Institution for Science, Washington, DC 20015, United States d Advanced Photon Source, Argonne National Laboratory, 9700 South Cass Avenue, Argonne, IL 60439, United States e Lawrence Livermore National Laboratory, 7000 East Ave L-231, Livermore, CA 94550, United States f Scripps Institution of Oceanography, UC San Diego, La Jolla, CA 92093-0220, United States g Key Laboratory of Earth and Planetary Physics, Institute of Geology and Geophysics, Chinese Academy of Sciences, Beijing 100029, China h Isotope Laboratory, Department of Earth and Space Sciences, University of Washington, Seattle, WA 98195, United States i McDonnell Center for the Space Sciences and Department of Earth and Planetary Sciences, Washington University in St. Louis, 1 Brookings Drive, St. Louis, MO 63123, United States j Robert A. Pritzker Center for Meteoritics and Polar Studies, The Field Museum of Natural History, Chicago, IL 60605, United States k IMPMC, CNRS, UMR 7590, Sorbonne Universite ´s, Universite ´ Pierre et Marie Curie, Muse ´um National d’Histoire Naturelle, CP 52, 57 rue Cuvier, Paris F-75231, France l Department of Earth and Environmental Sciences, Rensselaer Polytechnic Institute, 110 8th Street, Troy, NY 12180, United States Received 12 August 2020; accepted in revised form 11 March 2021; available online 23 March 2021 Abstract Interpreting isotopic signatures documented in natural rocks requires knowledge of equilibrium isotopic fractionation fac- tors. Here, we determine equilibrium Fe isotope fractionation factors between several common rock-forming minerals using a comparative approach involving three independent methods: (i) isotopic analyses of natural minerals from a metapelite from Mt. Moosilauke, New Hampshire, for which equilibration temperature and pressure are well constrained to be near the alu- minosilicate triple point (T ’ 500 °C, P ’ 4 kbar), (ii) Nuclear Resonant Inelastic X-ray Scattering (NRIXS) measurements of Fe force constants of minerals, and (iii) Density Functional Theory (DFT) ab initio calculations of Fe force constants of minerals. The minerals studied for Fe isotopes include, in increasing order of their b-factors: garnet < ilmenite fayalite < bi- otite < tourmaline < muscovite plagioclase. Some of this ordering is affected by the presence of Fe 3+ in the minerals, which https://doi.org/10.1016/j.gca.2021.03.014 0016-7037/Ó 2021 Elsevier Ltd. All rights reserved. ⇑ Corresponding author. E-mail address: [email protected] (N.X. Nie). www.elsevier.com/locate/gca Available online at www.sciencedirect.com ScienceDirect Geochimica et Cosmochimica Acta 302 (2021) 18–45
Transcript of Iron, magnesium, and titanium isotopic fractionations ...

Available online at www.sciencedirect.com
www.elsevier.com/locate/gca
ScienceDirect
Geochimica et Cosmochimica Acta 302 (2021) 18–45
Iron, magnesium, and titanium isotopic fractionationsbetween garnet, ilmenite, fayalite, biotite, and tourmaline:
Results from NRIXS, ab initio, and study of mineralseparates from the Moosilauke metapelite
Nicole X. Nie a,b,c,⇑, Nicolas Dauphas a,b, Esen E. Alp d, Hao Zeng a,b, Corliss K. Sio e,Justin Y. Hu a,b, Xi Chen a,b, Sarah M. Aarons a,b,f, Zhe Zhang a,b, Heng-Ci Tian g,h,
Da Wang c, Kelsey B. Prissel c,i, Jennika Greer b,j, Wenli Bi d, Michael Y. Hu d,Jiyong Zhao d, Anat Shahar c, Mathieu Roskosz k, Fang-Zhen Teng h,
Michael J. Krawczynski i, Philipp R. Heck b,j, Frank S. Spear l
aOrigins Laboratory, Department of the Geophysical Sciences and Enrico Fermi Institute, The University of Chicago, Chicago, IL 60637,
United StatesbChicago Center for Cosmochemistry, The University of Chicago, Chicago, IL 60637, United States
cEarth and Planets Laboratory, Carnegie Institution for Science, Washington, DC 20015, United StatesdAdvanced Photon Source, Argonne National Laboratory, 9700 South Cass Avenue, Argonne, IL 60439, United States
eLawrence Livermore National Laboratory, 7000 East Ave L-231, Livermore, CA 94550, United StatesfScripps Institution of Oceanography, UC San Diego, La Jolla, CA 92093-0220, United States
gKey Laboratory of Earth and Planetary Physics, Institute of Geology and Geophysics, Chinese Academy of Sciences, Beijing 100029, Chinah Isotope Laboratory, Department of Earth and Space Sciences, University of Washington, Seattle, WA 98195, United States
iMcDonnell Center for the Space Sciences and Department of Earth and Planetary Sciences, Washington University in St. Louis,
1 Brookings Drive, St. Louis, MO 63123, United StatesjRobert A. Pritzker Center for Meteoritics and Polar Studies, The Field Museum of Natural History, Chicago, IL 60605, United Statesk IMPMC, CNRS, UMR 7590, Sorbonne Universites, Universite Pierre et Marie Curie, Museum National d’Histoire Naturelle, CP 52,
57 rue Cuvier, Paris F-75231, FrancelDepartment of Earth and Environmental Sciences, Rensselaer Polytechnic Institute, 110 8th Street, Troy, NY 12180, United States
Received 12 August 2020; accepted in revised form 11 March 2021; available online 23 March 2021
Abstract
Interpreting isotopic signatures documented in natural rocks requires knowledge of equilibrium isotopic fractionation fac-tors. Here, we determine equilibrium Fe isotope fractionation factors between several common rock-forming minerals using acomparative approach involving three independent methods: (i) isotopic analyses of natural minerals from a metapelite fromMt. Moosilauke, New Hampshire, for which equilibration temperature and pressure are well constrained to be near the alu-minosilicate triple point (T ’ 500 �C, P ’ 4 kbar), (ii) Nuclear Resonant Inelastic X-ray Scattering (NRIXS) measurements ofFe force constants of minerals, and (iii) Density Functional Theory (DFT) ab initio calculations of Fe force constants ofminerals.
The minerals studied for Fe isotopes include, in increasing order of their b-factors: garnet < ilmenite � fayalite < bi-otite < tourmaline < muscovite � plagioclase. Some of this ordering is affected by the presence of Fe3+ in the minerals, which
https://doi.org/10.1016/j.gca.2021.03.014
0016-7037/� 2021 Elsevier Ltd. All rights reserved.
⇑ Corresponding author.E-mail address: [email protected] (N.X. Nie).

N.X. Nie et al. /Geochimica et Cosmochimica Acta 302 (2021) 18–45 19
tends to form stiffer bonds and be associated with heavy Fe isotope enrichments relative to Fe2+. We are, however, able toassess the magnitude of the effect of the ratio Fe3+/RFe on equilibrium fractionation factors, notably on the ilmenite-hematitesolid solution. Equilibrium Fe isotopic fractionation factors between garnet, ilmenite, biotite, tourmaline and fayalite aredetermined. We also report Mg and Ti isotopic compositions of selected Moosilauke minerals that allow us to better constrainthe equilibrium fractionation factors for garnet-biotite-tourmaline (Mg isotopes) and biotite-ilmenite (Ti isotopes).
We show how the newly determined equilibrium fractionation factors can be used to address diverse problems in Earth andplanetary sciences, notably (i) Fe and Mg isotopic fractionation during anatexis, (ii) Fe isotopic fractionation in lunar ilme-nite, and (iii) Ti isotopic fractionation during fluvial transport of minerals.� 2021 Elsevier Ltd. All rights reserved.
Keywords: Iron isotopes; Mg isotopes; Ti isotopes; Moosilauke Metapelite; NRIXS; Ab initio calculations
1. INTRODUCTION
Recent years have seen rapid growth in the applicationsof non-traditional stable isotopes to diverse topics rangingfrom cosmochemistry to medicine (Teng et al., 2017 andreferences therein). The iron isotope system has been exten-sively studied due to the ubiquity of Fe in most rocks andits variable oxidation states. It has been used to traceprocesses covering both high-temperature (e.g., early solarsystem formation, planetary accretion, magmatic differenti-ation, and core formation) and low-temperature processes(e.g., iron absorption in humans, surface weathering, ironcycling in the oceans and sediments) (Dauphas et al.,2017 and references therein). To interpret iron isotopic vari-ations in nature, it is crucial to know how Fe isotopes arefractionated between coexisting phases at equilibrium. Insome systems, these equilibrium isotopic fractionation fac-tors are poorly constrained, or published results are incon-sistent, which leads to ambiguities in interpretations.
Four independent methods can be used to determineequilibrium Fe isotope fractionation factors (Dauphaset al., 2017; Shahar et al., 2017): (i) One can measure natu-ral co-existing minerals (e.g., Beard and Johnson, 2004;Huang et al., 2011; Wu et al., 2017; Ye et al., 2020) but itcan be difficult to assess whether the minerals are in isotopicequilibrium, and even if they are, the equilibration temper-ature can be difficult to assess. Sample selection is thus crit-ical. (ii) One can measure the isotopic compositions of theproducts of laboratory experiments where the coexistingphases have achieved equilibrium or any departure thereofcan be corrected for (e.g., Skulan et al., 2002; Welch et al.,2003; Shahar et al., 2008, 2015; Beard et al., 2010; Elardoand Shahar, 2017; Sossi and O’Neill, 2017; Prissel et al.,2018). Equilibration between minerals has to be evaluatedcarefully because kinetic effects can cause large isotopicfractionation and therefore mask equilibrium fractionation.(iii) One can use the synchrotron radiation spectroscopictechnique of nuclear resonant inelastic X-ray scattering(NRIXS) to derive mean kinetic energy or mean force con-stant of Fe in minerals, from which fractionation factorsbetween minerals can be calculated (e.g., Polyakov et al.,2007; Dauphas et al., 2012, 2018; Blanchard et al., 2015;Roskosz et al., 2015). This technique can only be appliedto Mossbauer isotopes such as 57Fe, so not all elementscan be measured using this method. The technique is rela-tively new, but it has been applied to isotopic fractionations
of Fe and Sn (e.g., Dauphas et al., 2012; Blanchard et al.,2015; Roskosz et al., 2015, 2020, Shahar et al., 2016) andcan also be applied to others such as Kr, Eu, and Dy(Dauphas et al., 2018). (iv) One can perform ab initio calcu-lations using density-functional theory (DFT), from whichvibrational frequencies can be obtained to calculate isotopefractionation factors (e.g., Schauble, 2004; Hill andSchauble, 2008; Ottonello and Zuccolini, 2009; Rustadand Dixon, 2009; Fujii et al., 2014; Blanchard et al., 2017).
All the approaches highlighted above have strengths andweaknesses. We have therefore performed a comprehensivestudy to evaluate the degree of consistency between thesedifferent methods and their ability to correctly predict iso-tope fractionation factors. In the present work, we havestudied equilibrium isotope fractionation factors (mainlyFe, as well as Mg and Ti for selected phases) between sev-eral rock-forming minerals using three independent meth-ods. The goals of this study are to (i) more preciselyconstrain equilibrium fractionation factors and (ii) testthe consistency between various approaches. We first mea-sured the Fe isotopic compositions of minerals from a peli-tic schist from Mt. Moosilauke, New Hampshire, for whichthe temperature and pressure conditions are very well con-strained to be very near the aluminosilicate (Al2SiO5) triplepoint (T ’ 500 �C, P ’ 4 kbar; Hodges and Spear, 1982).This rock was used to calibrate many geothermobarometersbased on mineral paragenesis and element distributionbetween coexisting minerals. It is thus particularly well sui-ted for calibrating equilibrium isotopic fractionation fac-tors. We have also performed NRIXS measurements todetermine the Fe force constants of these minerals andthe equilibrium isotopic fractionation factors betweenthem. Finally, we performed ab initio calculations using aDFT approach to calculate Fe force constants and isotopicfractionation factors. The results from the three methodsare compared with each other to test their consistencyand to ensure that the equilibrium fractionation factorsthus derived are reliable.
In this work we study several minerals, including garnet,ilmenite, biotite, tourmaline, muscovite, plagioclase, quartz(these minerals are present in the pelitic schist from Moosi-lauke) and olivine (olivine is not present in the schist butNRIXS and ab initio calculations were performed on itfor comparison purposes). Applications of these equilib-rium fractionation factors to metamorphic and igneouspetrology are discussed.

20 N.X. Nie et al. /Geochimica et Cosmochimica Acta 302 (2021) 18–45
2. SAMPLES AND METHODS
2.1. Natural minerals from Mt. Moosilauke
Measuring naturally co-existing minerals provides arelatively straightforward way of constraining equilibriumisotope fractionation factors. Sample selection is howevercritical, because not all co-existing minerals are in isotopicequilibrium in metamorphic and igneous rocks, and themagnitude of equilibrium isotopic fractionation factorsbetween two phases decreases with increasing equilibrationtemperature (DA-B / 1/T2; pressure has negligible effectcompared to temperature, at least in conditions relevantto crustal processes; Bigeleisen and Mayer, 1947). There-fore, knowing precisely the equilibration temperatures ofphases is important to make meaningful use of isotopic dif-ferences measured between minerals.
In this work, we address the two difficulties by studyinga carefully selected pelitic schist sample (R71-90) from Mt.Moosilauke, New Hampshire (Hodges and Spear, 1982).All chemical and mineralogical evidence points to a mineralparagenesis that is in chemical equilibrium, including lackof zoning (Hodges and Spear, 1982). This bodes well forisotopic fractionations of the minerals recording equilib-rium conditions. Another virtue of studying Moosilaukeminerals is that the metamorphic temperature and pressurefor chemical equilibration are well constrained. The co-existence of aluminosilicate minerals (andalusite, kyanite,and sillimanite) in the vicinity constrains the equilibriumtemperature and pressure to be very near the aluminosili-cate triple point (Fig. 1; Rumble, 1973; Hodges andSpear, 1982). Hodges and Spear (1982) were thus able touse the minerals to calibrate a variety of geothermometersand geobarometers. To our knowledge, this is the first studyusing Moosilauke samples for calibrating equilibriumisotopic fractionation factors. The pelitic schist sample
Fig. 1. Minerals separated from pelitic schist R71-90. The mineralsaluminosilicate triple point (T ’ 500 �C, P ’ 4 kbar). Qz: quartz; Grt: gaBt: biotite.
R71-90 in this work is from the same outcrop as the sampleR71-90A studied in Hodges and Spear (1982); the one thatis closest to the aluminosilicate triple point. Hodges andSpear (1982) and previous work (Holdaway, 1971) consid-ered P-T conditions of 500 �C and 4 kbar at the triple point.Later work reevaluated the P-T condition of the triple pointto be at �550 �C and 4.5 kbar (Pattison, 1992). This tem-perature and pressure difference will not affect much ourestimated isotope fractionation factors. In this work weadopt 500 �C as the equilibration temperature to calculateisotope fractionation factors between minerals (Section 4).Quartz, biotite and muscovite are the major minerals inschist R71-90, plagioclase, ilmenite and garnet are abun-dant but in lesser amounts. Tourmaline was also observedbut in low abundance.
A small, fresh chip of R71-90 obtained by crushing a lar-ger piece of the rock was ground gently in a pre-cleanedagate mortar, then sieved using several mesh sizes to obtaina fraction containing mostly single minerals (�tens to hun-dreds of micron). Before handpicking minerals, phyllosili-cates (biotite and muscovite) were mechanically separatedfrom other more round-shaped minerals (mainly quartz,plagioclase and garnet). Specifically, the two types of min-erals can be separated by tilting and tapping paper onwhich the mineral mixture is deposited. Round grain miner-als roll off the paper while phyllosilicates stick to the paper.This step produced a clean phyllosilicate separate, facilitat-ing further mineral separation under a microscope.
Seven minerals were separated manually under an opti-cal microscope, including garnet, ilmenite, biotite, mus-covite, plagioclase, tourmaline and quartz (Fig. 1). Asmall fraction of the picked minerals was mounted inepoxy, checked under a scanning electron microscope(SEM) and characterized with energy dispersive x-rayspectroscopy (EDS). A fraction of the picked minerals withthe highest purity was selected for Fe, Mg and Ti isotope
underwent chemical equilibrium at P-T condition very near thernet; Tur: tourmaline; Ilm: ilmenite; Ms: muscovite; Pl: plagioclase;

N.X. Nie et al. /Geochimica et Cosmochimica Acta 302 (2021) 18–45 21
measurements (Tables 1 and 2; Figs. 2 and 3). Quartz waspresent as colorless and yellowish grains, and both werepicked separately and measured for their Fe isotopes, butthe Fe amount in quartz is extremely low and the measuredFe isotopic composition is surely affected by other Fe-bearing minerals present as inclusions or adhering to thesurface of the quartz grains. We report the quartz datafor the sake of completeness but make no use of them.The entire mineral separation procedure was performedon a second fresh chip from the same rock to check thereproducibility of Fe isotope measurements, and the resultson mineral separates 1 and 2 are reported in Table 1.
For isotopic analysis, about 1 mg of each mineral wasdissolved using mixtures of HF-HNO3-HClO4 following aprotocol described previously (Dauphas et al., 2004, 2009;Dauphas and Rouxel, 2006). Digestion residues and miner-als that are not easily digested (e.g., ilmenite) were trans-ferred to Parr bombs for digestion with a concentratedHF/HNO3 (28 M and 15 M respectively mixed in a 2:1 pro-portion) mixture heated at 170 ◦C in an oven for 3 days.For each mineral solution, half was used for Fe isotopicanalysis and half was used for Mg isotopic analysis.
The method for Fe chemical separation and isotopicanalysis is the one routinely used in the Origins Lab atthe University of Chicago (Dauphas et al., 2004, 2009;Dauphas and Rouxel, 2006). Iron is separated from matrixelements by passing samples in 6 N HCl through AG1-X8(200–400 mesh) resin. Matrix elements and Fe are elutedwith 6 N HCl and 0.4 N HCl respectively. The procedurewas performed twice. The purified Fe was evaporated todryness and taken up in 2% HNO3 (�0.3 M) for Fe isotopicanalysis. Iron isotopic analyses were carried out on aThermo Scientific Neptune MC-ICPMS upgraded toNeptune Plus specifications in the Origins Lab at theUniversity of Chicago. A quartz SSI cyclonic/Scott dualspray chamber was used as the sample introduction system,and standard-sample bracketing was used to correct forinstrumental fractionation. All Fe isotope data were brack-eted and expressed relative to IRMM-524, whose isotopiccomposition is identical to IRMM-014 (Craddock andDauphas, 2010).
Magnesium separation and isotopic analysis werecarried out at the Isotope Laboratory of the University ofWashington. Magnesium was separated using AG50W-X8cation exchange resin in 1 M HNO3 and the elutionprocedure was repeated for another time. Magnesiumisotopic composition was measured using a Nu PlasmaMC-ICPMS at the University of Washington in low resolu-tion mode and is reported relative to reference standardDSM-3. Detailed procedures have been reported previously(Teng and Yang, 2014; Teng et al., 2015).
Ilmenite, biotite, and the bulk rock were measured fortheir Ti isotopic compositions, which are reported inTable 2. Sample digestion, Ti separation, and Ti isotopicanalysis followed the method described in Greber et al.(2017a), which is slightly modified from an earlier proce-dure (Zhang et al., 2011; Millet and Dauphas, 2014). Alkaliflux fusion with lithium metaborate was used for completedissolution of the samples based on a procedure outlined inPourmand et al. (2012) and modified for Ti (Greber et al.,
2017a). Sample solutions were spiked with an ideal propor-tion of 47Ti-49Ti double spike as described in Millet andDauphas (2014) before Ti purification. The chemical proce-dure for Ti purification was outlined in Zhang et al. (2011).Briefly, Ti was separated from the matrix through a two-step ion-exchange chromatography. The first step used a2 mL TODGA column to separate Ti from matrix ele-ments, and in a second stage Ti was purified with 0.8 mLof AG1-X8 resin. Titanium isotopic compositions wereanalyzed using the Origins Lab MC-ICPMS at theUniversity of Chicago, using an Aridus sample introductionsystem together with X skimmer and Jet sampler cones, inmedium resolution mode on peak shoulders to avoid poten-tial molecular interferences. Titanium isotopic composi-tions were measured relative to a reference standardnamed Origins Laboratory Ti standard (OL-Ti), whosecomposition is close to the bulk silicate Earth andchondrites (Millet et al., 2016; Greber et al., 2017a). TheFe, Mg and Ti isotopic data in this study are reported usingthe conventional d-notation as follows (Tables 1 and 2;Figs. 2 and 3),
d56Fe ‰ð Þ ¼ 100056Fe54Fe
� �sample
=56Fe54Fe
� �IRMM�014
� 1
" #;
ð1Þ
d26Mg ‰ð Þ ¼ 100026Mg24Mg
� �sample
=26Mg24Mg
� �DSM�3
� 1
" #;
ð2Þ
d49Ti ‰ð Þ ¼ 100049Ti47Ti
� �sample
=49Ti47Ti
� �OL�Ti
� 1
" #: ð3Þ
2.2. NRIXS measurements of the Fe reduced partition
function ratios (b-factors) of minerals
Natural minerals were measured for their iron phonondensity of states using NRIXS. The minerals are Fe-richendmember minerals of the ones encountered in Moosi-lauke, for maximizing the 57Fe abundance as the NRIXStechnique can only probe 57Fe (the Mossbauer isotope ofFe), which has a natural abundance of only 2.119 %.NRIXS uses the nuclear transition of Mossbauer isotopesto probe the vibration modes of chemical bonds in solids,from which phonon density of states (PDOS), reduced par-tition function ratios (1000 lnb) and mean force constants(hF i) can be derived (Seto et al., 1995; Sturhahn et al.,1995; Chumakov and Sturhahn, 1999; Alp et al., 2003;Sturhahn and Jackson, 2007; Dauphas et al., 2018).Equilibrium isotope fractionations between minerals canbe calculated using the PDOS through the kinetic energy(Polyakov et al., 2005) or a moment expansion of NRIXSspectrum (phonon excitation probability density function),whose first term is related to the mean force constant of theFe bonds (Dauphas et al., 2012, 2018).
Five natural minerals of high purity and homogeneitywere chosen for NRIXS measurements (Table 3), includingalmandine (Fe-rich endmember of garnet) from Garnet Hill

Tab
le1
Feisotopic
compositionsofMoosilaukemineral
separates
(relativeto
IRMM-014).
Mineral
separates
1Mineral
separates
2Weigh
tedaverageoftw
oseparates
Mineral–garnet
fractionation(500
�C)
d56Fe
95%
c.i.
d57Fe
95%
c.i.
d56Fe
95%
c.i.
d57Fe
95%
c.i.
d56Fe
95%
c.i.
d57Fe
95%
c.i.
D56Fe
95%
c.i.
D57Fe
95%
c.i.
Garnet
�0.223
0.03
5�0
.322
0.06
6�0
.211
0.02
5�0
.305
0.03
8�0
.215
0.02
0�0
.309
0.03
30
00
0Ilmenite
�0.169
0.03
5�0
.260
0.06
6�0
.174
0.02
2�0
.251
0.03
2�0
.172
0.01
9�0
.253
0.02
80.04
20.02
80.05
60.04
4Biotite
0.09
20.03
50.14
60.06
60.09
90.02
50.14
70.03
80.09
70.02
00.14
70.03
30.31
10.02
90.45
60.04
7Tourm
aline
0.18
90.04
00.24
90.08
00.20
40.02
60.31
60.04
70.20
00.02
20.29
90.04
00.41
40.03
00.60
80.05
2Muscovite
0.29
70.04
20.43
70.08
30.36
20.02
60.50
70.05
50.34
40.02
20.48
60.04
60.55
90.03
00.79
50.05
7Plagioclase
0.35
10.07
00.41
70.09
50.20
60.07
00.23
20.08
50.27
80.04
90.31
40.06
30.49
30.05
30.62
30.07
1Quartz
(colorless)
0.40
30.04
00.52
10.10
6n.d.
n.d.
n.d.
n.d.
Quartz
(yellow)
0.26
70.03
70.33
40.07
0n.d.
n.d.
n.d.
n.d.
Bulk
0.10
20.02
00.13
80.02
90.10
20.02
00.13
80.02
90.31
70.02
80.44
70.04
4
n.d.notdetermined.
22 N.X. Nie et al. /Geochimica et Cosmochimica Acta 302 (2021) 18–45
Ely Nevada, ilmenite (NMNH96189; ilmenite microbeamstandard), annite (M9297; Fe-rich endmember of mica)originally from Rockfort, Massachusetts USA (providedby the Field Museum, Chicago), schorl (Fe-rich endmemberof tourmaline) from Karibib District, Erongo Region,Namibia, and fayalite (M7652; Fe-endmember of olivinefrom Rockfort, Massachusetts USA; provided by the FieldMuseum). Fayalite is not present in Moosilauke but wasmeasured as we had previously studied a synthetic57Fe-doped forsterite (Dauphas et al., 2014) and wantedto assess the quality of PDOS measurements of undopednatural minerals.
Each mineral was ground to a fine powder using acleaned agate mortar to minimize the effect of crystal orien-tation. The sample powder was then loaded into a 2 mmdiameter Kapton capillary for NRIXS measurements. Themeasurements were performed at sector 3ID of theAdvanced Photon Source (APS) at the Argonne NationalLaboratory. All measurements were at room pressure andtemperature. X-rays with energy around 14.4125 keV (thenominal nuclear resonance energy of 57Fe) were used toexcite 57Fe into a nuclear excited state. By applying appro-priate time discrimination, only the scattered X-rays pro-duced in the de-excitation of 57Fe were measured usingAvalanche Photodiodes. Details on the theory and methodof Fe NRIXS measurement have been explained in previouswork (Seto et al., 1995; Sturhahn et al., 1995; Chumakovand Sturhahn, 1999; Sturhahn and Jackson, 2007;Dauphas et al., 2012, 2018). By varying the energy of theincident X-rays around the nominal resonance energy andmeasuring the flux on resonantly scattered X-rays, onemeasures the phonon excitation probability density func-tion S(E), which through further data reduction andLog-Fourier transform yields the iron PDOS g(E)
(Sturhahn et al., 1995; Chumakov and Sturhahn, 1999;Dauphas et al., 2012). The reason why a nuclear transitioncan be used to probe lattice vibrations is that excitation of57Fe can happen outside of the nominal resonance energyof this nuclide when the lattice either absorbs or providesenergy in the form of phonon creation or annihilation,allowing the excitation to occur even when the energy iseither higher or lower than the resonance energy. Theenergy resolution of the incident X-ray beam (full widthat half maximum) was �1 meV. The beam was focused hor-izontally to a size of 25 lm while unfocused vertically in asize of 0.4 mm. The scans spanning typical energy rangesof �120 to +160 meV were acquired by varying the energyof the incident beam in increments of 0.25 meV. Dataacquisition at each energy step lasted for 3 s, and severalcomplete scans were processed for each sample, resultingin a total acquisition time at each energy of 90 s for a totalduration of �28 hr for each sample. The motivation for thebroad energy scans is to monitor the counts in the energytails of the spectrum that are used for background correc-tion (Dauphas et al., 2018). Data reduction and calculationof the PDOS and all the quantities that can be derived fromboth S(E) and g(E) were performed using the SciPhonsoftware (Dauphas et al., 2018). We can in particularcalculate reduced partition function ratio as a polynomialexpansion of the inverse of the square of the temperature

Table 2Mg and Ti isotopic compositions of Moosilauke minerals (500 �C).
Mg isotopes (relative to DSM-3) Ti isotopes (relative to OL-Ti)
d26/24Mg 2SD d25/24Mg 2SD d49/47Ti 95% c.i.
Garnet �1.541 0.067 �0.801 0.060 n.d. n.d.Ilmenite n.d. n.d. n.d. n.d. 0.054 0.012Biotite �0.146 0.045 �0.066 0.045 0.431 0.013Tourmaline 0.259 0.045 0.116 0.045 n.d. n.d.Bulk �0.130 0.044 �0.037 0.041 0.231 0.016
n.d. not determined.
Fig. 2. Iron isotopic compositions of minerals picked from peliticschist R71-90 from Mt. Moosilauke, New Hampshire. Two groupsof minerals (mineral separates 1 and 2; Table 1) were separatedfrom two rock chips of the same rock using the same method. (A)Iron isotopic compositions shown as a three-isotope plot. All datapoints following the slope 1.5 line (mass-dependent isotopefractionation line) indicates that the Fe isotope measurements didnot suffer from isobaric interferences even for the most Fe-depletedsamples (i.e., muscovite and plagioclase). (B) d56Fe values of thetwo groups of separated minerals. The two datasets (light and darkblue symbols) show consistent Fe isotopic compositions except forplagioclase, which is attributed to the fact that plagioclase containsextremely small amount of Fe and its Fe isotopic composition canbe easily affected by the presence of impurities.
Fig. 3. Magnesium isotopic compositions of minerals picked fromthe pelitic schist R71-90 from Mt. Moosilauke, New Hampshire(Table 2).
N.X. Nie et al. /Geochimica et Cosmochimica Acta 302 (2021) 18–45 23
(T is in K) with the coefficients in the expansion given bythe moments of g(E) or S(E) (Dauphas et al., 2012; Huet al., 2013),
1000lnb 56Fe =54Fe� � ’ A1
T 2þ A2
T 4þ A3
T 6ð4Þ
At high temperature, this equation can well be approxi-mated using the force constant as,
1000ln b 56Fe =54Fe� � ’ B1
hF iT 2
� B2
hF i2T 4
ð5Þ
with hF i the mean force constant of the iron bonds(in N/m), B1 ¼ 2904 and B2 is a constant depending onthe shape of the PDOS (Blanchard et al., 2015). For ironin most minerals, B2 ’ 52000 (Dauphas et al., 2018). Thevirture of using Eq. (5) is that B2, although slightly differentfor different minerals, does not change much (as shown inTable 3), allowing one to estimate b-factors when only forceconstant is known (Dauphas et al., 2017). The values of A1,A2, A3, B1, B2 and hF i are compiled in Table 3. The otherquantities that can be derived from g(E) and S(E) are alsoprovided in the table. At temperatures above �400 �C, b-factors can be well appoximated by the first terms in Eqs.4 or 5. For lower temperatures, reduced partition functionratios can be calculated using Eq. (4) and the coefficients A1,A2, A3 provided in Table 3. At a given temperature, theequilibrium Fe isotope fractionation factor between twophases is expressed as the difference between their reducedpartition function ratios through,
DA�B ¼ dA � dB ¼ 1000lnbA � 1000lnbB ð6Þ
2.3. Ab initio calculations
The reduced partition function ratios of almandine,ilmenite, annite, schorl and fayalite were calculated using

Table 3Mineral properties derived from NRIXS measurements.
Almandine (Garnet Hill, Ely,Nevada)
Ilmenite(NMNH96189)
Annite (M9297, Rockfort,Massachusetts)
Schorl (Erongo Region,Namibia)
Fayalite (M7652, Rockport,Massachusetts)
Parameters from S
Temperature from detailed balance(K)
273 294 287 293 289
Lamb-Mossbauer factor from S 0.6806 ± 0.0056 0.7251 ± 0.0031 0.6704 ± 0.0047 0.7483 ± 0.0040 0.7117 ± 0.0060Mean squaredisplacement < z2 > from S (A2)
0.00722 ± 0.00011 0.00603 ± 0.00006 0.00751 ± 0.00010 0.00544 ± 0.00007 0.00638 ± 0.00012
Internal energy/atom from S (meV) 27.43 ± 0.84 28.06 ± 0.71 28.51 ± 0.84 28.62 ± 0.76 27.99 ± 1.12Kinetic energy/atom from S (meV) 13.72 ± 0.42 14.03 ± 0.36 14.25 ± 0.42 14.31 ± 0.38 13.99 ± 0.56Force constant from S (N/m) 110 ± 14 155 ± 11 188 ± 16 196 ± 12 149 ± 25
(Fe3+/RFe = 0) (Fe3+/RFe = 0.2) (Fe3+/RFe = 0.32) (Fe3+/RFe = 0.05) (Fe3+/RFe = 0)
56Fe/54Fe b coefficients from S
1000 lnb = A1/T2 + A2/T
4 + A3/T6 (T in K)
A1 3.137E + 05 ± 4.019E + 04 4.398E + 05± 3.225E + 04
5.357E + 05 ± 4.439E + 04 5.571E + 05 ± 3.556E+ 04
4.258E + 05 ± 7.193E + 04
A2 �8.326E + 08 ± 3.532E + 08 �1.275E + 09± 3.695E + 08
�2.240E + 09 ± 4.244E + 08 �2.305E + 09 ± 3.297E+ 08
�1.319E + 09 ± 8.842E + 08
A3 6.792E + 12 ± 5.394E + 12 7.292E + 12± 7.533E + 12
1.863E + 13 ± 6.982E + 12 1.870E + 13 ± 5.368E+ 12
1.119E + 13 ± 1.828E + 13
1000 lnb = B1 < F>/T2 � B2 < F>2/T4 (T in K)B1 2904 2904 2904 2904 2904B2 62,800 50,339 57,846 55,171 53,799
Parameters from g
Lamb-Mossbauer factor from g 0.6796 0.7237 0.6683 0.7454 0.7099Mean squaredisplacement < z2 > from S (A2)
0.00725 0.00607 0.00756 0.00552 0.00643
d < z2>/dT (A2/K) 2.28E-05 1.87E-05 2.36E-05 1.66E � 05 1.98E-05Critical temperature (K) 822 1002 796 1127 947Resilience (N/m) 60 74 59 83 70Internal energy/atom from g (meV) 27.44 28.06 28.52 28.63 27.99Kinetic energy/atom from g (meV) 13.72 14.03 14.26 14.31 14.00Vibrational entropy (kb/atom) 1.34 1.18 1.16 1.12 1.20Helmholtz free energy (meV) �7.12 �2.50 �1.55 �0.22 �3.09Vibrational specific heat (kb/atom) 0.94 0.92 0.91 0.90 0.92lamb-Mossbauer factor at T = 0from g
0.90 0.91 0.91 0.91 0.91
Kinetic energy/atom at T = 0 fromg (meV)
5.13 6.12 6.54 6.74 6.00
Force constant from g (N/m) 110 155 188 196 149(continued on next page)
24N.X
.Nie
etal./
Geochim
icaet
Cosm
ochim
icaActa
302(2021)
18–45

Tab
le3(continued)
Alm
andine(G
arnet
Hill,Ely,
Nevad
a)Ilmenite
(NMNH96
189)
Annite(M
9297,Rockfort,
Massachusetts)
Schorl(Erongo
Region,
Nam
ibia)
Fayalite(M
7652,Rockport,
Massachusetts)
56Fe/
54Febcoeffi
cients
from
g
1000
lnb=
A1/T
2+
A2/T
4+A
3/T
6(T
inK)
A1
3.14
3E+05
4.40
3E+05
5.38
3E+
055.59
3E+05
4.26
E+05
A2
�8.483E+08
�1.287E+09
�2.330
E+
09�2
.39E
+09
�1.33E
+09
A3
7.55
9E+12
7.88
8E+12
2.33
2E+
132.32
0E+13
1.18
E+13
Velocities
from
g
Inputdensity
(g/cc)
3.5
3.5
3.5
3.5
3.5
Inputbulk
modulus(G
Pa)
100
100
100
100
100
Debye
velocity
(m/s)
4887
±25
540
95±
117
2915
±90
4522
±66
4058
±44
p-w
avevelocity
(m/s)
7388
±189
6820
±78
6118
±51
7117
±47
6795
±29
s-wavevelocity
(m/s)
4416
±242
3668
±112
2578
±86
4070
±63
3633
±42
Poissonratio
0.22
20.29
70.39
20.25
70.30
0
N.X. Nie et al. /Geochimica et Cosmochimica Acta 302 (2021) 18–45 25
a Density Functional Theory (DFT) ab initio approach,assuming that iron only exists as Fe2+. Due to the magneticfeature of Fe and relatively large sizes of the primitive cellsof these minerals, it was challenging to compute their fullvibrational spectra. Specifically, we frequently ran intodivergence problems when we tried to compute the fullvibrational spectra of these minerals. Therefore, we usedthe high-temperature approximation above (Eq. (5)) thatrelates the reduced partition function ratio to the meanforce constant, and calculated the latter by displacing theiron atoms along three orthogonal directions in Cartesiancoordinates. This is an approximate approach, and the fullvibrational spectra were not obtained. This method hasbeen successfully applied to several isotopic systems (e.g.,Kowalski and Jahn, 2011; Kowalski et al., 2013; Ducheret al., 2016). While more work will be needed to fully vali-date the force constants determined with this approach, weshow below that their scaling with interatomic distances fol-lows the trends defined by other minerals for which the fullPDOS was measured or calculated, so we have no obviousreason to question this first-order approach.
If the element was located at more than one equivalentsite, a weighted average was calculated based on the num-ber of distinct sites. This was the case for fayalite, whichhas two Fe sites with equal numbers. Therefore, two forceconstants, one for each site, were calculated and their aver-age (50:50 here) was calculated to give the fayalite forceconstant. The force constant in a specific direction was cal-culated following these steps: (i) the lattice parameters andatomic positions were relaxed starting from the experimen-tally determined structures; (ii) the atom of interest (Fe)was moved from its equilibrium position along x or y or zdirection while keeping lattice and positions of other atomsconstant; and (iii) the total energy was fitted against dis-placement using the formula for a harmonic potential(hF i is the effective force constant, x is the displacementfrom the equilibrium position),
E ¼ 1
2hF ix2 þ constant: ð7Þ
The calculation of ground state potential energy surfacewas conducted by Quantum ESPRESSO (Giannozzi et al.,2009, 2017) with Perdew–Burke–Ernzerhof (PBE) general-ized gradient approximation (GGA) (Perdew et al., 1996)and GBRV ultrasoft pseudopotentials (Garrity et al.,2014). For all systems, unless otherwise specified, adisplacement step of 0.0025 A and a uniform(Monkhorst-Pack) 2 � 2 � 2 (4 � 2 � 4 for fayalite,3 � 3 � 3 for ilmenite) k-point mesh were used(Monkhorst and Pack, 1976). The cutoff energy of wavefunctions was set at 60 eV, so that the total energyconverged within 5 meV/atom. The cutoff energy of chargedensity was set to 720 eV (dual of 12) as suggested in theliterature (Lejaeghere et al., 2016; Prandini et al., 2018).
The structural configurations of the minerals can befound in the Supplementary Materials. The ilmenite,almandine and fayalite primitive cells were adopted fromliterature without modification (Hazen, 1977; Geigeret al., 1992; Yamanaka et al., 2007). The annite primitivecell was adopted from Redhammer et al. (2000) and a

26 N.X. Nie et al. /Geochimica et Cosmochimica Acta 302 (2021) 18–45
1 � 1 � 2 supercell was built to accommodate its antiferro-magnetic property (Rancourt et al., 1994). The schorl struc-ture was adopted from Bacık et al. (2012), while replacingNa with Ca to balance charge, assuming 100% occupancyof O at position (0, 0, 0.7716), and a 2 � 1 � 1 supercellwas built to model antiferromagnetism. Cell parametersand the calculated Fe force constants of the minerals arecompiled in Table 4.
2.4. Determination of Fe redox state using conventional
Mossbauer spectroscopy
Iron redox state in minerals can affect equilibrium Feisotope fractionation factors because Fe3+ tends to prefer-entially incorporate heavy Fe isotopes. Iron redox ratiosof minerals from Moosilakue and minerals measured byNRIXS were therefore measured using conventional Moss-bauer spectroscopy at the Argonne National Laboratory.The minerals were ground to fine powders to make mountswith an effective thickness of �5 mg Fe/cm2. This corre-sponds to �30 mg mineral mass/cm2 for tourmaline and�15 mg mineral mass/cm2 for other minerals. The samplearea of the mounts was adjusted according to the availablemass of each mineral (i.e., if the powder mass is limited, thesample area has to be reduced in order to obtain the correcteffective thickness), and final sample areas range from 0.04to 1 cm2 for spectra collection. All Mossbauer absorptionspectra were collected at room temperature, with a mea-surement time of one to two days per mineral. Results werecalibrated against an a-Fe foil of 25 lm thickness and 100%purity. The spectra were fit with doublets (Fig. 4) using acommercial software WinNormos (provided by WissElcompany). The relative Fe2+ and Fe3+ proportions werederived from the relative areas of the doublets (Fig. 4; seeSupplementary Table S4 for information on the assignedFe redox states and relative areas). While the fitting param-eters of Mossbauer spectra with doublets are non-unique,determining Fe redox states with Mossbauer spectroscopyis relatively straightforward, and different fit methods giveconsistent results. In this work the numbers of doubletsto fit the spectra of the minerals were the same as those usedin literature (Gibb et al., 1969; Annersten, 1974; Amthaueret al., 1976; Dyar and Burns, 1986; Ferrow et al., 1988;Virgo et al., 1988; Dyar et al., 1998).
3. RESULTS
3.1. Iron, Mg and Ti isotopic compositions of minerals from
Mt. Moosilauke
The Fe isotopic compositions of mineral separates fromthe pelitic schist R71-90 from Mt. Moosilauke are reportedin Table 1 and Fig. 2. The chemical compositions of theminerals can be found in Hodges and Spear (1982). Toassess the reproducibility of the isotope measurements, werepeated the whole procedure, starting with mineral separa-tion. The two groups of minerals separated from two rockchips of R71-90 (mineral separates 1 and 2 in Table 1 andFig. 2) were measured for their Fe isotopic compositions.The expectation was that if the mineral separation was
good, the two groups of minerals should give consistentFe isotopic compositions. As shown in Fig. 2, garnet, ilme-nite, biotite, tourmaline from the two groups show the sameFe isotopic compositions. Muscovite from the two groupsshow the same Fe isotopic composition within error butthe errors are relatively large due to their low Fe contents.Plagioclase from the two groups are less consistent; thiscould be because plagioclase contains an extremely smallamount of Fe, so isotopic compositions may be affectedby the presence of a tiny amount of impurities in the plagio-clase fractions.
The bulk rock of R71-90 has an Fe isotopic compositionof d56Fe = +0.10 ± 0.02‰. The d56Fe values of the miner-als vary significantly, from �0.22‰ to +0.40‰. Biotite hasthe same d56Fe value (+0.10 ± 0.02‰; weighted average ofmineral separates 1 and 2) as the bulk, which is expectedbecause the rock is a pelitic schist and biotite dominatesthe Fe budget. Garnet and ilmenite have lighter Fe isotopiccompositions of �0.22 ± 0.02‰ and �0.17 ± 0.02‰respectively, while tourmaline, muscovite and plagioclasehave heavier isotopic compositions. The weighted averageof Fe isotopic compositions of tourmaline from the twomineral separates is +0.20 ± 0.02‰. Muscovite and plagio-clase are heavier than all other minerals, a weighted averageof the two groups of mineral separates yielded d56Fe valuesfor muscovite and plagioclase of +0.34 ± 0.02 and +0.28± 0.05‰, respectively. Quartz in mineral separate 1 wasalso measured for Fe isotopes. Quartz with two differentcolors (colorless and yellowish) were measured separately,and d56Fe values of +0.40 ± 0.04 and +0.27 ± 0.04‰ wereobtained for colorless quartz and yellowish quartz respec-tively. Given the extremely low Fe content in quartz, thesesignatures are not representative of quartz itself but ratherreflect the compositions of impurities or weatheringproducts.
Large Mg isotopic variation was also observed inMoosilauke minerals (Table 2 and Fig. 3). The bulk rockhas a d26Mg value of �0.13 ± 0.04‰. Biotite has a d26Mgvalue of �0.15 ± 0.05‰, the same as the bulk compositionwithin error. Garnet and tourmaline have d26Mg values of�1.54 ± 0.07 and +0.26 ± 0.05‰, respectively.
Ilmenite, biotite, and bulk were measured for Ti isotopiccompositions (Table 2). Ilmenite has a Ti isotopic composi-tion of d49Ti = +0.05 ± 0.01‰, lighter than the Ti isotopiccomposition of biotite and the bulk rock, which are +0.43± 0.01 and +0.23 ± 0.02‰, respectively.
3.2. Iron force constants from NRIXS measurements
The mineral thermo-elastic properties, including themean force constants of the iron bonds, derived fromNRIXS measurements of phonon excitation probabilitydensity S(E) or the partial phonon density of states PDOSg(E) are summarized in Table 3. We focus our discussionon the force constant as it is the dominant driver of equilib-rium isotopic fractionation, especially at high temperature,but we also provide the 3rd order polynomial expansion in1/T2 to calculate 1000 lnb at any temperature (Table 3).The PDOS of the measured minerals can be found in theSupplementary Materials. The force constants are 110

Tab
le4
Ironforceconstan
tsofmineralscalculatedbyabinitio
DFTap
proach.
Alm
andine
Ilmenite
Annite
Schorl
Fayalite
Abinitio
Exp
er.
Diff.
Abinitio
Exp
er.
Diff.
Abinitio
Exp
er.
Diff.
Abinitio
Exp
er.
Diff.
Abinitio
Exp
er.
Diff.
a(A)
10.069
9.98
10.89
%5.47
25.54
0�1
.22%
5.32
95.39
0�1
.14%
19.164
19.041
0.65
%4.85
64.81
80.78
%b(A
)10
.069
9.98
10.89
%5.47
25.54
0�1
.22%
5.33
15.39
0�1
.09%
9.58
19.52
00.64
%10
.567
10.470
0.93
%c(A)
10.069
9.98
10.89
%5.47
25.54
0�1
.23%
21.036
20.617
2.03
%9.58
19.52
00.64
%6.06
06.08
6�0
.43%
alpha
109.4
109.5
�0.07%
56.0
54.7
2.37
%94
.795
.1�0
.43%
113.9
113.8
0.10
%90
.090
.00.00
%beta
109.4
109.5
�0.07%
56.0
54.7
2.34
%94
.895
.1�0
.27%
113.9
113.8
0.09
%90
.090
.00.00
%ga
mma
109.4
109.5
�0.07%
56.0
54.7
2.36
%12
0.0
120.0
0.00
%11
3.9
113.8
0.09
%90
.090
.00.00
%<F>
120
133
207
209
144
Exp
er.:experim
entallymeasuredlatticeparam
eters.Diff.:difference
betweenexperim
entallymeasuredlatticeparam
etersan
dcalculatedparam
eters.Exp
erim
entallymeasuredlatticeparam
eters
arefrom
literature
(see
maintext).<F>isforceconstan
tin
N/m
.
N.X. Nie et al. /Geochimica et Cosmochimica Acta 302 (2021) 18–45 27
± 14 N/m for almandine garnet (Garnet Hill, Ely Nevada),155 ± 11 N/m for ilmenite (NMNH96189), 188 ± 16 N/mfor annite (the Fe-rich endmember of the biotite solidsolution; M9297; from Rockport, Massachusetts),196 ± 12 N/m for schorl tourmaline (from Erongo Region,Namibia), and 149 ± 25 N/m for fayalite (M7652; fromRockport, Massachusetts). A synthetic ilmenite wasmeasured before using NRIXS by Williams et al. (2016).They obtained a force constant of 156 ± 10 N/m, whichis in excellent agreement with our measured value of155 ± 11 N/m.
3.3. Iron force constants from ab initio calculations
The calculated mineral lattice parameters and force con-stants from the ab initioDFT approach are given in Table 4.Force constants are 120, 133, 207, 209 and 144 N/m foralmandine, ilmenite, annite, schorl, and fayalite respec-tively. The result in general agrees with the NRIXS result(Table 3) of increasing force constants of almandine, ilme-nite (similar to fayalite), annite, and schorl, and is also con-sistent with increasing d56Fe values of garnet, ilmenite,biotite and tourmaline in Moosilauke R71-90 (Table 1and Fig. 2). The only exception is annite, for which ab initio
yields a force constant that is slightly higher than that mea-sured by NRIXS.
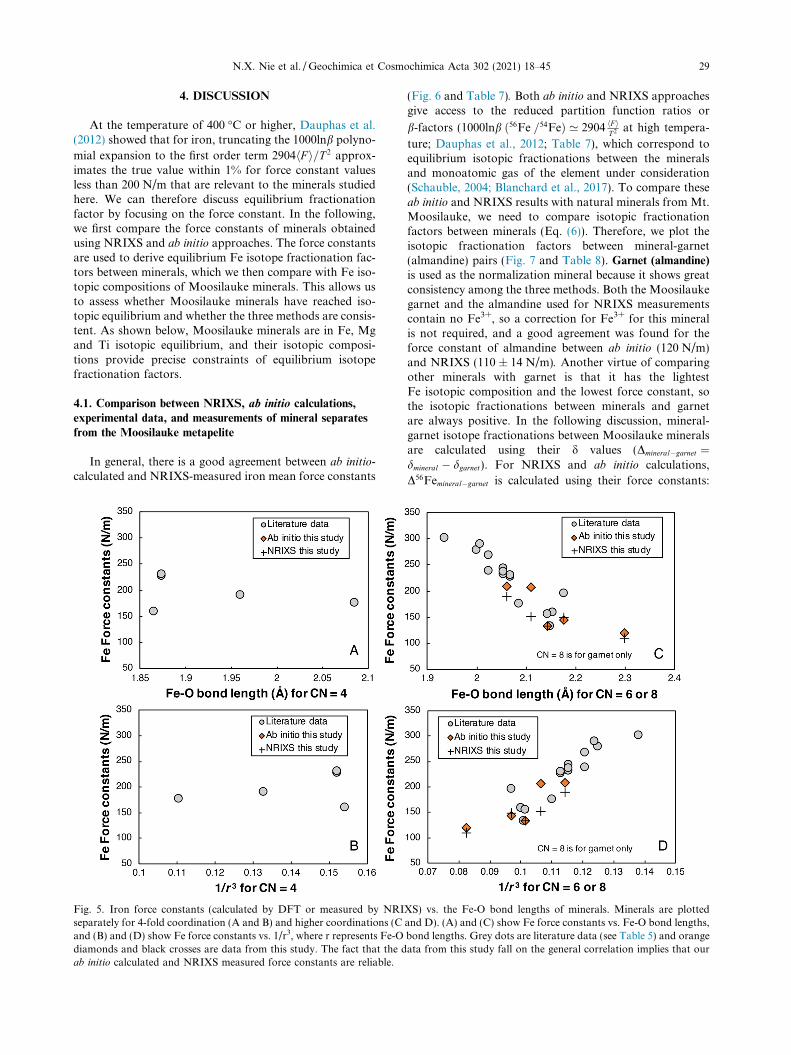
To assess the reliability of the calculated/measured forceconstants in this study, we further compare them with theforce constants measured or computed in the literature.The expectation is that, to first order, Fe force constantsshould correlate with the Fe-O bond lengths in mineralswhere Fe is coordinated with O. The ionic bond model ofYoung et al. (2015) predicts that Fe force constants shouldcorrelate linearly with 1/r3, where r is the equilibrium Fe-Ointerionic distance. In Fig. 5, we therefore compare ourmeasured/calculated Fe force constants with literature val-ues in a plot hFi vs. 1/r3 (Table 5). Given that the Fe coor-dination in minerals affects Fe isotopic fractionation, wesplit minerals into 4-fold coordinated minerals and mineralswith higher Fe coordinations. Not much data is availableon 4-fold coordinated minerals, but a clear trend can beseen for minerals with Fe in 6-fold coordination. The forceconstants calculated in this study follow the trend definedby literature data.
Based on the agreement between force constant determi-nations based on NRIXS and ab initio calculations, and thesimilar relationship with interatomic distances as literaturevalues, we believe that our force constant estimates are reli-able. The displacement method is however limited, as itdoes not allow comparison with PDOS measured byNRIXS or other spectroscopic data, and further work willbe needed to fully validate this approach.
3.4. Redox states of Fe in the minerals
Iron redox states were determined for both Moosilaukeminerals and minerals used for NRIXS measurements(Fig. 4 and Table 6). Using electron microprobe data to cal-culate Fe redox state of ilmenite is fairly straightforward

Fig. 4. Iron-57 Mossbauer spectra of the minerals studied.
28 N.X. Nie et al. /Geochimica et Cosmochimica Acta 302 (2021) 18–45
and reliable (Droop, 1987). We calculated a Fe3+/RFe ratioof �0 for Moosilauke ilmenite based on its chemicalcomposition determined with an electron microprobe. Forminerals such as mica and tourmaline that contain vacantcation sites, the Fe redox states cannot be calculated fromelectron probe data with great confidence. In those cases,conventional Mossbauer spectroscopy was used to obtain
the Fe3+/RFe ratios. Moosilauke garnet and biotite haveFe3+/RFe ratios of �0 and 0.22, respectively. The mineralsused specifically for NRIXS measurements were measuredby Mossbauer and we found Fe3+/RFe ratios for almandine(Garnet Hill), ilmenite (NMNH96189), annite (M9297),and schorl (Erongo Region, Namibia) of 0, 0.2, 0.32 and0.05, respectively.
N.X. Nie et al. /Geochimica et Cosmochimica Acta 302 (2021) 18–45 29
4. DISCUSSION
At the temperature of 400 �C or higher, Dauphas et al.(2012) showed that for iron, truncating the 1000lnb polyno-
mial expansion to the first order term 2904hF i=T 2 approx-imates the true value within 1% for force constant valuesless than 200 N/m that are relevant to the minerals studiedhere. We can therefore discuss equilibrium fractionationfactor by focusing on the force constant. In the following,we first compare the force constants of minerals obtainedusing NRIXS and ab initio approaches. The force constantsare used to derive equilibrium Fe isotope fractionation fac-tors between minerals, which we then compare with Fe iso-topic compositions of Moosilauke minerals. This allows usto assess whether Moosilauke minerals have reached iso-topic equilibrium and whether the three methods are consis-tent. As shown below, Moosilauke minerals are in Fe, Mgand Ti isotopic equilibrium, and their isotopic composi-tions provide precise constraints of equilibrium isotopefractionation factors.
4.1. Comparison between NRIXS, ab initio calculations,
experimental data, and measurements of mineral separates
from the Moosilauke metapelite
In general, there is a good agreement between ab initio-calculated and NRIXS-measured iron mean force constants
Fig. 5. Iron force constants (calculated by DFT or measured by NRIseparately for 4-fold coordination (A and B) and higher coordinations (Cand (B) and (D) show Fe force constants vs. 1/r3, where r represents Fe-Odiamonds and black crosses are data from this study. The fact that the dab initio calculated and NRIXS measured force constants are reliable.
(Fig. 6 and Table 7). Both ab initio and NRIXS approachesgive access to the reduced partition function ratios or
b-factors (1000lnb 56Fe =54Feð Þ ’ 2904 hF iT 2 at high tempera-
ture; Dauphas et al., 2012; Table 7), which correspond toequilibrium isotopic fractionations between the mineralsand monoatomic gas of the element under consideration(Schauble, 2004; Blanchard et al., 2017). To compare theseab initio and NRIXS results with natural minerals from Mt.Moosilauke, we need to compare isotopic fractionationfactors between minerals (Eq. (6)). Therefore, we plot theisotopic fractionation factors between mineral-garnet(almandine) pairs (Fig. 7 and Table 8). Garnet (almandine)
is used as the normalization mineral because it shows greatconsistency among the three methods. Both the Moosilaukegarnet and the almandine used for NRIXS measurementscontain no Fe3+, so a correction for Fe3+ for this mineralis not required, and a good agreement was found for theforce constant of almandine between ab initio (120 N/m)and NRIXS (110 ± 14 N/m). Another virtue of comparingother minerals with garnet is that it has the lightestFe isotopic composition and the lowest force constant, sothe isotopic fractionations between minerals and garnetare always positive. In the following discussion, mineral-garnet isotope fractionations between Moosilauke mineralsare calculated using their d values (Dmineral�garnet ¼dmineral � dgarnet). For NRIXS and ab initio calculations,
D56Femineral�garnet is calculated using their force constants:
XS) vs. the Fe-O bond lengths of minerals. Minerals are plottedand D). (A) and (C) show Fe force constants vs. Fe-O bond lengths,bond lengths. Grey dots are literature data (see Table 5) and orangeata from this study fall on the general correlation implies that our

Table 5Iron force constants and Fe-O bond lengths of minerals.
Phases Method <F> (N/m) Note Ref. for < F> CN 1 Bond length (A) CN 2 Bond length (A) Ref. for CN
Magnetite NRIXS 228 * [1] 6 2.068 4 1.873 [10]FeO (Wustite) NRIXS 160 * [1] 6 2.153 4 1.865 [11]Magnetite NRIXS 230 * [2] 6 2.068 4 1.873 [10]Orthoenstatite NRIXS 177 * [2] 6 2.086 4 2.085 [12]Hematite NRIXS 244 * [2] 6 2.054 [13]Goethite NRIXS 268 * [3] 6 2.023 [14]H-Jarosite NRIXS 280 * [3] 6 2.000 [15]K-Jarosite NRIXS 290 * [3] 6 2.006 [16]Olivine NRIXS 197 * [4] 6 2.176 [10]Fe2+ in MgFeAl spinel NRIXS 190 * [5] 4 1.960 [17]Fe3+ in MgFeAl spinel NRIXS 302 * [5] 6 1.934 [17]Ilmenite NRIXS 156 * [6] 6 2.143 [10]Hematite ab initio 232 * [7] 6 2.054 [18]Siderite ab initio 134 * [7] 6 2.147 [19]Goethite ab initio 239 * [3] 6 2.023 [20]Hematite ab initio 238 * [8] 6 2.054 [13]Almandine ab initio 120 $ [9] 8 2.298 [10]Ilmenite ab initio 133 $ [9] 6 2.143 [10]Annite ab initio 207 $ [9] 6 2.109 [21]Schorl ab initio 209 $ [9] 6 2.060 [22]Fayalite ab initio 144 $ [9] 6 2.176 [10]Almandine NRIXS 110 [9] 8 2.298 [10]Ilmenite NRIXS 133 # [9] 6 2.143 [10]Annite NRIXS 152 # [9] 6 2.109 [21]Schorl NRIXS 190 # [9] 6 2.060 [22]Fayalite NRIXS 149 [9] 6 2.176 [10]
CN: Coordination number. * Calculated using the beta factors reported in Dauphas et al. (2017). $ calculated using the displacement approach. # Fe3+ was corrected. [1] Polyakov et al. (2007). [2]Dauphas et al. (2012). [3] Blanchard et al. (2015). [4] Dauphas et al. (2014). [5] Roskosz et al. (2015). [6] Williams et al. (2016). [7] Blanchard et al. (2009). [8] Rustad and Dixon (2009). [9] Thisstudy. [10] Sossi and O’Neill (2017). [11] Fjellvag et al. (1996). [12] Domeneghetti et al. (1995). [13] Maslen et al. (1994). [14] Alvarez et al. (2008). [15] Basciano and Peterson (2007). [16] Mills et al.(2013). [17] Lavina et al. (2009). [18] Maslen et al. (1994). [19] Lavina et al. (2010). [20] Alvarez et al.(2008). [21] Redhammer et al. (2000). [22] Fortier and Donnay (1975).
30N.X
.Nie
etal./
Geochim
icaet
Cosm
ochim
icaActa
302(2021)
18–45

Table 6Iron redox ratios determined using Mossbauer spectroscopy.
Minerals Fe3+/RFe Comments
Moosilauke minerals
Garnet 0 Almandine; contains some Mn and Mg; Fe/(Fe + Mg + Mn) = 0.75b
Ilmenite 0a Small amount of Mn; Fe/(Fe + Mn) = 0.95Biotite 0.22 Fe/(Fe + Mg) = 0.5b
Tourmaline n.d. Fe/(Fe + Mg) = 0.35Muscovite n.d. Fe/(Fe + Mg) = 0.46b
Plagioclase n.d. Albiteb
Quartz n.d.
Minerals for NRIXS measurement
Almandine (Garnet Hill, Ely Nevada) 0 Small amount of Mn and little Mg; Fe/(Fe + Mn) = 0.75Ilmenite (NMNH96189) 0.20 Small amount of Mn and little Mg; Fe/(Fe + Mn) = 0.91Annite (M9297) 0.32 Small amount of Mn and little Mg; Fe/(Fe + Mn) = 0.98Schorl (Erongo Region, Namibia) 0.05 Fe-endmember of tourmaline; little Mn or MgFayalite (M7652) 0 Small amount of Mn and little Mg; Fe/(Fe + Mn) = 0.97
a. calculated based on the chemical composition. b. from Hodges and Spear (1982); n.d. not determined. The ratios in the table are atomicratios.
Fig. 6. Force constants derived from NRIXS and ab initio
calculations. (A) Mean Fe force constant of ilmenite-hematitesolid solution as a function of Fe3+ content. There is a 111 N/mdifference between hematite and pure Fe2+ ilmenite. (B) Compar-ison of the force constants derived from the two approaches, beforeand after Fe3+ correction which assumes a 111 N/m differencebetween pure Fe3+ and Fe2+ endmembers as documented inilmenite-hematite solid solutions. There is good agreement betweenthe two approaches, except for annite.
N.X. Nie et al. /Geochimica et Cosmochimica Acta 302 (2021) 18–45 31
D56Femineral�garnet ¼ 2904hF imineral�hF igarnet
T 2 , where T is the tem-
perature in K. The calculated fractionation factors betweenminerals and garnet as a function of temperature in the
form of D56Femineral�garnet ¼ A� 106=T 2 are summarized inTable 8.
For ilmenite, ab initio yields a value of 133 N/m, which isslightly lower than the NRIXS-measured force constant forilmenite NMNH96189 of 155 ± 11 N/m. A synthetic ilme-nite was measured previously by NRIXS and an almostidentical value of 156 ± 10 N/m was obtained (Williamset al., 2016). The slightly higher NRIXS-measured forceconstant of ilmenite relative to the ab initio value couldbe due to the presence of Fe3+ in the ilmenite. TheNMNH96189 ilmenite is a reference standard for electronmicroprobe analysis and has a well constrained Fe3+/RFeratio of 0.2 (Jarosewich et al., 1980), and this ratio is alsoconfirmed by our Mossbauer analysis (Fig. 4 and Table 6).It has been shown in previous studies that Fe oxidationstates can affect Fe force constants significantly. For exam-ple, Roskosz et al. (2015) found a strong dependence of Feforce constant on Fe3+/RFe ratio in spinel, and a transitionfrom pure Fe2+ spinel to its Fe3+ counterpart causing theFe force constant to increase by 104 ± 17 N/m. Similarly,the force constants are shifted upwards by 145 ± 27 N/mand 156 ± 32 N/m for rhyolite and basaltic glass, respec-tively, between the Fe2+ and Fe3+ endmembers (Dauphaset al., 2014). Ilmenite forms a solid solution with hematite,which previous NRIXS work showed had a force constantof 244 N/m (Sturhahn et al., 1999; Dauphas et al., 2012).Assuming that the Fe mean force constant in this solid solu-tion scales linearly with the Fe3+/RFe ratio, we can writefor Fe in this solid solution,
hF iIlmenite-HematiteðN=mÞ ¼ 111Fe3þP
Feþ 133; ð8Þ
or hF iIlmenite-Hematite
Nm
� �¼ 244
Fe3þPFe
þ 133 1� Fe3þPFe
� �: ð9Þ
The coefficients in Eq. (9) correspond to the purehematite and ilmenite mean Fe force constants. The onefor hematite (244 N/m) is from previous NRIXS measure-

Tab
le7
ComparisonofmeanFeforceconstan
tsan
db-factors
betweenabinitio
calculationsan
dNRIX
Smeasurements.
Abinitio
calculations
NRIX
S
Minerals
<F>
(N/
m)
1000
lnbat
500�C
1000
lnbat
800�C
Minerals
Fe3
+/
RFe
<F>(N
/m)no
Fe3
+correction
<F>(N
/m)withFe3
+
correction
1000
lnbat
500�C
1000
lnbat
800�C
Alm
andine
120
0.58
0.30
Alm
andine(Ely,Nevad
a)0
110±
1411
0±
140.53
±0.07
0.28
±0.03
Ilmenite
133
0.65
0.34
Ilmenite(N
MNH96189)
0.2
155±
11133±
110.65
±0.05
0.34
±0.03
Annite
207
1.01
0.52
AnniteM92
97(R
ockfort,
Massachusetts)
0.32
188±
1615
2±
160.74
±0.08
0.38
±0.04
Schorl
209
1.02
0.53
Schorl(Erongo
,Nam
ibia)
0.05
196±
1219
0±
120.92
±0.06
0.48
±0.03
Fay
alite
144
0.70
0.36
Fay
alite(M
7652
)0
149±
2514
9±
250.72
±0.12
0.38
±0.06
1000
lnb5
6/54values
werecalculatedusing1000
lnb=
2904
<F>/T
2.Fe3
+/R
Fewas
determined
usingMossbau
erspectroscopy(F
ig.4an
dTab
le6).Fe3
+correctionwas
donebyassuminga
111N/m
difference
betweenFe3
+an
dFe2
+mineral
analogu
es.
32 N.X. Nie et al. /Geochimica et Cosmochimica Acta 302 (2021) 18–45
ments (Sturhahn et al., 1999), while that for ilmenite(133 N/m) is from our ab initio DFT calculation performedfor a Fe3+/RFe ratio of 0 (Fig. 6A). The fact that ourNRIXS measurements and ab initio calculations of ilmenitefall on a straight line with hematite (Fig. 6A) indicates thatthe main reason for the difference between the NRIXS andthe ab initio results is the presence of Fe3+ in the former.
The ilmenite-garnet iron isotope fractionation has beenpreviously determined in lab equilibration experiments at800 �C (Sossi and O’Neill, 2017). This datum, as well asthe fractionation measured in the Moosilauke samples,are evaluated against trends predicted by NRIXS andab initio DFT predictions. In Fig. 7A we plot the isotopicfractionations between the ilmenite-garnet pair. We showthe fractionations with their Fe3+/RFe as measured, as wellas the values corrected to the pure Fe2+ endmembersassuming a shift of 111 N/m between Fe2+ and Fe3+ coun-terparts (Eq. (8)). As shown, there is an overall excellentagreement between previous lab equilibration experiments(Sossi and O’Neill, 2017), Moosilauke minerals, NRIXSand ab initio approaches for the ilmenite-garnet pair. Ourresults point to an ilmenite and garnet (almandine) isotopefractionation, with only Fe2+ in the two minerals, of
D56Feilmenite�garnet ’ 0:05� 106=T 2 (Table 8 and Fig. 7B).This work provides the first estimate of Fe force con-
stants for annite (the Fe-endmember of the biotite solidsolution) and schorl (the Fe-endmember of tourmaline).For annite (biotite), direct comparison of the force con-stants derived from ab initio calculations and NRIXS mea-surements reveals a small discrepancy (Fig. 6B andTable 7), with ab initio calculated value (207 N/m) higherthan the NRIXS value (188 ± 16 N/m). However, as indi-cated by conventional Mossbauer, the NRIXS annite(M9297) contains about 32% Fe as Fe3+. The force con-stant for the pure Fe2+ endmember is therefore predictedto be even smaller, thus increasing the discrepancy betweenNRIXS and ab initio results (Fig. 6 and Table 7). TheMoosilauke biotite has 22% Fe3+, and the biotite-garnetfractionation is consistent with NRIXS prediction bothbefore and after Fe3+ correction (Fig. 7C and 7D). Aftercorrection for Fe3+ using the same method as forilmenite-hematite solid solution (i.e., assuming a 111 N/mdifference between Fe3+ and Fe2+ endmembers), the twomethods yielded the same isotope fractionation factor for
Fe3+-free endmembers of D56Febiotite�garnet ’ 0:12� 106=T 2
(Table 8). Given the consistency between the NRIXS mea-surements and Moosilauke minerals, and the complexity ofthe crystal structure and primitive cell of annite in ab initio
calculations, we suspect that ab initio (which gives a muchlarger fractionation) may suffer from a large error forannite. Ye et al. (2020) suggested an equilibrium Fe isotope
fractionation factor of D56Febiotite�garnet ¼ 0:09ð�0:05Þ�106=T 2 based on a pair of natural garnet and biotite thatcontain 5 and 29 % Fe3+ respectively. This fractionationfactor, if corrected for Fe3+, would correspond to a frac-
tionation of �0:01ð�0:05Þ � 106=T 2, which is smaller thanthe fractionation factor constrained here. However, Fe iso-topic fractionation in biotite and garnet may depend ontheir chemical compositions, which could explain the

N.X. Nie et al. /Geochimica et Cosmochimica Acta 302 (2021) 18–45 33
observed discrepancy. Future work is needed to test howelemental compositions affect Fe isotope fractionationfactors.
For schorl (tourmaline), consistency among the threeapproaches was found. The NRIXS-measured forceconstant of 196 ± 12 N/m is within error of the ab initio-calculated value of 209 N/m (Table 7 and Fig. 6). For themineral pair tourmaline-garnet, as shown in Fig. 7E andTable 8, the three methods all indicate a fractionation fac-
tor of D56Fetourmaline�garnet ¼ 0:25� 106=T 2, before Fe3+ cor-rection. The Fe3+ correction for NRIXS schorl (ErongoRegion, Namibia) containing only 5% Fe3+ is minor.Moosilauke tourmaline was not measured for Fe3+ contentdue to the limited sample amount, but the consistencyamong the three methods may imply a minor Fe3+ contentof Moosilauke tourmaline.
The Moosilauke sample does not contain any olivine.But a Mg-rich olivine (forsterite; Fo82) was measured pre-viously using NRIXS by Dauphas et al. (2014), so here wemeasure an Fe-rich olivine (fayalite) using NRIXS for com-parison. The mean Fe force constant of the fayalite mea-sured by NRIXS is 149 ± 25 N/m. Electron microprobeanalysis using EDS shows that this mineral contains littleMg (Fo = 0) and a minor amount of Mn (MnO = �2 wt%; Table 6). This force constant is much lower than thevalue reported by Dauphas et al. (2014), who quoted anNRIXS-derived force constant of 197 ± 10 N/m for the for-sterite (Fo = 82) they measured. The force constant of fay-alite measured in this study is the same as the value derivedfrom ab initio calculation (144 N/m) and from SOD shift(133 N/m; Polyakov and Mineev, 2000). Another evidencesupporting low Fe force constant of fayalite is that it hasa very similar value to ilmenite (155 ± 11 N/m), and previ-ous lab equilibration experiments also showed little Fe iso-topic fractionation between the two minerals (Sossi andO’Neill, 2017). The discrepancy between the force constantsof forsterite and fayalite cannot be attributed to an errorinduced by different measurement sessions, because asshown above the NRIXS-derived force constants for ilme-nite are identical from different sessions. Whether the dis-crepancy was caused by a difference in Mg contentwarrants further study. If it is true, this would translateto a mean Fe force constant for the forsterite-fayalite solidsolution of
hF iForsterite-FayaliteðN=mÞ ¼ 0:59Mg# þ 149 ð10Þwhere Mg# ¼ 100�Mg=ðMg þ FeÞ.
In summary, after correction for variable Fe3+ contentsin NRIXS-measured minerals and Mossilauke minerals,there is excellent agreement between the three approaches(Fig. 7 and Table 8). The only mineral that shows some dis-crepancy is biotite/annite (Fig. 7D). The measured isotopicfractionation between biotite and garnet in Moosilauke isconsistent with NRIXS measurements but not with theab initio calculations and we suspect that ab initio calcula-tion may have suffered from a large error for annite. Theconsistency between the three approaches implies thatMoosilauke minerals have reached Fe isotope equilibrium.Table 8 summarizes the equilibrium isotope fractionationfactors determined in this study (all minerals are relative
to garnet). We did not perform NRIXS or ab initio calcula-tions for minerals with Fe in trace amounts (e.g., muscoviteand plagioclase), but their equilibrium isotope fractionationfactors can be estimated using the Fe isotopic compositionsof Moosilauke minerals, and they are also reported inTable 8.
4.2. Magnesium isotopic fractionations between Moosilauke
minerals
The previous section shows that minerals from Mt.Moosilauke have reached Fe isotope equilibrium. Garnet,biotite and tourmaline have also been measured for theirMg isotopes, and whether the minerals reached Mg isotopicequilibrium needs to be assessed. As with Fe, we estimatethat truncating the polynomial expansion to the first order(high-T limit) should yield accurate 1000 lnb values within1% for 26Mg/24Mg at 500 �C or higher. Magnesium doesnot contain Mossbauer isotopes, so its force constant can-not be measured using NRIXS. Ab initio calculations werenot performed for Mg isotopes in this study, but literaturedata on ab initio calculations exist for some Mg-containingphases (Schauble, 2011; Huang et al., 2013; Wu et al.,2015). Given that Fe2+ and Mg2+ have similar ionic radii(0.78 vs. 0.72 A) and often replace each other in the samecrystal sites of minerals, one may expect them to show acorrelation in their isotopic fractionations. In Table 9 andFig. 8 we have compiled Mg vs. Fe isotope fractionationsof minerals derived from ab initio calculations and NRIXSmeasurements (Polyakov and Mineev, 2000; Polyakovet al., 2007; Blanchard et al., 2009; Schauble, 2011;Dauphas et al., 2012; Huang et al., 2013; Roskosz et al.,
2015). We find a trend for D26Mgmineral�garnet vs.
D56Femineral�garnet. The expected slope of the trend dependson Mg and Fe force constants and the masses of theirisotopes,
DMgA�B
DFeA�B
¼ m26 � m24
m26m24
� �m56m54
m56 � m54
� � hF iMgA � hF iMg
B
hF iFeA � hF iFeB¼ 4:8
hF iMgA � hF iMg
B
hF iFeA � hF iFeBð11Þ
If Fe and Mg have the same force constants in minerals,the slope should be 4.8 according to Eq. (11). However,most minerals plot slightly above the line (Fig. 8A). Aspointed out by Schauble (2011), deviation from the simplemass-scaling relationship between Mg and Fe isotopesindicates that Mg forms slightly stiffer bonds than Fe.Regardless of the difference, equilibrium Mg vs. Fefractionations of minerals show a trend in Fig. 8, and theMoosilauke minerals (tourmaline, biotite and garnet)follow this trend, suggesting that most likely Moosilaukeminerals have reached Mg and Fe isotopic equilibrium.
Converting the Mg isotopic differences betweenMoosilauke minerals to the temperature-dependent form
(i.e., D26Mgmineral�garnet ¼ A� 106=T 2; Fig. 8 and Table 8)
gives a biotite-garnet equilibrium fractionation factor of
D26Mgbiotite�garnet ¼ 0:83 �0:05ð Þ � 106=T 2. This fractiona-
tion agrees with the equilibrium fractionation reported

Fig. 7. Comparison between d56Fe analyses of Moosilauke minerals, NRIXS measurements, and ab initio calculations of Fe isotopefractionation between minerals. The blue shaded areas represent the errors of NRIXS measurements. Isotopic fractionations are expressed asisotopic differences between minerals and garnet (almandine). All iron in Moosilauke garnet and NRIXS-measured almandine is present asFe2+. Iron for ab initio calculations is assumed to be all Fe2+. (A) Isotopic fractionation between ilmenite and garnet. Isotopic fractionationbetween Moosilauke ilmenite (Fe3+/RFe = 0) and garnet (Fe3+/RFe = 0) (filled blue circle; corresponds to Dilmenite-garnet = 0.03(±0.02) � 106/T2)is consistent with that of ab initio calculations (black dash line; Dilmenite-almandine = 0.04 � 106/T2). NRIXS-measured fractionation (blue curve)and the fractionation determined by lab experiments (Sossi and O’Neill, 2017) are higher, but after correcting for Fe3+ in ilmenite measuredhere by NRIXS (Fe3+/RFe = 0.2) and studied by Sossi et al (Fe3+/RFe = 0.09) would bring the fractionations down to values that areconsistent with Moosilauke minerals and ab initio calculations, as shown in (B). (B) Isotopic fractionation between ilmenite and garnet aftercorrecting for Fe3+, assuming a 111 N/m difference between Fe3+ and Fe2+ counterparts. (C) Isotopic fractionation between biotiteand garnet. Isotopic compositions of Moosilauke biotite (Fe3+/RFe = 0.22) and garnet (Fe3+/RFe = 0) correspond to a fractionation ofDbiotite-garnet = 0.19 (± 0.02) � 106/T2 (filled blue circle). NRIXS measurements (blue curve) yielded Dannite-almandine = 0.22(±0.06) � 106/T2
with Fe3+/RFe = 0.32 for annite and Fe3+/RFe = 0 for almandine. The ab initio-calculated fractionation factor for the pure Fe2+ endmembers(black dash line) is Dannite-almandine = 0.25 � 106/T2. (D) Isotopic fractionation between biotite and garnet after correcting for Fe3+ assuming a111 N/m difference between pure Fe3+ and Fe2+ biotite. NRIXS measurements (Dannite-almandine = 0.12(±0.06) � 106/T2 after correctionfor Fe3+) and Moosilauke minerals (Dbiotite-garnet = 0.12(±0.02) � 106/T2 after correction for Fe3+) show excellent consistency, while ab initio
calculation gives a larger fractionation that may have suffered from a large error. (E) Isotopic fractionation between tourmaline and garnet.Great consistency among Moosilauke minerals, NRIXS measurements and ab initio calculations was found, pointing to a fractionation factorof Dtourmaline-garnet = 0.25(±0.02) � 106/T2. Fe3+/RFe was not measured for Moosilauke tourmaline due to the limited amount of the mineral,but tourmaline for NRIXS measurements had Fe3+/RFe = 0.05, a correction for Fe3+ is minor and would lead to a fractionation ofDtourmaline-garnet = 0.23(±0.02) � 106/T2. (F) Isotopic fractionation between fayalite and garnet. Fayalite is not present in the Mossilaukesample, and NRIXS (Dfayalite-almandine = 0.11(±0.08) � 106/T2 ; Fe3+/RFe = 0 for fayalite) and ab initio (Dfayalite-almandine = 0.07 � 106/T2)results are shown, together with experimental data from Sossi and O’Neill (2017).
34 N.X. Nie et al. /Geochimica et Cosmochimica Acta 302 (2021) 18–45
by Wang et al. (2015b), who found the relationship �0.83–
0.96 �106=T 2 based on isotopic compositions of naturalminerals from metapelites, again implying that Mg isotopicequilibrium has been reached between Moosilauke biotiteand garnet. Magnesium isotopic fractionation between
tourmaline and garnet had not been previously constrained,and our study suggests an equilibrium isotope fractionation
factor of D26Mgtourmaline�garnet ¼ 1:08 �0:05ð Þ� 106=T 2. Wang
et al. (2020b) measured Mg isotopic compositions of min-eral separates from Himalayan leucogranites and found

Tab
le8
Ironan
dMgisotopefractionationsbetweenmineralsan
dgarnet,an
dTiisotopefractionationbetweenbiotite
andilmenite.
Methods
Ilmenite-Garnet
Biotite-G
arnet
Tourm
aline-Garnet
Fayalite-Garnet
Muscovite-G
arnet
Plagioclase-Garnet
Feisotopefractionation
Avaluein
D56/54Fe=A�
106/T
2
Moosilaukeminerals(before
Fe3
+
correction)
0.03
±0.02
(Fe3
+/R
Fe=
0)0.19
±0.02
(Fe3
+/R
Fe=
0.22
)0.25
±0.02
(Fe3
+/R
Feunknown)
_0.33
±0.02
(Fe3
+/R
Feunknown)
0.30
±0.03
(Fe3
+/R
Feunknown)
Moosilaukeminerals(Fe3
+content
correctedto
0)0.03
±0.02
0.12
±0.02
__
__
NRIX
S(before
Fe3
+correction)
0.13
±0.05
(Fe3
+/R
Fe=
0.2)
0.22
±0.06
(Fe3
+/R
Fe=
0.32
)0.25
±0.05
(Fe3
+/R
Fe=
0.05
)0.11
±0.08
(Fe3
+/R
Fe=
0)_
_
NRIX
S(Fe3
+contentcorrectedto
0)0.07
±0.05
0.12
±0.06
0.23
±0.05
0.11
±0.08
__
Abinitio
calculations
(Fe3
+contentis0)
0.04
0.25
0.25
0.07
__
Mgisotopefractionation
Avaluein
D26/24Mg=A�
106/T
2
Moosilaukeminerals
_0.83
±0.05
1.08
±0.05
__
_Tiisotopefractionation
Avaluein
D49/47Ti=A�
106/T
2
Moosilaukeminerals
0.23
±0.01
forBiotite-Ilm
enite
ForFe3
+correction,an
isotopicdifference
of111N/m
betweenFe3
+an
dFe2
+mineral
endmem
berswas
assumed.Garnet
does
notcontain
Fe3
+.TheFe3
+/R
Feratiosin
bracketsaretheratiosof
themineralsthat
werecompared
togarnet.
N.X. Nie et al. /Geochimica et Cosmochimica Acta 302 (2021) 18–45 35
an isotopic difference between tourmaline and garnet from0.82 to 1.63‰, in general consistent with the large isotopicdifference between the two minerals observed in this study.
4.3. Titanium isotopic fractionation between biotite and
ilmenite
Moosilauke ilmenite, biotite, and the bulk rock weremeasured for their Ti isotopic compositions, with ilmenite(+0.05 ± 0.01‰ for d49/47Ti) being isotopically lighterthan the bulk rock (+0.23 ± 0.02‰) and biotite(+0.43 ± 0.01‰). At 500 �C, the first order term of thepolynomial expansion should yield 1000 lnb values accuratewithin 1% for the 49Ti/47Ti ratio. Unlike Mg and Fe, thetitanium isotopic composition of the bulk rock is not solelycontrolled by biotite (TiO2 = 1.3 wt%; Hodges and Spear,1982) but also by ilmenite. The Ti isotope fractionationbetween biotite and ilmenite is large, +0.38 ± 0.02‰ at500 �C, which corresponds to a temperature-dependent Ti
isotope fractionation of D49Tibiotite�garnet ¼ þ0:23ð�0:01Þ�106=T 2 (Table 8). In ilmenite, Ti is 6-fold coordinated. Inbiotite, there is some uncertainty as to how Ti4+ is present,but in all cases it involves Ti substituting for a lower chargecation in the octahedral layer (Henry and Guidotti, 2002;Henry et al., 2005), meaning that Ti in biotite should alsobe 6-fold coordinated. Therefore, similar oxidation stateand coordination number of Ti are present in ilmeniteand biotite, and it is difficult to explain the much heavierTi isotopic composition of biotite relative to ilmenite withthese two parameters. Wang et al. (2020a) calculated equi-librium Ti (either Ti3+ or Ti4+) isotopic fractionationsbetween various minerals using ab initio calculations.Although biotite was not included, they found significantvariation in reduced partition function ratios of geikielite-ilmenite solid solutions (up to 0.45‰ at 500 �C), despitethe fact that Ti is in same valence state of +4 and thesame coordination number of 6, implying an effect ofFe/(Fe + Mg) ratio on Ti reduced partition function ratio.The finding of significant Ti isotopic fractionation betweenbiotite and ilmenite is therefore not out of line with modelpredictions, but further work is needed to ascertain itsorigin.
5. APPLICATIONS
5.1. Iron and Mg isotopic fractionations during anatexis
Melting of the lower crust and the subsequent migrationof the partial melt to the upper crust during orogenesis playa key role in the chemical differentiation of the continentalcrust (Rudnick and Gao, 2003; Brown and Rushmer, 2006),but the isotopic fractionation during the process has notbeen well constrained. Here we show that our newly con-strained Fe and Mg isotope fractionation factors can beapplied to modeling isotopic fractionation during thisimportant process of intracrustal differentiation.
Fluid undersaturated melting likely predominates overfluid-saturated melting during high-grade metamorphism,and melt production usually involves the breakdownof hydrated minerals such as mica and amphibole

36 N.X. Nie et al. /Geochimica et Cosmochimica Acta 302 (2021) 18–45
(e.g., Yardley and Valley, 1997; Clemens, 2006). Muscovite/biotite dehydration melting is typical at �750–900 �C andcrustal pressures, and is commonly observed in orogens(e.g., Clemens, 2006; Brown, 2013). The biotite breakdownreaction in high-grade metapelite (�825–900 �C) is thefocus of the Fe and Mg isotope fractionation modellingpresented below, because it yields relatively large quantityof melts compared to muscovite dehydration melting(Clemens and Vielzeuf, 1987; Vielzeuf and Holloway,1988; Patino and Johnston, 1991). According to Patinoand Johnston (1991), biotite reacts over a temperatureinterval of 825–975 �C at 10 kbar, with the melt fractionincreasing steadily. The reaction was described as,
1g Btþ 0:55g Plþ 0:14g Alsþ 0:76g Qz
¼ 1:72g Meltþ 0:73g Grt: ð12Þ(Bt: biotite; Pl: plagioclase; Als: aluminosilicates; Qz:
quartz; Grt: garnet). In this reaction, biotite breaks downto produce melt and garnet that would be a residual refrac-tory phase in the source during melt extraction. In order tomodel Fe and Mg isotopic fractionation in this reaction, weuse the biotite-garnet Fe isotopic fractionation factors thatwe derived (Tables 8 and 10). The isotopic fractionationfactors between the minerals and melt are unknown, butcan be constrained using the NRIXS-derived Fe forceconstant of biotite (this study) and the force constant ofrhyolite glass reported in Dauphas et al. (2014). TheNRIXS-measured biotite (Fe3+/RFe = 0.32) has a forceconstant of 188 ± 16 N/m. Correction to a Fe3+/RFe ratioof 0.22 (i.e., the ratio in Moosilake biotite) would lead to aforce constant of 176 N/m. Dauphas et al. (2014) found acorrelation between the mean Fe force constant and theFe3+/RFe ratio in rhyolite glass. At a Fe3+/RFe ratio of0.22 similar to Moosilauke biotite (i.e., assuming the meltand biotite have similar Fe3+/RFe ratios), we estimate themean Fe force constant to be 272 N/m. These values forbiotite and rhyolite glass correspond to an equilibrium frac-
tionation of +0.22‰ (i.e., D56Femelt�bt ¼ 0:22‰) at 850 �C.For Mg isotopic fractionation between melt and biotite,for lack of better constraints, we assume that
DMgMelt�Bt ¼ 4:4DFe
Melt�Bt, as has been observed for equilibriumFe and Mg isotopic fractionations between biotite and gar-
net (i.e., DMgBt�Grt ¼ 4:4DFe
Bt�Grt) in the Moosilauke minerals.Based on the stoichiometry of the Eq. (12), each mole of
Fe in biotite consumed would generate 0.75 moles of Fe ingarnet and 0.25 moles of Fe in melt. Magnesium releasedfrom the breakdown of biotite would distribute amongthe three phases according to the Fe-Mg exchange coeffi-cients (Table 10; Breton and Thompson, 1988). Biotitedominates the Fe and Mg budget in metapelites similar toMoosilauke metapelites, and its Mg and Fe isotopic com-positions also represent the isotopic composition of bulkprotolith prior to the dehydration melting. We are inter-ested in the isotopic difference between melt and protolith,so the isotopic fractionation is expressed relative to the bulkoriginal metapelite. The results of the model are shown inFig. 9. In general, the melt has Fe and Mg isotopic compo-sitions heavier than biotite and garnet. For Fe, the meltbecomes progressively heavier for both batch equilibrium
and Rayleigh distillation, reaching a melt-biotite (protolith)difference up to +0.3‰. For Mg, batch equilibrium wouldcause the isotopic composition of the melt to decreaseslightly, but a Rayleigh distillation would lead to anincrease in the isotopic composition of the melt reaching+1.2‰ (i.e., 1.2‰ difference between melt and protolith).An important driver for the relatively large fractionationsis the formation of isotopically light garnet in the residue.In summary, this three-phase fractionation model suggeststhat the granitic melt produced from biotite dehydrationmelting of metapelitic rocks during anatexis is isotopicallyheavier than the source, by �0.2–0.3‰ for Fe isotopesand by �0.9–1.2‰ for Mg isotopes, provided that equilib-rium isotope fractionation prevails during partial meltingand no melt exchange with surroundings. The spread of iso-topic composition of the melt is relatively small, �0.1‰ forFe isotopes, and �0.3‰ for Mg isotopes.
Our modeled results are in excellent agreement with arecent study by Telus et al. (2012), who studied the Fe,Mg, Zn, and U isotopic compositions of migmatites, gran-itoids, and pegmatites from the Black Hills, South Dakotathat experienced a similar mica dehydration melting. Usingthe leucosomes in migmatites to represent granitic melt, themelanosome to represent the residue, and the nearby schistto represent the bulk source composition prior to themigmatization, they found a � +0.2‰ melt-source Fe iso-topic fractionation. This is consistent with our modeledresults suggesting that the melt should be isotopically heav-ier than the source by �0.2–0.3‰. Furthermore, the limitedisotopic variation of the melt in our model, �0.1‰ varia-tion for Fe isotopes, and �0.3‰ variation for Mg isotopes,is in general consistent with the observed limited isotopicvariations in S-type granites of �0.15‰ and �0.1‰ forFe isotopes and Mg isotopes, respectively (Li et al., 2010;Telus et al., 2012). However, our model considered onlythe biotite dehydration reaction under equilibrium condi-tions. Other Fe-bearing phases in the source such as Fe oxi-des, if present, could modify the Fe isotopic compositionsof the phases modeled here if there is any isotopic exchangebetween them during the process. Anatexis could alsoinvolve other processes such as assimilation and diffusion,which can induce further Fe and Mg isotopic variationsin granites.
5.2. Heavy Fe isotopic composition of lunar ilmenite
Ilmenite is an important mineral in lunar petrogenesis.Two types of mare basalts that have been identified in thereturned Apollo samples are low-Ti and high-Ti basalts.High-Ti basalts are distinguished from low-Ti basalts bytheir very high TiO2 content (in excess of 6 wt%) andabundant (10–20 modal %) ilmenite (Papike et al., 1976).Previous petrological studies have shown that the two typesof basalts cannot be related to each other by fractional crys-tallization, and melting of different source regions isrequired (Walker et al., 1975; Kesson and Ringwood,1976). The formation of high-Ti basalts might haveinvolved melting of a source region that include Fe- andTi-rich oxides that were produced in the late stage of lunarmagma ocean and were mixed subsequently with early

Table 9Comparison of Mg and Fe isotope fractionation factors at 500 �C.
Minerals 1000lnb 26/24
Mg at 500 �CD26/24Mg(mineral-garnet)
Ref. Minerals 1000 lnb 56/54
Fe at 500 �CD56/54Fe(mineral-garnet)
Ref.
Periclase 4.435 2.145 [1] Wustite 0.760 0.240 [3]Dolomite 3.503 1.213 [1] Ankerite 0.475 �0.045 [4]Magnesite 3.332 1.042 [1] Siderite 0.630 0.110 [5]Spinel 5.487 3.197 [1] Spinel 0.900 0.380 [6]Forsterite 3.898 1.608 [1,2] Fayalite 0.710 0.190 [7]Orthoenstatite 4.031 1.741 [1,2] Orthoenstatite 0.840 0.320 [8]Diopside 4.109 1.819 [1,2] Diopside 0.935 0.415 [4]Pyrope 2.290 0.000 [2] Almandine 0.520 0.000 [7]
[1] Schauble, 2011. [2] Huang et al., 2013. [3] Polyakov et al., 2007. [4] Polyakov and Mineev, 2000. [5] Blanchard et al., 2009. [6] Roskoszet al., 2015; [7] This study. [8] Dauphas et al., 2012.
Fig. 8. Magnesium isotope fractionations between Moosilauke minerals, compared to literature data. (A) Magnesium isotopic fractionationsvs. Fe isotopic fractionations for mineral-garnet pairs at 500 �C. Moosilauke minerals (colored symbols) are compared with minerals reportedin literature (grey dots are literature data showing the equilibrium Mg and Fe isotope fractionations based on ab initio calculations andNRIXS measurements; see Table 9; Polyakov and Mineev, 2000; Polyakov et al., 2007; Blanchard et al., 2009; Schauble, 2011; Dauphas et al.,2012; Huang et al., 2013; Roskosz et al., 2015). Slope 4.8 line indicates the mass scaling relationship if Mg and Fe have the same bond strengthin analogous minerals. Moosilauke minerals following the trend defined by literature minerals suggests that they have most likely reached Mgand Fe isotopic equilibrium. (B) Magnesium isotope fractionations of biotite-garnet and tourmaline-garnet pairs. Isotopic difference betweenbiotite and garnet (green diamond) corresponds to a fractionation of Dbiotite-garnet = 0.83(±0.05) � 106/T2. This fractionation agrees with thefractionation of 0.83–0.96 � 106/T2 reported in Wang et al. (2015b) (shaded grey area). Magnesium isotopic fractionation between tourmalineand garnet as a function of temperature, calculated using the isotopic difference between the two minerals (yellow triangle) at 500 �C, isDtourmaline-garnet = 1.08(±0.05) � 106/T2.
N.X. Nie et al. /Geochimica et Cosmochimica Acta 302 (2021) 18–45 37
mafic cumulates as a result of lunar mantle overturn(Kesson and Ringwood, 1976). The Mg and Fe isotopiccompositions of the two types of basalts are clearly distinct,with high Ti basalts systematically shifted relative to low-Tibasalts by �+0.1‰ for d56Fe (Poitrasson et al., 2004;Weyer et al., 2005; Craddock et al., 2010; Liu et al., 2010)and �� 0.1‰ for d26Mg (Sedaghatpour et al., 2013). Thisisotopic difference between low-Ti and high-Ti mare basaltswas likely set during lunar magma ocean (LMO) stage,reflecting signatures of LMO cumulates that later on wereremelted to produce mare basalts (Sedaghatpour andJacobsen, 2019). Comparison of low and high-Ti marebasalts thus suggests that ilmenite-rich cumulates in theLMO have heavy Fe isotopic composition relative to lunarmantle source regions not enriched in ilmenite.
Measurements of the mineral separates from low-Ti andhigh-Ti mare basalts also reveal that ilmenite in those
basalts, on average, have heavier isotopic composition thanthe co-existing pyroxene and olivine (Craddock et al., 2010;Wang et al., 2015a). Based on mass balance, Craddocket al. (2010) suggested that the Fe isotopic composition oflow-Ti basalts was controlled mainly by that of pyroxenewhile that of high-Ti basalts was controlled by ilmeniteand pyroxene. The measured heavier Fe isotopic composi-tion of ilmenite relative to pyroxene in mare basalts is atodds with the discussion above that under equilibrium con-ditions ilmenite should have lighter Fe isotopic compositioncompared to Mg-rich olivine and pyroxene (the force con-stant of pyroxene was not measured in this study but canbe found in literature; Table 5).
Below, we examine whether the reason for the measuredheavy Fe isotopic composition of (1) ilmenite mineral sep-arates in mare basalts, and (2) bulk high-Ti mare basaltsis that the signature was established during crystallization

38 N.X. Nie et al. /Geochimica et Cosmochimica Acta 302 (2021) 18–45
of earlier phases. This is a difficult idea to test for the LMOas a whole, but we evaluate below whether this is a viableinterpretation for minerals separated in mare basalts. Wemodelled the Fe isotopic evolution during the crystalliza-tion of melts with both low-Ti and high-Ti mare basaltcompositions (see Supplementary Materials for details).The mineral crystallization sequences were calculated usingthe MELTS program, and equilibrium Fe isotope fraction-ation factors between phases as a function of temperaturewere calculated using the force constants constrained in thisstudy and in the literature (Table S3). The results show thatfor both low-Ti and high-Ti starting compositions, the Feisotopic composition of ilmenite (both instantaneouslycrystallized and bulk/cumulate) is never heavier than thatof pyroxene or olivine (either instantaneously crystallizedor bulk) during crystallization (Fig. 10). Therefore, equilib-rium crystallization of minerals from mare basalt melts wasunlikely to cause the observed heavier Fe isotopic composi-tion of ilmenite relative to pyroxene/olivine.
Therefore, the heavy Fe isotopic composition of ilmenitemineral separates measured by Craddock et al. (2010) mostlikely reflects non-equilibrium conditions. One possibleexplanation for the heavy isotopic compositions of ilmenitein mare basalts is that it is controlled by Fe-Mg interdiffu-sion during crystallization of ilmenite. Large diffusion-driven Fe and Mg isotopic fractionations have beenobserved in terrestrial ilmenite (Tian et al., 2020). For ilme-nite to acquire an elevated d56Fe through diffusion, Fe hasto diffuse out of ilmenite while Mg diffuses in, which couldhappen if ilmenite interacted with a Mg-rich melt. How-ever, during mineral crystallization one would expect themelt to become progressively Fe-rich and Mg-depleted.Tian et al. (2020) invoked a model of interstitial immiscibleliquid phase segregation to explain the occurrence of a Mg-rich melt during ilmenite formation in a terrestrial setting.Diffusion-driven isotopic fractionation during the evolutionof immiscible silica melts has also been invoked to explainthe large Fe isotopic variations observed in A-type grani-toids (Zhu et al., 2015). These processes, however, are notnecessarily relevant to the melts that lunar ilmenite crystal-ized from. Measurements of Mg isotopes of lunar ilmeniteand associated minerals are needed to further assess thispossibility.
Another possibility for producing Fe isotopically heavyilmenite in mare basalts is if ilmenite was derived fromarmalcolite (Mg,Fe)Ti2O5 initially crystallized from themelts of the mare basalt source region. In mare basalts,ilmenite has been observed to sometimes occur as mantleson armalcolite, indicating formation through either break-down of armalcolite (into ilmenite and rutile) or reactionbetween armalcolite and basaltic liquid or other phases(El Goresy et al., 1974). Armalcolite has shorter FeAObonds than ilmenite (Wechsler et al., 1976; Wechsler andPrewitt, 1984), and could have heavier Fe isotopic compo-sition than ilmenite during equilibrium crystallization.Inheriting Fe isotopic composition from armalcolite couldthus have led to a heavy Fe isotopic composition in ilme-nite. Further work on lunar ilmenite is needed to elucidatethe origin of the heavy Fe isotopic composition of ilmenitedocumented by Craddock et al., (2010) but our results sug-
gest that it is unlikely to reflect equilibrium conditions, andother processes such as diffusion or inheritance of isotopesfrom pre-existing minerals have to be invoked.
5.3. Titanium isotopic fractionation by hydrodynamic sorting
during sediment transport
Titanium isotopic system has been used to reconstructthe chemical evolution of the continental crust in Earth’shistory (Greber et al., 2017b; Deng et al., 2019), relyingon the fact that the Ti isotopic composition of igneousrocks changes during magmatic differentiation (Milletet al., 2016; Johnson et al., 2019; Aarons et al., 2020;Hoare et al., 2020; Wang et al., 2020a; Zhao et al., 2020).Titanium is often considered to be immobile under terres-trial surface conditions and thus is used for normalizingconcentrations of water-soluble elements (e.g., Brimhalland Dietrich, 1987; Sheldon and Tabor, 2009), thereforeTi isotopic fractionation is expected to be insignificant dur-ing low temperature weathering processes. However, usingTi isotopes of detrital rocks such as shales to reconstructthe composition of the continental crust through time, ashas been done in Greber et al. (2017b), relies on the premisethat Ti isotopes do not fractionate during transport andsedimentation processes so that the Ti isotopic composi-tions of bulk sediments can reflect the integrated composi-tions of the sources. Sedimentary processes involveweathering, mixing, and transport of minerals, which caninvolve hydrodynamic sorting. Insoluble elements such asTi, Al, and Zr, although resistant to chemical weathering,can potentially be fractionated relative to their sourceabundances by hydrodynamic sorting during fluvial trans-port (Garcia et al., 1994; Bouchez et al., 2011; Lupkeret al., 2011; Garzanti et al., 2011). Previous study of riversediments showed that elemental compositions of river sus-pended sediments changed as a function of sampling depthor grain size due to hydrodynamic sorting (Bouchez et al.,2011; Garzanti et al., 2011). For example, a trend ofincreasing Ti/Th (Th was considered to be insoluble andwas used as the normalization element) with decreasingAl/Si (a surrogate for grain size) in Amazon river sus-pended sediments was found by Bouchez et al. (2011),and was interpreted as reflecting hydrodynamic sorting ofTi-rich heavy minerals into the near bottom of the waterchannel (i.e., low Al/Si coarse samples).
If fluvial transport can fractionate insoluble elementsincluding Ti, the question arises that whether it could alsofractionate Ti isotopes and induce a shift between the Tiisotopic composition of sediments (e.g., river sedimentsand shales) and their source, complicating the use of theTi isotopic composition of shales as a proxy for the uppercontinental crust composition (Greber et al., 2017b). Inshales, a strong correlation between TiO2 and Al2O3 haslong been observed (e.g., Goldschmidt, 1954; Garciaet al., 1994; Totten and Hanan, 2007), which is often attrib-uted to the retention of Ti within the fine-grained clay min-erals, but heavy Ti-rich minerals such as ilmenite and rutilealso contribute to Ti budget of suspended loads in rivers,because on the TiO2 vs. Al2O3 plot, the TiO2 value of shalesis greater than zero at zero Al2O3 (Totten and Hanan,

Table 10Parameters used for calculating Fe and Mg isotopic co-evolution during the anatexis of metapelitic rocks.
Parameters Comments
FeGrt produced/FeBt consumed = 0.75 75% Fe consumed in biotite during reaction enters product garnet; Calculated based on thestoichiometry of the reaction (Eq. (12)) and the chemical formulas of biotite and garnet
(Mg/Fe)Bt = 1 Initial molar Fe/Mg ratio of biotite; Assuming the ratio is similar to Moosilauke biotite(Hodges and Spear, 1982)
KDFe�MgGrt�Bt ¼ XFe
Grt
XMgGrt
=XFe
Bt
XMgBt
¼ 2:63 Fe-Mg distribution coefficient between garnet and biotite at 850 �C and 10 kbar(Breton and Thompson, 1988)
KDFe�MgGrt�Melt ¼ XFe
Grt
XMgGrt
=XFe
Melt
XMgMelt
¼ 2:32 Fe-Mg distribution coefficient between garnet and melt at 850 �C and 10 kbar(Breton and Thompson, 1988)
D56FeMelt-Bt = 0.22‰ Fe isotope fractionation between melt (heavy) and biotite (light) at 850 �C; see Section 5.1 for moreinformation
D56FeBt-Grt = 0.15‰ Fe isotope fractionation between biotite (heavy) and garnet (light) at 850 �C; Calculated byextrapolating Fe isotope fractionation between Moosilauke biotite and garnet to 850 �C
D26MgMelt-Bt = 0.97‰ Mg isotope fractionation between melt (heavy) and biotite (light); AssumingD26MgMelt-Bt/D
56FeMelt-Bt = D26MgBt-Grt/D56FeBt-Grt (see Section 5.1)
D26MgBt-Grt = 0.66‰ Mg isotope fractionation between biotite (heavy) and garnet (light); Through extrapolationof Mg isotope fractionation between Moosilauke biotite and garnet to 850 �C
Fig. 9. Iron and Mg distribution and isotopic evolution during biotite dehydration melting. Elemental partitioning and isotopic fractionationare considered between three phases of biotite, garnet and melt. The initial Fe and Mg isotopic compositions of the source are noted as d0
56Feand d0
26Mg. Fe distribution was assumed to follow the stoichiometry of the biotite breakdown reaction (Eq. (12)). Mg distribution wasassumed to be governed by Fe-Mg exchange coefficients among the three phases. (A) Iron isotopic evolution of biotite, garnet and melt duringbiotite dehydration melting, calculated for both batch equilibrium (dashed lines) and Rayleigh fractionation (solid lines) scenarios. (B)Magnesium isotopic evolution for biotite, garnet and melt. (C) Iron distribution among biotite, garnet, and melt during biotite dehydrationmelting. (D) Magnesium distribution among biotite, garnet, and melt during biotite dehydration melting.
N.X. Nie et al. /Geochimica et Cosmochimica Acta 302 (2021) 18–45 39

Fig. 10. Iron isotopic compositions of minerals and melt during crystallization of average high-Ti mare basalt composition (A) and averagelow-Ti mare basalt composition (B). The mineral crystallization sequence was calculated using MELTS program, and the equilibrium Feisotope fractionation factors between minerals are calculated using the force constants listed in Table S3. The results suggest that the Feisotopic compositions of ilmenite (either instantaneously crystallized or bulk average) are always lighter than the Fe isotopic compositions ofpyroxene and olivine during melt crystallization, which is at odds with the observed heavy Fe isotopic composition of ilmenite in mare basalts.This implies that ilmenite must have experienced non-equilibrium isotope fractionation processes.
Fig. 11. Titanium isotopic composition of sediments modeled byassuming a two-endmember mixing between Ti-rich heavy minerals(using ilmenite as a proxy, assuming no Al in ilmenite and itsisotopic composition of zero) and clay minerals (using biotite as aproxy, assuming a a Ti/Al mol/mol ratio of 0.04, and a d49Ti valueheavier than ilmenite by 0.35‰ at 500 �C and by 0.13‰ at 1000 �C).
40 N.X. Nie et al. /Geochimica et Cosmochimica Acta 302 (2021) 18–45
2007). Further work is needed to identify the carrier of Ti inrivers, and in particular whether Ti in the finest size fractionis in clay minerals or in secondary Ti-oxides. We assumebelow that clay minerals and coarser Ti-rich oxides arethe two main Ti carriers in sediments. Given that biotiteand clay minerals are both phyllosilicates with the same flatsheet crystal structure, biotite may be used as a proxy forclay minerals with regard to Ti equilibrium isotope frac-tionation. Our study suggests that at equilibrium, biotiteshould be preferentially enriched in the heavy Ti isotopescompared to ilmenite (Section 4.3). Many other silicateminerals are also expected to have heavy Ti isotopiccompositions relative to ilmenite, because ilmenite andTi-bearing oxides host Ti in a higher coordination thansilicates (Millet et al., 2016; Johnson et al., 2019; Wanget al., 2020a). Regardless of whether Ti is fractionated atequilibrium during clay formation or clay formation simplyinherits the Ti isotopic composition of primary silicateminerals (e.g., biotite and pyroxene), we would expect theseclay minerals to have heavy Ti isotopic composition relativeto Ti-bearing oxides. It is thus conceivable that hydro-dynamic sorting in fluvial systems, which would removeTi-rich heavy minerals into coarse-grained sediments,would enrich fine-grained rafting clay minerals in heavyTi isotopic composition, and thus would lead to a heavierTi isotopic composition in shales than source materials.
The effect of sorting on fractionating Ti isotopic compo-sitions of river sediments and shales can be broadly con-strained using the observed Ti isotope fractionationbetween biotite and ilmenite. In Fig. 10, we use the Ti iso-topic fractionation between biotite and ilmenite constrainedin this study as a proxy to estimate the isotopic compositionof sediments due to mixing of clay minerals and Ti-bearingoxide minerals. Assuming an isotopic fractionation betweenclay minerals and Ti-oxide minerals of +0.35‰ (thefractionation observed in Moosilauke biotite and ilmenite;Section 4.3), and a Ti/Al ratio of 0.04 (mol/mol) for clay
minerals (similar to Moosilauke biotite) and no Al inTi-rich minerals (similar to Moosilauke ilmenite),Ti isotopic compositions of sediments as a function of theirTi/Al ratios is calculated by mixing the two components(assuming ilmenite has a Ti isotopic composition of zero).A smaller fractionation of +0.13‰ at a higher temperature(1000 �C) corresponding to magmatic conditions is alsoshown in Fig. 11 for comparison. These fractionationswould represent the largest possible Ti isotopic variationsbetween sediments and their sources. In reality, the frac-tionation would be smaller given that the two endmembersof Fe-Ti oxides and phyllosilicates are mixed to some levelsin both the sources and sediments. Further detailed work

N.X. Nie et al. /Geochimica et Cosmochimica Acta 302 (2021) 18–45 41
on the Ti isotopic compositions, Ti mineral carriers, and Ti/Al ratios of river sediments and shales will tell us morequantitatively whether such fractionation needs to beaccounted for in provenance reconstructions. Our data sug-gest that the Ti isotopic difference between sediments andtheir sources most likely will not exceed 0.35‰.
6. CONCLUSION
Three independent methods have been used in this studyfor constraining equilibrium Fe isotope fractionation fac-tors among several common rock-forming minerals, includ-ing (i) isotopic analyses of minerals from Mt. Moosilauke(garnet, ilmenite, biotite, tourmaline, muscovite, plagio-clase and quartz; Table 1 and Fig. 2), (ii) NRIXS measure-ments of Fe force constants of natural almandine, ilmenite,annite, schorl and fayalite (Table 3 and Fig. 6), and (iii)ab initio calculations of Fe force constants of almandine,ilmenite, annite, schorl and fayalite (Table 4 and Fig. 6).Given that Fe3+ content has a large influence on the Fe-Obond strength and hence isotopic fractionation, Mossbauerspectroscopy was performed to quantify the Fe3+/RFeratios in the natural minerals measured by NRIXS (Fig. 4and Table 6). Equilibrium Fe isotopic fractionation factorsbetween pure Fe2+-endmember minerals are calculatedafter applying a correction to account for the contributionof Fe3+. In general, the three methods show good consis-tency for Fe isotopes (Fig. 7 and Table 8), suggesting thatMoosilauke minerals have reached Fe isotope equilibrium.
By comparing to Fe isotopic fractionations in Moosi-lauke minerals and Mg and Ti isotopic fractionationsreported in literature, we show that Moosilauke mineralsare also in isotopic equilibrium for Mg and Ti isotopes.We report equilibrium Mg isotope fractionation factorsbetween biotite, tourmaline, and garnet, as well as equilib-rium Ti isotope fractionation factor between biotite andilmenite (Table 8). Several applications of the newly con-strained equilibrium isotopic fractionation factors are dis-cussed: (i) Fe and Mg isotope fractionation duringanatexis of metapelites was modeled and the results arecompared with previous migmatite measurements, (ii) theFe isotope fractionation factors between ilmenite and otherminerals suggest that the ilmenite in mare basalts must havecrystalized in disequilibrium with other minerals and melt,and (iii) hydrodynamic sorting during fluvial transport ofTi-oxides could potentially fractionate the Ti isotopic com-position of terrigenous sediments, and further work isneeded to tell if this is an issue in provenance studies.
Declaration of Competing Interest
The authors declare that they have no known competingfinancial interests or personal relationships that could haveappeared to influence the work reported in this paper.
ACKNOWLEDGEMENTS
We thank Marc Blanchard for insightful discussions on theDFT approach and his assistance in addressing some commentsfrom the reviewers. This work was supported by grants from
NASA (NNX17AE86G, NNX17AE87G, 80NSSC17K0744, and80NSSC20K0821) and NSF (EAR1502591, EAR144495, andEAR-2001098) to ND, by a NASA Earth and Space ScienceFellowship NNX15AQ97H and a Carnegie PostdoctoralFellowship to NXN. This research used resources of the AdvancedPhoton Source, a U.S. Department of Energy (DOE) Office ofScience User Facility operated for the DOE Office of Science byArgonne National Laboratory under Contract No. DE-AC02-06CH11357.
APPENDIX A. SUPPLEMENTARY DATA
Supplementary data to this article can be found online athttps://doi.org/10.1016/j.gca.2021.03.014.
REFERENCES
Aarons S. M., Reimink J. R., Greber N. D., Heard A. W., ZhangZ. and Dauphas N. (2020) Titanium isotopes constrain amagmatic transition at the Hadean-Archean boundary in theAcasta Gneiss Complex. Sci. Adv. 6, eabc9959.
Alp E. E., Sturhahn W., Toellner T. S., Zhao J., Hu M. and BrownD. E. (2003) Vibrational dynamics studies by nuclear resonantinelastic X-ray scattering. In Mossbauer Spectroscopy. Springer,pp. 3–20.
Alvarez M., Sileo E. E. and Rueda E. H. (2008) Structure andreactivity of synthetic Co-substituted goethites. Am. Mineral.
93, 584–590.Amthauer G., Annerste H. and Hafner S. S. (1976) The Mossbauer
spectrum of 57Fe in silicate garnets. Zeitschrift fur Kristallo-
graphie-Crystall. Mater. 143, 14–55.Annersten H. (1974) Mossbauer studies of natural biotites. Am.
Mineral.: J. Earth Planet. Mater. 59, 143–151.Bacık P., Uher P., Ertl A., Jonsson E., Nysten P., Kanicky V. and
Vaculovic T. (2012) Zoned Ree enriched dravite from a graniticpegmatite in Forshammar Bergslagen Province, Sweden anEmpa Xrd and La–Icp-Ms Study. Can. Mineral. 50, 825–841.
Basciano L. C. and Peterson R. C. (2007) Jarosite–hydroniumjarosite solid-solution series with full iron site occupancy:mineralogy and crystal chemistry. Am. Mineral. 92, 1464–1473.
Beard B. L., Handler R. M., Scherer M. M., Wu L., Czaja A. D.,Heimann A. and Johnson C. M. (2010) Iron isotope fraction-ation between aqueous ferrous iron and goethite. Earth Planet.
Sci. Lett. 295, 241–250.Beard B. L. and Johnson C. M. (2004) Inter-mineral Fe isotope
variations in mantle-derived rocks and implications for the Fegeochemical cycle. Geochim. Cosmochim. Acta 68, 4727–4743.
Bigeleisen J. and Mayer M. G. (1947) Calculation of equilibriumconstants for isotopic exchange reactions. J. Chem. Phys. 15(5),261–267.
Blanchard M., Poitrasson F., Meheut M., Lazzeri M., Mauri F.and Balan E. (2009) Iron isotope fractionation between pyrite(FeS2), hematite (Fe2O3) and siderite (FeCO3): A first-princi-ples density functional theory study. Geochim. Cosmochim. Acta
73, 6565–6578.Blanchard M., Dauphas N., Hu M. Y., Roskosz M., Alp E. E.,
Golden D. C., Sio C. K., Tissot F. L. H., Zhao J., Gao L.,Morris R. V., Fornace M., Floris A., Lazzeri M. and Balan E.(2015) Reduced partition function ratios of iron and oxygen ingoethite. Geochim. Cosmochim. Acta 151, 19–33.
Blanchard M., Balan E. and Schauble E. A. (2017) Equilibriumfractionation of non-traditional isotopes: a molecular modelingperspective. Rev. Mineral. Geochem. 82, 27–63.

42 N.X. Nie et al. /Geochimica et Cosmochimica Acta 302 (2021) 18–45
Bouchez J., Gaillardet J., France-Lanord C., Maurice L. andDutra-Maia P. (2011) Grain size control of river suspendedsediment geochemistry: Clues from Amazon River depthprofiles. Geochem., Geophys., Geosyst. 12.
Breton N. L. and Thompson A. B. (1988) Fluid-absent (dehydra-tion) melting of biotite in metapelites in the early stages ofcrustal anatexis. Contr. Mineral. Petrol. 99, 226–237.
Brimhall G. H. and Dietrich W. E. (1987) Constitutive massbalance relations between chemical composition, volume,density, porosity, and strain in metasomatic hydrochemicalsystems: results on weathering and pedogenesis. Geochim.
Cosmochim. Acta 51, 567–587.Brown M. (2013) Granite: From genesis to emplacement. GSA
Bull. 125, 1079–1113.Brown M. and Rushmer T. (2006) Evolution and Differentiation of
the Continental Crust. Cambridge University Press.Chumakov A. I. and Sturhahn W. (1999) Experimental aspects of
inelastic nuclear resonance scattering. Hyperfine Interact. 123,781–808.
Clemens J. D. (2006) Melting of the Continental Crust: Fluid
Regimes, Melting Reactions, and Source-Rock Fertility. Cam-bridge University Press.
Clemens J. D. and Vielzeuf D. (1987) Constraints on melting andmagma production in the crust. Earth Planet. Sci. Lett. 86, 287–306.
Craddock P. R. and Dauphas N. (2010) Iron isotopic compositionsof reference materials, geostandards and chondrites. Geostand.Geoanal. Res 35, 101–123.
Craddock P. R., Dauphas N. and Clayton R. N. (2010) Miner-alogical control on iron isotopic fractionation during lunardifferentiation and magmatism. In Lunar and Planetary ScienceConference p. 1230.
Dauphas N., Janney P. E., Mendybaev R. A., WadhwaM., RichterF. M., Davis A. M., Van Zuilen M., Hines R. and Foley C. N.(2004) Chromatographic separation and multicollection-ICPMS analysis of iron. Investigating mass-dependent and-independent isotope effects. Anal. Chem. 76, 5855–5863.
Dauphas N., Pourmand A. and Teng F.-Z. (2009) Routine isotopicanalysis of iron by HR-MC-ICPMS: How precise and howaccurate? Chem. Geol. 267, 175–184.
Dauphas N., Roskosz M., Alp E. E., Golden D. C., Sio C. K.,Tissot F. L. H., Hu M. Y., Zhao J., Gao L. and Morris R. V.(2012) A general moment NRIXS approach to the determina-tion of equilibrium Fe isotopic fractionation factors: applica-tion to goethite and jarosite. Geochim. Cosmochim. Acta 94,254–275.
Dauphas N., Roskosz M., Alp E. E., Neuville D. R., HuM. Y., SioC. K., Tissot F. L. H., Zhao J., Tissandier L., Medard E. andCordier C. (2014) Magma redox and structural controls on ironisotope variations in Earth’s mantle and crust. Earth Planet.
Sci. Lett. 398, 127–140.Dauphas N., John S. G. and Rouxel O. (2017) Iron isotope
systematics. Rev. Mineral. Geochem. 82, 415–510.Dauphas N., HuM. Y., Baker E. M., Hu J., Tissot F. L., Alp E. E.,
Roskosz M., Zhao J., Bi W. and Liu J. (2018) SciPhon: a dataanalysis software for nuclear resonant inelastic X-ray scatteringwith applications to Fe, Kr, Sn, Eu and Dy. J. SynchrotronRadiation 25, 1581–1599.
Dauphas N. and Rouxel O. (2006) Mass spectrometry and naturalvariations of iron isotopes. Mass Spectrom. Rev. 25, 515–550.
Deng Z., Chaussidon M., Savage P., Robert F., Pik R. andMoynier F. (2019) Titanium isotopes as a tracer for the plumeor island arc affinity of felsic rocks. Proc. Natl. Acad. Sci. 116,1132–1135.
Domeneghetti M. C., Molin G. M., Stimpfl M. and Tribaudino M.(1995) Orthopyroxene from the Serra de Mage Meteorite:
Structure refinement and estimation of C2/c pyroxene contri-butions to apparent Pbca diffraction violations. Am. Mineral.
80, 923–929.Droop G. T. R. (1987) A general equation for estimating Fe3+
concentrations in ferromagnesian silicates and oxides frommicroprobe analyses, using stoichiometric criteria. Mineral.
Mag. 51, 431–435.Ducher M., Blanchard M. and Balan E. (2016) Equilibrium zinc
isotope fractionation in Zn-bearing minerals from first-princi-ples calculations. Chem. Geol. 443, 87–96.
Dyar M. D. and Burns R. G. (1986) Mossbauer spectral study offerruginous one-layer trioctahedral micas. Am. Mineral. 71,955–965.
Dyar M. D., Taylor M. E., Lutz T. M., Francis C. A., Guidotti C.V. and Wise M. (1998) Inclusive chemical characterization oftourmaline; Mossbauer study of Fe valence and site occupancy.Am. Mineral. 83, 848–864.
El Goresy A., Ramdohr P., Medenbach O. and Bernhardt H.-J.(1974) Taurus-Littrow TiO2-rich basalts-Opaque mineralogyand geochemistry. In Lunar and Planetary Science ConferenceProceedings pp. 627–652.
Elardo S. M. and Shahar A. (2017) Non-chondritic iron isotoperatios in planetary mantles as a result of core formation. Nat.
Geosci. 10, 317–321.Ferrow E. A., Annersten H. and Gunawardane R. P. (1988)
Mossbauer effect study on the mixed valence state of iron intourmaline. Mineral. Mag. 52, 221–228.
Fjellvag H., Grønvold F., Stølen S. and Hauback B. (1996) On thecrystallographic and magnetic structures of nearly stoichiomet-ric iron monoxide. J. Solid State Chem. 124, 52–57.
Fortier S. and Donnay G. (1975) Schorl refinement showingcomposition dependence of the tourmaline structure. Can.
Mineral. 13, 173–177.Fujii T., Moynier F., Blichert-Toft J. and Albarede F. (2014)
Density functional theory estimation of isotope fractionation ofFe, Ni, Cu, and Zn among species relevant to geochemical andbiological environments. Geochim. Cosmochim. Acta 140, 553–576.
Garcia D., Fonteilles M. and Moutte J. (1994) SedimentaryFractionations between Al, Ti, and Zr and the Genesis ofStrongly Peraluminous Granites. J. Geol. 102, 411–422.
Garrity K. F., Bennett J. W., Rabe K. M. and Vanderbilt D. (2014)Pseudopotentials for high-throughput DFT calculations. Com-
put. Mater. Sci. 81, 446–452.Garzanti E., Ando S., France-Lanord C., Censi P., Vignola P.,
Galy V. and Lupker M. (2011) Mineralogical and chemicalvariability of fluvial sediments 2. Suspended-load silt (Ganga–Brahmaputra, Bangladesh). Earth Planet. Sci. Lett. 302, 107–120.
Geiger C. A., Armbruster T., Lager G. A., Jiang K., LottermoserW. and Amthauer G. (1992) A combined temperature depen-dent 57 Fe Mossbauer and single crystal X-ray diffraction studyof synthetic almandine: Evidence for the Gol’danskii-Karyagineffect. Phys. Chem. Miner. 19, 121–126.
Giannozzi P., Baroni S., Bonini N., Calandra M., Car R.,Cavazzoni C., Ceresoli D., Chiarotti G. L., Cococcioni M.and Dabo I. (2009) QUANTUM ESPRESSO: a modular andopen-source software project for quantum simulations ofmaterials. J. Phys.: Condens. Matter 21 395502.
Giannozzi P., Andreussi O., Brumme T., Bunau O., Nardelli M. B.,Calandra M., Car R., Cavazzoni C., Ceresoli D. and Cococ-cioni M. (2017) Advanced capabilities for materials modellingwith Quantum ESPRESSO. J. Phys.: Condens. Matter 29
465901.Gibb T. C., Greenwood N. N. and Twist W. (1969) The Mossbauer
spectra of natural ilmenites. J. Inorg. Nucl. Chem. 31, 947–954.

N.X. Nie et al. /Geochimica et Cosmochimica Acta 302 (2021) 18–45 43
Goldschmidt V. M. (1954) Oxford at Clarendon Press: London.Geochemistry 730.
Greber Nicolas D., Dauphas N., Bekker A., Ptacek M. P.,Bindeman I. N. and Hofmann A. (2017b) Titanium isotopicevidence for felsic crust and plate tectonics 3.5 billion years ago.Science 357, 1271–1274.
Greber Nicolas D., Dauphas N., Puchtel I. S., Hofmann B. A. andArndt N. T. (2017a) Titanium stable isotopic variations inchondrites, achondrites and lunar rocks. Geochim. Cosmochim.
Acta 213, 534–552.Hazen R. M. (1977) Effects of temperature and pressure on the
crystal structure of ferromagnesian olivine. Am. Mineral. 62,286–295.
Henry D. J. and Guidotti C. V. (2002) Titanium in biotite frommetapelitic rocks: Temperature effects, crystal-chemical con-trols, and petrologic applications. Am. Mineral. 87, 375–382.
Henry D. J., Guidotti C. V. and Thomson J. A. (2005) The Ti-saturation surface for low-to-medium pressure metapeliticbiotites: Implications for geothermometry and Ti-substitutionmechanisms. Am. Mineral. 90, 316–328.
Hill P. S. and Schauble E. A. (2008) Modeling the effects of bondenvironment on equilibrium iron isotope fractionation in ferricaquo-chloro complexes. Geochim. Cosmochim. Acta 72, 1939–1958.
Hoare L., Klaver M., Saji N. S., Gillies J., Parkinson I. J.,Lissenberg C. J. and Millet M.-A. (2020) Melt chemistry andredox conditions control titanium isotope fractionation duringmagmatic differentiation. Geochim. Cosmochim. Acta.
Hodges K. V. and Spear F. S. (1982) Geothermometry, geobarom-etry and the Al2SiO5 triple point at Mt. Moosilauke, NewHampshire. Am. Mineral. 67, 1118–1134.
Holdaway M. J. (1971) Stability of andalusite and the aluminosil-icate phase diagram. Am. J. Sci. 271, 97–131, doi 10.
Hu M. Y., Toellner T. S., Dauphas N., Alp E. E. and Zhao J.(2013) Moments in nuclear resonant inelastic x-ray scatteringand their applications. Phys. Rev. B 87 064301.
Huang F., Zhang Z., Lundstrom C. C. and Zhi X. (2011) Iron andmagnesium isotopic compositions of peridotite xenoliths fromEastern China. Geochim. Cosmochim. Acta 75, 3318–3334.
Huang F., Chen L., Wu Z. and Wang W. (2013) First-principlescalculations of equilibrium Mg isotope fractionations betweengarnet, clinopyroxene, orthopyroxene, and olivine: Implicationsfor Mg isotope thermometry. Earth Planet. Sci. Lett. 367, 61–70.
Jarosewich E., Nelen J. A. and Norberg J. A. (1980) Referencesamples for electron microprobe analysis. Geostandards
Newsletter 4, 43–47.Johnson A. C., Aarons S. M., Dauphas N., Nie N. X., Zeng H.,
Helz R. T., Romaniello S. J. and Anbar A. D. (2019) Titaniumisotopic fractionation in Kilauea Iki lava lake driven by oxidecrystallization. Geochim. Cosmochim. Acta 264, 180–190.
Kesson S. E. and Ringwood A. E. (1976) Mare basalt petrogenesisin a dynamic moon. Earth Planet. Sci. Lett. 30, 155–163.
Kowalski P. M. and Jahn S. (2011) Prediction of equilibrium Liisotope fractionation between minerals and aqueous solutionsat high P and T: An efficient ab initio approach. Geochim.
Cosmochim. Acta 75, 6112–6123.Kowalski P. M., Wunder B. and Jahn S. (2013) Ab initio prediction
of equilibrium boron isotope fractionation between mineralsand aqueous fluids at high P and T. Geochim. Cosmochim. Acta
101, 285–301.Lavina B., Cesare B., Alvarez-Valero A. M., Uchida H., Downs R.
T., Koneva A. and Dera P. (2009) Closure temperatures ofintracrystalline ordering in anatectic and metamorphic her-cynite, Fe2+ Al2O4. Am. Mineral. 94, 657–665.
Lavina B., Dera P., Downs R. T., Yang W., Sinogeikin S., MengY., Shen G. and Schiferl D. (2010) Structure of siderite FeCO 3to 56 GPa and hysteresis of its spin-pairing transition. Phys.Rev. B 82 064110.
Lejaeghere K., Bihlmayer G., Bjorkman T., Blaha P., Blugel S.,Blum V., Caliste D., Castelli I. E., Clark S. J. and Dal Corso A.(2016) Reproducibility in density functional theory calculationsof solids. Science 351, aad3000.
Li W.-Y., Teng F.-Z., Ke S., Rudnick R. L., Gao S., Wu F.-Y. andChappell B. W. (2010) Heterogeneous magnesium isotopiccomposition of the upper continental crust. Geochim. Cos-
mochim. Acta 74, 6867–6884.Liu Y., Spicuzza M. J., Craddock P. R., Day J. M., Valley J. W.,
Dauphas N. and Taylor L. A. (2010) Oxygen and iron isotopeconstraints on near-surface fractionation effects and the com-position of lunar mare basalt source regions. Geochim. Cos-
mochim. Acta 74, 6249–6262.Lupker M., France-Lanord C., Lave J., Bouchez J., Galy V.,
Metivier F., Gaillardet J., Lartiges B. and Mugnier J.-L. (2011)A Rouse-based method to integrate the chemical compositionof river sediments: Application to the Ganga basin. J. Geophys.Res. Earth Surf. 116.
Maslen E. N., Streltsov V. A., Streltsova N. R. and Ishizawa N.(1994) Synchrotron X-ray study of the electron density in a-Fe2O3. Acta Crystallograph. Section B 50, 435–441.
Millet M.-A. and Dauphas N. (2014) Ultra-precise titanium stableisotope measurements by double-spike high resolution MC-ICP-MS. J. Anal. At. Spectrom. 29, 1444–1458.
Millet M.-A., Dauphas N., Greber N. D., Burton K. W., Dale C.W., Debret B., Macpherson C. G., Nowell G. M. and WilliamsH. M. (2016) Titanium stable isotope investigation of magmaticprocesses on the Earth and Moon. Earth Planet. Sci. Lett. 449,197–205.
Mills S. J., Nestola F., Kahlenberg V., Christy A. G., Hejny C. andRedhammer G. J. (2013) Looking for jarosite on Mars: Thelow-temperature crystal structure of jarosite. Am. Mineral. 98,1966–1971.
Monkhorst H. J. and Pack J. D. (1976) Special points for Brillouin-zone integrations. Phys. Rev. B 13, 5188.
Ottonello G. and Zuccolini M. V. (2009) Ab-initio structure,energy and stable Fe isotope equilibrium fractionation of somegeochemically relevant H-O–Fe complexes. Geochim. Cos-
mochim. Acta 73, 6447–6469.Papike J. J., Hodges F. N., Bence A. E., Cameron M. and Rhodes
J. M. (1976) Mare basalts: Crystal chemistry, mineralogy, andpetrology. Rev. Geophys. 14, 475–540.
Patino Douce A. E. and Johnston A. D. (1991) Phase equilibriaand melt productivity in the pelitic system: implications for theorigin of peraluminous granitoids and aluminous granulites.Contr. Mineral. Petrol. 107, 202–218.
Pattison D. R. (1992) Stability of andalusite and sillimanite and theAl2SiO5 triple point: constraints from the Ballachulish aureole,Scotland. J. Geol. 100, 423–446.
Perdew J. P., Burke K. and Ernzerhof M. (1996) Generalizedgradient approximation made simple. Phys. Rev. Lett. 77,3865.
Poitrasson F., Halliday A. N., Lee D.-C., Levasseur S. and TeutschN. (2004) Iron isotope differences between Earth, Moon, Marsand Vesta as possible records of contrasted accretion mecha-nisms. Earth Planet. Sci. Lett. 223, 253–266.
Polyakov V. B., Clayton R. N., Horita J. and Mineev S. D. (2007)Equilibrium iron isotope fractionation factors of minerals:Reevaluation from the data of nuclear inelastic resonant X-rayscattering and Mossbauer spectroscopy. Geochim. Cosmochim.
Acta 71, 3833–3846.

44 N.X. Nie et al. /Geochimica et Cosmochimica Acta 302 (2021) 18–45
Polyakov V. B. and Mineev S. D. (2000) The use of Mossbauerspectroscopy in stable isotope geochemistry. Geochim. Cos-
mochim. Acta 64, 849–865.Polyakov V. B., Mineev S. D., Clayton R. N., Hu G. and Mineev
K. S. (2005) Determination of tin equilibrium isotope fraction-ation factors from synchrotron radiation experiments. Geochim.
Cosmochim. Acta 69, 5531–5536.Pourmand A., Dauphas N. and Ireland T. J. (2012) A novel
extraction chromatography and MC-ICP-MS technique forrapid analysis of REE, Sc and Y: Revising CI-chondrite andPost-Archean Australian Shale (PAAS) abundances. Chem.
Geol. 291, 38–54.Prandini G., Marrazzo A., Castelli I. E., Mounet N. and Marzari
N. (2018) Precision and efficiency in solid-state pseudopotentialcalculations. npj Comput. Mater. 4, 1–13.
Prissel K. B., Krawczynski M. J., Nie N. X., Dauphas N., CouvyH., HuM. Y., Alp E. E. and Roskosz M. (2018) Experimentallydetermined effects of olivine crystallization and melt titaniumcontent on iron isotopic fractionation in planetary basalts.Geochim. Cosmochim. Acta 238, 580–598.
Rancourt D. G., Christie I. A. D., Lamarche G., Swainson I. andFlandrois S. (1994) Magnetism of synthetic and natural annitemica: ground state and nature of excitations in an exchange-wise two-dimensional easy-plane ferromagnet with disorder. J.Magn. Magn. Mater. 138, 31–44.
Redhammer G. J., Beran A., Schneider J., Amthauer G. andLottermoser W. (2000) Spectroscopic and structural propertiesof synthetic micas on the annite-siderophyllite binary: Synthe-sis, crystal structure refinement, Mossbauer, and infraredspectroscopy. Am. Mineral. 85, 449–465.
Roskosz M., Sio C. K. I., Dauphas N., Bi W., Tissot F. L. H., HuM. Y., Zhao J. and Alp E. E. (2015) Spinel–olivine–pyroxeneequilibrium iron isotopic fractionation and applications tonatural peridotites. Geochim. Cosmochim. Acta 169, 184–199.
Roskosz M., Amet Q., Fitoussi C., Dauphas N., Bourdon B.,Tissandier L., Hu M. Y., Said A., Alatas A. and Alp E. E.(2020) Redox and structural controls on tin isotopic fraction-ations among magmas. Geochim. Cosmochim. Acta 268, 42–55.
Rudnick R. L. and Gao S. (2003) 3.01 - Composition of the
Continental Crust. Pergamon, Oxford, pp. 1–64.Rumble, III, D. (1973) Andalusite, kyanite, and sillimanite from
the Mount Moosilauke region, New Hampshire. Geol. Soc. Am.
Bull. 84, 2423–2430.Rustad J. R. and Dixon D. A. (2009) Prediction of iron-isotope
fractionation between hematite (a-Fe2O3) and ferric andferrous iron in aqueous solution from density functional theory.J. Phys. Chem. A 113, 12249–12255.
Schauble E. A. (2004) Applying stable isotope fractionation theoryto new systems. Rev. Mineral. Geochem. 55, 65–111.
Schauble E. A. (2011) First-principles estimates of equilibriummagnesium isotope fractionation in silicate, oxide, carbonateand hexaaquamagnesium(2+) crystals. Geochim. Cosmochim.
Acta 75, 844–869.Sedaghatpour F. and Jacobsen S. B. (2019) Magnesium stable
isotopes support the lunar magma ocean cumulate remeltingmodel for mare basalts. Proc. Natl. Acad. Sci. USA 116, 73–78.
Sedaghatpour F., Teng F.-Z., Liu Y., Sears D. W. and Taylor L. A.(2013) Magnesium isotopic composition of the Moon. Geochim.
Cosmochim. Acta 120, 1–16.Seto M., Yoda Y., Kikuta S., Zhang X. W. and Ando M. (1995)
Observation of nuclear resonant scattering accompanied byphonon excitation using synchrotron radiation. Phys. Rev. Lett.74, 3828.
Shahar A., Elardo S. M. and Macris C. A. (2017) Equilibriumfractionation of non-traditional stable isotopes: an experimen-tal perspective. Rev. Mineral. Geochem. 82, 65–83.
Shahar A., Hillgren V. J., Horan M. F., Mesa-Garcia J., KaufmanL. A. and Mock T. D. (2015) Sulfur-controlled iron isotopefractionation experiments of core formation in planetarybodies. Geochim. Cosmochim. Acta 150, 253–264.
Shahar A., Schauble E. A., Caracas R., Gleason A. E., Reagan M.M., Xiao Y., Shu J. and Mao W. (2016) Pressure-dependentisotopic composition of iron alloys. Science 352, 580–582.
Shahar A., Young E. D. and Manning C. E. (2008) Equilibriumhigh-temperature Fe isotope fractionation between fayalite andmagnetite: An experimental calibration. Earth Planet. Sci. Lett.
268, 330–338.Sheldon N. D. and Tabor N. J. (2009) Quantitative paleoenviron-
mental and paleoclimatic reconstruction using paleosols. EarthSci. Rev. 95, 1–52.
Skulan J. L., Beard B. L. and Johnson C. M. (2002) Kineticand equilibrium Fe isotope fractionation between aqueousFe (III) and hematite. Geochim. Cosmochim. Acta 66, 2995–3015.
Sossi P. A. and O’Neill H. St. C. (2017) The effect of bondingenvironment on iron isotope fractionation between minerals athigh temperature. Geochim. Cosmochim. Acta 196, 121–143.
Sturhahn W., Alp E. E., Quast K. W. and Toellner T. (1999)Lamb-Moossbauer factor and second-order Doppler shift ofhematite. Advanced Photon Source User Activity Report.
Sturhahn W. and Jackson J. M. (2007) Geophysical applications ofnuclear resonant spectroscopy. Spec. Papers-Geol. Soc. Am.
421, 157.Sturhahn W., Toellner T. S., Alp E. E., Zhang X., Ando M., Yoda
Y., Kikuta S., Seto M., Kimball C. W. and Dabrowski B.(1995) Phonon density of states measured by inelastic nuclearresonant scattering. Phys. Rev. Lett. 74, 3832.
Telus M., Dauphas N., Moynier F., Tissot F. L. H., Teng F.-Z.,Nabelek P. I., Craddock P. R. and Groat L. A. (2012) Iron,zinc, magnesium and uranium isotopic fractionation duringcontinental crust differentiation: The tale from migmatites,granitoids, and pegmatites. Geochim. Cosmochim. Acta 97, 247–265.
Teng F.-Z., Dauphas N. and Watkins J. M. (2017) Non-traditionalstable isotopes: retrospective and prospective. Rev. Mineral.
Geochem. 82, 1–26.Teng F.-Z., Li W.-Y., Ke S., Yang W., Liu S.-A., Sedaghatpour F.,
Wang S.-J., Huang K.-J., Hu Y. and Ling M.-X. (2015)Magnesium isotopic compositions of international geologicalreference materials. Geostand. Geoanal. Res. 39, 329–339.
Teng F.-Z. and Yang W. (2014) Comparison of factors affecting theaccuracy of high-precision magnesium isotope analysis bymulti-collector inductively coupled plasma mass spectrometry.Rapid Commun. Mass Spectrom. 28, 19–24.
Tian H.-C., Zhang C., Teng F.-Z., Long Y.-J., Li S.-G., He Y., KeS., Chen X.-Y. and Yang W. (2020) Diffusion-driven extremeMg and Fe isotope fractionation in Panzhihua ilmenite:Implications for the origin of mafic intrusion. Geochim.
Cosmochim. Acta 278, 361–375.Totten M. W. and Hanan M. A. (2007) Chapter 12 Heavy Minerals
in Shales. In Developments in Sedimentology. Elsevier, pp. 323–341.
Vielzeuf D. and Holloway J. R. (1988) Experimental determinationof the fluid-absent melting relations in the pelitic system. Contr.Mineral. Petrol. 98, 257–276.
Virgo D., Luth R. W., Moats M. A. and Ulmer G. C. (1988)Constraints on the oxidation state of the mantle: an electro-chemical and 57Fe Mossbauer study of mantle-derivedilmenites. Geochim. Cosmochim. Acta 52, 1781–1794.
Walker D., Longhi J., Stolper E. M., Grove T. L. and Hays J. F.(1975) Origin of titaniferous lunar basalts. Geochim. Cos-
mochim. Acta 39, 1219–1235.

N.X. Nie et al. /Geochimica et Cosmochimica Acta 302 (2021) 18–45 45
Wang K., Jacobsen S. B., Sedaghatpour F., Chen H. and KorotevR. L. (2015a) The earliest Lunar Magma Ocean differentiationrecorded in Fe isotopes. Earth Planet. Sci. Lett. 430, 202–208.
Wang S.-J., Teng F.-Z. and Bea F. (2015b) Magnesium isotopicsystematics of metapelite in the deep crust and implications forgranite petrogenesis. Geochem. Persp. Lett., 75–83.
Wang W., Huang S., Huang F., Zhao X. and Wu Z. (2020a)Equilibrium inter-mineral titanium isotope fractionation:Implication for high-temperature titanium isotope geochem-istry. Geochim. Cosmochim. Acta 269, 540–553.
Wang Z.-Z., Liu S.-A., Liu Z.-C., Zheng Y.-C. and Wu F.-Y.(2020b) Extreme Mg and Zn isotope fractionation recorded inthe Himalayan leucogranites. Geochim. Cosmochim. Acta 278,305–321.
Wechsler B. A. and Prewitt C. T. (1984) Crystal structure ofilmenite (FeTiO3) at high temperature and at high pressure.Am. Mineral. 69, 176–185.
Wechsler B. A., Prewitt C. T. and Papike J. J. (1976) Chemistryand structure of lunar and synthetic armalcolite. Earth Planet.
Sci. Lett. 29, 91–103.Welch S. A., Beard B. L., Johnson C. M. and Braterman P. S.
(2003) Kinetic and equilibrium Fe isotope fractionationbetween aqueous Fe (II) and Fe (III). Geochim. Cosmochim.
Acta 67, 4231–4250.Weyer S., Anbar A. D., Brey G. P., Munker C., Mezger K. and
Woodland A. B. (2005) Iron isotope fractionation duringplanetary differentiation. Earth Planet. Sci. Lett. 240, 251–264.
Williams K. B., Krawczynski M. J., Nie N. X., Dauphas N., CouvyH., Hu M. Y. and Alp E. E. (2016) The role of differentiationprocesses in mare basalt iron isotope signatures. In LunarPlanet Sci Conf p. 2779.
Wu Z., Huang F. and Huang S. (2015) Isotope fractionationinduced by phase transformation: First-principles investigationfor Mg2SiO4. Earth Planet. Sci. Lett. 409, 339–347.
Wu H., He Y., Bao L., Zhu C. and Li S. (2017) Mineralcomposition control on inter-mineral iron isotopic fractiona-tion in granitoids. Geochim. Cosmochim. Acta 198, 208–217.
Yamanaka T., Komatsu Y. and Nomori H. (2007) Electron densitydistribution of FeTiO 3 ilmenite under high pressure analyzedby MEM using single crystal diffraction intensities. Phys. Chem.
Miner. 34, 307–318.Yardley B. W. and Valley J. W. (1997) The petrologic case for a dry
lower crust. J. Geophys. Res. Solid Earth 102, 12173–12185.Ye H., Wu C., Brzozowski M. J., Yang T., Zha X., Zhao S., Gao
B. and Li W. (2020) Calibrating equilibrium Fe isotopefractionation factors between magnetite, garnet, amphibole,and biotite. Geochim. Cosmochim. Acta 271, 78–95.
Young E. D., Manning C. E., Schauble E. A., Shahar A., Macris C.A., Lazar C. and Jordan M. (2015) High-temperature equilib-rium isotope fractionation of non-traditional stable isotopes:Experiments, theory, and applications. Chem. Geol. 395, 176–195.
Zhang J., Dauphas N., Davis A. M. and Pourmand A. (2011) Anew method for MC-ICPMS measurement of titanium isotopiccomposition: Identification of correlated isotope anomalies inmeteorites. J. Anal. At. Spectrom. 26, 2197–2205.
Zhao X., Tang S., Li J., Wang H., Helz R., Marsh B., Zhu X. andZhang H. (2020) Titanium isotopic fractionation during mag-matic differentiation. Contrib. Miner. Petrol. 175, 1–16.
Zhu D., Bao H. and Liu Y. (2015) Non-traditional stable isotopebehaviors in immiscible silica-melts in a mafic magma chamber.Sci. Rep. 5, 17561.
Associate editor: Fang Huang