Iron catalysts for the growth of carbon nanofibers: Fe ... · Iron catalysts for the growth of ......
13
HAL Id: hal-00793965 https://hal.archives-ouvertes.fr/hal-00793965 Submitted on 25 Mar 2013 HAL is a multi-disciplinary open access archive for the deposit and dissemination of sci- entific research documents, whether they are pub- lished or not. The documents may come from teaching and research institutions in France or abroad, or from public or private research centers. L’archive ouverte pluridisciplinaire HAL, est destinée au dépôt et à la diffusion de documents scientifiques de niveau recherche, publiés ou non, émanant des établissements d’enseignement et de recherche français ou étrangers, des laboratoires publics ou privés. Iron catalysts for the growth of carbon nanofibers: Fe, Fe3C or both? Zanbing He, Jean Luc Maurice, Aurelien Gohier, Chang Seok Lee, Didier Pribat, Costel Sorin Cojocaru To cite this version: Zanbing He, Jean Luc Maurice, Aurelien Gohier, Chang Seok Lee, Didier Pribat, et al.. Iron catalysts for the growth of carbon nanofibers: Fe, Fe3C or both?. Chemistry of Materials, American Chemical Society, 2011, 23 (24), pp.5379-5387. <10.1021/cm202315j>. <hal-00793965>
-
Upload
trinhxuyen -
Category
Documents
-
view
217 -
download
2
Transcript of Iron catalysts for the growth of carbon nanofibers: Fe ... · Iron catalysts for the growth of ......

HAL Id: hal-00793965https://hal.archives-ouvertes.fr/hal-00793965
Submitted on 25 Mar 2013
HAL is a multi-disciplinary open accessarchive for the deposit and dissemination of sci-entific research documents, whether they are pub-lished or not. The documents may come fromteaching and research institutions in France orabroad, or from public or private research centers.
L’archive ouverte pluridisciplinaire HAL, estdestinée au dépôt et à la diffusion de documentsscientifiques de niveau recherche, publiés ou non,émanant des établissements d’enseignement et derecherche français ou étrangers, des laboratoirespublics ou privés.
Iron catalysts for the growth of carbon nanofibers: Fe,Fe3C or both?
Zanbing He, Jean Luc Maurice, Aurelien Gohier, Chang Seok Lee, DidierPribat, Costel Sorin Cojocaru
To cite this version:Zanbing He, Jean Luc Maurice, Aurelien Gohier, Chang Seok Lee, Didier Pribat, et al.. Iron catalystsfor the growth of carbon nanofibers: Fe, Fe3C or both?. Chemistry of Materials, American ChemicalSociety, 2011, 23 (24), pp.5379-5387. <10.1021/cm202315j>. <hal-00793965>
Chemistry of Materials vol 23 iss24 (2011) 5379‐5387
DOI: http://dx.doi.org/10.1021/cm202315j
Iron Catalysts for the Growth of Carbon Nanofibers: Fe, Fe3C or
Both?
Zhanbing He,,†,‡ Jean‐Luc Maurice,† Aurelien Gohier,† Chang Seok Lee,† Didier Pribat,,§ and Costel
Sorin Cojocaru†
†Laboratoire de Physique des Interfaces et Couches Minces, LPICM, UMR 7647, Ecole Polytechnique-CNRS, Route de Saclay,
91128 Palaiseau Cedex, France
§Department of Energy Science, Sungkyunkwan University, Suwon 440-746, Korea
ABSTRACT:
Iron is a widely used catalyst for the growth of carbon nanotubes (CNTs) or carbon nanofibers (CNFs) by catalytic chemical vapor
deposition. However, both Fe and Fe−C compounds (generally, Fe3C) have been found to catalyze the growth of CNTs/CNFs, and a
comparison study of their respective catalytic activities is still missing. Furthermore, the control of the crystal structure of iron‐based
catalysts, that is α‐Fe or Fe3C, is still a challenge, which not only obscures our understanding of the growth mechanisms of
CNTs/CNFs, but also complicates subsequent procedures, such as the removal of catalysts for better industrial applications. Here, we
show a partial control of the phase of iron catalysts (α‐Fe or Fe3C), obtained by varying the growth temperatures during the
synthesis of carbon‐based nanofibers/nanotubes in a plasma‐enhanced chemical vapor deposition reactor. We also show that the
structure of CNFs originating from Fe3C is bamboo‐type, while that of CNFs originating from Fe is not. Moreover, we directly
compare the growth rates of carbon‐based nanofibers/nanotubes during the same experiments and find that CNFs/ CNTs grown by
α‐Fe nanoparticles are longer than CNFs grown from Fe3C nanoparticles. The influence of the type of catalyst on the growth of CNFs
is analyzed and the corresponding possible growth mechanisms, based on the different phases of the catalysts, are discussed.
KEYWORDS: carbon nanotubes, carbon nanofibers, PECVD growth, Iron catalyst, α‐Fe, Fe3C, growth mechanism, TEM
1. INTRODUCTION
Carbon nanotubes (CNTs)/carbon nanofibers (CNFs) have attracted continuous interest in the past two decades due to their singular
properties and their potential applications in the field of nanotechnology. These potentialities have given rise to an intense research
activity on catalytic chemical vapor deposition (CCVD) methods, which have been widely studied for large‐scale synthesis of
CNTs/CNFs.1 In particular, the plasma‐enhanced CVD (PECVD) synthesis process has been developed due to its ability to grow
vertically aligned CNTs/ CNFs at low temperatures, which is required for applications such as field emission devices.2,3 Generally,
CCVD CNT growth requires transition metal (Ni, Fe, Co) nanoparticle catalysts to decompose a gas mixture based on carbonaceous
precursors. However, some crucial questions on the growth mechanisms of CNTs/CNFs by CCVD still generate intense debates, as
summarized by Yoshida and co‐workers:4 (1) liquid, solid, or fluctuating structure for catalysts; (2) carbon diffusion through surface
or bulk; (3) metal or metal carbide for catalysts. Some experimental or theoretical4−9 works have been conducted to give some
insights on the first two questions, but few experimental works have focused on the crystallographic phases (metal or metal carbide)

of catalysts.4,5 Concerning iron catalyst, different phases of nanoparticles (e.g., body‐centered cubic (BCC) α‐iron,10−13 iron car‐
bide,4,5,10,14−19 and both20,21) have been reported from experimental observations. However, few efforts have been made to correlate
the nanoparticle chemical nature (e.g., Fe and/or Fe3C) with its catalytic efficiency for CNT growth. Hence, some essential questions
about iron‐based catalysts for the growth of CNTs/CNFs arise: (1) Are there any differences between the growth mechanisms of
CNTs/CNFs, depending on whether the catalyst particles are iron or iron carbide? (2) How do iron or iron carbide affect the growth
of CNTs/CNFs? (3) Is it possible to control the crystallographic phases of iron or iron carbide nanoparticle catalysts during growth? It
is of high interest to give some answers to these questions, from both fundamental and technological points of view. In the present
paper, by using exactly the same growth conditions with three different growth temperatures, we show that (1) both cementite Fe3C
and α‐Fe can act as catalysts for the growth of carbon nanotubes/nanofibres, but (2) they are characterized by quite different
behaviors: first, only the carbide appears to operate at 600 °C and below; second, the growth rate of CNFs from cementite, Fe3C,
appears largely lower than that of CNFs from Fe at higher temperatures (650 and 725 °C). Finally, it is interesting to note that the
structure of the nano‐objects obtained by Fe and Fe3C as well as the shape of the catalysts themselves are different, which can help
one to distinguish them easily.
2. EXPERIMENTAL DETAILS
2.1. Growth Conditions.
The vertically aligned CNF arrays were grown from 10 nm thick Fe films deposited on oxidized Si substrates by physical vapor deposition. During the
annealing up to the growth temperature and under vacuum, the iron thin film reorganizes to form catalytic seeds (nanoparticles) from which
CNFs/CNTs nucleate and grow. Growth was performed by direct current (dc) PECVD using a triode configuration, a method we otherwise develop
for field‐emission application.22 Briefly, a dc plasma is generated between two mesh electrodes (anode and cathode) made of graphite. Ions are
extracted from the plasma, down to the substrate, by negatively biasing the substrate holder (the third electrode) with respect to the cathode. The
growth conditions have been optimized for the fabrication of field emitter arrays; the only parameter that varies here is temperature. The pressure
in the reactor is 1 × 10⁻⁶ mbar before gas introduction and it is set to 2 mbar during growth. The precursor atmosphere is a mixture of water vapor,
hydrogen, and isopropyl alcohol with flow rates of 6.5, 3, and 5.5 sccm respectively. These optimized growth conditions correspond to 69% H, 18%
C, and 13% O (in at %), so that reducing elements are the major constituents of the plasma. As a consequence, we find little oxygen in the catalyst
particles after growth, as shown in Figures S1−3 (Suppor ng Informa on), which represent some electron energy‐loss spectroscopy (EELS) mapping
analysis performed on various carbon fibers after growth, with either Fe (Figures S1 & S2) or Fe3C catalyst (Figure S3). Only the air‐exposed surface
of the catalyst particles seems to be slightly oxidized. However, there are at least three phenomenon likely to contribute to the surface oxidation of
catalyst particles: (1) oxide formation during the growth of CNFs; (2) iron oxidation (native oxide) during the storage in air and at room temperature
for some time; (3) iron oxidation under the electron beam irradiation during the transmission electron microscope (TEM) experiments.23 We
believe that the two latter reasons are likely to be the most important, because the oxygen was found only at the bare surfaces of catalysts and not
in the bulk. So, we believe that the weak oxidizing effect of water vapor (and alcohol to a lesser extent) is to suppress the deposition of unwanted
amorphous carbon (which would poison catalysts), whereas oxidation of the catalyst particles during growth is prevented by the overall reducing
atmosphere inside the reactor. The applied voltage between anode and cathode in the chamber is kept constant at 500 V with a current intensity
of 0.2 A. At the beginning of the growth process, the extraction voltage and the extraction current are slowly increased up to the optimum
conditions (−50 V; 55 mA). At the end of the process, the chamber is totally pumped out and cooled down. Cooling takes around 30 min without
any gas flowing into the chamber. The present CNT synthesis runs were performed at 600, 650, and 725 °C for 36 min.
2.2. Characterization.
The characterizations of nanotubes/nano‐ fibers and catalysts were performed after the whole growth process was terminated. Of course, only in
situ observations of growth would warrant that the shape and structure of the catalysts observed are those that indeed catalyze growth. In the
present work, we assume that no phase‐change (Fe → Fe3C, or reciprocally) has occurred between growth and observation. This speculation is
justified by the present experimental observations (see Discussion). Scanning electron microscope (SEM) images of CNTs/CNFs were taken by a
Hitachi S‐4800 FE‐SEM with 25 kV accelerating voltage. The TEM samples were prepared by first scratching the deposits on the as‐grown samples.
CNFs were then adsorbed onto holey amorphous carbon membranes by gently rubbing copper TEM grids on the scratched samples. The TEM
images were obtained using a Philips CM 30 instrument working at 300 kV, and a Topcon 002B microscope working at 160 kV. Selected‐area
electron diffraction patterns (EDPs) were employed to determine the crystallographic phases of catalysts and high‐resolution electron microscopy
(HREM) images were used to study the microscopic mechanisms involved in the catalytic growth of CNFs. The nanoparticle catalysts were tilted to
zone axes to achieve EDPs by using a transmission electron microscope double‐tilt specimen holder, which is helpful to distinguish easily the
crystallographic phases of α‐Fe and Fe3C because of their different lattice parameters, symmetries, and crystal structures.
3. RESULTS
Let us first mention that the definitions of carbon nanofiber (CNF) and carbon nanotube (CNT) used here are those proposed by
Melechko and co‐workers:2 CNFs are those objects where graphene planes are at an angle with the tube axis (herringbone or
bamboo structure) while CNTs are those where these planes are parallel to the tube axis. This generates a qualitative difference for
the path of an electric current (e.g., in field‐emission applications) traveling along the nanostructure axis: either in the graphene
layer plane (tube) or across the graphene planes (fiber). There is a structural continuity between these two kinds of objects and one
can decrease the CNF angle (and thus get closer to CNTs) by, e.g., using water vapor in the growth atmosphere.23
3.1. Occurrence of α‐Fe or Fe3C Catalysts As a Function of Temperature.
Figure 1 shows the SEM images of the CNFs grown at 600, 650, and 725 °C. As suggested by their dark contrast in the SEM images, all
the top parts of CNFs are occupied by nanoparticles, indicating a tip‐growth mode, which is anticipated from a dc‐PECVD growth
technique on a SiO2 substrate (no chemical interaction between catalyst and substrate). Low‐magnification TEM images in Figure 2
display the general morphology of CNFs at different growth temperatures, whereas the corresponding enlarged bright‐field TEM
images emphasize the morphology of the nanoparticle catalysts. Irrespective of the growth temperatures, catalysts show elongated
tear‐drop shape along CNF axes, which is consistent with the common observation of nanoparticles when CNF growth is performed
by CVD. Selected‐area EDPs (Figure 3) were recorded to identify the crystal structure of individual catalyst nanoparticles. Both α‐Fe
(ferrite, BCC, a = 0.287 nm) and Fe3C (cementite, orthorhombic, Pnma space group, a = 0.509 nm; b = 0.674 nm; c = 0.452 nm) were
found to act as catalysts for the growth of CNFs. However, over the 30 fibers that we analyzed here, only Fe3C was found at the tips
of CNFs which were grown at the low temperature of 600 °C. We note that Yoshida et al., also found Fe3C at the growth temperature
of 600 °C,4 even though using different growth conditions and particle size, leading to CNT growth (as opposed to CNF). In contrast,
both α‐Fe and Fe3C were observed at the higher growth temperatures of 650 and 725 °C (see the Supporting Information, Table 1).
At 650 °C, over the collection of nanoparticles examined, we found 42 Fe3C and 80 Fe particles (i.e., 34.4% of Fe3C), whereas at 725
°C, there are 50 Fe3C and 106 Fe particles (i.e., 32% Fe3C). There is thus a threshold temperature for the occurrence of α‐ Fe
nucleation, with no appearance below 600 °C (we confirmed this with an experiment at 575 °C, which only shows Fe3C), and a slowly
varying existence at higher temperature. 3.2. Shape of Catalyst Nanoparticles and Nanofiber Structure. Interestingly, two distinct
kinds of morphologies of nanoparticles, namely rounded head (Figure 2k) and faceted head (Figure 2l), are found to be closely
correlated with the catalysts’ crystal structures determined from the analysis of EDPs. Those catalysts with faceted heads are α‐Fe
(Figure 3a−d), whereas those having round heads are primitive orthorhombic Fe3C (Figure 3e−h). Furthermore, some correlations
between the phases of nanoparticle catalysts and the CNF structure are also found. CNFs catalyzed by Fe3C at 650 or 725 °C always
exhibit a bamboo‐like morphology, with thick compartment‐separating joints encapsulated quasi‐peri‐ odically in the CNF hollow
core (Figure 2e, j, blue arrowheads; see the Supporting Information, Figures S4 and S5). Inversely, only few random graphene layers
are found in the CNF core when growth is catalyzed by α‐Fe. Surprisingly, the percentage of the bamboo‐like CNFs catalyzed by Fe3C
is 100%, found by checking more than 40 bamboo‐like CNFs at each temperature of 650 and 725 °C, where Fe and Fe3C coexist. In
other words, no CNFs catalyzed by Fe have a bamboo‐like structure with the thick compartment‐separating joints in their hollow
cores. It is worth pointing out that the enlongated α‐Fe nanoparticle tails observed at a relatively high temperature (725 °C) drive
the walls of CNFs parallel to their growth axis (Figure 2g, h and the Supporting Information, Figure S5e, f), so that the CNFs then
become true carbon nanotubes according to the definitions in ref 2.3.3. CNF Size Depending on the Type of Catalyst (Fe or Fe3C). The
simultaneous occurrence of Fe and Fe3C at 650 and 725 °C gives us the opportunity to directly compare the growth rates of
CNFs/CNTs which are grown under exactly the same synthesis conditions. The length of CNTs/CNFs is an important parameter
because we are mainly interested in field emission applications, and the field amplification factor, β, at the tip of a needle‐like field
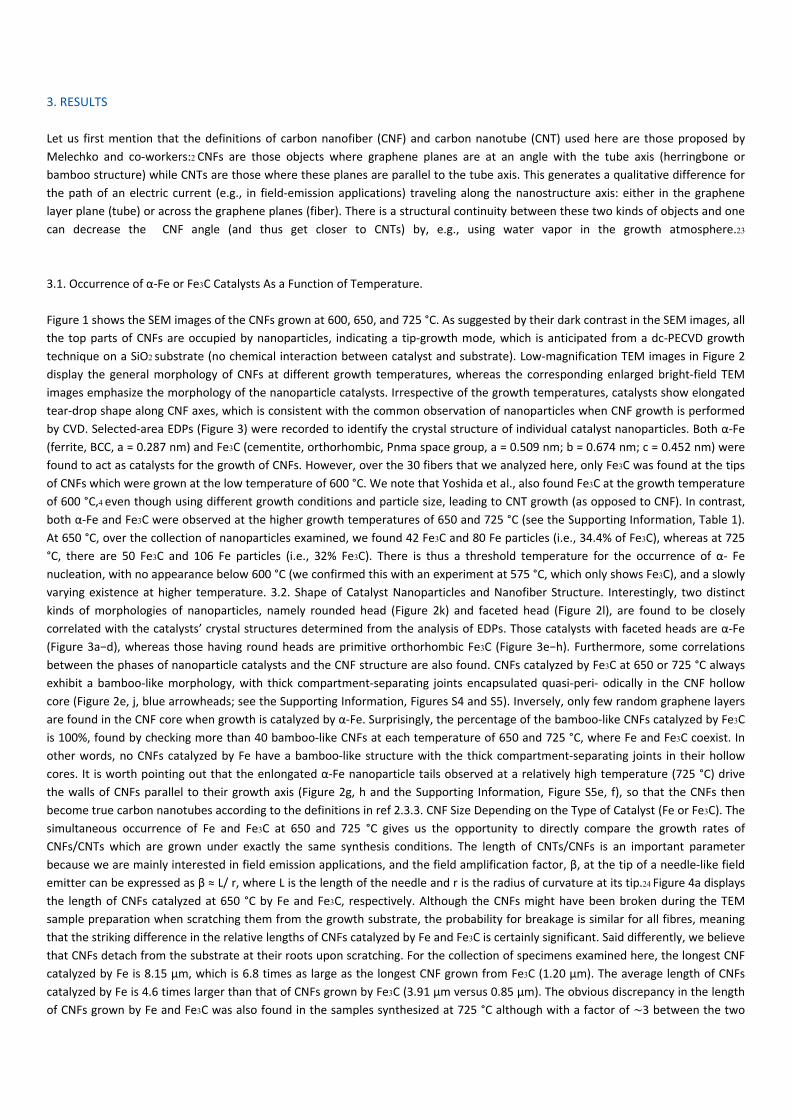
emitter can be expressed as β ≈ L/ r, where L is the length of the needle and r is the radius of curvature at its tip.24 Figure 4a displays
the length of CNFs catalyzed at 650 °C by Fe and Fe3C, respectively. Although the CNFs might have been broken during the TEM
sample preparation when scratching them from the growth substrate, the probability for breakage is similar for all fibres, meaning
that the striking difference in the relative lengths of CNFs catalyzed by Fe and Fe3C is certainly significant. Said differently, we believe
that CNFs detach from the substrate at their roots upon scratching. For the collection of specimens examined here, the longest CNF
catalyzed by Fe is 8.15 μm, which is 6.8 times as large as the longest CNF grown from Fe3C (1.20 μm). The average length of CNFs
catalyzed by Fe is 4.6 times larger than that of CNFs grown by Fe3C (3.91 μm versus 0.85 μm). The obvious discrepancy in the length
of CNFs grown by Fe and Fe3C was also found in the samples synthesized at 725 °C although with a factor of ∼3 between the two

average sizes (see the Supporting Information, Figure S6). The average diameters of CNFs catalyzed by Fe and Fe3C as a function of
growth temperatures are plotted in Figure 4b for comparison. The largest diameters of CNFs grown by Fe and Fe3C at 650 °C are 162
and 97.6 nm, respectively. The average diameter of CNFs grown from Fe nanoparticles at 650 °C is 100.7 nm, which is 1.69 times
larger than the diameter of CNFs grown from Fe3C nanoparticles (59.5 nm) under the same conditions. This is directly related to the
significantly larger size (on average) of the α‐Fe particles compared to the Fe3C ones at 650 °C (see Figures 2d and e). However, the
average diameter of CNFs grown from Fe catalysts at 725 °C is almost the same as that of Fe3C‐grown CNFs at 725 °C (55.3 nm versus
53.0 nm). In other words, the average diameter of CNFs grown by Fe decreases drastically (from 100.7 to 55.3 nm) when the
temperature increases from 650 to 725 °C, whereas no significant difference can be observed in the case of Fe3C nanoparticles.
Furthermore, the distribution of CNF diameters catalyzed by Fe is wider than that of Fe3C‐catalyzed CNFs (Figure 4). As far as field‐
emission characteristics are concerned,24 the field amplification factor for Fe‐catalyzed fibres, βFe ≈ LFe/rFe, is always larger than the
corresponding one for Fe3C‐catalyzed fibres.
3.4. Connections between Graphene Layers and the Catalyst Atomic Planes.
HREM images in Figure 5 show the details of the interface between the Fe catalyst and the graphene layers. Although the side
surface of catalyst which serves for the nucleation of graphene layers is conical in shape, with no clear faceting, it is important to
image the crystal planes to understand the atomic mechanisms of growth. The viewing direction of Fe in Figure 5 is along the [111]
crystallographic direction. The upper graphene layers of CNFs are parallel in this projection to (143)Fe, which is just an indication that
the Fe surface has a high energy there, with no minimization by faceting. However, their bending at the connection with the catalyst
“shoulder” (yellow arrow in Figure 5b) clearly indicates a specific relationship with the family of Fe planes that emerge at that Fe
surface, i.e. (011̅)Fe, which are the densest in the BCC structure. Thus the graphene layers are in the continuity of, and appear
generated by, the densest planes in the Fe structure. Because of the mismatch between the spacing of graphene layers (0.34 nm)
and that of iron (011̅) crystallographic planes (0.20 nm), the interface is at an angle that optimizes the match, so as to maximize the
connection of CNF layers with the step edges formed by the intersection of the (011̅)Fe crystallographic planes with the catalyst
surface. The picture is quite different in the case of Fe3C catalyst nanoparticles, which exhibit in general smooth side surfaces under
a low magnification and do not show large collections of step edges as observed previously on the side surface of Fe nanoparticles.
Figure 6 shows the interface between a Fe3C particle and graphene layers grown at 600 °C: some monatomic steps and protrusions
with few atomic steps can be detected at close inspection. This is highlighted on the locations marked by black lattice spots in Figure
6a, two of them being enlarged in Figure 6b, c for more details. Three graphene layers labeled “1”, “2”, and “3” in Figure 6a are the
inner layers of the CNF, as indicated by the blue, red, and green dotted lines, respectively. Layer “1” is discrete, but all its segments
connect entirely with the Fe3C catalyst; layer “2” looks more continuous than layer “1”, but more disrupted than layer “3”. Layer “3”
is the most continuous one among them, with its part connecting with the lower section of the side surface of Fe3C particle, as seen
at the low right‐end side in Figure 6a. As with Fe, the graphene layers follow the curvature of the sidewalls of the Fe3C catalyst
particles. For instance, in the TEM image of Figure 6, a majority of graphene layers from the CNF are parallel to the (3̅4̅1)
crystallographic plane of Fe3C, with fewer parallel to (3̅5̅2). Again, this is an indication of the high catalyst surface energy needed for
graphene nucleation. The deviation of the orientation of the graphene layers, caused by the change of the crystallographic side
surface of the elongated convex Fe3C particle, is compensated by inserting some more graphene layers, hence the presence of edge‐
type dislocations, marked by a white “ ” in Figure 6a. Another reason for the generation of dislocations in the CNF structure would
be the nucleation at multipositions. The number of atomic steps on the Fe3C side wall varies depending on the nucleation location,
e.g., 2 and 3 graphene layers at the up‐ and down‐sides of the protrusion in Figure 6b, and only one in Figure 6c. The merging of
different numbers of graphene layers spreading from different nucleation sites could misfit, which induces one more graphene layer
to be inserted between two continuous graphene layers leading to an edge dislocation, as seen in Figure 6a.

Figure 1. SEM images of vertically aligned CNFs grown at different temperatures. (a) 600, (b) 650, and (c) 725 °C. Catalyst nanoparticles appear with
a dark contrast at the tips of CNFs.

Figure 2. Low‐magnification and enlarged bright‐field TEM images of CNFs/CNTs grown at different temperatures: (a, b) 600, (c−e) 650, and (f− j)
725 °C. (k, l) Schematics of Fe3C and Fe catalyst shapes. Both Fe3C and Fe catalysts are elongated along the axis of the tubes/fibers, but the Fe3C
particles exhibit a rounded growth front which contrasts with the faceted one of the Fe particles. Note that both CNTs (h) and CNFs (j) have been
observed at the high temperature growth of 725 °C.
Figure 3. Experimental selected‐area electron diffraction patterns (EDPs) of the nanoparticle catalysts obtained by tilting them to low index zone
axes. (a) [100], (b) [111], (c) [110], and (d) [113 ̅] EDPs of Fe; (e) [010], (f) [11̅1 ̅], (g) [011], and (h) [001] EDPs of Fe3C (cementite). Fe3C catalysts were
found at all growth temperatures, whereas Fe catalysts were only found at the relatively higher temperatures of 650 and 725 °C.
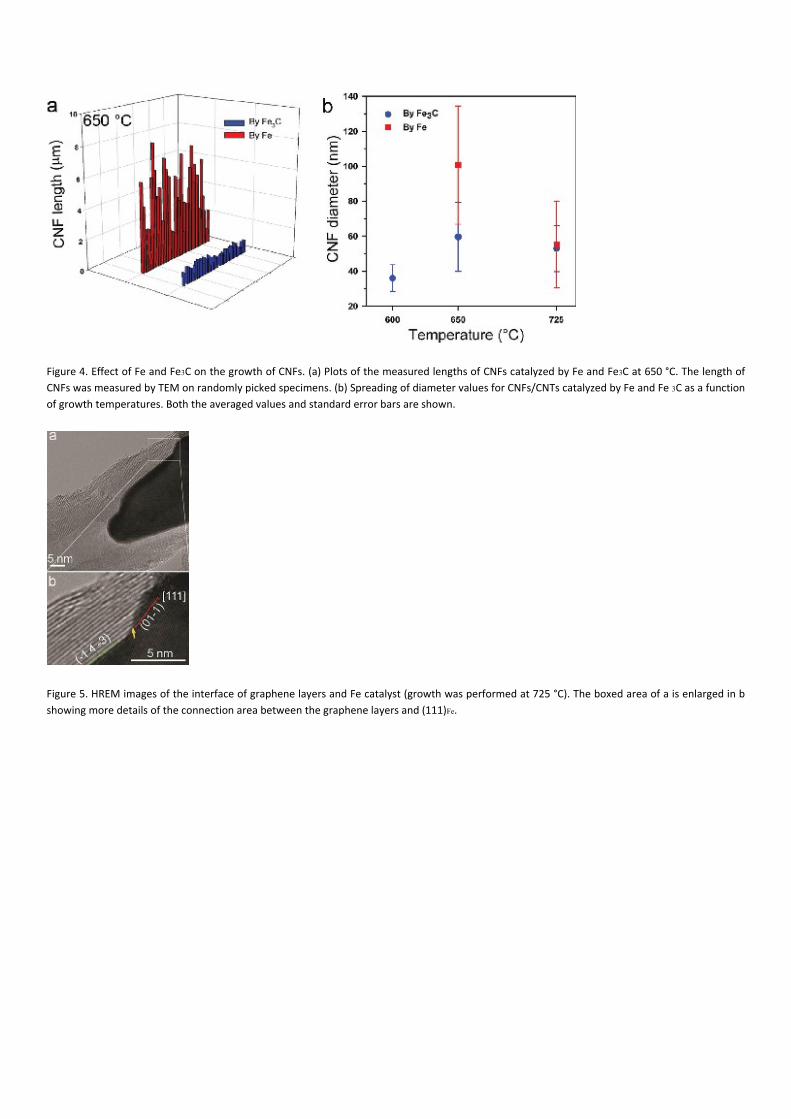
Figure 4. Effect of Fe and Fe3C on the growth of CNFs. (a) Plots of the measured lengths of CNFs catalyzed by Fe and Fe3C at 650 °C. The length of
CNFs was measured by TEM on randomly picked specimens. (b) Spreading of diameter values for CNFs/CNTs catalyzed by Fe and Fe 3C as a function
of growth temperatures. Both the averaged values and standard error bars are shown.
Figure 5. HREM images of the interface of graphene layers and Fe catalyst (growth was performed at 725 °C). The boxed area of a is enlarged in b
showing more details of the connection area between the graphene layers and (111)Fe.
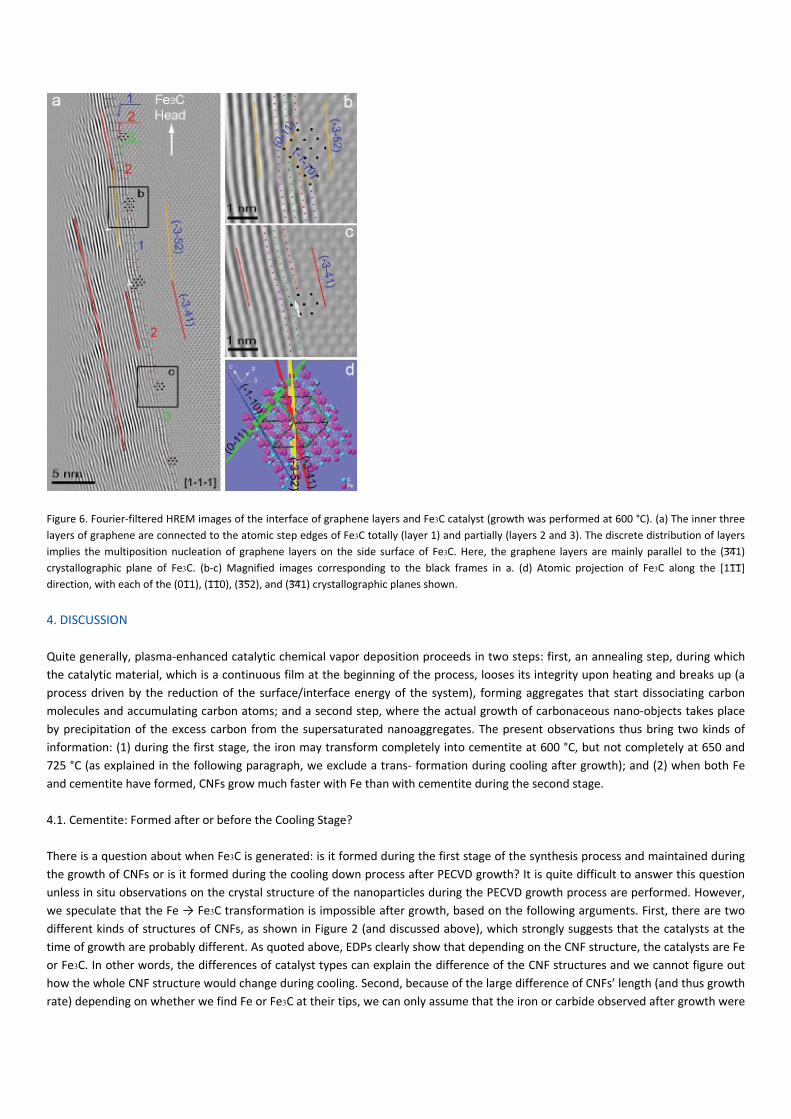
Figure 6. Fourier‐filtered HREM images of the interface of graphene layers and Fe3C catalyst (growth was performed at 600 °C). (a) The inner three
layers of graphene are connected to the atomic step edges of Fe3C totally (layer 1) and partially (layers 2 and 3). The discrete distribution of layers
implies the multiposition nucleation of graphene layers on the side surface of Fe3C. Here, the graphene layers are mainly parallel to the (3̅4 ̅1)
crystallographic plane of Fe3C. (b‐c) Magnified images corresponding to the black frames in a. (d) Atomic projection of Fe3C along the [11̅1 ̅]
direction, with each of the (01 ̅1), (1 ̅1 ̅0), (3 ̅5 ̅2), and (3 ̅4 ̅1) crystallographic planes shown.
4. DISCUSSION
Quite generally, plasma‐enhanced catalytic chemical vapor deposition proceeds in two steps: first, an annealing step, during which
the catalytic material, which is a continuous film at the beginning of the process, looses its integrity upon heating and breaks up (a
process driven by the reduction of the surface/interface energy of the system), forming aggregates that start dissociating carbon
molecules and accumulating carbon atoms; and a second step, where the actual growth of carbonaceous nano‐objects takes place
by precipitation of the excess carbon from the supersaturated nanoaggregates. The present observations thus bring two kinds of
information: (1) during the first stage, the iron may transform completely into cementite at 600 °C, but not completely at 650 and
725 °C (as explained in the following paragraph, we exclude a trans‐ formation during cooling after growth); and (2) when both Fe
and cementite have formed, CNFs grow much faster with Fe than with cementite during the second stage.
4.1. Cementite: Formed after or before the Cooling Stage?
There is a question about when Fe3C is generated: is it formed during the first stage of the synthesis process and maintained during
the growth of CNFs or is it formed during the cooling down process after PECVD growth? It is quite difficult to answer this question
unless in situ observations on the crystal structure of the nanoparticles during the PECVD growth process are performed. However,
we speculate that the Fe → Fe3C transformation is impossible after growth, based on the following arguments. First, there are two
different kinds of structures of CNFs, as shown in Figure 2 (and discussed above), which strongly suggests that the catalysts at the
time of growth are probably different. As quoted above, EDPs clearly show that depending on the CNF structure, the catalysts are Fe
or Fe3C. In other words, the differences of catalyst types can explain the difference of the CNF structures and we cannot figure out
how the whole CNF structure would change during cooling. Second, because of the large difference of CNFs’ length (and thus growth
rate) depending on whether we find Fe or Fe3C at their tips, we can only assume that the iron or carbide observed after growth were

indeed present during growth, and even that they had formed before actual growth, during the incubation stage. Third, as
summarized in Figure 2 and already discussed, the shape of Fe and Fe3C nanoparticles is drastically different. It is also hard to figure
out how (i) the facets of the Fe nanoparticles’ growth front can be transformed into the round surface of Fe3C upon cooling, and (ii)
how the large collection of growth steps at the side surface of these Fe nanoparticles would disappear after the growth process, still
during the cooling stage. Therefore, we think that Fe3C nanoparticles were formed during the first stage of growth (annealing) and
kept as catalysts during the growth process, which is also suggested by the uniform structure of CNFs grown by Fe3C, e.g., the thick
compartment‐separating joints encapsulated quasi‐periodically in the CNF hollow core, as seen in Figures S4b−d and S5c in the
Supporting Information. Note, for instance in Figure S4d, that the thick compartments inside the fiber can be seen right from the
bottom part, which tells us that Fe3C was already there at the beginning of growth. In fact those compartments can be used as a
marker for growth from Fe3C.
4.2. Iron or Carbide?
A quick look at the Fe−C phase diagram tells us that under the eutectoic temperature (∼ 730 °C), the only phases are α‐Fe and graphite. The Fe3C domain of existence consists in a vertical straight line, indicating that this compound supports very little off‐
stoichiometry. As carbon solubility is well below 0.1 at % in α‐Fe,25 Fe3C or graphite should appear as soon as the carbon
concentration reaches a few fractions of percent in iron. Carbon solubility in α‐Fe in the 600−700 °C range is slightly higher when the
solution is in equilibrium with cementite25,26 than with graphite, which indicates that graphite − and not cemen te – should
precipitate first from an iron solution that becomes super‐ saturated with carbon. However, what differentiates the appearance of
one of the two phases is more probably related to the parameters classically involved in heterogeneous nucleation: surface energy,
elastic energy, and density of nucleation sites. An incubation period is necessary before the onset of graphene nucleation.4,27 During
this incubation time, carbon invades the α‐Fe catalyst seeds very rapidly, as carbon diffusion is very fast in α‐Fe (see our discussion
on growth rate below), thus reaching almost instantaneously the solubility limit. The carbon then has to precipitate, either directly in
the form of graphite (or rather graphene sheets), or in the form of carbide. Graphene is two‐dimensional in nature, with very low
surface energy (46.7 mJ/m2, see ref 28), so that its precipitation cost at the surface of nanoparticles is low, except at the nucleation
stage, where the proportion of lateral − high‐energy – surfaces or edges remains significant (e.g., Figure 5). Thus the occurrence of
graphene essentially depends on the density and quality of nucleation sites on the nanoparticles. Cementite has in contrast a
standard 3D structure, related to that of α‐ Fe,29 but with quite different crystal symmetries and lattice parameters. Thus its
precipitation costs in an iron matrix have to include significant interface and elastic energy terms. In other words, once Fe3C is locally
nucleated, the Fe3C−Fe interface has to progress inside the Fe particle (overcoming interface energy and elastic energy barriers) until
the latter has completely turned into cementite. This will tend to occur in smaller particles, because the interface has less to travel,
which is consistent with what we observe at 650 °C (see Figure 2d, e). On the other hand, as the growth temperature is raised, the
number of vacancies in α‐Fe increases, which tends to ease the self‐diffusion of Fe atoms, favoring the formation of atomic steps on
the side walls of the nanoparticle (inducing reshaping of the particle) and thus favoring the nucleation of graphene layers. So, our
understanding is that at low growth temperature (600 °C and below), the reshaping of the Fe catalyst particle (leading to step
formation and graphene precipitation) is not fast enough to overtake nucleation and growth of Fe3C, whereas at higher
temperature, the two mechanisms coexist, resulting in mixtures of Fe and Fe3C catalysts. The question now is how general are the
present results and observations? Of course our growth conditions are rather specific, but we note that Behr and co‐workers30 have
also found mixtures of Fe and Fe3C in their nanotubes/nanofibers, grown by PECVD at 800 °C, even though they used inductive
coupling (ICP) for plasma excitation and they observed root‐ growth conditions because their iron catalysts interact with the Si
substrate. They attributed the difference in catalyst structure to the growth atmosphere (H2 partial pressure), which obviously is not
the main parameter to consider, since here we observe mixtures of Fe and Fe3C without changing the growth atmosphere. Also, de
Resende and co‐workers21 find the simultaneous occurrence of α‐Fe and Fe3C (as well as γ‐Fe) at 1025 °C growth temperature, using
pure CVD. Anisimov and co‐workers13 found Fe3C, in conjunction with Fe, although in their growth conditions (CO disproportionation
between ∼850 and 1050 °C and very small residence time in the furnace), they observed Fe3C to be inactive for CNT growth. So,
whatever the mechanism, this phenomenon of simultaneous occurrence of Fe and Fe3C is seen in other reports, for growth
temperatures above 600 °C, but has never been systematically studied. On the other hand, as already quoted, Yoshida and co‐
workers (ref 4) have found only Fe3C at 600 °C, consistently with our observations.
4.3. Growth Rate.
Now that we have qualitatively explained the presence or absence of metal or carbide with nucleation barrier considerations, we
shall see that the different growth rates (in our 650 and 725 °C growth treatments) stem additionally from other parameters.
Depending on the process parameters, the growth of CNTs can be limited by (i) nucleation,31 (ii) carbon diffusion inside4,32 or at the
surface of the catalyst33,34 and (iii) feedstock supply,35 including adsorption and dissociation of the gas molecules or radicals on the
surface of the catalyst particles. Let us first examine the diffusion of carbon atoms across the nanoparticles. The diffusion coefficient
of C in α‐Fe,36 is much larger than that of C in Fe3C:37 DFe (600 °C) = 9 × 10⁻⁸ cm2s−1 and DFe (725 °C) = 4 × 10⁻⁷ cm2s−1 to be compared
respectively to DFe3C (600 °C) = 9 × 10⁻¹³ cm2s−1 and DFe3C(725 °C) = 10−11 cm2s−1. Thus, if one compares the typical diffusion times
across the nanoparticle catalysts, e.g., to reach a diffusion length 2(Dt)1/2 ≈ 10 nm, for Fe and Fe3C in the 600− 725 °C temperature
range, one will count the former in microseconds and the latter in seconds. As moreover, recent studies indicate that for Fe catalyst,
C diffusion occurs via a surface or subsurface mechanism33,34 (which usually is a low energy path compared to bulk diffusion33),
whereas for Fe3C, carbon would diffuse in the bulk via a vacancy‐assisted mechanism,4 the difference becomes huge. Thus we infer
that the difference of growth rate between the two catalysts is essentially due to the fact that carbon atoms cross the nanoparticles
of α‐Fe and Fe3C by two different means: fast diffusion of carbon atoms for α‐Fe, and a slow diffusion of the carbon with a
compensating vacancy flux for Fe3C. The fact that the difference in growth rate decreases, when the temperature increases from 650
to 725 °C, is probably due the different activation energies of the two mechanisms (0.8635 and 1.79 eV,37 respectively, for carbon
diffusion in α‐Fe and cementite). Finally, let us also add that the dissociation rate of the carbon‐bearing radicals on the surface of the
catalyst particles might also be more effective on Fe than on Fe3C, due to the faceting of the leading edge of the Fe nanoparticles
(i.e., the side exposed to the growth nutrients). Begtrup and co‐ workers34 have recently demonstrated the catalytic effect of Fe‐
facets in the case of an amorphous feedstock, by both in situ TEM observations and calculations.
4.4. Mechanisms of Growth: Iron.
Next, we focus on the step‐edge sites on the side surfaces of catalysts, which have been ascertained as nucleation centers for CNT
growth by in situ as well as postgrowth TEM observations.38−40 Here, large collections of step edges are generally found at the side
surfaces of the head of Fe catalysts, as indicated by red arrowheads in Figure 2 and the Supporting Information, Figure S7. Some
graphene layers are found to collectively nucleate under these step edges, e.g. a group of 15 graphene layers as shown in the
Supporting Information, Figure S7. We note that large nucleation areas certainly help keeping the carbon concen‐ tration low in the
catalyst nanoparticle, thus preventing the Fe → Fe3C transformation as explained above. Taken altogether, the above observations
suggest that the growth mechanisms of graphene layers on Fe would be similar to what has been observed previously on Ni,7,38 i.e.,
based on the formation of atomic steps on the lateral walls of the nanoparticles, followed by nucleation of graphene layers and
migration of the steps on both sides as graphene extends. Steps accumulate below the leading edge of the Fe particle (resulting in
the characteristic “nail head” shape), because (i) they cannot cross the edges toward the front facets as they would have to
completely reorganize to do that, and (ii) the step diffusion rate on the facets exposed to the growth nutrients is probably slowed‐
down by carbon/defect accumulation there. On the other hand, as already suggested above, step diffusion toward the trailing edge
results in an elongation of the nanoparticle, thus driving the walls of the nanoparticle more and more parallel to the CNF axis and
eventually leading to the growth of nanotubes (see Figure S5e, f in the Supporting Information). The decrease in diameter of the Fe
nanoparticles as the temperature increases is probably the result of a stronger dewetting during the incubation stage of the growth,
which leads to smaller nanoparticles. It is worth noting, however, that the elongation mentioned above should be enhanced by
increasing temperatures as it depends on surface step mobility, which in turn, should also decrease the particle and CNFs’ diameter.
4.5. Mechanisms of Growth: Cementite.
Although Fe3C has already been observed as catalyst for the growth of CNFs/ CNTs,4,5,14−19 few works have focused on its growth
mechanisms.41 Recently, Fe3C was found as catalyst for the base‐growth of CNTs by in situ environmental TEM.4 However, the
mechanism for the tip‐growth of CNTs/CNFs by Fe3C catalysts is still scarcely documented. HREM images in Figure 6 give some clues
for understanding the growth mechanism of CNFs by Fe3C. The discrete inner layers could imply that the graphene layers catalyzed
by Fe3C nucleate simultaneously at multipositions, where steps are available. Note that the discrete inner graphene layers are
always connected to the step edges of Fe3C, which again is similar to what has been observed on nickel using in situ TEM,38 and
confirmed by theoretical calculations.9,38,42 The protrusions on the side walls of the Fe3C catalyst particles could be due to the
accumulation of steps having diffused from both sides in order to let the graphene layer grow (again, mechanisms of refs 7 and 38).
There are two types of atoms (C and Fe) in atomic steps, which imply a collective diffusion process when the steps move. It is in this

process that Fe3C would loose carbon atoms to the graphite. In a vacancy‐ assisted mechanism, this would create carbon vacancies
in the cementite lattice that would have to migrate to the nano‐ particle’s surface where the feeding gas is decomposed.
5. CONCLUSION
We have observed the concomitant growth of CNFs/CNTs from Fe and Fe3C nanoparticles and confirmed that orthorhombic Fe3C
(cementite) can act as a catalyst for the tip‐growth of CNFs/CNTs by PECVD. Furthermore, the different phases of α‐Fe and Fe3C
nanoparticle catalysts can be controllably varied by adjusting the growth temperatures. At low temperatures (600 °C), only Fe3C acts
as a catalyst for the growth of CNFs. However, both α‐Fe and Fe3C (cementite) are active at the higher temperatures of 650 and 725
°C. The growth rates of CNFs/CNTs from Fe and Fe3C nanoparticles are compared under exactly the same growth conditions: the
average length of CNFs grown by Fe is much higher than that of CNFs grown by Fe3C at both 650 and 725 °C. We also find that the
structure of CNFs grown from Fe is markedly different from that of CNFs grown from Fe3C. We have attributed the higher growth
rate from Fe nanoparticles to a much faster diffusion of carbon atoms across those particles. Moreover, only Fe nanoparticles at a
high temperature of 725 °C are found to catalyze the growth of real carbon nanotubes, where the graphene layers are parallel to the
tube axis. According to our observations, the growth mechanisms of CNFs/CNTs from Fe and Fe3C can be explained by graphene
nucleation at step edges, followed by migration of those step edges, similarly to the observations already made on Ni nanoparticles
during the growth of CNFs. However, the steps on the crystallographic planes composing the sidewalls of the Fe3C nanoparticles
include two types of atoms, which slows down their formation and their migration rates compared to Fe. Consequently, the growth
front of iron and cementite particles present different shapes: the former being faceted and the latter rounded.
* Supporting Information
Additional figures, table, and information. This material is available free of charge via the Internet at http://pubs.acs.org.
ACKNOWLEDGMENTS
Z.H. thanks Dr. G. Rizza and P.‐E. Coulon at Laboratoire des Solides Irradies, Ecole Polytechnique, France, for use of the CM 30
microscope. D.P. acknowledges partial support from WCU program, through the NRF of Korea, funded by MEST (R31‐2008‐000‐
10029‐0). This work has been supported by the Region Ile‐de‐France in the framework of C’Nano IdF as well by the ANR project
“Nanoscanner”. C’Nano IdF is the nanoscience competence center of Paris Region, supported by CNRS, CEA, MESR, and Region Ile‐
de‐France.
REFERENCES
(1) Öncel, Ç .; Yürüm, Y. Fullerenes, Nanotubes, Carbon Nanostruct.2006, 14, 17.
(2) Melechko, A. V.; Merkulov, V. I.; McKnight, T. E.; Guillorn, M. A.; Klein, K. L.; Lowndes, D. H.; Simpson, M. L. J. Appl. Phys. 2005,97, 041301.
(3) Meyyappan, M. J. Phys. D: Appl. Phys. 2009, 42, 213001.
(4) Yoshida, H.; Takeda, S.; Uchiyama, T.; Kohno, H.; Homma, Y.Nano Lett. 2008, 8, 2082.
(5) Homma, H.; Kobayashi, Y.; Ogino, T.; Takagi, D.; Ito, R.; Jung,Y. J.; Ajayan, P. M. J. Phys. Chem. B 2003, 107, 12161.
(6) Amara, H.; Bichara, C.; Ducastelle, F. Phys. Rev. B 2006, 73,113404.
(7) Abild‐Pedersen, F.; Norskov, J. K.; Rostrup‐Nielsen, J. R.;Sehested, J.; Helveg, S. Phys. Rev. B 2006, 73, 115419.
(8) Hofmann, S.; Sharma, R.; Ducati, C.; Du, G.; Mattevi, C.; Cepek,C.; Cantoro, M.; Pisana, S.; Parvez, A.; Cervantes‐Sodi, F.; Ferrari, A. C.; Dunin‐
Borkowski, R.; Lizzit, S.; Petaccia, L.; Goldoni, A.; Robertson, J. Nano Lett. 2007, 7, 602.
(9) Amara, H.; Bichara, C.; Ducastelle, F. Phys. Rev. Lett. 2008, 100,056105.
(10) Zhang, X.; Cao, A.; Wei, B.; Li, Y.; Wei, J.; Xu, C.; Wu, D. Chem.Phys. Lett. 2002, 362, 285.
(11) Park, J.‐B.; Choi, G.‐S.; Cho, Y.‐S.; Hong, S.‐Y.; Kim, D.; Choi,S.‐Y.; Lee, J.‐H.; Cho, K.‐I. J. Cryst. Growth 2002, 244, 211. (12) Sengupta, J.; Jacob, C.
J. Cryst. Growth 2009, 311, 4692.
(13) Anisimov, A. S.; Nasibulin, A. G.; Jiang, H.; Launois, P.;Cambedouzou, J.; Shandakov, S. D.; Kauppinen, E. I. Carbon 2010, 48,380.
(14) Ni, L.; Kuroda, K.; Zhou, L.‐P.; Ohta, K.; Matsuishi, K.;Nakamura, J. Carbon 2009, 47, 3054.
(15) Emmenegger, C.; Bonard, J. M.; Mauron, P.; Sudan, P.; Lepora,A.; Grobety, B.; Züttel, A.; Schlapbach, L. Carbon 2003, 41, 539.

(16) Nishimura, K.; Okazaki, N.; Pan, L.; Nakayama, Y. Jpn. J. Appl.Phys. 2004, 43, L471.
(17) Peigney, A.; Coquay, P.; Flahaut, E.; Vandenberghe, R. E.; DeGrave, E.; Laurent, C. J. Phys. Chem. B 2001, 105, 9699.
(18) Oberlin, A.; Endo, M.; Koyama, T. J. Cryst. Growth 1976, 32,335.
(19) Behr, M. J.; Mkhoyan, K. A.; Aydil, E. S. ACS Nano 2010, 4,5087.
(20) Louis, B.; Gulino, G.; Vieira, R.; Amadou, J.; Dintzer, T.;Galvagno, S.; Centi, G.; Ledoux, M. J.; Pham‐Huu, C. Catal. Today2005, 102−103, 23.
(21) de Resende, V. G.; De Grave, E.; Cordier, A.; Weibel, A.;Peigney, A.; Laurent, C. Carbon 2009, 47, 482.
(22) Kim, D.; Lim, S. H.; Guilley, A. J.; Cojocaru, C. S.; Bouree, J. E.;Vila, L.; Ryu, J. H.; Park, K. C.; Jang, J. Thin Solid Films 2008, 516,706.
(23) He, Z. B.; Maurice, J.‐L.; Lee, C. S.; Gohier, A.; Pribat, D.;Legagneux, P.; Cojocaru, C. S. Carbon 2011, 49, 435.
(24) Utsumi, T. IEEE Trans. Electron Devices 1991, 38, 2276.
(25) Hasebe, M.; Ohtani, H.; Nishizawa, T. Metall. Mater. Trans. A1985, 16, 913.
(26) Chipman, J. Metall. Mater. Trans. B 1972, 3, 55.
(27) Le Normand, F.; Švrcek, V.; Senger, A.; Dintzer, T.; Pham‐Huu,C. J. Phys. Chem. C 2009, 113, 14879.
(28) Wang, S.; Zhang, Y.; Abidi, N.; Cabrales, L. Langmuir 2009, 25,11078.
(29) Sharma, R.; Moore, E.; Rez, P.; Treacy, M. M. J. Nano Lett.2009, 9, 689.
(30) Behr, M. J.; Gaulding, E. A.; Mkhoyan, K. A.; Aydil, E. S. J. Appl.Phys. 2010, 108, 053303.
(31) Page, A. J.; Ohta, Y.; Irle, S.; Morokuma, K. Acc. Chem. Res.2010, 43, 1375.
(32) Baker, R. T. K.; Harris, P. S.; Thomas, R. B.; Waite, R. J. J. Catal.1973, 30, 86.
(33) Hofmann, S.; Csanyi, G.; Ferrari, A. C.; Payne, M. C.;Robertson, J. Phys. Rev. Lett. 2005, 95, 036101.
(34) Begtrup, G. E.; Gannett, W.; Meyer, J. C.; Yuzvinsky, T. D.;Ertekin, E.; Grossman, J. C.; Zettl, A. Phys. Rev. B 2009, 79, 205409.
(35) Hafner, J. H.; Bronikowski, M. J.; Azamian, B. R.; Nikolaev, P.; Rinzler, A. G.; Colbert, D. T.; Smith, K. A.; Smalley, R. E. Chem. Phys. Lett. 1998,
296, 195.
(36) Homan, C. G. Acta Metall. 1964, 12, 1071.
(37) Schneider, A.; Inden, G. Calphad 2007, 31, 141−147.
(38) Helveg, S.; Lopez‐Cartes, C.; Sehested, J.; Hansen, P. L.; Clausen, B. S.; Rostrup‐Nielsen, J. R.; Abild‐Pedersen, F.; Norskov, J.K. Nature 2004, 427,
426.
(39) Lin, M.; Tan, J. P. Y.; Boothroyd, C.; Loh, K. P.; Tok, E. S.; Foo, Y. −L. Nano Le . 2007, 7, 2234.
(40) Zhu, H. W.; Suenaga, K.; Hashimoto, A.; Urita, K.; Hata, K.; Iijima, S. Small 2005, 1, 1180.
(41) Schaper, A. K.; Hou, H.; Greiner, A.; Phillipp, F. J. Catal. 2004,222, 250.
(42) Nørskov, J. K.; Bligaard, T.; Logadottir, A.; Bahn, S.; Hansen, L. B.; Bollinger, M.; Bengaard, H.; Hammer, B.; Sljivancanin, Z.;Mavrikakis, M.; Xu,
Y.; Dahl, S.; Jacobsen, C. J. H. J. Catal. 2002,209, 275.