IRIS June 20041. 2 Outline of Talk Relation of surface and subsurface velocity fields Western US...
40
IRIS June 2004 1
-
date post
22-Dec-2015 -
Category
Documents
-
view
213 -
download
0
Transcript of IRIS June 20041. 2 Outline of Talk Relation of surface and subsurface velocity fields Western US...

IRIS June 2004 1
IRIS June 2004 2
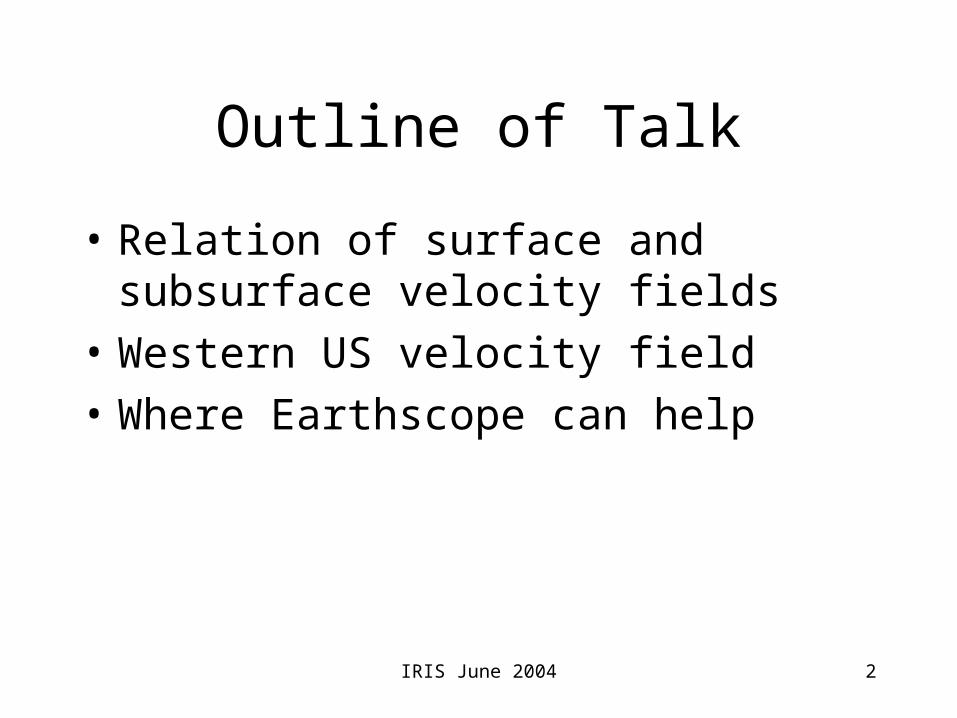
Outline of Talk
• Relation of surface and subsurface velocity fields
• Western US velocity field
• Where Earthscope can help
IRIS June 2004 3
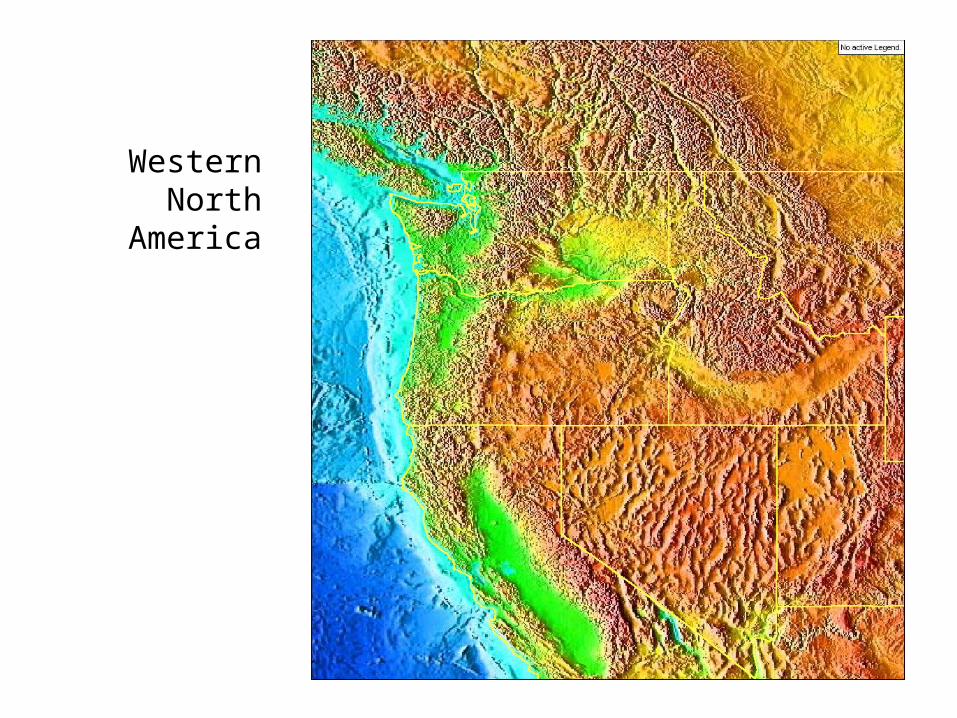
Western North America

IRIS June 2004 4
How to characterize the deformation: Possibilities
• Plate-like Faults penetrate lithosphere as high strain areasShear in mantle lithosphere ‘localized’
• Floating blocks in continuumWeak faults extend only through thin brittle upper layerDistributed shear in mantle/lower crust
• Plates with wide boundariesCombination of above
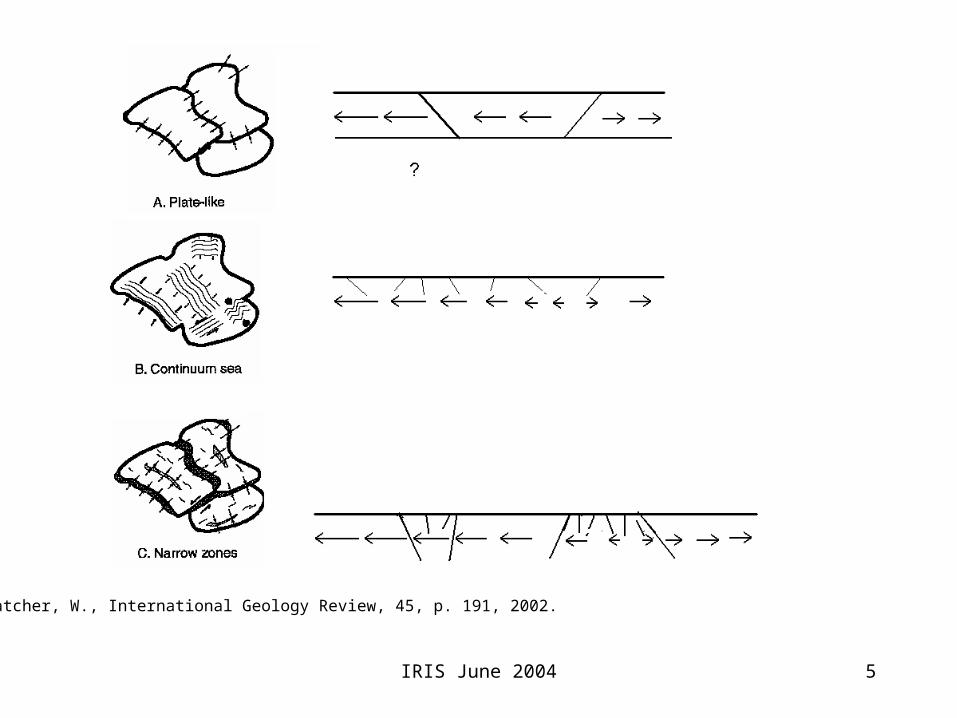
IRIS June 2004 5
Thatcher, W., International Geology Review, 45, p. 191, 2002.

IRIS June 2004 6
Thatcher, W., J. Geophysical Res., March 1995.

IRIS June 2004 7
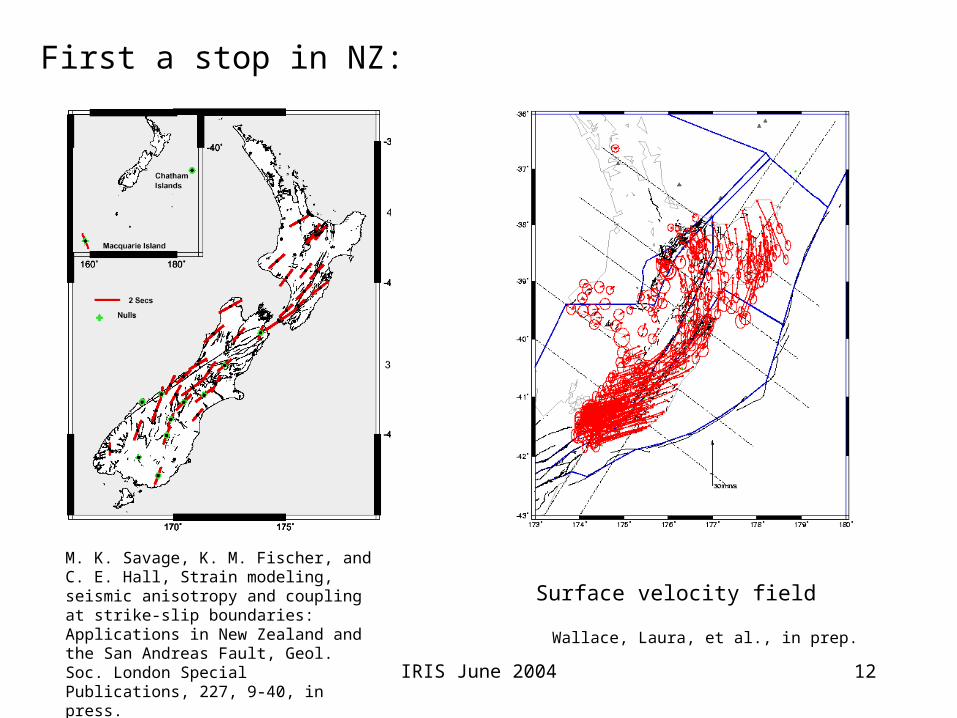
Marlborough region NZ
Bourne et al., 1998
IRIS June 2004 8
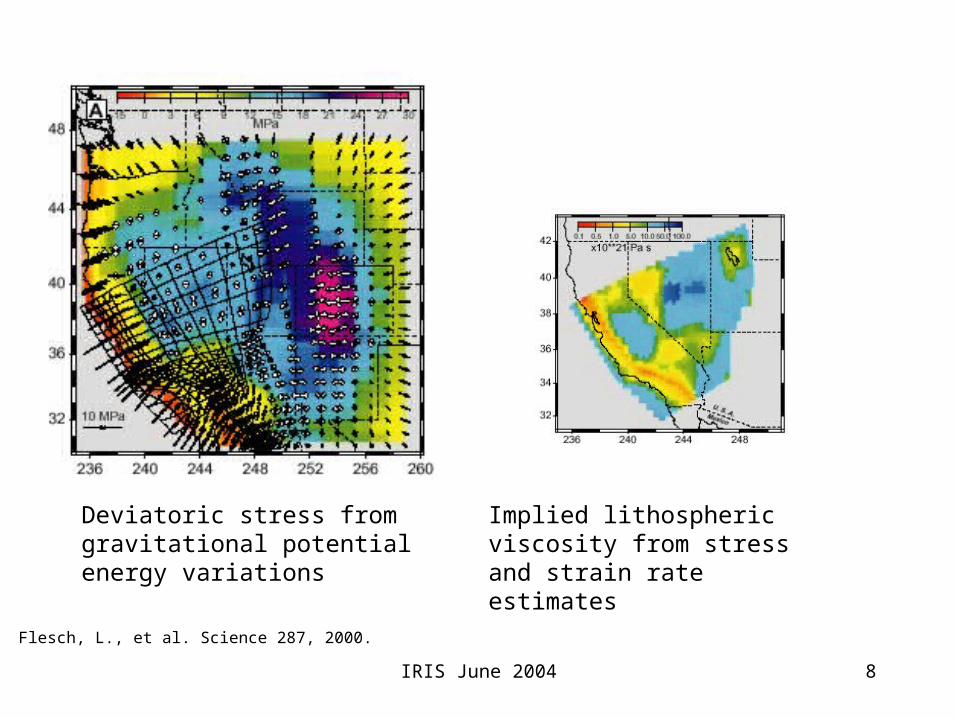
Flesch, L., et al. Science 287, 2000.
Deviatoric stress from gravitational potential energy variations
Implied lithospheric viscosity from stress and strain rate estimates

IRIS June 2004 9
Thatcher, W., International Geology Review, 45, p. 191, 2002.

IRIS June 2004 10
Pollitz, F., Geophys. J. Int. 153, 2003.

IRIS June 2004 11
Let’s examine the plate possibility for western US
Analysis• Use geodetic, geologic, seismologic data to estimate simultaneously
crustal block rotation poles, coupling on block-bounding faults, internal strain rates, and GPS reference frame
• Each GPS velocity solution rotated into reference frame by least-squares fit
• No velocity data excluded due to proximity to faults• 3D coupling distribution on faults parameterized by nodes along fault
contours• Minimize reduced
2 by simulated annealing & downhill simplex
IRIS June 2004 12
M. K. Savage, K. M. Fischer, and C. E. Hall, Strain modeling, seismic anisotropy and coupling at strike-slip boundaries: Applications in New Zealand and the San Andreas Fault, Geol. Soc. London Special Publications, 227, 9-40, in press.
Wallace, Laura, et al., in prep.
Surface velocity field
First a stop in NZ:

IRIS June 2004 13
Rotational and Elastic parts of velocity field
Wallace, Laura, et al., in prep.
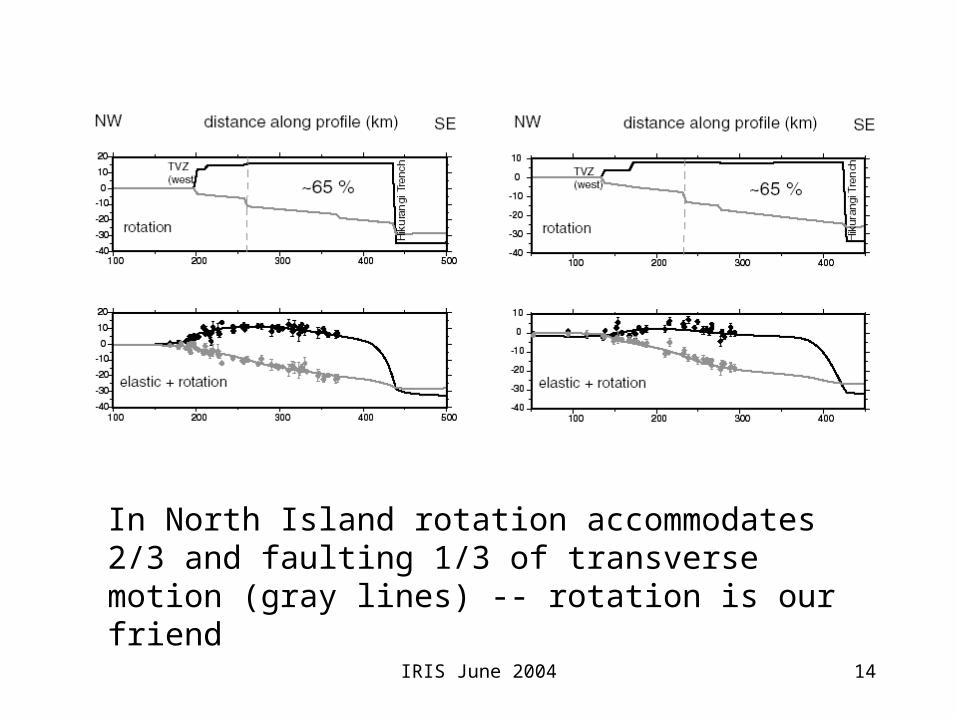
IRIS June 2004 14
In North Island rotation accommodates 2/3 and faulting 1/3 of transverse motion (gray lines) -- rotation is our friend

IRIS June 2004 15
Region is divided into ‘blocks’, contiguous areas that are thought to rotate.
Each block rotates about a pole.
The rotating blocks are separated by dipping faults.
Velocities due to fault locking are added to rotations to get full
velocity field.
The relative long-term slip vectors on the faults
are determined from rotation poles.
Back-slip is applied at each fault to get surface
velocities due to locking.

IRIS June 2004 16
The strain rate tensor near a locked fault represents a spatial transition from the velocity of one block to the velocity of the other. In other words, a locked fault allows one block to communicate information about its motion into an adjacent block.
Program described at www.rpi.edu/~mccafr/defnode/defnode.html

IRIS June 2004 17
DataGPS velocities
• PNW1, our PNW solution• SCEC CDM3, Southern California • WUSC version 2, Western US (Bennett
et al.)• Northern California (Freymueller et al.,
1999) • BARD (Murray and Segall, 2001)• Sierra Nevada (Dixon et al., 2000)• ECSZ (McCluskey et al. 2001, Gan et
al. 2001)• Basin and Range (Thatcher et al. 1999)• Baja (Dixon et al. 2002)• Pacific –North America (Beavan et al.
2002)
Slip vectors • Harvard CMT, NUVEL-1, C. DeMets, Jackson & Molnar (1990)
Transform azimuths• C. DeMets
Slip rates• NUVEL-1, C. DeMets, several compilations
Fault outline data• Jennings
IRIS June 2004 18
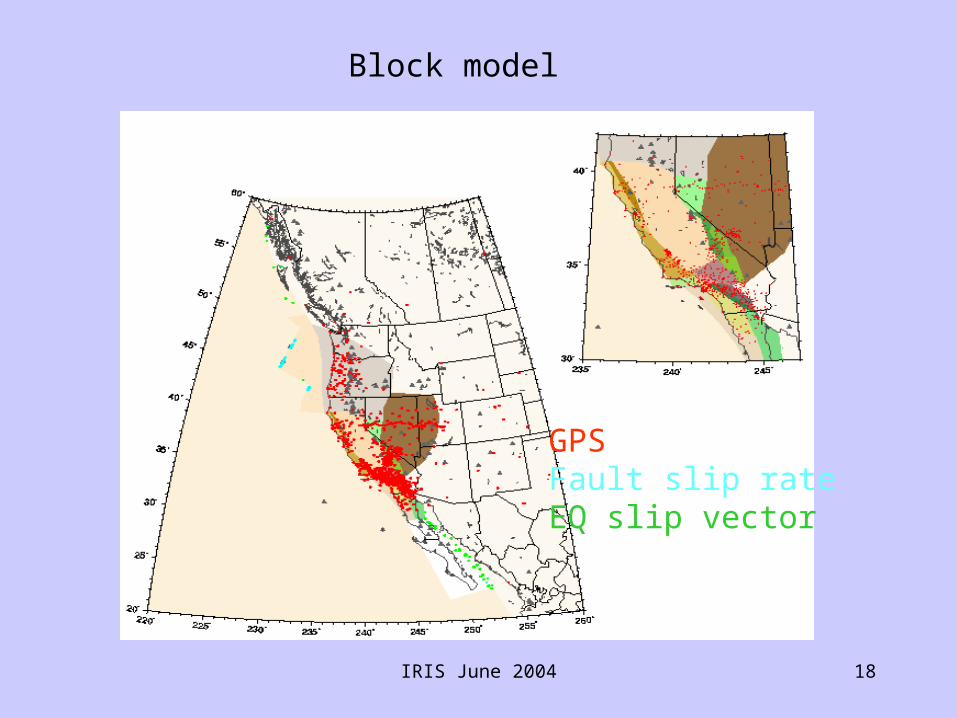
Block model
GPS Fault slip rateEQ slip vector

IRIS June 2004 19
North America reference frame is estimated by minimizing 248 GPS velocities (Nrms=1.1, Wrms=1.0mm/yr).
Pacific angular velocity from 5 spreading rates, 73 eq slip vectors (Nrms = 1.2), and 56 GPS velocities (Nrms = 1.2, Wrms=1.0mm/yr).
Juan de Fuca Euler vector from 28 PAC-JdF spreading rates, 1 transform azimuth (Blanco FZ; res = 1º).

IRIS June 2004 20
Slip vectorsObservedCalculated
Block boundaries placed alongmajor fault systems.
IRIS June 2004 21
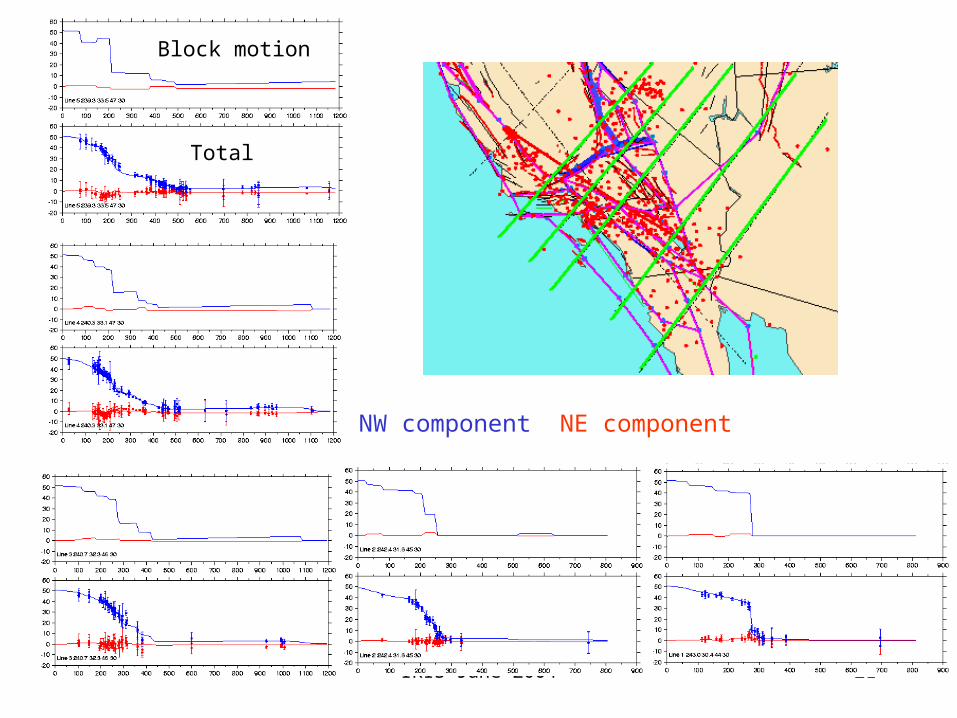
Block motion
Total
NW component NE component

IRIS June 2004 22
Rotational component
N component E component

IRIS June 2004 23
GPS residuals with 70% confidence ellipses
IRIS June 2004 24
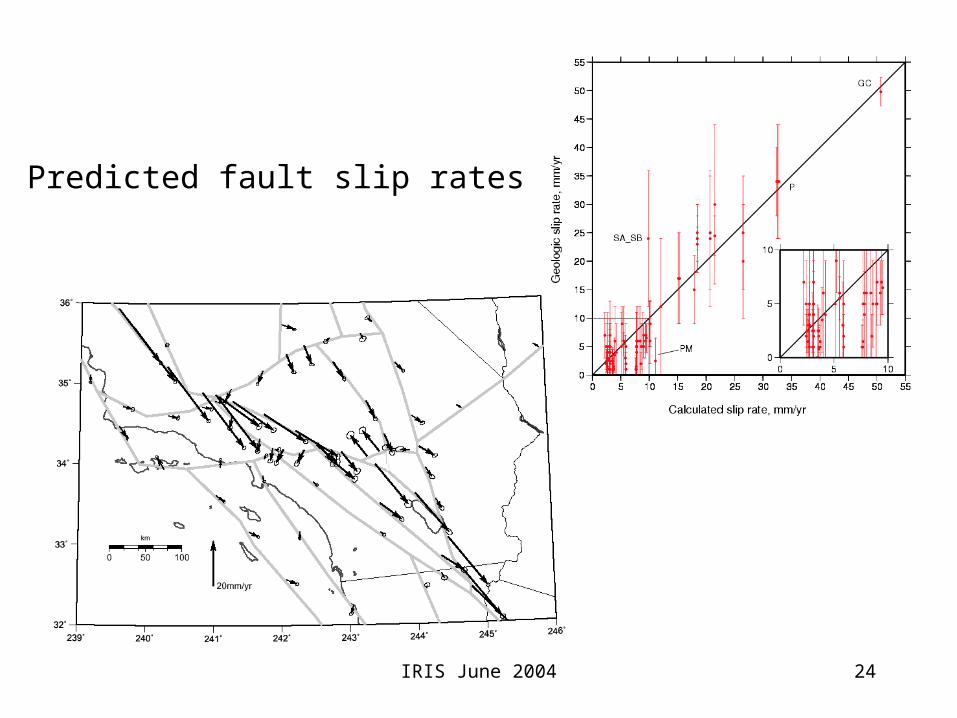
Predicted fault slip rates

IRIS June 2004 25
Lamb, S., Earth Planet. Sci. Lett. 84, p. 75, 1987.
Block rotations
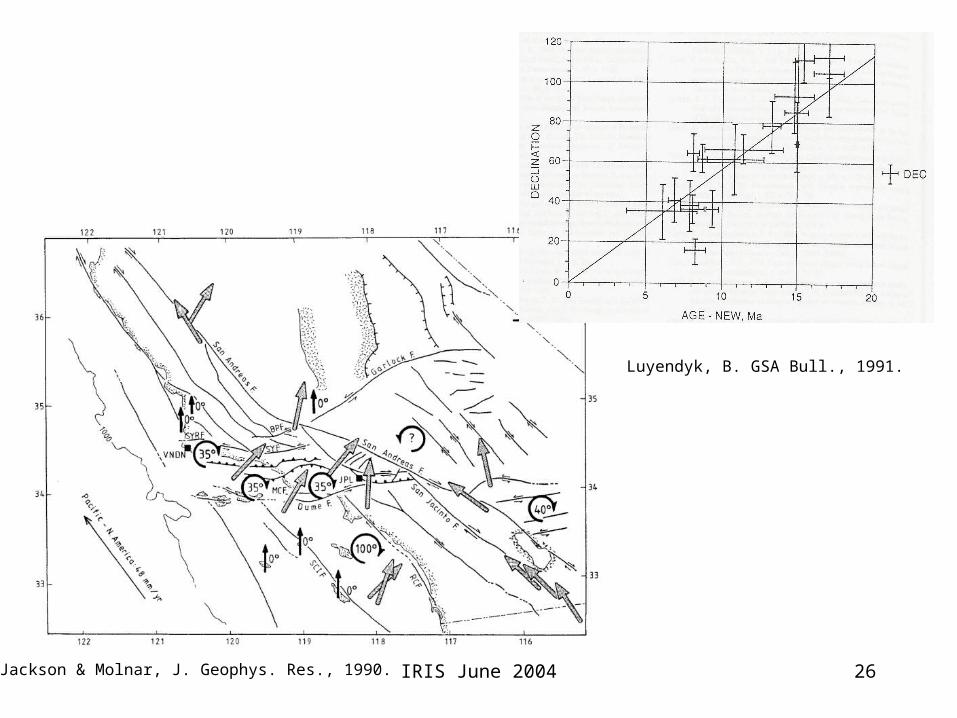
IRIS June 2004 26Jackson & Molnar, J. Geophys. Res., 1990.
Luyendyk, B. GSA Bull., 1991.
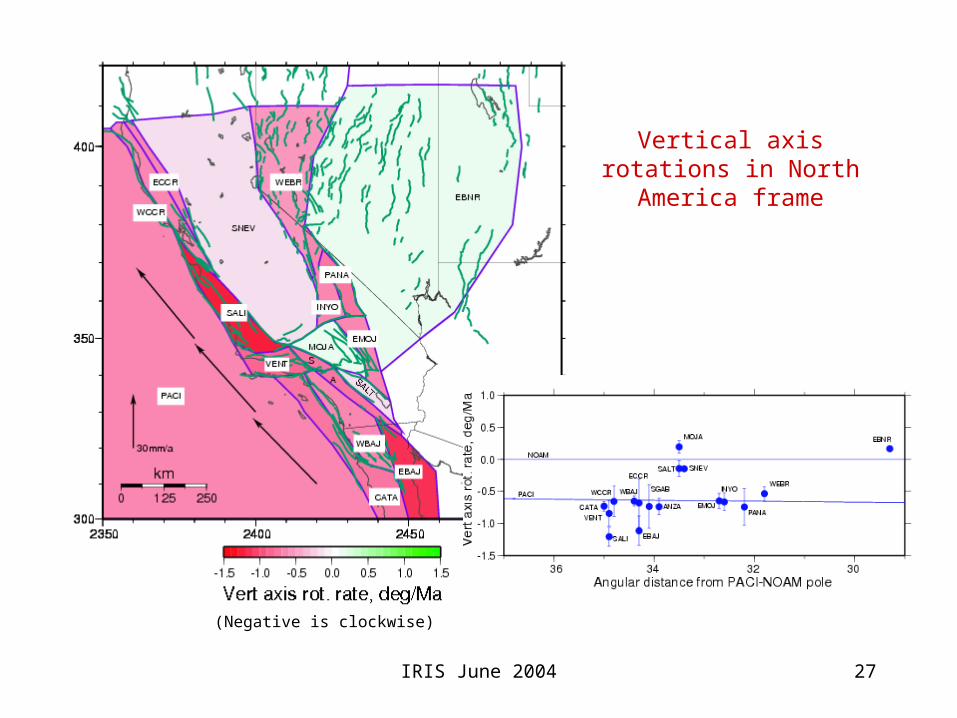
IRIS June 2004 27
Vertical axis rotations in North America frame
(Negative is clockwise)

IRIS June 2004 28
GPS residuals in Transverse Ranges don’t indicate rapid rotations (presently)
IRIS June 2004 29
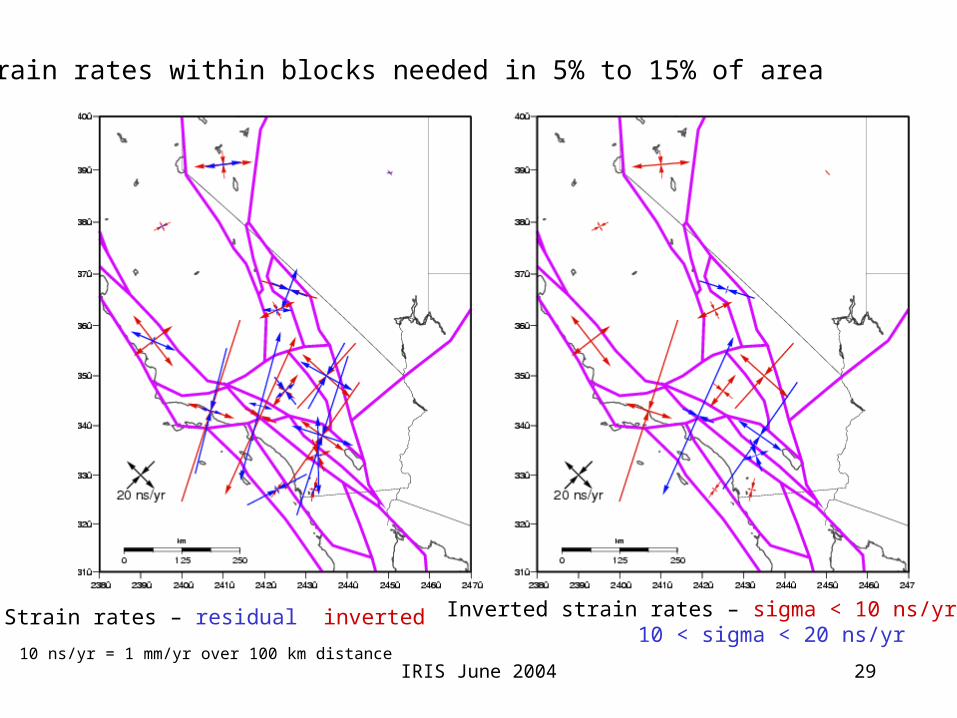
Strain rates – residual inverted Inverted strain rates – sigma < 10 ns/yr10 < sigma < 20 ns/yr
10 ns/yr = 1 mm/yr over 100 km distance
Strain rates within blocks needed in 5% to 15% of area
IRIS June 2004 30
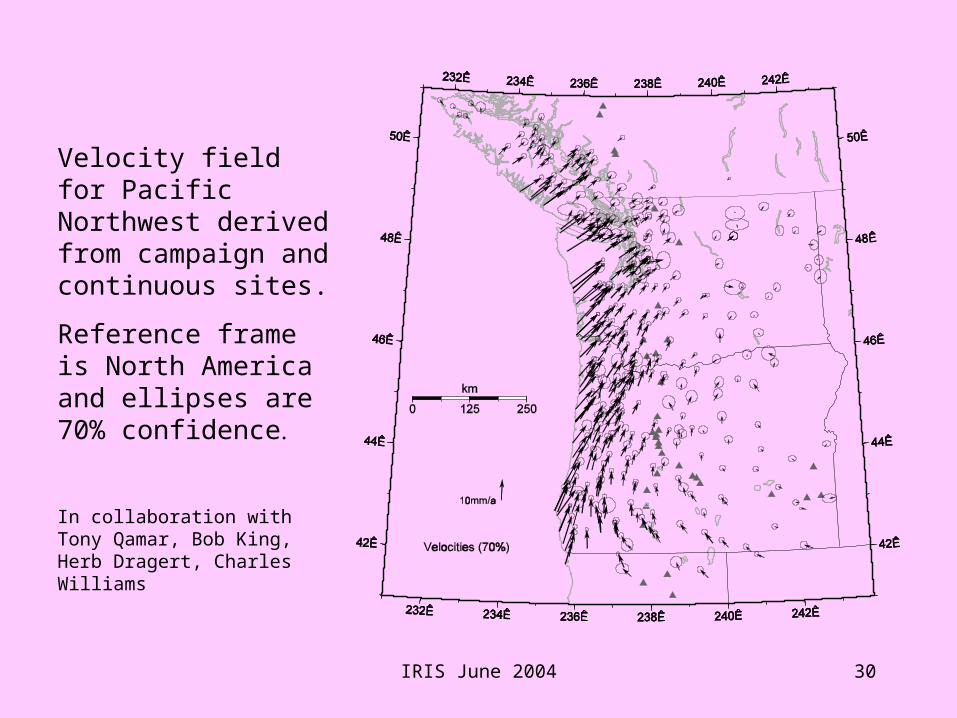
Velocity field for Pacific Northwest derived from campaign and continuous sites.
Reference frame is North America and ellipses are 70% confidence
In collaboration with Tony Qamar, Bob King, Herb Dragert, Charles Williams

IRIS June 2004 31
42.5N
44.5N
46N47.2N
Distance from deformation front, km
East profiles of East component
W E
mm
/a
East profiles of North component
Distance from deformation front, km
42.5N
44.5N
46N
47.2N
mm
/a
42.5N
44.5N
46N
47.2N

IRIS June 2004 32
IRIS June 2004 33
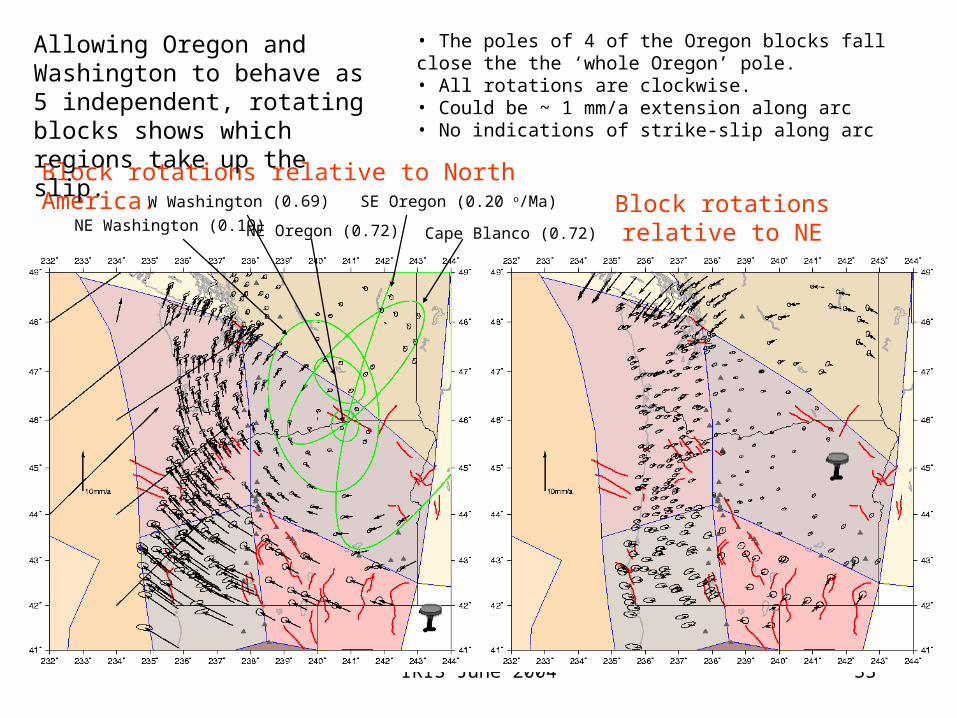
Block rotations relative to North America.Block rotations relative to
NE Oregon.Cape Blanco (0.72)
SE Oregon (0.20 o/Ma)
NE Oregon (0.72)
W Washington (0.69)
NE Washington (0.19)
Allowing Oregon and Washington to behave as 5 independent, rotating blocks shows which regions take up the slip.
• The poles of 4 of the Oregon blocks fall close the the ‘whole Oregon’ pole. • All rotations are clockwise.• Could be ~ 1 mm/a extension along arc• No indications of strike-slip along arc
IRIS June 2004 34
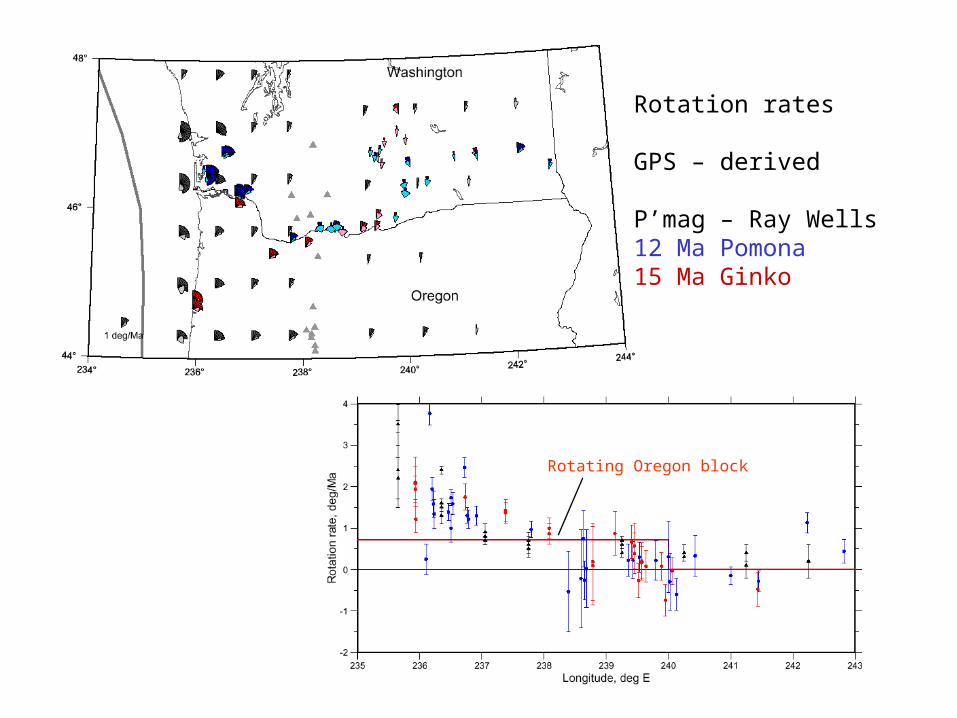
Rotation rates
GPS – derived
P’mag – Ray Wells12 Ma Pomona15 Ma Ginko
Rotating Oregon block
IRIS June 2004 35
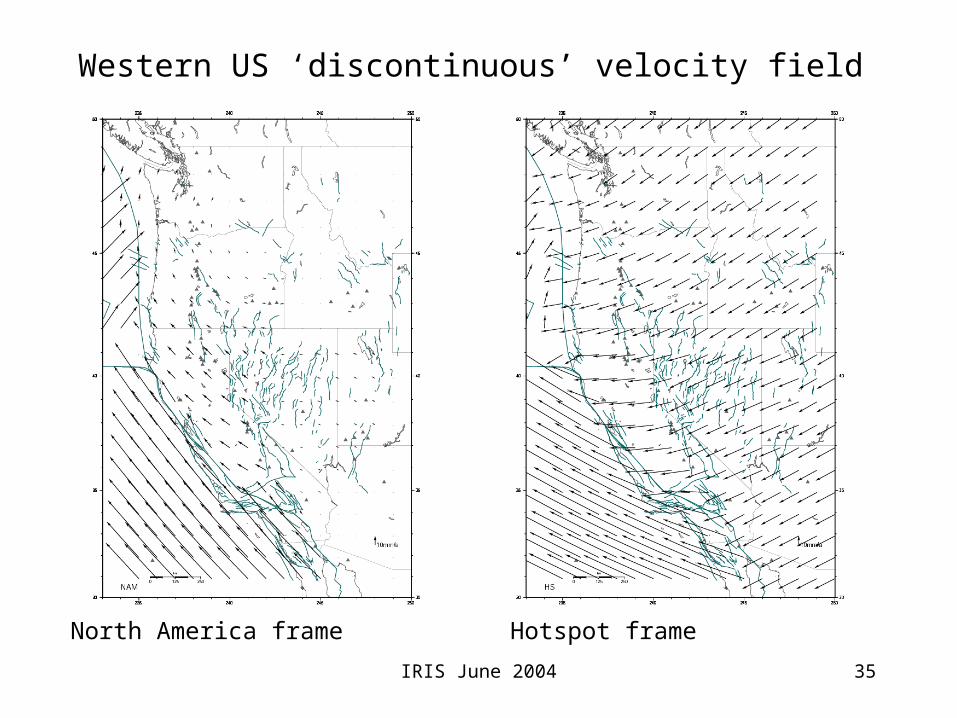
North America frame Hotspot frame
Western US ‘discontinuous’ velocity field

IRIS June 2004 36
Summary of shear-wave splitting measurements in California and Nevada. From M. K. Savage, K. M. Fischer, and C. E. Hall, Geol. Soc. London Special Publications, 227, 9-40, in press.
Splitting observations on map of shear wave velocities at 150 km depth. (Silver, P., and W. Holt, Science 295, 2002)
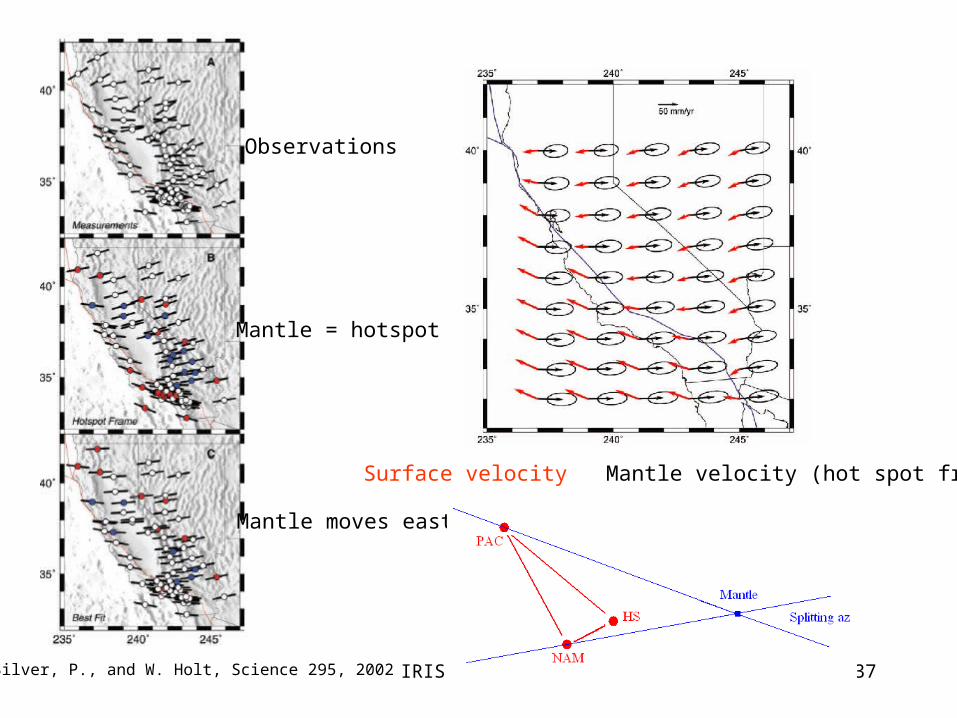
IRIS June 2004 37Silver, P., and W. Holt, Science 295, 2002
Surface velocity Mantle velocity (hot spot frame)
Observations
Mantle = hotspot
Mantle moves east

IRIS June 2004 38
Straining block inversion
Rigid block inversion
Steady-state, discontinuous, hot-spot frame velocity field

IRIS June 2004 39
Thoughts:
• ‘Block’ representation appears to work for about 85 to 95% of western US at the mm/yr (2%) level
• PBO will provide improved surface velocity distributions
• USArray can provide length-scales of strain variations in mantle
• USArray can provide length-scales of mantle wavespeed variations (viscosity) in mantle
IRIS June 2004 40
THE END