IRC1L IRC1R cnt1 IRC1R::ura4 B - Genes &...
12
A B geneX!::kanMX6 IRC1R::ura4 + -natMX6 ade6-swi6 + -hphMX6 X . . . Mating and sporulation geneX!::kanMX6 IRC1R::ura4 + -natMX6 ade6-swi6 + -hphMX6 FOA Figure S1: Screen of the fission yeast deletion library for mutants that result in heterochromatin spreading outside boundaries. (A) A schematic diagram of the query strain. A natMX6 cassette was inserted at the right side of IRC1R::ura4 + , conferring resistance to nourseothricin. The strain also contains ade6-swi6 + with an adjacent hphMX6 cassette, conferring resistance to hygromycin. (B) Workflow to introduce IRC1R::ura4 + and ade6-swi6 + into the fission yeast deletion library (Bioneer). The deletion library was constructed with a kanMX4 cassette, which confers resistance to geneticin. Query strains were mated with the deletion library with the aid of the Singer RoToR HDA pinning robot, and resulting haploid cells with desired genotypes were selected and pinned to FOA medium to measure cell growth. cnt1 imr1L imr1R otr1L otr1R IRC1R::ura4 + IRC1L IRC1R natMX6 Selection with geneticin, nourseothricin, and hygromycin Wang_FigS1
Transcript of IRC1L IRC1R cnt1 IRC1R::ura4 B - Genes &...

A!
B!
geneX!::kanMX6 IRC1R::ura4+-natMX6 ade6-swi6+-hphMX6
X
. . . Mating and sporulation
geneX!::kanMX6 IRC1R::ura4+-natMX6 ade6-swi6+-hphMX6
FOA
Figure S1: Screen of the fission yeast deletion library for mutants that result in heterochromatin spreading outside boundaries. (A) A schematic diagram of the query strain. A natMX6 cassette was inserted at the right side of IRC1R::ura4+, conferring resistance to nourseothricin. The strain also contains ade6-swi6+ with an adjacent hphMX6 cassette, conferring resistance to hygromycin. (B) Workflow to introduce IRC1R::ura4+ and ade6-swi6+ into the fission yeast deletion library (Bioneer). The deletion library was constructed with a kanMX4 cassette, which confers resistance to geneticin. Query strains were mated with the deletion library with the aid of the Singer RoToR HDA pinning robot, and resulting haploid cells with desired genotypes were selected and pinned to FOA medium to measure cell growth.
cnt1
imr1L imr1R otr1L otr1R
IRC1R::ura4+
IRC1L IRC1R
natMX6
Selection with geneticin, nourseothricin, and hygromycin
Wang_FigS1
Wang_FigS2
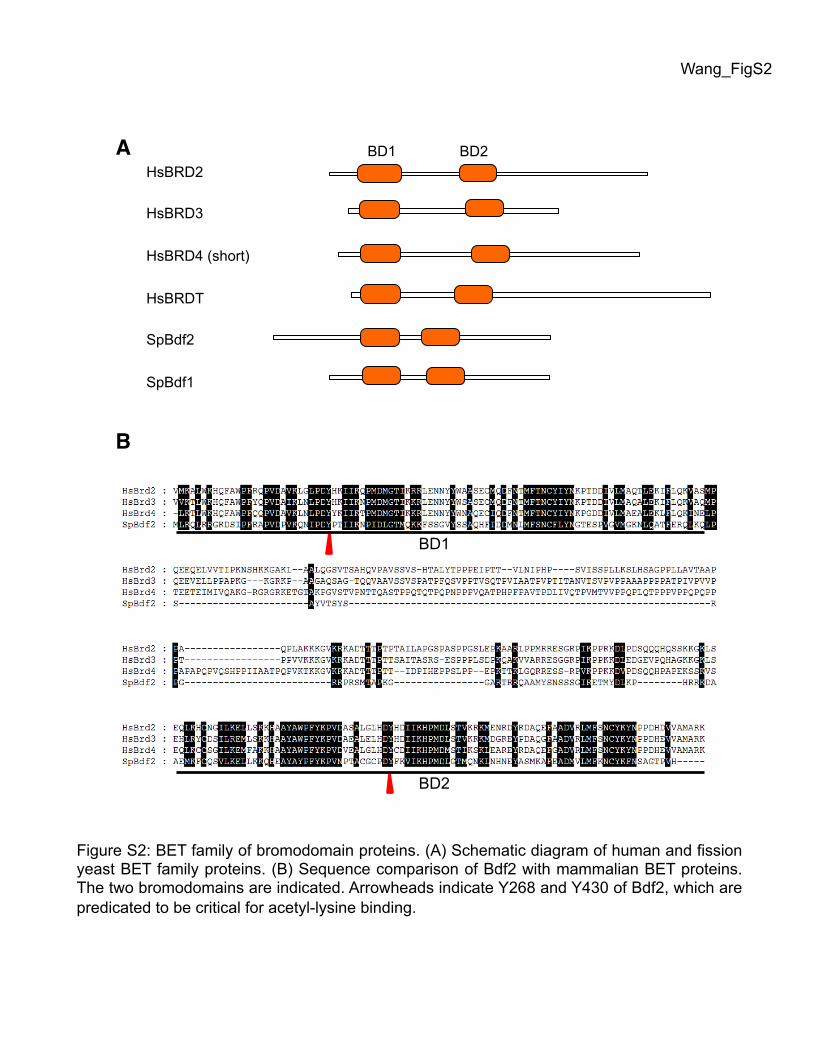
Figure S2: BET family of bromodomain proteins. (A) Schematic diagram of human and fission yeast BET family proteins. (B) Sequence comparison of Bdf2 with mammalian BET proteins. The two bromodomains are indicated. Arrowheads indicate Y268 and Y430 of Bdf2, which are predicated to be critical for acetyl-lysine binding.
BD1 BD2 HsBRD2 HsBRD3 HsBRD4 (short) HsBRDT SpBdf2 SpBdf1
A!
B!
BD1
BD2
Wang_FigS3
H3
leve
ls a
t ura
4+
H3
leve
ls a
t ura
4+
0
5
10
15
20
0
2
4
6
0
5
10
15
20
H4
leve
ls a
t ura
4+
A! B! C!
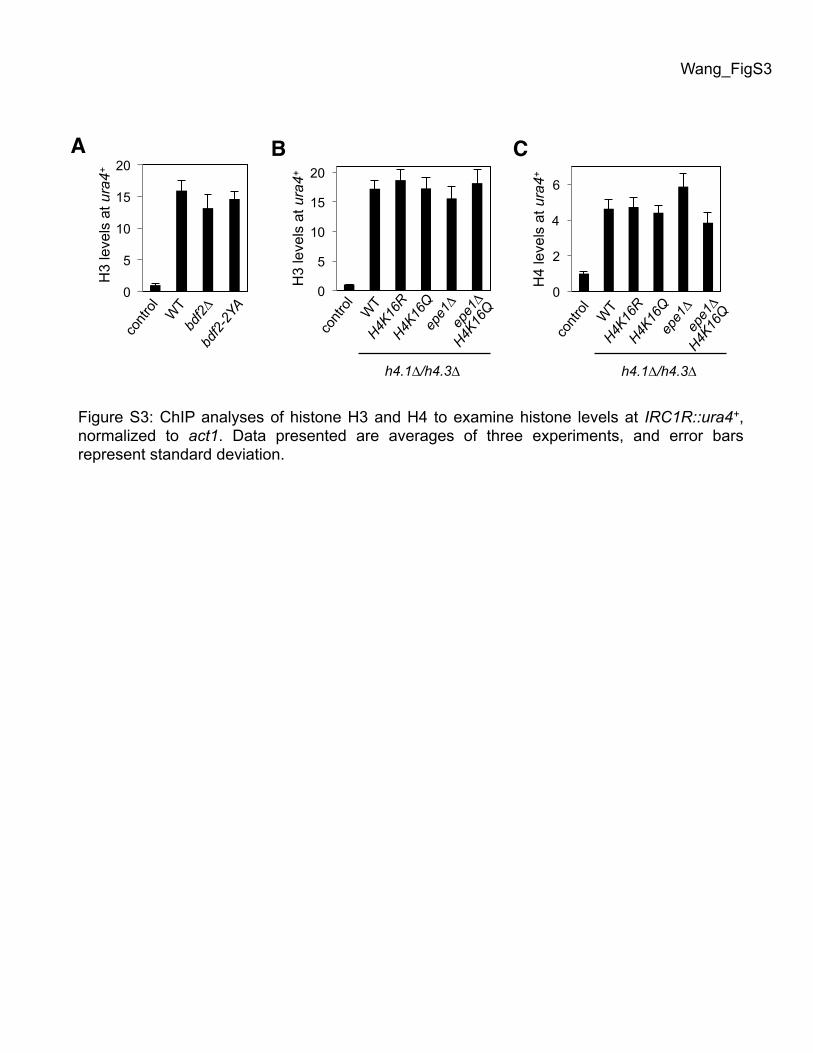
Figure S3: ChIP analyses of histone H3 and H4 to examine histone levels at IRC1R::ura4+, normalized to act1. Data presented are averages of three experiments, and error bars represent standard deviation.
h4.1!/h4.3! h4.1!/h4.3!

mat2 mat3 IRL IRR cenH
IRR::ura4+
control FOA
WT bdf2!
IRR::ura4+
0
1
2
3
4
Bdf
2 le
vels
at I
R
Control Bdf2-Flag
Figure S4: Bdf2 is required for heterochromatin boundary formation at the silent mating-type region. (A) Schematic diagram of silent mating-type region. Shaded area indicates heterochromatin, which is enriched for H3K9me and Swi6. Black arrows indicate inverted repeats (IRs) that serve as heterochromatin boundaries. The IRR::ura4+ was inserted 118 bp to the right of IRR (Singh and Klar, 2008). (B) Serial dilution analyses were performed to measure heterochromatin spreading at IRR::ura4+ . (C) ChIP analysis of Bdf2 levels at IR. The values are averages of three experiments, and error bars represent standard deviation.
A!
B!
C!
Wang_FigS4
Wang_FigS5
control FOA IRC1R::ura4+
WT bdf2!
Bdf2-Flag
A
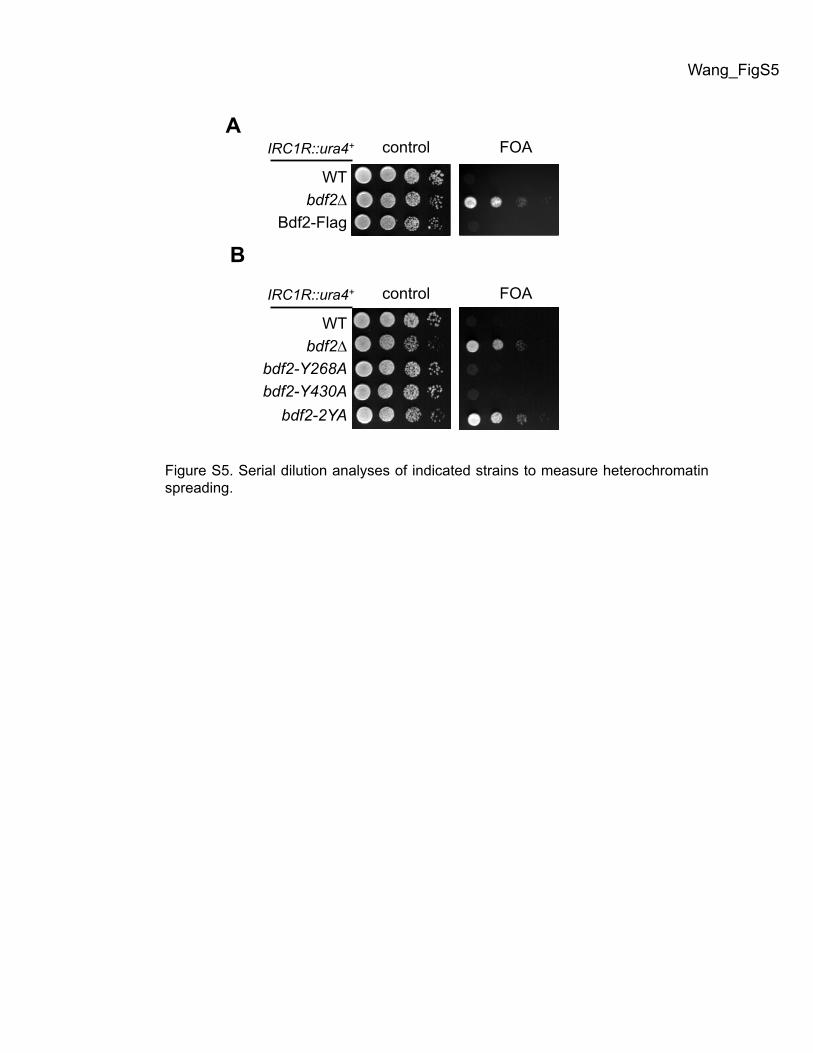
Figure S5. Serial dilution analyses of indicated strains to measure heterochromatin spreading.
control FOA IRC1R::ura4+
WT bdf2!
bdf2-Y268A bdf2-Y430A
bdf2-2YA
B
0
2
4
6
8
control WT epe1!
Bdf
2 le
vels
at o
ca8p
Bdf2-Flag
Bdf
2-Fl
ag le
vels
0
1
2
3
4
5
6
885 887 889 891
tim23 oca8 ubp1 mrpl31
B
0%
10%
20%
30%
40%
50%
60%
70%
promoter ORF Integenic
genomewide
Bof1 enriched
A
kb
C
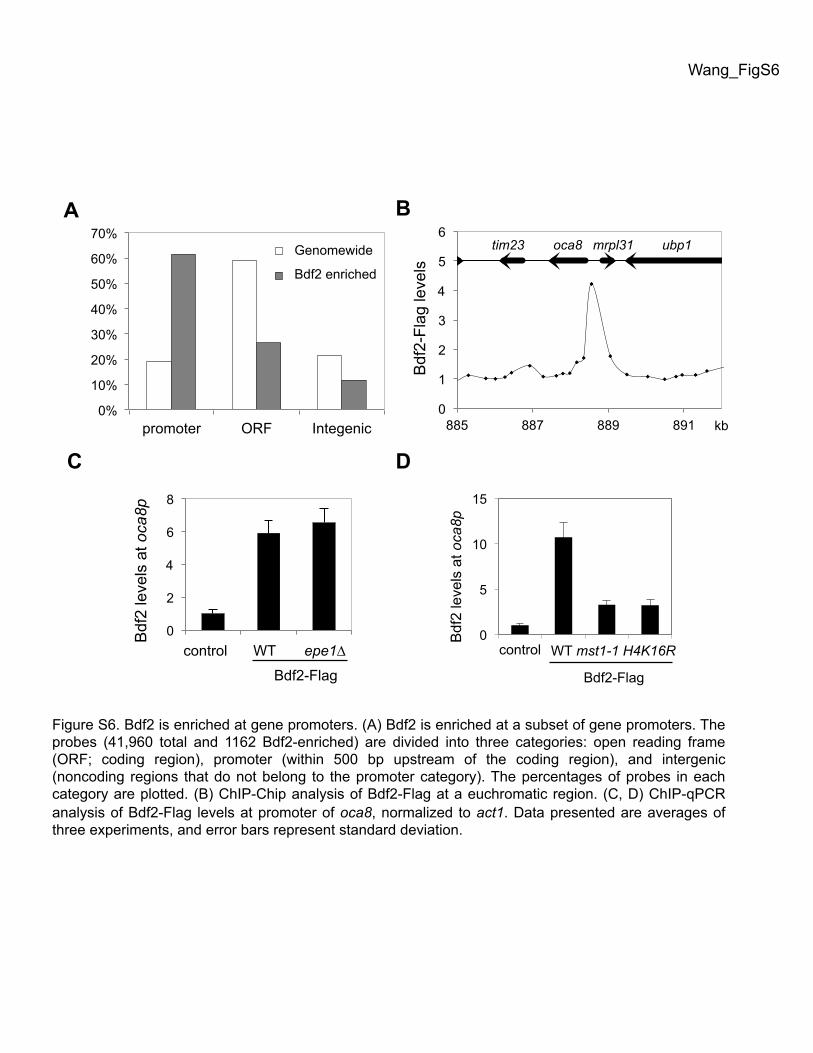
Figure S6. Bdf2 is enriched at gene promoters. (A) Bdf2 is enriched at a subset of gene promoters. The probes (41,960 total and 1162 Bdf2-enriched) are divided into three categories: open reading frame (ORF; coding region), promoter (within 500 bp upstream of the coding region), and intergenic (noncoding regions that do not belong to the promoter category). The percentages of probes in each category are plotted. (B) ChIP-Chip analysis of Bdf2-Flag at a euchromatic region. (C, D) ChIP-qPCR analysis of Bdf2-Flag levels at promoter of oca8, normalized to act1. Data presented are averages of three experiments, and error bars represent standard deviation.
Wang_FigS6
0
5
10
15
Bdf
2 le
vels
at o
ca8p
control WT mst1-1 H4K16R
Bdf2-Flag
D
Genomewide
Bdf2 enriched
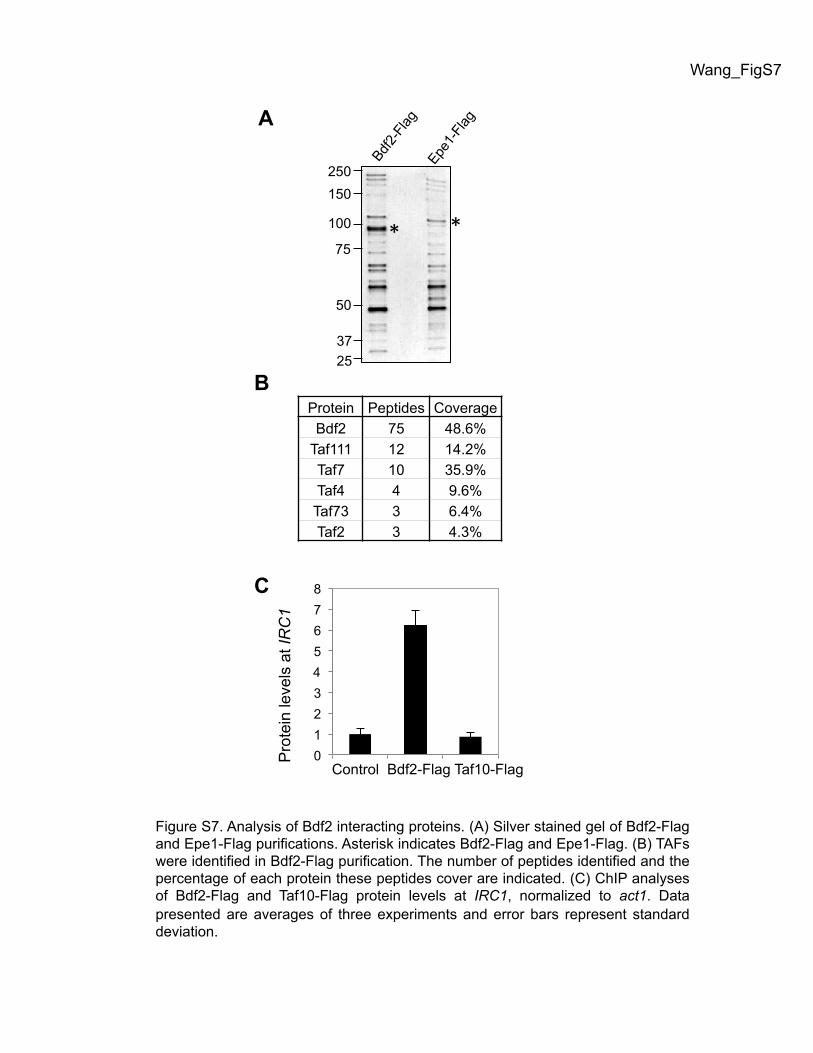
Figure S7. Analysis of Bdf2 interacting proteins. (A) Silver stained gel of Bdf2-Flag and Epe1-Flag purifications. Asterisk indicates Bdf2-Flag and Epe1-Flag. (B) TAFs were identified in Bdf2-Flag purification. The number of peptides identified and the percentage of each protein these peptides cover are indicated. (C) ChIP analyses of Bdf2-Flag and Taf10-Flag protein levels at IRC1, normalized to act1. Data presented are averages of three experiments and error bars represent standard deviation.
Wang_FigS7
250 150
100
75
50
37 25
A
B Protein Peptides Coverage
Bdf2 75 48.6% Taf111 12 14.2% Taf7 10 35.9% Taf4 4 9.6%
Taf73 3 6.4% Taf2 3 4.3%
Pro
tein
leve
ls a
t IR
C1
C
!" !"
0 1 2 3 4 5 6 7 8
Control Bdf2-Flag Taf10-Flag
control WT epe1! swi6! Bdf2-Flag Epe1-Flag
control WT bdf2!
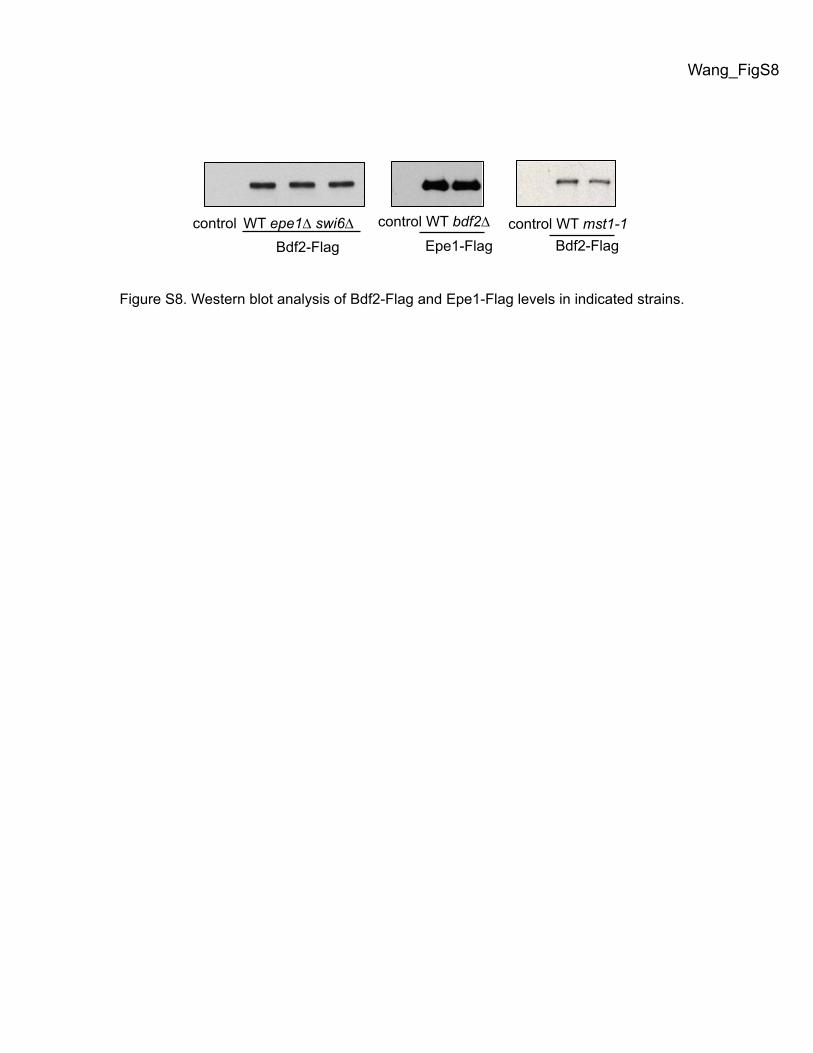
Figure S8. Western blot analysis of Bdf2-Flag and Epe1-Flag levels in indicated strains.
Bdf2-Flag control WT mst1-1
Wang_FigS8

unmodified H4(1-19) & (11-30)
singly ac- H4 only
double ac- H4 only
triple ac- H4 only
tetra ac- H4 only
ac- H4 with other modifications
1 2 3 4 5 6 7 8 9 10 11 12 13 14 15 16 17 18 19 20 21 22 23 24
A
B
C
D
E
F
G
H
I
J
K
L
M
N
O
P
H3
H4 (1-19)
H4 (11-30)
H2A & H2B
0 1 2 3 4 5 6 7 8
H4
K20
ac
H4
K8a
c
H4
K12
ac
H4
K5a
c
H4
K16
ac
H2B
K5a
c
H2A
K9a
c
H2A
K5a
c
H2A
K13
ac
H2B
K12
ac
H2B
K15
ac
H3
K14
ac
H3
K18
ac
H3
K9a
c
H3
K4a
c
H3
K27
ac S
peci
ficity
Fac
tor
B
A
Figure S9. The bromodomains of Bdf2 preferentially bind to multiply-acetylated histone H4 tail peptides. (A) The binding of GST-Bdf2-BD to a modified histone tail peptide array. Each spot contains a peptide with a different combination of modifications (See Table S2). The binding of Bdf2 to H4 (1-19) peptide is acetylation-dependent, and higher affinity is achieved with multiply-acetylated peptides. Bdf2 also showed high background binding to unmodified H4 (11-30) peptide and its derivatives (array position M18 to O11). (B) The contribution of each acetylation event to Bdf2-histone interactions. Specificity factor is defined as the ratio of the average intensity of all spots containing a particular modification divided by the average intensity of all spots not containing the modification.
Wang_FigS9

Figure S11. Bdf2 functions in protecting H4K16ac in heterochromatin boundary formation. Ten-fold serial dilution analyses of indicated yeast strains to measure the spreading of heterochromatin into the IRC1R::ura4+ reporter. All strains used are in an h4.1!/h4.3! background.
IRC1R::ura4+ control FOA
WT epe1!
h4.1/h4.3! epe1! h4.1/h4.3!
Figure S10. Reducing histone dosage attenuates heterochromatin spreading. (A) Western blot analyses of histone H4 levels. (B) Ten-fold serial dilution analyses of indicated yeast strains to measure the spreading of heterochromatin into the IRC1R::ura4+ reporter.
Wang_Fig10
Wang_FigS11
WT H4.2 !-H4
Ponceau S
A B
WT H4K16Q
epe1! H4K16Q epe1!
h4.1!/
h4.3!
IRC1R::ura4+
WT H4K16Q
bdf2! bdf2! H4K16Q
control FOA
WT H4K16R
bdf2! bdf2! H4K16R

otr::ura4+
WT bdf2!
WT bdf2!
control FOA
pREP41
pREP41-Epe1
Figure S13. Epe1 negatively regulates heterochromatin assembly independently of Bdf2. Serial dilution analysis of indicated strains to measure the expression of otr::ura4+. Epe1 was supplied on a pREP41 plasmid, and cells were grown on medium without thiamine to induce expression of the nmt1 promoter.
Figure S12. ChIP analysis of Epe1-Flag and Bdf2-Flag at pericentric dh repeats, normalized to act1. Data presented are averages of three experiments, and error bars represent standard deviation.
0
5
10
15
20
25
30
control WT ddb1! Epe1-Flag
WT ddb1! Bdf2-Flag
Flag
pro
tein
leve
ls a
t dh
Wang_FigS12
Wang_FigS13
control FOA IRC3L::ura4+
WT bdf2! bdf1!
IRC1R::ura4+
WT bdf2! bdf1!
control FOA
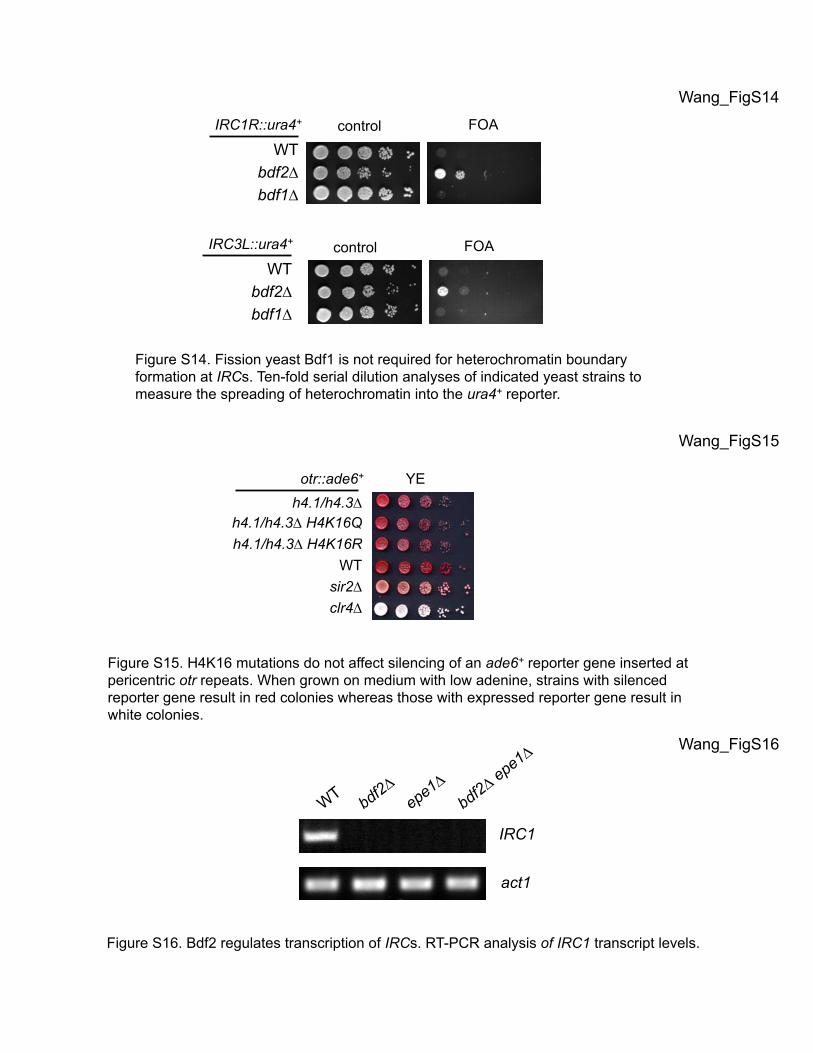
Figure S14. Fission yeast Bdf1 is not required for heterochromatin boundary formation at IRCs. Ten-fold serial dilution analyses of indicated yeast strains to measure the spreading of heterochromatin into the ura4+ reporter.
h4.1/h4.3! h4.1/h4.3! H4K16Q h4.1/h4.3! H4K16R
WT sir2! clr4!
otr::ade6+ YE
Figure S15. H4K16 mutations do not affect silencing of an ade6+ reporter gene inserted at pericentric otr repeats. When grown on medium with low adenine, strains with silenced reporter gene result in red colonies whereas those with expressed reporter gene result in white colonies.
Wang_FigS14
Wang_FigS15
act1
IRC1
Figure S16. Bdf2 regulates transcription of IRCs. RT-PCR analysis of IRC1 transcript levels.
Wang_FigS16