
IRAQI JOURNAL OF MEDICAL SCIENCES
159
Volume 7 (2) 2009 ISSN 1681-6579 IRAQI JOURNAL OF MEDICAL SCIENCES CHAIRMAN OF THE EDITORIAL BOARD Professor Faiza Aftan Zghair Msc, FIC. Path Deputy Editor Professor Nidhal Abdul-Muhymen PhD EXECUTIVE EDITORIAL BOARD Journal Secretary Esraa' S. NAJI Technical Editor Aliaa' N. Hatam Enas T. Abdul-Karim DCH, PhD Asst. Professor Editor Hala S. Aref CABP Asst. Professor Editor Hasan A. AL-Hamadani FICMS Asst. Professor Editor Hussam A. Ahmed FRCS Asst. Professor Editor Samir M. Jasim PHD Asst. Professor Editor
Transcript of IRAQI JOURNAL OF MEDICAL SCIENCES

Volume 7 (2) 2009 ISSN 1681-6579
IRAQI JOURNAL
OF MEDICAL SCIENCES
CHAIRMAN OF THE EDITORIAL BOARD
Professor Faiza Aftan Zghair Msc, FIC. Path
Deputy Editor
Professor Nidhal Abdul-Muhymen PhD
EXECUTIVE EDITORIAL BOARD
Journal Secretary Esraa' S. NAJI
Technical Editor
Aliaa' N. Hatam
Enas T. Abdul-Karim DCH, PhD Asst. Professor Editor Hala S. Aref CABP Asst. Professor Editor Hasan A. AL-Hamadani FICMS Asst. Professor Editor Hussam A. Ahmed FRCS Asst. Professor Editor Samir M. Jasim PHD Asst. Professor Editor

Iraqi Journal of Medical Sciences
All articles published represent the opinions of the authors and do not reflect the
policy of Iraqi Journal of Medical Sciences. All rights are reserved to
Iraqi Journal of Medical Sciences. No part of the journal may be
reproduced or transmitted in any form or by any means, electronic or mechanical,
including photocopying, recording, or via any storage or retrieval system, without
written permission from the journal.
All correspondence and subscription information requests should be addressed to:
The Editor of Iraqi Journal of Medical Sciences
P. O. Box 14222, Baghdad, Iraq.
College of Medicine
Baghdad, Iraq
Tel and Fax: 964-1-5224368
E-mail: [email protected]
Copyright 2000

Advisory Board
Professor Asst. Professor Asst. Professor Asst. Professor Asst. Professor Professor Professor Asst. Professor Asst. Professor Asst. Professor Asst. Professor Asst. Professor Professor Asst. Professor Professor Asst. Professor Professor Professor Asst. Professor Professor Asst. Professor Professor Professor Professor Professor Asst. Professor Professor Professor Asst. Professor Professor Professor Professor Professor Professor Professor Professor Asst. Professor
Abdul-Hussien M. AL-Hadi Abdul-Razak H. Ahmed Adeeb A. AL-Zubaidy Alaa G. Hussien Ali Khiralla Amjad Dawood Niazi Anam Rasheed AL-Salihi Atta Gitti Allawi Fakhraddin N. Nassir Faris Abdul kareem Farqad Badir Hamdan Ferhad Suliffan Ghassan A. Al-Shamma Haider J. Mobarak Hashim M. AL-kadimy Hassan A. Hassan Hikmat A.R. Hatam Hussam H. Ali Jalil I. Salih Jassim M. AL-Mahana Lamia A.K. AL-Saady Maha M. AL-Bayati Mahmood Hayawi Hamash Mohammed H. AL-Alwan Muaid N. Majeed Muzahim K.Al-Khyatt Nazar El-Hasani Rafi M. Al-Rawi Rahi K. AL-Yasiri Sami E. Matlob Sarmad Khunda Sawsan S. Al-Haidari Thamir A. Hamdan Usama N. Rifat Usama S. Al-Nasiri Yarub I. Khattab Zuhair A. Eissa
(Al-Nahrain University) (Al-Nahrain University) (Al-Nahrain University) (Al-Nahrain University) (Babil University) (Iraqi Board for Medical Specialization) (Irf Institute of Embryo Research & Infertility Treatment / Al-Nahrain University) (Wassit University) (Kirkuk University) (Alkindi collage\ Baghdad University) (Al-Nahrain University) (Duhok University) (Al-Nahrain University) (Al-Nahrain University) (Al-Nahrain University) (Al-Nahrain University) (Al-Nahrain University) (Al-Nahrain University) (Al-Anbar University) (Al-Kufa University) (Al-Nahrain University) (Al-Nahrain University) (Mutah University) (Al-Mustansiriya University) (Thiqar University) (Al-Mosul University) (Iraqi Board for Medical Specialization) (U.A.E) (AL-Qadisiah University) (Al-Nahrain University) (Baghdad University) (Al-Nahrain University) (Al-Basra University) (U.A.E) (Al-Nahrain University) (Al-Nahrain University) (Karbala University)

Iraqi Journal of Medical Sciences
Aims and Scope
Iraqi Journal of Medical Sciences is published by College of Medicine,
Al-Nahrain University. It is a quarterly multidisciplinary medical journal. High quality
papers written in English, dealing with aspects of clinical, academic or investigative
medicine or research will be welcomed. Emphasis is placed on matters relating to
medicine in Iraq in particular and the Middle East in general, though articles are
welcomed from anywhere in the world.
Iraqi Journal of Medical Sciences publishes original articles, case
reports, and letters to the editor, editorials, investigative medicine, and review
articles. They include forensic medicine, history of medicine, medical ethics, and
religious aspects of medicine, and other selected topics.
Iraqi JMS FORMAT INSTRUCTION TO AUTHORS
Iraqi Journal of Medical Sciences (Iraqi JMS) is a periodic, peer-reviewed journal published quarterly by College of Medicine, Al-Nahrain University. Iraqi JMS publishes manuscripts in all fields of health and medicine written in English. Types of Contributions: Original articles, review articles, case studies, editorials, medical education, history of medicine, ethics, practical points, medical quiz, conferences, meetings and letters to the Editor. Manuscripts: • Submission of a manuscript implies that is not being considered for publication anywhere.
•
• Manuscripts submitted to IJMS are subject to editorial evaluation and revision by two referees.
The author should provide a document officially state that the current work was carried out at the site which provides this certification. The document should be signed by the highest authorized member at that location.
• The format of IJMS complies with the uniform requirements for manuscripts submitted to Biomedical Journals, published by the International Committee of Medical Journals Editors (ICMJE) (Vancouver, British Colombia, 1979) and its last update in October 2001, available on the web site www.icmje.org. • Manuscript should be typewritten double spaced on size A4 (29.5x21 cm) paper with wide margins. Page should be numbered consecutively. One original and two photocopies including figures, tables, and photographs should be submitted. Begin each of following sections on separate page in the following sequence: Title page, abstract and keywords, text, acknowledgments, references, tables, and legends for illustration. • Manuscript and figures will not be returned to the authors whether the editorial decision is to accept, revise or reject. • Manuscripts must be accompanied by a covering paper signed by all authors that the paper has not been published in and will not be submitted to any other journal if accepted in IJMS. • The page should contain (a) title of the manuscript, (b) names of each author (first name, middle initial and family name) including highest academic degree, (c) official academic and/or clinical title and affiliation (d) name and address of the institution where the work was done (e) name and address (E-mail if available) of the author to whom correspondence should be sent. • Abstract: manuscript should include an abstract of not more than 150 words. Structured abstract typed on a separate sheet and consist of background, objective, method, results, and conclusion. Translation in Arabic to be included : خلفية الدراسة، (
). هدف الدراسة، طريقة العمل، النتائج و الاستنتاج
• Keywords: three to ten keywords should be provided on the same page as the abstract in Arabic and English. As far as possible, be selected from the National Library of Medicine Medical Subject Headings. • The Arabic abstract should follow the United Medical Dictionary (Council of Arab Ministers of Health/WHO/ Arab Medical Union/ALESCO, 3 P
rdP edition.
• Manuscript format: It should be divided into the following parts: introduction, materials and methods, results and discussion.

• References: All references should be listed in consecutive numerical order by English numerical, in the order of citation in the text. Once a reference is cited all subsequent citations should be to the original number. Examples 1. Standard Journal Article: use et al when the number of authors exceeds 6.
Halliwell B, Gutteridge JMC. Oxygen toxicity, Oxygen radicals, transition metals and disease. Biochem J. 1984; 219: 1-14. 2. Books: Mann JI, Pyorala K, and Teuscher A. Diabetes in epidemiological perspective. London: Churchill Livingstone. 1983. 3. Chapter in book: Phillips SJ, and Whisnant JP. Hypertension and strock. In: Laragh JH, and Brenner BM. editors. Hypertension: Pathophysiology, diagnosis, and management. 2nd
• Tables: Each table should be typed on a separate page double-spaced, including all headings, number all tables with English numerals and include a short title. Vertical lines between columns are to be avoided.
ed. NewYork: Raven Press; 1995. p. 465-78.
• Figures: All figures must be suitable for reproduction without being retouched or redrawn. Figure number, name of senior author, and title of the work should be written lightly on the back with red pencil. Photographs must be supplied as glossy black and white prints. The top of the figures should be indicated clearly. • Legends: Captions for figures must be typed; double spaced, and must not appear on the figure. Proof Reading will be done by the secretarial office of the journal. The principal author will receive a copy of the journal. The authors are responsible for accuracy of all statements, data, and references included in the manuscript. • After the manuscript has been accepted for publication, authors are required to supply the final version of the manuscript on 3.5” IBM-compatible floppy disk in MS word version 6 or later. • All corresponding to be addressed to the Chief Editor on the address below: Chief Editor: Iraqi Journal of Medical Sciences College of Medicine, Al-Nahrain University, P.O. Box 14222, Tel. 5231521, Al-Kadhiymia, Baghdad, IRAQ.
Iraqi Journal of Medical Sciences A Medical Journal Encompassing All Medical Specializations
Issued Quarterly CONTENTS Editorial NEWBORN SCREENING FOR INBORN ERRORS OF METABOLISM (IEM) Hala S. Arif………………………………………….…….…………….……...1-3
ARTICLES MINERAL HOMEOSTASIS IN PREECLAMPSIA. Faisal Gh. Al-Rubaye, Maha M. Al-Bayati,Tariq Hovthy Al-Khayat …………………4-11 EXTRACTION AND PURIFICATION OF TWO OUTER MEMBRANE PROTEINS
(PORINS) FROM KLEBSIELLA PNEUMONIAE LOCAL ISOLATE. Amir H. Al–Shammary, Essam F. Al-Jumaily, Nidhal Abdulmohymen..…………..12-17 EVALUATION OF THE ROLE OF ERYTHROCYTE DEFORMATIONON
ERYTHROCYTES AGGREGATION AND SEDIMENTATION RATE USING HE-NE LASER SCATTERING.
Rowaida A. Al-khazragi……………………………………………………….……………18-25 CYSTINURIA IN A GROUP OF CHILDREN IN IRAQ. Shatha Hussain Ali……………………………………………………………….…………26-34 CD30 MOLECULE EXPRESSION IN SERA AND ON T CELLS OF TROPHOBLAST
TISSUE FROM WOMEN WITH RECURRENT SPONTANIOUS ABORTION. Nidhal AbdulMohymen, Amal Hussain………………………………………….………35-40
PATTERN OF MYCOBACTERIUM TUBERCULOSIS DRUG RESISTANCE IN
PREVIOUSLY TREATED CASES IN IRAQ. mustafa Nema ,Hashim M. Al-Kadimy.……………………………………….…………41-49 IMMUNOPHENOTYPHING OF PERIPHERAL BLOOD LYMPHOCYTES TO PERSON
EXPOSED TO ELECTROMAGNETIC FIELDS. Rafid Abdul –Wahid…………………………………………………………………………50-58 ULTRA STRUCTURAL STUDY OF CARBOXYLESTER HYDROLASES ACTIVITY IN
THE INTERNEURON OF THE MAMMALIAN SPINAL CORD. Ali Abdul-Sattar Abdul-Rhman……………………………………………………………59-66
A STUDY FOR THE CORRELATION BETWEEN EOSINOPHIL DERIVED NEUROTOXIN (EDN) AND ASTHMA.
Shehab.A.Lafei, Nidhal Abdul-Mohymen, Amer Al-Najjar……………….…………..67-74
NERVE CONDUCTION STUDIES IN HEALTHY IRAQIS: NORMATIVE DATA. Farqad B. Hamdan………………………………………………………………………….75-92 ENDOSCOPIC SINUS SURGERY VERSUS CONVENTIONAL METHOD IN
MANAGEMENT OF NASO-ETHMOIDAL POLYPS AND THEIR ASSOCIATED INTRANASAL ABNORMALITIES.
Hiwa As’ad Rawandzi…………………………………………………………………….93-103 PULMONARY HYPERTENSION IN PATIENTS WITH CHRONIC RENAL FAILURE Jawad Kadhem Manuti……………………………………………………..…………..104-108 MORPHOMETRIC STUDY ON THE AG-NOR CHANGES IN SKELETAL MUSCLE
RESIDENT CELLS WITH AGING May Fadhil Majid Al-Habib , Huda Rashid Kareem…………………..…………….109-115 TRACE ELEMENTS HOMEOSTASIS IN PREECLAMPSIA Faisal Gh. Al-Rubaye……………………………………………………………………116-123 Case Report INCIDENTAL INTRACRANIAL TUMOR. Mutaz Abdul Majeed Al-Qazzaz………………………………………….……………124-128
Iraqi Journal of Medical Sciences 1
Editorial:
Newborn screening for inborn errors of metabolism (IEM)
Hala S. Arif CABP
Inborn errors of metabolism (IEM) are monogenic diseases resulting in deficient activity in a single enzyme in a pathway of intermediary metabolism. Sir Garrod, was the first to recognize heritable blocks in normal human metabolic flow that conformed to Mandelian mechanisms of inheritance, and gave the name IEM, at 1908.
Single gene defects result in abnormalities in the synthesis or catabolism of proteins, carbohydrates, fats, or complex molecules. Most are due to a defect in an enzyme or transport protein, which results in a block in a metabolic pathway. Effects are due to toxic accumulations of substrates before the block, intermediates from alternative metabolic pathways, defects in energy production and use caused by a deficiency of products beyond the block, or a combination of these metabolic deviations. Nearly every metabolic disease has several forms that vary in age of onset (from few days after birth till adulthood), clinical severity, and, often, mode of inheritance.
The incidence collectively, is estimated to be approximately 1 in 4000 live births.
The international frequencies for each individual inborn error of metabolism vary. Of term infants who develop symptoms of sepsis without known risk factors, as many as 20% may have an inborn error of metabolism.
Dept. Pediatrics, College of Medicine, Al-Nahrain University.
There are over 300 gene disorders
leading to specific biochemical defects of IEM, a specific intervention that may prevent morbidity and/or is available in at least 1/3rd
IEM may be implemented for sudden deterioration in a previously normal baby, of unexplained neonatal death. Older children with unexplained encephalopathy, mental retardation, epilepsy. Unexplained hepatomegaly, fulminant or chronic liver disease ending in cirrhosis, or at times hepatic carcinoma. Renal stones. Cardiomyopathy, rhabdomyolysis, maternal acute fatty liver of pregnancy.
of the cases.
Most of the diseases that exhibit clinical consequences manifest (or can be detected) in the newborn period or shortly after, on the other hand those that present early in the neonatal period are often lethal if proper treatment is not implemented, so early detection at least for some of these disorders has proven very effective in
Iraqi Journal of Medical Sciences 2
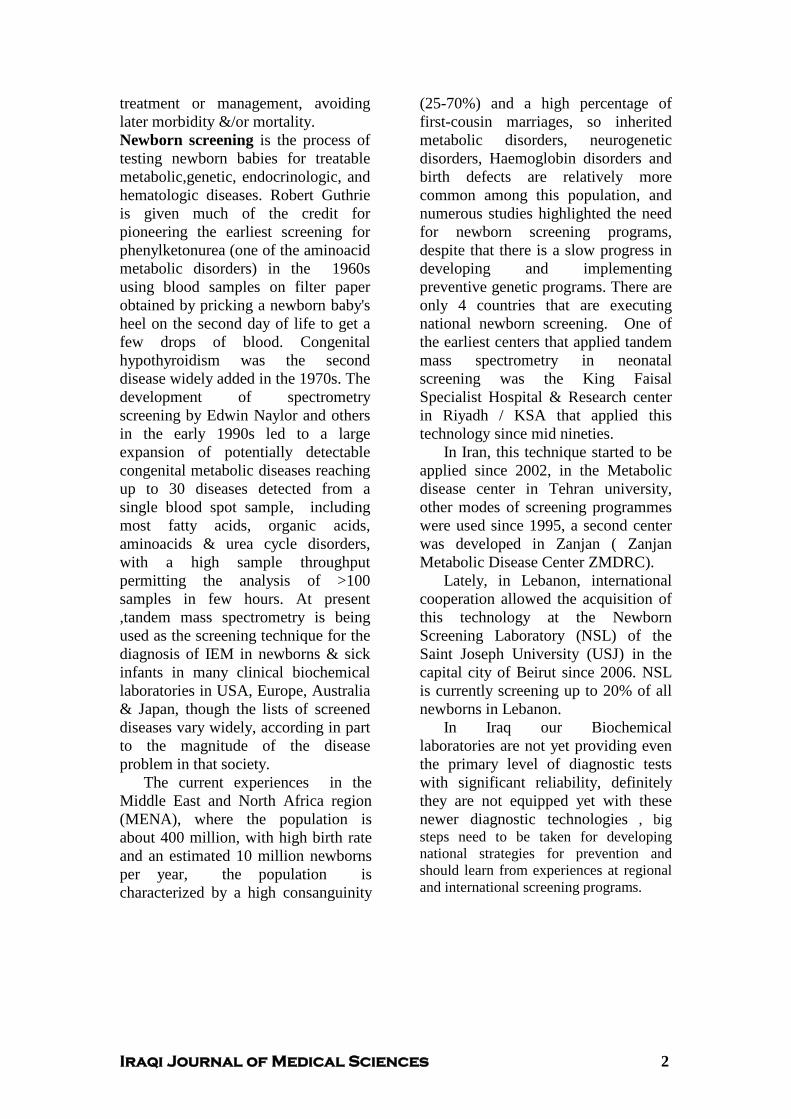
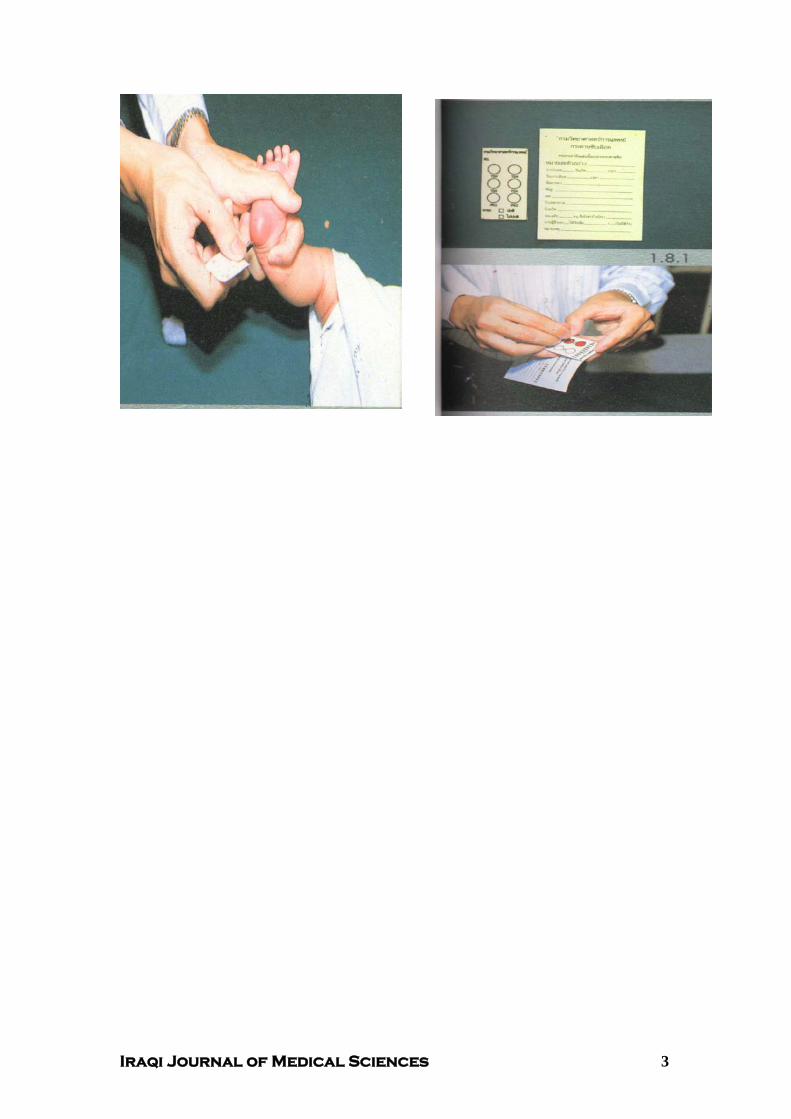
treatment or management, avoiding later morbidity &/or mortality. Newborn screening is the process of testing newborn babies for treatable metabolic,genetic, endocrinologic, and hematologic diseases. Robert Guthrie is given much of the credit for pioneering the earliest screening for phenylketonurea (one of the aminoacid metabolic disorders) in the 1960s using blood samples on filter paper obtained by pricking a newborn baby's heel on the second day of life to get a few drops of blood. Congenital hypothyroidism was the second disease widely added in the 1970s. The development of spectrometry screening by Edwin Naylor and others in the early 1990s led to a large expansion of potentially detectable congenital metabolic diseases reaching up to 30 diseases detected from a single blood spot sample, including most fatty acids, organic acids, aminoacids & urea cycle disorders, with a high sample throughput permitting the analysis of >100 samples in few hours. At present ,tandem mass spectrometry is being used as the screening technique for the diagnosis of IEM in newborns & sick infants in many clinical biochemical laboratories in USA, Europe, Australia & Japan, though the lists of screened diseases vary widely, according in part to the magnitude of the disease problem in that society.
The current experiences in the Middle East and North Africa region (MENA), where the population is about 400 million, with high birth rate and an estimated 10 million newborns per year, the population is characterized by a high consanguinity
(25-70%) and a high percentage of first-cousin marriages, so inherited metabolic disorders, neurogenetic disorders, Haemoglobin disorders and birth defects are relatively more common among this population, and numerous studies highlighted the need for newborn screening programs, despite that there is a slow progress in developing and implementing preventive genetic programs. There are only 4 countries that are executing national newborn screening. One of the earliest centers that applied tandem mass spectrometry in neonatal screening was the King Faisal Specialist Hospital & Research center in Riyadh / KSA that applied this technology since mid nineties.
In Iran, this technique started to be applied since 2002, in the Metabolic disease center in Tehran university, other modes of screening programmes were used since 1995, a second center was developed in Zanjan ( Zanjan Metabolic Disease Center ZMDRC).
Lately, in Lebanon, international cooperation allowed the acquisition of this technology at the Newborn Screening Laboratory (NSL) of the Saint Joseph University (USJ) in the capital city of Beirut since 2006. NSL is currently screening up to 20% of all newborns in Lebanon.
In Iraq our Biochemical laboratories are not yet providing even the primary level of diagnostic tests with significant reliability, definitely they are not equipped yet with these newer diagnostic technologies , big steps need to be taken for developing national strategies for prevention and should learn from experiences at regional and international screening programs.
Iraqi Journal of Medical Sciences 3
Iraqi Journal of Medical Sciences 4
Mineral Homeostasis in Preeclampsia
Faisal Gh. Al-Rubaye1 MBChB; MSc; PhD, Maha M. Al-Bayati2
MBChB;CABOG, Tariq Hovthy Al-Khayat PhD.
Background: Preeclampsia is a form of high blood pressure manifested during pregnancy, it is a common major complication causing significant morbidity and mortality; however, its etiology is unknown. Moreover, data on mineral homeostasis and on cation pattern during pregnancy are conflicting. Also, the status of ionized calcium and magnesium during pregnancy and its complication preeclampsia have not been described adequately.
Abstract
Objective: to demonstrate the pattern of minerals during preeclampsia with respect to normal pregnancy. Subject and methods: the present study is a cross-sectional case-control study includes measurement of minerals (calcium and magnesium) in 60 patients with preeclampsia. They are classified into two groups according to gestational age: o Preeclamptics in the second trimester G1: (n=30). o Preeclamptics in the third trimester G2: (n=30,).
The results are compared with 60 apparently healthy pregnants controls. They are classified according to gestational age into two groups: o Pregnants in the second trimester G3: (n=30). o Pregnants in the third trimester G4: (n=30). Results: show that serum corrected calcium and serum magnesium are significantly reduced in preeclamptics when compared with normal pregnants. In addition, there was a reduction in free calcium and free magnesium that was accompanied by a significant high elevation of the ratio between ionized calcium to ionized magnesium. Conclusion: preeclamptics (in different gestational age groups) have altered mineral status when compared with healthy pregnants matched with their age and gestational age. Key words: preeclampsia, calcium, magnesium. IRAQI J MED SCI, 2009; VOL.7 (2):4-11
Preeclampsia is defined as the onset of hypertension and the presence of proteinuria during pregnancy, usually occurring after the 20th week of gestation in a previously normotensive woman and resolving completely by the sixth week after delivery of fetus
Introduction
(1, 2)
.
1Dept. Chemistry & Biochemistry,2Dept. Obstetrics & Gynecology, College of Medicine, Al-Nahrain University,3
Adress Correspondence to: Dr. Faisal Gh. Al-Rubaye.
Dept. Biochemistry, College of Medicine, Babylon University
E- mail: [email protected] Mobile: 07702640792 Received: 27th July 2008, Accepted: 13th
The pathophysiology of preeclampsia is thought to represent a defective response to the physiologic demands of normal pregnancy
April 2009.
(2, 3). Normal pregnancy is associated with profound changes in maternal homeostasis (4). The endpoint of these changes is to provide the fetus with the necessary environment for growth and the mother with adequate protection against pregnancy complications (4)
During normal pregnancy, maternal plasma total calcium concentrations fall, primarily because of the decrease in serum albumin to which the mineral is predominantly bound in the circulation and it seems likely that there is a relatively little change in unbound ionized calcium. However, there is a
.
Mineral status in PE….Faisal Gh. Al-Rubaye et al
Iraqi Journal of Medical Sciences 5
substantial fetal need for calcium P
(5)P. It is
now clear that the dynamics of calcium homoeostasis are in fact substantially altered in pregnancy P
(5)P. pregnancy-
induced hypomagnesemia has been reported previously. however; the status of ionized magnesium during pregnancy and its relation to other important cations such as ionized calcium have not been described adequately it is the “free” or ionized magnesium that exerts biological activityP
(6)P.
It was suggested that a deficiency in magnesium contributed to the development of vasoconstriction in preeclampsiaP
(7)P. Also, deficiencies in
calcium intake have been linked to preeclampsia/eclampsia, and hypocalciuria and deviations in both 1,25-(OH)R2RDR3R and PTH have been shown in women with preeclampsiaP
(7)P.
USubjects & Methods A-Subjects
The study was a cross-sectional, case-control study conducted on 60 patients with preeclampsia (PE) attending the Obstetric Consultant-Clinic, Antenatal Clinic, and Labor Ward at Al-Kadhimiya Teaching Hospital, for re-evaluation of newly diagnosed PE, or for delivery.
The diagnosis of PE was based on clinical criteria that were hypertension (absolute BP of 140/90 mmHg twice over 4 hr without prior comparison)P
(1, 2)P
and proteinuria (21.5 mg of urinary protein per mmol creatinine)P
(8)P.
The exclusion criteria, which were used for cases and controls, were gestational or chronic hypertension, diabetes mellitus, renal disease, multifetal gestation, intrauterine fetal death, and pregnancy less than 20 weeks of gestation.
Depending on the gestational age, the patients were divided into two groups: 1.Preeclamptics in the second trimester (G1):
Includes thirty Preeclamptics in their second trimester of pregnancy. Age range was from 18 to 37 years (mean age + SD = 26.1 + 6.4 year). The gestational age range was from 20 to 28 weeks (mean gestational age + SD = 26.3 + 1.5 week). 2.Preeclamptics in the third trimester (G2):
Includes thirty preeclamptics in their third trimester of pregnancy. Age range was from 18 to 40 year (mean age + SD = 25.1 + 6.9 year). Gestational age range from 29 to 40 weeks (mean gestational age + SD = 35.6 + 1.6 week). UControls:
Sixty apparently healthy pregnant women attending the Antenatal clinic, and Labor Ward at Al-Kadhimiya Teaching Hospital, for re-evaluation of their pregnancy, or for delivery. The control groups were comparable preeclamptic groups regarding the age, gestational age, Depending on the gestational age, the apparently healthy pregnants were divided into two groups: 3. Control pregnants in the second trimester (G3):
They were thirty apparently healthy pregnants in the second trimester of pregnancy. Age range was from 15 to 38 years (mean age + SD = 24.6 + 4.5 year). Gestational age range was from 20 to 28 weeks (mean gestational age + SD = 25.5 + 1.8 week). 4. Control pregnants during the third trimester (G4):
They were thirty pregnants in the third trimester of pregnancy. Age range was from 18 to 35 year (mean age + SD = 24.8 + 4.6 year). Gestational age range
Mineral status in PE….Faisal Gh. Al-Rubaye et al
Iraqi Journal of Medical Sciences 6
was from 29 to 40 weeks (mean gestational age + SD = 34.6 + 2.1 week). B. Blood & urine samples:
Ten milliliters of random venous blood were withdrawn from each patient and control, in supine position, without application of tourniquet. Samples then were transferred into clean new plane tube, left at room temperature for 15 minutes for clotting, centrifuged, and the separated serum was transferred into Eppendrof tube, which was used for measuring minerals (Ca, Mg). The tubes were stored at –20P
oP C until analysis,
which was done within one month after collectionP
(9)P.
Random urine specimens were obtained from each subject in the study to quantify urinary calcium P
(9)P,
magnesium P
(9)P that were expressed as a
ratio to urinary creatinine P
(9)P. As a
preservative, 1-2 mls of 6M HCl was added to each random urine specimen; the samples were stored in appropriate containers at -20ºC until analysis P
(9)P.
C-Methods Using atomic absorption
spectrophotometer (Buck Scientific 210 JVP), the assay for calcium and magnesium estimation was carried out by adding 2.45 ml of (1% lanthanum chloride) solution to 0.05 ml of serum (or urine). These solutions were aspirated directly into air-acetylene flame where the calcium and magnesium hallow cathode lamp were used at wavelength 422.7 and 285.2 nm respectivelyP
(9)P. Adjusted serum calcium
can be calculated according to the formulaP
(10)P:
Adjusted calcium (mmol/L) = Measured calcium concentration (mmol/L) + 0.02 [40 – albumin concentration (g/L)].
Instead of obtaining a crude correction for measured calcium, the same data was used to calculate the
ionized calcium according to the formulaP
(10)P:
Ionized calcium (mmol/L) = 60 × measured calcium (mmol/L) – K'/12 K' + 60 Where K' = 0.19 × total protein (g/L) + albumin (g/L).
The concentration of magnesium ion in serum was calculated from measurement of concentrations of total serum protein and total serum magnesium according to the equation P
(11)P: [100.4 GZ / 100G – P]P
2P + (33.77 +
2.42 f P – f Mg) [100.4 GZ / 100G – P] – 33.77 f Mg = 0. Where P = total protein in gm per 100 ml of serum. G = specific gravity of serum = 0, 00292 * P + 1.007 f = liters of serum that contain 1 kilo of water = 1000/G (4225.6 - 3225.6 G). Mg = total magnesium in milli-equivalent per liter of serum. Z = is MgP
++P in milli-equivalent per liter
of serum. UResults
The serum corrected and ionized calcium concentrations were lower in the preeclamptic women in third trimester G2 group as compared to healthy controls in the third trimester G4 [P < 0.001 for both] and even when compared to the preeclamptics in the second trimester G1 [P < 0.001 for both] as seen in (Table 1). The same significant reduction in corrected but not ionized calcium was noticed in the second trimester group G1 when compared to the healthy pregnants in the second trimester group G3 [P < 0.001 for corrected calcium but > 0.05 for ionized calcium] as seen in (Table 1). There was no significant difference in corrected and ionized serum calcium values between healthy pregnants in
Mineral status in PE….Faisal Gh. Al-Rubaye et al
Iraqi Journal of Medical Sciences 7
each group [P > 0.05 for both] as seen in (Table 1).
Although the urinary excretion of calcium (expressed as urinary calcium per creatinine) was significantly reduced in preeclamptics in both groups G1 [P < 0.01] and G2 [P < 0.05] in comparison with pregnant controls of the same gestational period G3 and G4, the level of urinary calcium excretion was not significantly different between preeclamptics in the second and third trimester G1 and G2 [P > 0.05] nor between healthy pregnants in the same gestational periods G3 and G4 [P > 0.05] as seen in (Table 1).
A significant reduction in both total and ionized serum magnesium was noticed throughout the course of pregnancy whether among the preeclamptics groups: G1 and G2 [P < 0.001 for both]; or among healthy control pregnant G3 and G4 [P < 0.001 for both]. When preeclamptic groups G1 and G2 were compared with corresponding healthy control pregnant groups G3 and G4, the reduction in total and ionized serum magnesium was also significant [P < 0.001 for], as seen in (Table 1).
A significant elevation in urinary magnesium excretion expressed as a ratio of urinary magnesium to urinary creatinine was noticed through out the course of pregnancy whether among the preeclamptic groups: G1 and G2 [P < 0.001]; or among healthy control pregnant G3 and G4 [P < 0.01 for both]. When preeclamptic groups G1 and G2 were compared with corresponding healthy control pregnant groups G3 and G4, the significant increase in magnesium excretion is also found [P < 0.001], as seen in (Table 1).
A significant elevation in the ratio between ionized calcium to ionized
magnesium was noticed in preeclamptics in both gestational period groups G1 [P < 0.001] and G2 [P < 0.001] as compared to the healthy pregnants in the same gestational periods G3 and G4. This significant elevation was also present in pregnants in the third trimester groups G2 [P < 0.01] and G4 [P < 0.001] when compared to pregnants in the second trimester groups G1 and G3, as seen in (Table 1). UDiscussion
A number of studies have been published finding serum total calcium levels not different in non-pregnant controls and healthy pregnant women, whereas other researchers like Pederson et. al.P
(12)P, found decreased total serum
calcium values in normal pregnancy. Furthermore, the beneficial role of a calcium supplementation in preeclampsia is still controversial P
(13, 14)P.
Some investigators reported an increased free erythrocyte and platelets calcium concentration, speculating that transmembrane calcium fluxes re-altered in hypertensive pregnancy, possibly by a specific mechanism probably of placental origin P
(7)P. The
finding of low serum total calcium in preeclamptics reported here is in agreement with findings of others P
(7, 15,
16)P who conclude that a calcium deficit
leading to an increased intracellular ionized calcium concentration during late pregnancy contribute to the pathogenesis of preeclampsia. In contrary, many investigators P
(6, 12, 17, 18)P
found that serum calcium did not differ significantly from normal pregnant group.
Regarding the ionized fraction of calcium, is crucial for the synthesis of vasoactive substances in the endothelium as prostacyclin and nitric oxideP
(19)P. The
finding of significant reduction in this
Mineral status in PE….Faisal Gh. Al-Rubaye et al
Iraqi Journal of Medical Sciences 8
fraction, as seen in Table 1 is consistent with those reported byP
PSeely et.al.P
(20)P,
who revealed that a low level of active vitamin D (1, 25-(OH)R 2R D) in preeclamptics, may contribute to suboptimal intestinal absorption of calcium during a time of increased calcium demand resulting in lower ionized calcium, increased PTH, and hypocalciuria in preeclampsiaP
(6)P.
Abnormalities in calcium homeostasis may contribute to the increased vascular sensitivity documented in preeclampsiaP
(6)P. In contradiction to the reported
difference in ionized calcium between normal and preeclamptic patients, other authors like Sanders et.al. P
(17)P, Siddiqui &
RanaP
(21)P, Pederson et.al.P
(12)P, Richards et.
al.P
(22)P found no difference in serum
ionized calcium. Urinary calcium in preeclamptic in
this study was observed to be lowered as compared to corresponding control pregnant as seen in (Table 1).
The etiology of hypocalciuria in preeclampsia is unknown. However, different assumptions have been givenP
(23)P. Particularly, it has been proposed
that hypocalciuria may result from decreased dietary intake of calcium resulting in a low circuating calcium and hence low urinary calcium P
(23)P; or from
decrease intestinal absorption as secondary result of decreased 1,25 dihydroxyvitamin D, which enhances intestinal absorption of calcium P
(23)P; or it
may be due toP
Pincreased calcium intake
by the growing fetus and placentaP
23P;
lastly, it may be due to intrinsic renal tubular dysfunction, presumably due to decreased glomerular filtration and increased tubular reabsorptionP
(23)P.
We found also, a decrease in both total and ionized magnesium throughout the 2 P
ndP and 3 P
rdP trimesters of
pregnancy in both normal and
preeclamptic pregnant women as seen in Table 1, like several studies P
(6, 7, 24-28)P.
The level of the cation studied was found to be within the same ranges reported for corresponding non-pregnants in other studies like P
(7, 20, 24, 27)P.
Although the reason for the reduction in total and ionized magnesium is not clear, it is not likely to be due solely to hemodiluton and extracellular fluid volume expansion as serum magnesium levels are still observed to decrease when correcting for protein dilution P
(6)P.
An increase in the renal clearance during pregnancy may contribute to the reduction in serum magnesium, since the kidney is the main regulator of the body magnesium P
(6)P. This was supported by
the finding of significant increase in magnesium excretion in healthy control and preeclamptic pregnancy with advancing gestational age according to magnesium: creatinine ratio, as seen in (Table 1). Other factors that may contribute to hypomagnesaemia in pregnancy include poor dietary intakeP
6P
which is accompanied by consumption of minerals by the growing fetal skeletal system P
(6)P. Hypoproteinaemia is another
contributing factor since extracellular magnesium accounts for about 1% of the total body magnesium content. About 55% of magnesium is free, 30% is associated with proteins (primarily albumin), and 15% is complexed with phosphate, citrate, and other anions P
(9)P.
The technique used for measuring ionized magnesium can also be considered, ideally, it is the ion-selective electrode which is not available in Iraqi laboratories, instead a mathematical equation was employed P
(9, 11)P.
We also found an increased ionized calcium:ionized magnesium ratio during normal and complicated pregnancy, as seen in (Table 1). In
Mineral status in PE….Faisal Gh. Al-Rubaye et al
Iraqi Journal of Medical Sciences 9
previous reports P
(28)P, the molar ratio of
total calcium to total magnesium remained constant throughout pregnancy. However, ionized magnesium can be altered independent of total magnesium concentrations P
(29)P. A
high calcium-magnesium ratio has been associated with increasing vasospasm P
(30)P. Increased intracellular calcium and
decreased intracellular magnesium have been reported in women with hypertension and diabetes P
(30)P. Thus
electrolytes abnormalities may contribute to altered blood pressureP
(23)P.
The relation between serum total and ionized magnesium with intracellular magnesium has not been defined clearly. In previous studyP
(30)P,
there was no significant difference in red blood cell magnesium levels in teenagers with pregnancy-induced hypertension,
whereas plasma magnesium tended to decrease with increasing gestation in this same group. However, recent evidence suggests that extracellular magnesium may modulate intracellular magnesium in vascular smooth-muscle cells P
(6)P.
On the basis of previous experimental data, the mechanisms underlying the magnesium-induced vasodilation may be due to a modification of the response to vasopressor hormones P
(7)P, and an
interaction with cellular calcium handlingP
(7)P. These possible mechanisms
were discussed by Kisters et. al. 2000P
(7)P.
Further study of intracellular minerals and the membrane Na, K ATPase and calcium pumps to explore their potential role in the pathogenesis of preeclampsia is required for future work.
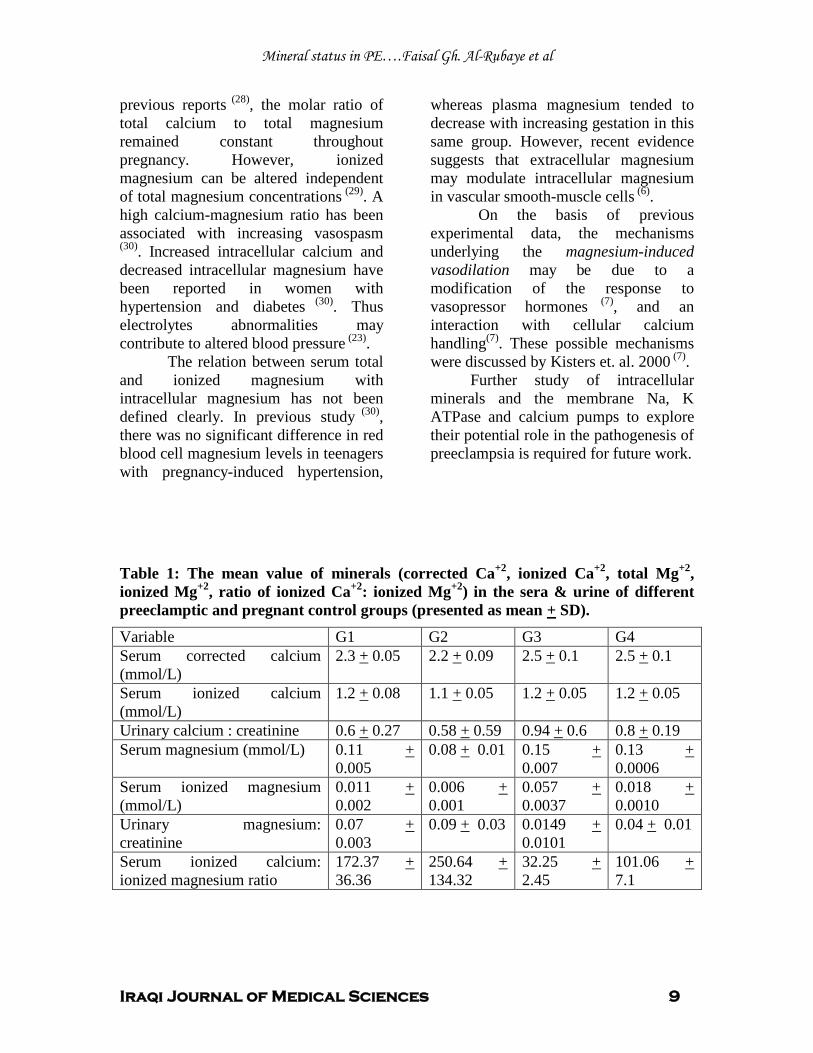
Table 1: The mean value of minerals (corrected Ca P
+2P, ionized Ca P
+2P, total MgP
+2P,
ionized Mg P
+2P, ratio of ionized CaP
+2P: ionized Mg P
+PP
2P) in the sera & urine of different
preeclamptic and pregnant control groups (presented as mean + SD).
Variable G1 G2 G3 G4 Serum corrected calcium (mmol/L)
2.3 + 0.05 2.2 + 0.09 2.5 + 0.1 2.5 + 0.1
Serum ionized calcium (mmol/L)
1.2 + 0.08 1.1 + 0.05 1.2 + 0.05 1.2 + 0.05
Urinary calcium : creatinine 0.6 + 0.27 0.58 + 0.59 0.94 + 0.6 0.8 + 0.19 Serum magnesium (mmol/L) 0.11 +
0.005 0.08 + 0.01 0.15 +
0.007 0.13 + 0.0006
Serum ionized magnesium (mmol/L)
0.011 + 0.002
0.006 + 0.001
0.057 + 0.0037
0.018 U+ U0.0010
Urinary magnesium: creatinine
0.07 + 0.003
0.09 + 0.03 0.0149 U+ U0.0101
0.04 + 0.01
Serum ionized calcium: ionized magnesium ratio
172.37 + 36.36
250.64 + 134.32
32.25 + 2.45
101.06 + 7.1
Mineral status in PE….Faisal Gh. Al-Rubaye et al
Iraqi Journal of Medical Sciences 10
UReferences 1. Baker PN. (Ed.). Obstetrics by Ten Teacher; 18 P
thP edition. 2006, PP: 159-161. Hodder Arnold
2. Parry S and Marchiano D. Hypertension in pregnancy. In: Mark-M and Sam-S. (Eds.). NMS (National medical series for independent study) / Obstetrics & gynecology. 5 P
thP ed. 2005; P: 169.
Lippincott Williams & Wilkins. 3. Hollenberg N D. Organ systems dependent estrone nitric oxide and the potential for nitric oxide-targeted therapies in related diseases.The Journal of Clinical Hypertension. 2006; 8 suppl4: 63-73. 4. Kametas N, McAuliffe F, Krampl E, Sherwood R, Nicolaides K H. Maternal electrolytes addition liver function changes during pregnancy at high altitude. Clinica Chimica Acta. 2003; 328: 21-29. 5. Dunlop W, Normal pregnancy: physiology and endocrinology. In: Edmonds-DK. (Eds.). Dewhurst Textbook of Obstetrics and Gynecology for postgraduates. 6 P
thP ed. 1999; PP:
81-3. Blackwell Science. 6. Standley CA, Whitty JE, Mason BA, Cotron DB. Serum ionized magnesium levels in normal and preeclamptic gestation. Obstet-Gynecol. 1997; 89: 1051-2. 7. Kisters K, Barenbroka M, Louwenb F, Hausberga M, Rahna KH, Koscha M. Membrane, intracellular, and plasma magnesium, and calcium concentrations in preeclampsia. AM J Hyperten. 2000; 13: 765-769. 8. Yamasmit Water, Chaithongwogwatthana S, Charoenvidhya D, Uerpairojkit B, Tolosa J. Random urinary protein-creatinine ratio for prediction of significant proteinuria in women with preeclampsia. J-Matern-Fetal-Neonatal-Med. 2004; 16: 257-9. 9. Endres DB, Rude RK, Mineral and Bone Metabolism. In: Carel-AB, and Edward-RA. (Eds.). Tietz Textbook of Clinical Chemistry. 3 P
rdP
ed. 1999; PP: 1395-1412. Saunders Company, Philadelphia. 10. Gowenlock AH, McMurray JR, McLauchlan D. (Eds). Varley's Practical Clinical Biochemistry. 6 P
thP ed. 1977; PP: 868-873.
Heinemann Medical Books, London 11. Willis MJ and Sunderman FW. Normograms for calculating magnesium ion in serum and ultrafiltrates. Studies in serum electrolytes. 1952; PP: 343-45. 12. Pederson EB, Johannesen P, Kristensen S, Rasmussen AB, Emmertsen K, Moller J, et,al. Calcium, parathyroid hormone and calcitonin in normal pregnancy and preeclampsia. Gynecol-Obstet-Invest. 1984; 18: 156-164.
13. Rogers MS, Heldy YM, Fung HY, Hung CY. Calcium and low-dose aspirin prophylaxis in women at high risk of pregnancy-induced hypertension. Hypertens Pregnancy. 1999; 18: 165-172. 14. Levine RJ, Hauth JC, Curet LB, Sibai BM, Catalano PM , Moris CD, et,al. Trial of calcium to prevent preeclampsia. N-Engl-J-Med. 1997; 337: 69-76. 15. Ingec M, Nazik H, Kadanali S. Urinary calcium excretion in sever preeclampsia and eclampsia. Clin-Chem-Lab-Med. 2006; 44: 51-3. 16. Hojo M, August P. Calcium metabolism in normal and hypertensive pregnancy. Semin-Nephrol. 1995; 15:504-11. 17. Sanders R, Koijnenberg A, Huijgen HJ, Wolf H, Boer K, Sanders GT. Intracellular and extracellular ionized and total magnesium in preeclampsia and uncomplicated pregnancy. Clin-Chem-Lab-Med. 1999; 37: 55-9. 18. Gao S, Liu G, Li L. Observation and analysis on metabolism of serum calcium and phosphorus in patients with pregnancy-induced hypertension. Zhongha Liu Xing Bing Xue Za Zhi. 1998; Dec; 19: 350-2. 19. Lopez P. Prevention of preeclampsia with calcium supplementation and its relation with the L-arginine: nitric oxide pathway. Braz J Med Biol Res (BRAZIL). 1996; 29: 731-41. 20. Seely EW, Wood RJ, Brown EM, Graves SW. Lower serum ionized calcium and abnormal calciotropic hormone levels in preeclampsia. J Clin Endocrinol Metab. 1992; 74:1436-40. 21. Siddiqui JA, Rana IA. Mineral and parathyroid hormone inter-relationships in normal pregnancy and pregnancy-induced hypertension. J Pak Med Assoc. 1993; 43: 92-5. 22. Richards SR, Nelson DM, Zuspan FP. Calcium levels in normal and hypertensive pregnant patients. Am J Obstet Gynecol. 1984 May 15; 149: 168-71. 23. Szidt Adjidé V, Vendittelli F, Sandra D, Brédent Bangou J, Janky E. Calciuria and preeclampsia: a case-control study. European Journal of Obstetrics & Gynecology and Reproductive Biology. 2006; 125: 193-8. 24. Handwerker SM, Altura BT, Altura BM. Ionized serum magnesium and potassium levels in pregnant women with preeclampsia and eclampsia. J-Reprod-Med. 1995; 40: 201-8. 25. Handwerker SM, Altura BT, Altura BM, Royo B. Ionized serum magnesium levels in umbilical cord blood of normal pregnant women at delivery: Relationship to calcium,
Mineral status in PE….Faisal Gh. Al-Rubaye et al
Iraqi Journal of Medical Sciences 11
demographics and birth weight. Am-J-Perinatol. 1993; 10:392-7. 26. Seydoux J, Luc Pauier EG, Beguin F. Serum and intracellular magnesium during normal pregnancy and in patients with preeclampsia. Br-J-Obstet-Gynecol. 1992; 99: 207-11. 27. Kurzel RB. Serum magnesium levels in pregnancy and preterm labor. Am-J-Perinatol. 1991; 8: 119-27. 28. Borella P, Szilagyi A, Than G, Csaba I, Giardino A, Facchinetti F. Maternal plasma concentrations of magnesium, calcium, zinc, and copper in normal and pathological pregnancies. Sci-Total-Environ. 1990; 99: 67-76. 29. Brooks CIO, Fry CH. Ionized magnesium and calcium in plasma from healthy volunteers and patients undergoing cardiopulmonary bypass. Br-Heart-J.1993; 69: 404-8. 30. Resnick LM, Gupta RK, Bhargave KK, Grunespan H, Alderman MH, Laragh JH. Cellular ions in hypertension, diabetes and obesity. Hypertension. 1991; 17: 951-7.
Iraqi Journal of Medical Sciences 12
Extraction and purification of two outer membrane proteins (porins) from Klebsiella pneumoniae local isolate.
Amir H. Al–Shammary1 PhD, Essam F. Al-Jumaily2PhD, Nidhal Abdulmohymen1
PhD.
Background: The porins are present in large amounts in the outer membrane of gram negative bacteria and form water-filled channels that permit the diffusion of small hydrophilic solutes across the outer membrane. Porins are generally divided into two classes: nonspecific porins (e.g., OmpC and OmpF), which permit the general diffusion of small polar molecules (600 Da), and specific porins (e.g., LamB), which facilitate the diffusion of specific substrates.
Abstract
Objective: To purify and characterize outer membrane proteins (porins) from a local isolate of Klebsiella pneumoniae. Materials and methods: An identified local isolate of Klebsiella pneumoniae was used as a primary source for the isolation and purification of porins. Outer membrane protein (porins) was purified and characterized and the contaminating lipopolysaccharides (LPS) were detected by thiobarbituric acid assay.
Results: The final preparation contained porins in a concentration of 3.2 mg/ml. The results of electrophoretic separation revealed that porins appeared as two distinct bands with molecular weights of porins were estimated to be 35 and 36 kDa, respectively. Conclusions: Porins were expressed by the local isolate of Klebsiella pneumoniae with molecular weights highly similar to that of porins preparations produced by other gram negative bacteria and Klebsiella pneumoniae expressed two types of porins under standard laboratory conditions. Keywords: Porins, Thiobarbituric acid, Gel filtration chromatography, Ketodeoxyoctinate. IRAQI J MED SCI, 2009; VOL.7 (2):12-17
Approximately, 50% of the dry mass of the outer membrane of gram-negative bacteria consists of proteins, and more than 20 immunochemically distinct proteins (termed outer membrane proteins [OMPs]) have been identified in E. coli. Apart from their structural role, OMPs have also been shown to have other functions, particularly with regard to transport, and have been classified as permeases and porins. Furthermore, several OMPs have been shown to be potent inducers of cytokine synthesis
Introduction
(1)
.
1Dept. Medical Microbiology, College of Medicine, Al-Nahrain University, 2
Adress Correspondence to: Dr. Amir H. Al–Shammary
Institute of Genetic Engineering and Biotechnology for postgraduate studies.
E- mail: [email protected] Received: 29th October 2008, Accepted: 18th
Porins are OMPs which form trimers that span the outer membrane and contain a central pore with a diameter of about 1 nm. These porins (e.g., OmpC and OmpF of E. coli) are permeable to molecules with molecular masses lower than approximately 600 Da. Porins play a crucial role in the interactions between the environment and bacteria, in addition, or probably as a consequence, they are present in large amounts in the outer membrane of gram-negative bacteria
March 2009.
(2).
Porins were extracted according to the method described by Nurminen
Materials and methods
(3)
Briefly, the bacterial cells were harvested by centrifugation at 4000 rpm for 30 minutes. One gm of bacterial cells was washed twice with 0.01M tris buffer (pH 7.8) and suspended in10 ml of 0.01 M tris
.
Extraction and purification of porins from Klebsiella pneumoniae… Amir H. Al–Shammary et al
Iraqi Journal of Medical Sciences 13
buffer containing 0.01 M EDTA and 1.3 mg lysozyme, then 0.4 ml solution of 1 M MgCl2 containing 50 mg DNas & RNase each was added. One gm (wet weight) prepared above was extracted twice (separated by centrifugation at 3000xg) with 2% TX-100 buffer containing 0.01M MgCl2
Half mg trypsin / ml suspension was added and incubated overnight at 37 °C. One hundred ml of the digested mixture was centrifuged at 20000xg, the supernatant was collected, and the pellet was digested once more with trypsin. The supernatant of both digestions was ultrafiltered using the amikon apparatus. The retained material was washed with 1L of D.W. by further ultra filtration. The precipitate was suspended into 100 ml of D.W. and centrifuged at 20000xg for 20 minutes. The sediment was finally suspended in 10 ml of D.W.
.
For further purifying porins, the final preparation was subjected to gel filtration chromatography using Sephacryl S-200 gel. Preparation and packing of the gel
Sephacryl S-200 gel was prepared according to the instructions of the manufacturing company. It was suspended for 2 hrs in 250 ml of 0.01 M EDTA buffer (pH 7.5) containing 0.2% TX-100 and then it was degassed by using vacuum pump. Gel was poured with care (to avoid bubbles) onto a column with dimensions of 1.5x88 cm. Finally the column was equilibrated over night with the same buffer. Method of Gel filtration chromatography
Five ml of porins solution was loaded onto the column, and fraction of 5 ml each were eluted after settling the flow rate to about 30 ml/hrs. Absorbance at 280 nm was measured for all of the fractions.
Concentration The porins peaks, were collected
as 80 ml of elution buffer and concentrated by sucrose to a final volume of 10 ml for each peak. Sodium dodecyl sulfate-polyacrylamide gel electrophoresis (SDS-PAGE)
The purity of the porins and the apparent masses of their variants were estimated by SDS-PAGE. SDS-PAGE was done according to the method of Laemmli described by Garfin, (4)
. The protein concentration in the final preparation of porins was measured by the absolute method:
O.D. at 235nm - O.D. at 280 nm 2.51
=
protein concentration (mg/ml) as mentioned by Whitaker and Granum, (5)
Thiobarbituric acid assay for the estimation of lipopolysaccharide (LPS) concentration (Ketodeoxyoctinate).
.
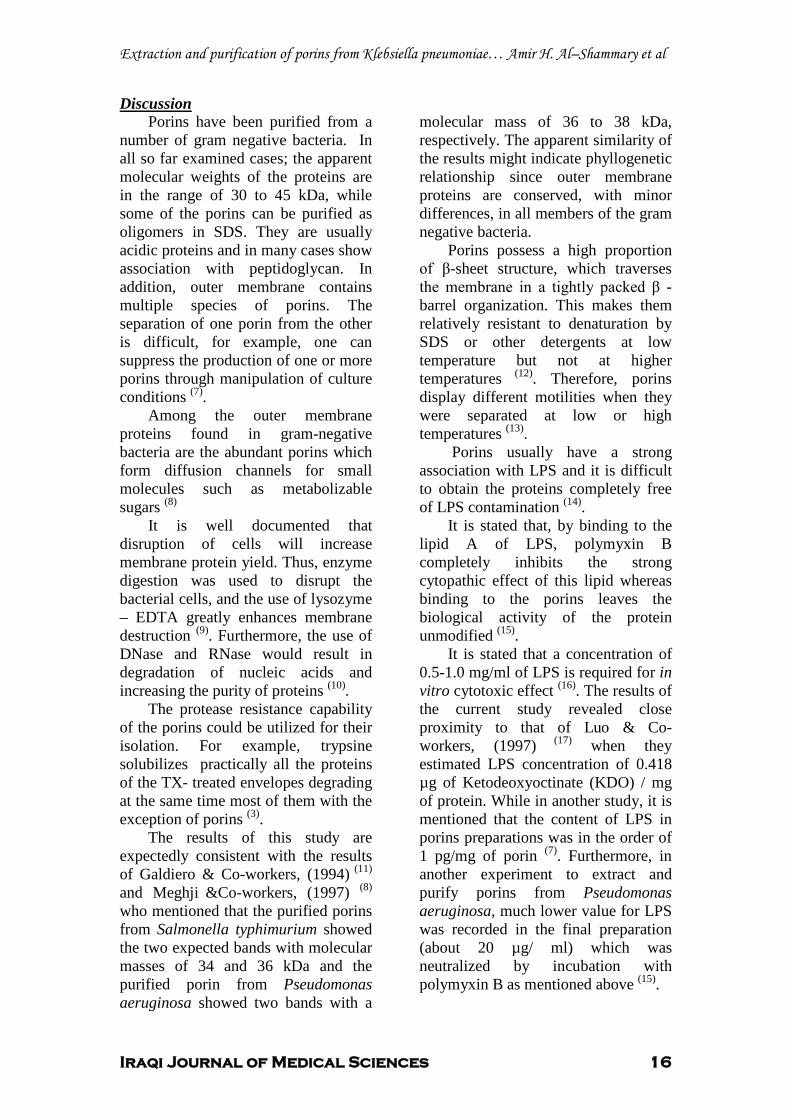
Standard curve of LPS: Several known concentrations of LPS were plotted versus their relevant absorbance at 550 nm, and a standard curve was created. By the aid of the standard curve, it was possible to measure LPS concentrations in the final porins preparation.
Thiobarbituric acid assay was performed according to the method described by Hanson and Philip, (6) and to alleviate the cytotoxic effects of contaminating LPS, polymyxin B was added to the final porins solution in a dose of 5g/ml and the mixture was incubated for one hour at 20°C.
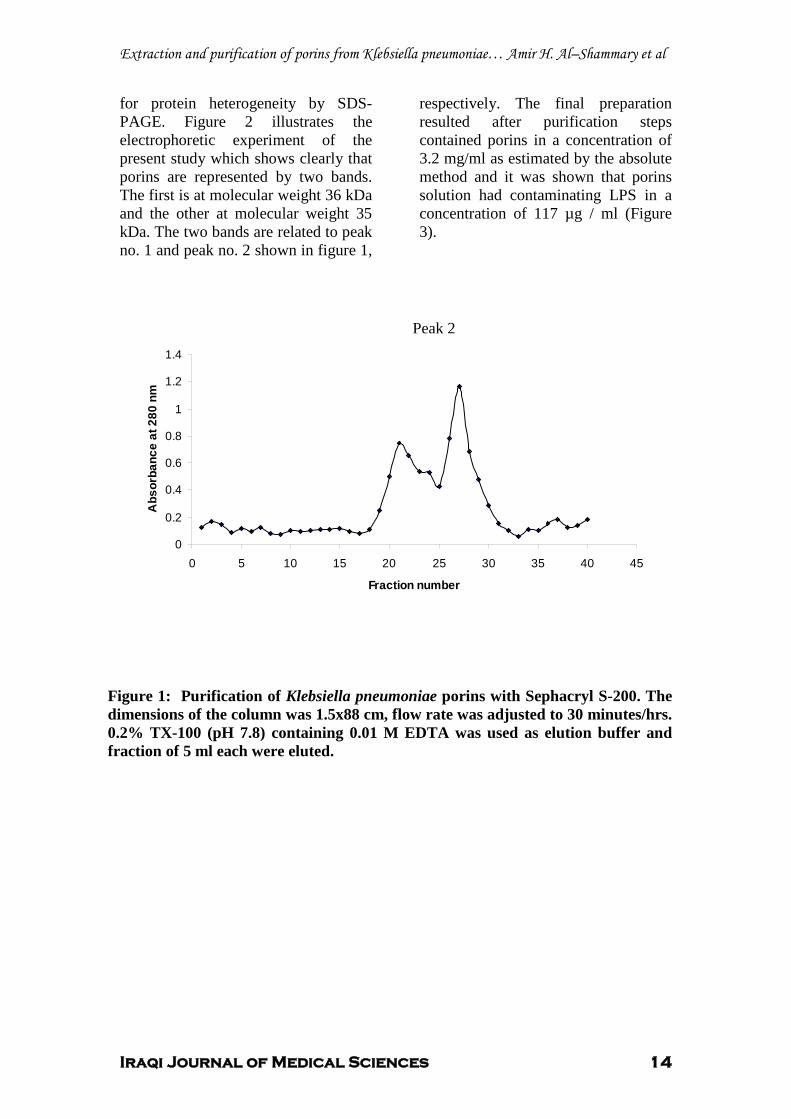
The results revealed that porins were eluted as two peaks (Figure 1); the fractions enriched in protein, identified by absorbance at 280 nm, were pooled and extensively concentrated by sucrose and checked
Results
Extraction and purification of porins from Klebsiella pneumoniae… Amir H. Al–Shammary et al
Iraqi Journal of Medical Sciences 14
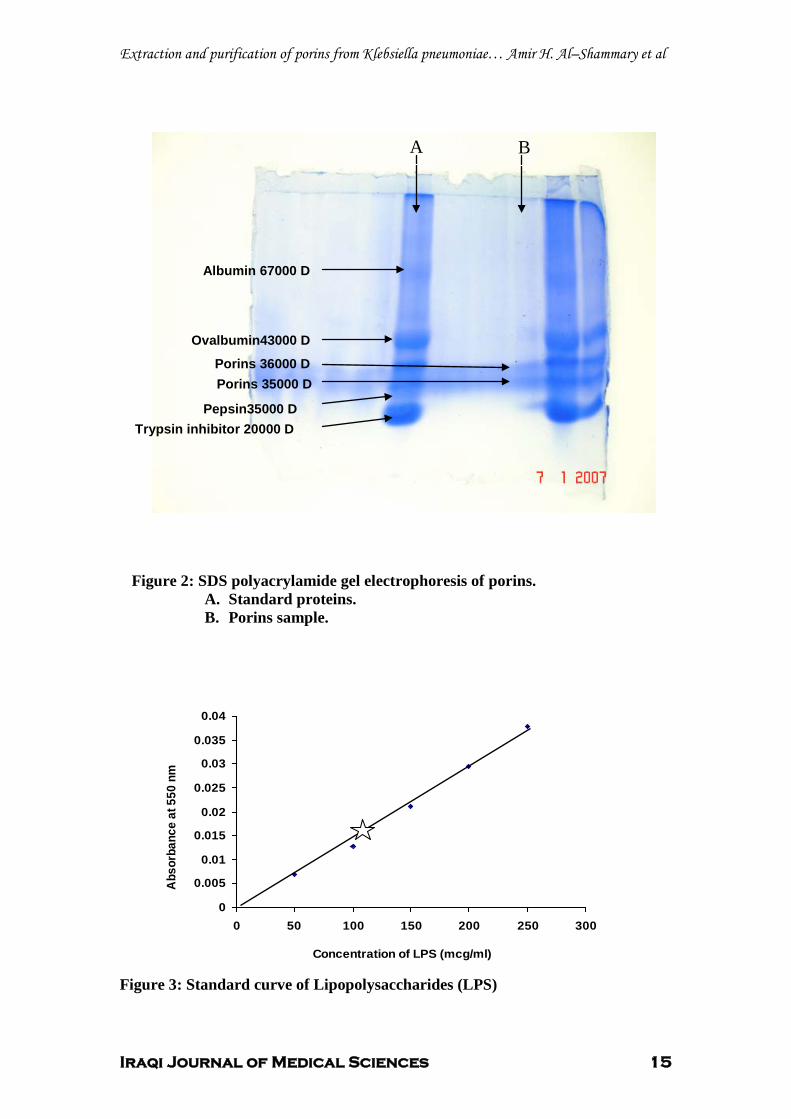
for protein heterogeneity by SDS-PAGE. Figure 2 illustrates the electrophoretic experiment of the present study which shows clearly that porins are represented by two bands. The first is at molecular weight 36 kDa and the other at molecular weight 35 kDa. The two bands are related to peak no. 1 and peak no. 2 shown in figure 1,
respectively. The final preparation resulted after purification steps contained porins in a concentration of 3.2 mg/ml as estimated by the absolute method and it was shown that porins solution had contaminating LPS in a concentration of 117 µg / ml (Figure 3).
Figure 1: Purification of Klebsiella pneumoniae porins with Sephacryl S-200. The dimensions of the column was 1.5x88 cm, flow rate was adjusted to 30 minutes/hrs. 0.2% TX-100 (pH 7.8) containing 0.01 M EDTA was used as elution buffer and fraction of 5 ml each were eluted.
Peak 1
Peak 2
0
0.2
0.4
0.6
0.8
1
1.2
1.4
0 5 10 15 20 25 30 35 40 45
Fraction number
Abs
orba
nce
at 2
80 n
m
Extraction and purification of porins from Klebsiella pneumoniae… Amir H. Al–Shammary et al
Iraqi Journal of Medical Sciences 15
0
0.005
0.01
0.015
0.02
0.025
0.03
0.035
0.04
0 50 100 150 200 250 300
Concentration of LPS (mcg/ml)
Abs
orba
nce
at 5
50 n
m
Figure 2: SDS polyacrylamide gel electrophoresis of porins.
A. Standard proteins. B. Porins sample.
Figure 3: Standard curve of Lipopolysaccharides (LPS)
Ovalbumin43000 D
Porins 35000 D
Pepsin35000 D Trypsin inhibitor 20000 D
Porins 36000 D
Albumin 67000 D
A B
Extraction and purification of porins from Klebsiella pneumoniae… Amir H. Al–Shammary et al
Iraqi Journal of Medical Sciences 16
Porins have been purified from a number of gram negative bacteria. In all so far examined cases; the apparent molecular weights of the proteins are in the range of 30 to 45 kDa, while some of the porins can be purified as oligomers in SDS. They are usually acidic proteins and in many cases show association with peptidoglycan. In addition, outer membrane contains multiple species of porins. The separation of one porin from the other is difficult, for example, one can suppress the production of one or more porins through manipulation of culture conditions
Discussion
(7)
Among the outer membrane proteins found in gram-negative bacteria are the abundant porins which form diffusion channels for small molecules such as metabolizable sugars
.
(8)
It is well documented that disruption of cells will increase membrane protein yield. Thus, enzyme digestion was used to disrupt the bacterial cells, and the use of lysozyme – EDTA greatly enhances membrane destruction P
(9)P. Furthermore, the use of
DNase and RNase would result in degradation of nucleic acids and increasing the purity of proteins P
(10)P.
The protease resistance capability of the porins could be utilized for their isolation. For example, trypsine solubilizes practically all the proteins of the TX- treated envelopes degrading at the same time most of them with the exception of porins P
(3)P.
The results of this study are expectedly consistent with the results of Galdiero & Co-workers, (1994)P
(11)P
and Meghji P
P&Co-workers, (1997) P
(8)P
who mentioned that the purified porins from Salmonella typhimurium showed the two expected bands with molecular masses of 34 and 36 kDa and the purified porin from Pseudomonas aeruginosa showed two bands with a
molecular mass of 36 to 38 kDa, respectively. The apparent similarity of the results might indicate phyllogenetic relationship since outer membrane proteins are conserved, with minor differences, in all members of the gram negative bacteria.
Porins possess a high proportion of β-sheet structure, which traverses the membrane in a tightly packed β -barrel organization. This makes them relatively resistant to denaturation by SDS or other detergents at low temperature but not at higher temperatures P
(12)P. Therefore, porins
display different motilities when they were separated at low or high temperatures P
(13)P.
Porins usually have a strong association with LPS and it is difficult to obtain the proteins completely free of LPS contamination P
(14)P.
It is stated that, by binding to the lipid A of LPS, polymyxin B completely inhibits the strong cytopathic effect of this lipid whereas binding to the porins leaves the biological activity of the protein unmodified P
(P2TP
15P2TP
)P.
It is stated that a concentration of 0.5-1.0 mg/ml of LPS is required for in vitro cytotoxic effect P
(16)P. The results of
the current study revealed close proximity to that of Luo & Co-workers, (1997)P
(17)P when they
estimated LPS concentration of 0.418 µg of Ketodeoxyoctinate (KDO) / mg of protein. While in another study, it is mentioned that the content of LPS in porins preparations was in the order of 1 pg/mg of porin P
(7)P. Furthermore, 2Tin
another experiment to extract and purify porins from Pseudomonas aeruginosa, much lower value for LPS was recorded in the final preparation (about 20 2Tµg/ ml) which was neutralized by incubation with polymyxin B as mentioned above P
(P2TP
15P2TP
)P.
Extraction and purification of porins from Klebsiella pneumoniae… Amir H. Al–Shammary et al
Iraqi Journal of Medical Sciences 17
.
1. Henderson B, Poole S and Wilson M. Bacterial Modulins: A novel class of virulence factors which cause host tissue pathology by inducing cytokine synthesis. Microbiological rev. 1996; 60 (2):316–341.
References
2. Hernandez-Alles S, Alberti S, Alvarez D, Martinez-Martinez L, Gil J, Tomas J M and Benedi V J. Porins expression in clinical isolates of Klebsiella pneumoniae. Microbiology. 1999; 145:673–679. 3. Nurminen M. A mild procedure to isolate 34K, 35K, and 36K porins of the outer membrane of Salmonella typhimurium. FEMS Microbiol. Lett. 1978; 3:331–334. 4. Garfin DE. One-dimentional electrophoresis. In: Deutscher,M.P.(ed.), Methods in enzymology, 1990; vol.182, Pp :425-41. Academic press, New York. 5. Whitaker JR and Granum PE.An absolute method for protein determination based on difference in absorbance at 235 and 280 nm. Analytical Biochem. 1980; 109:156-159. 6. Hanson R S and Philip J A Chemical composition. In :Gerhardt P, Murry R GE, Costilow R N, Nester E W, Wood W A, Krieg N R and Phillips G B. (ed),Manual of methods for general bacteriology. American Society for Microbiology, Washington, D.C. 1981; PP: 328-364. 7. Nikaido H. Proteins forming large channels from bacterial and mitochondrial outer membranes: porins and phage lambda receptor proteins. Methods in Enzymol. 1983; 97:85–100. 8. Meghji S, Henderson B, Nair S P, and Tufano M A. Bacterial Porins Stimulate Bone Resorption. Infect. Immun. 1997; 65(4):1313-1361. 9. Johnson K J and Perry M B. Improved techniques for the preparation of bacterial lipopolysaccharides. Can. J. Microbiol. 1976; 22:29-34. 10. Nnalue NA, Khan GN and Mustafa N. Cross reactivity between six enterobacteriacae complete lipopolysaccharides core chemotyping. J. Med. Microbiol. 1999; 48:433-41. 11. Galdiero F, Sommese L, Scarfogliero P and Galdiero M. Biological activities: lethality, Shwartzman reaction and pyrogenicity of Salmonella typhimurium porins. Microb. Pathog. 1994; 16:111–119. 12. Koebnik R, Locher K P and Van Gelder P. Structure and function of bacterial outer membrane proteins: barrels in anutshell. Mol. Microbiol. 2000; 37:239-253. 13. Exner M M, Doig P, Trust T J and Hancock R E W. Isolation and Characterization of a Family of Porin Proteins
from Helicobacter pylori. Infect. Immun. 1995; 63(4):1567–1572. 14. Gulig P A and Hansen E J. Coprecipitation of lipopolysaccharide and the 39,000-molecular-weight major outer membrane protein of Haemophilus influenzae type b by lipopolysaccharide-directed monoclonal antibody. Infect. Immun. 1985; 49:819–827. 15. Buommino E, Morelli F, Metafora S, Rossano F, Perfetto B, Baroni A and Tufano
16. Fumarola D. Bacteriocin as cytotoxic agents: the role of possible contaminants. 1977; IRCS Med. Sci. 5:596.
M A. Porin from Pseudomonas aerogenosa Induces Apoptosis in an Epithelial Cell Line Derived from Rat Seminal Vesicles. Infect. Immun. 1999; 67 (9):4794-4800.
17. Luo Y, Glisson J R, Jackwood M W, Hancock R E W, Bains M, Cheng I N and Wang C. Cloning and Characterization of the Major Outer Membrane Protein Gene (ompH) of Pasteurella multocida X-73. J. Bacteriol. 1997; 179 (24):7856–7864.
Iraqi Journal of Medical Sciences 18
Evaluation of the role of erythrocyte deformation on erythrocytes aggregation and sedimentation rate using He-Ne laser scattering
Rowaida A. Al-khazragi MSc.
UAbstract Background: The erythrocyte aggregation is an important physiological phenomenon in the circulation of blood. It is a basic characteristic of normal blood that plays a major role in the cardiovascular system, especialy in the microcirculation. Objective: To evaluate the role of deformability of red blood cells on the aggregation and sedimentation of red blood cells. Subjects & Method: The present study was carried out on thirty two healthy subjects. Laser scattering method was employed for this study. From scattered light intensity, profiles continuously obtained during aggregation and sedimentation of the aggregated erythrocytes. Different values of erythrocyte deformability were determined and evaluate their effects on each phase of the erythrocyte aggregation and
sedimentation, rouleaux formation, one- dimensional aggregate and three- dimensional aggregate formation. Results: Deformability values are expressed in term of rigidity index, the difference between medium and high rigidity index significantly decreased the rate of aggregation and the rate of three dimensional aggregate sedimentation. Conclusion: Variation of the values of erythrocyte deformability from low to medium and from medium to high showed different effects on aggregation and sedimentation stages. Keywords: Erythrocyte aggregation, sedimentation rate, deformability, laser light. IRAQI J MED SCI, 2009; VOL.7 (2):18-25
UIntroduction
Erythrocytes aggregation and disaggregation are natural phenomena in the circulation of blood P
(1)P. Aggregation
of red blood cells is the formation of reversible structure containing a number of particles, while erythrocytes sedimentation monitors the tendency of red blood cells to form aggregates in plasma P
(2)P.
The formation of clumps of red blood cells under low or non-flow conditions, result from the attraction forces between the red blood cells. The cells adhere to each other in rouleaux aggregates. Slight mechanical force, such that occurs in the circulation, Dept. Physiology, College of Medicine, AL-Nahrain University. Adress Correspondence to: Dr. Rowaida A. Al-khazragi . E- mail: [email protected] Received: 6th November 2008, Accepted: 6th May 2009.
is enough to disperse these aggregates. The process of aggregation affected
by many physical and chemical factors. Chemical factors are concerned with modifications of either erythrocytes or suspending medium such as hematocrite, PH of the suspending medium, macromolecules and flow conditions P
(3,4)P.
Some investigations have pointed out the importance of cellular modifications to the erythrocyte aggregation, especially in relation to erythrocyte deformability, and erythrocyte filterability, (Ability of erythrocytes to change shape as they pass through narrow spaces, such as the microvasculare) P
(5)P.
The role of RBCdeforwation on ESR.…Rowaida A. Al-khazragi
Iraqi Journal of Medical Sciences 19
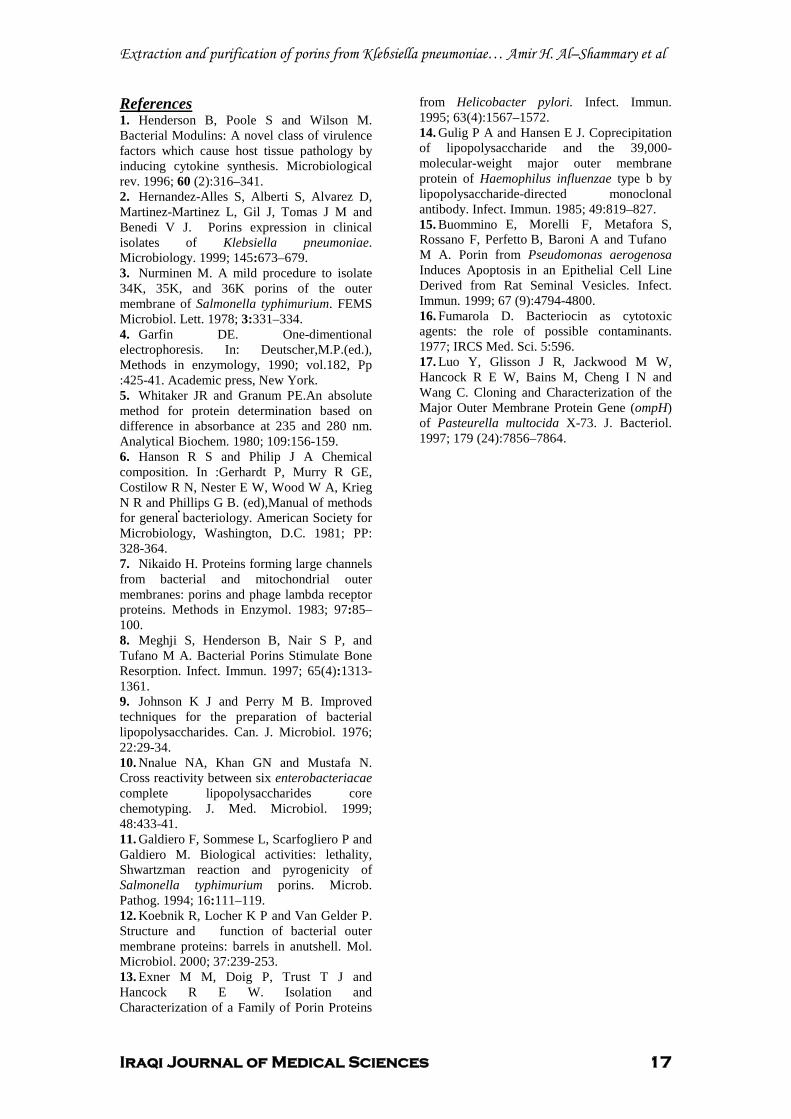
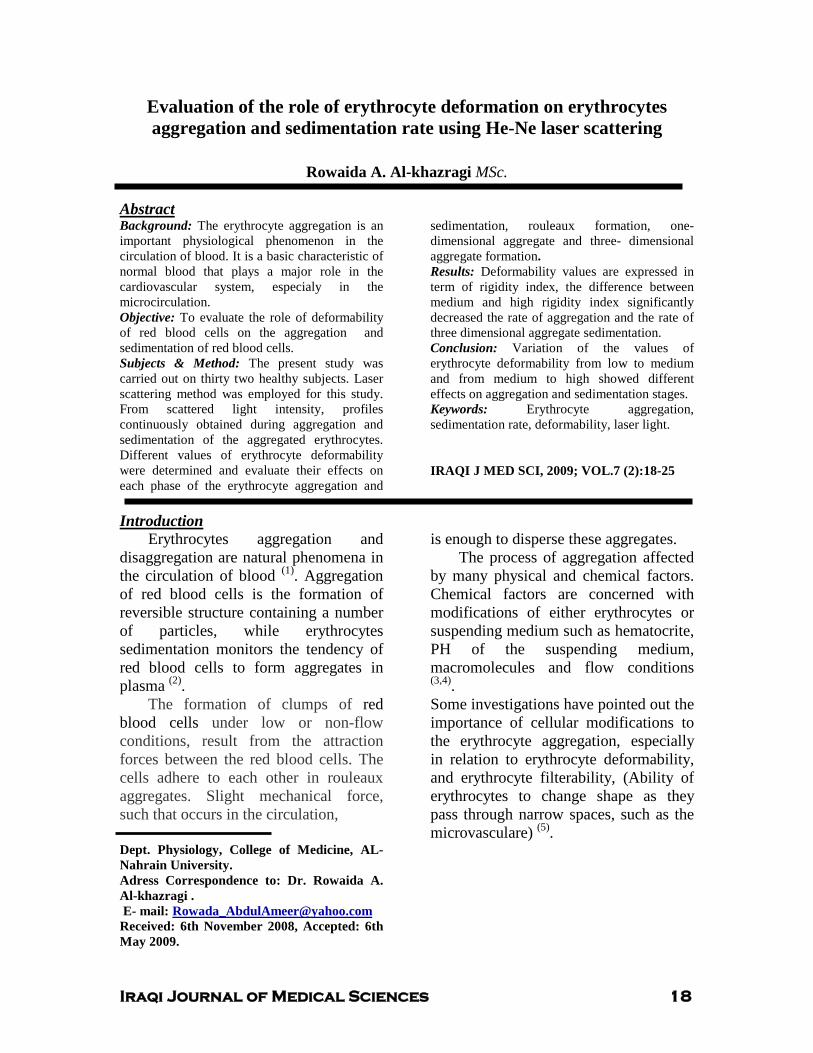
Figure 1: Erythrocyte deformability when passing through microcirculation In large blood vessels, the resistance
to blood flow depends to minor degree on blood viscosity but mostly upon the diameter of the vessels. This is due to the laminar blood flow and the deformability of erythrocytes under the high shear rate which reduce the viscosity of blood makes it ineffective. While the resistance to blood flow in the capillaries depends mainly on viscosity of the blood and erythrocyte aggregation under the low shear rate which increase blood viscosity (6)
The true capillaries are about 5 µm in diameter at the arterial end and 9 µm at the venous end, and since the red blood cells are flat disks of about 7 µm in diameter, thus when the sphincters are dilated, the diameter of the capillaries is just sufficient to permit erythrocyte to squeeze through in a "single file". Erythrocyte is a "bag" that can be deformed into almost any shape. This is because the normal cell has a great excess of cell membrane for the quantity
of material inside, and due to the pliability of the cell membrane. Deformation does not stretch the membrane greatly & consequently does not rupture the cells as would be the case with old erythrocytes
.
(6,7,8).
The present study depend on a modified method of E. Muralidharan, in Biorheology, 1994,
Materials and methods
(9)
Five ml of fresh blood samples were drawn from the cubital vein of 32 healthy human subjects using heparin (0.03/5ml of blood), as anticoagulant, into a sterilized tube. 1 ml of the blood was used to measure the ESR (erythrocyte sedimentation rate) by Westergren method. Any record above 15 mm/hr for males and above 20 mm/hr for females) was excluded from the study (According to Bottlger, 1967)
.Which work on the same principle of laser light scattering.
(10)
Four ml of the rest blood sample was put in centrifuge to separate erythrocytes from plasma and WBC coat
.
The role of RBCdeforwation on ESR.…Rowaida A. Al-khazragi
Iraqi Journal of Medical Sciences 20
(3000 rpm for 10 minutes at 4°C). After removal of plasma & WBC coat, the erythrocytes were washed 3 times with iced cold normal saline (0.9% NaCl) and then re-centrifuge the sample again (3000 rpm for 10 minutes at 4 °C) to remove any particles that may be attached to the erythrocyte membrane. Physiological measurements: The measurement of erythrocyte deformability: It was carried out by measuring the filtration time of the following two solutions: The first solution 2 ml consisted of 5% of packed erythrocytes suspension prepared by mixing 100 µl of packed
erythrocytes with 1900 µl of suspending medium. (The packed erythrocytes were already washed three times with ice cold 0.9% NaCl as mentioned above). The second solution (2 ml) was of cell free suspending medium. The suspending medium was prepared from the following chemicals: (150 mM KCl, 0.5 mM Na3
The pH of the solution was 7.4 at room temperature.
EDTA, 10 mM Tris-HCl )
The filtration was through Whatman filter paper (number 1). The deformability values were expressed in term of rigidity index (RI):
Filtration time of 2 ml 5% packed erythrocytes suspension
RI = ------------------------------------------------------------------------------- Filtration time of 2 ml of cell free suspending medium
This method was described by Al- Gailani and Al- Remadani (1998) (11)
The blood sample preparation: .
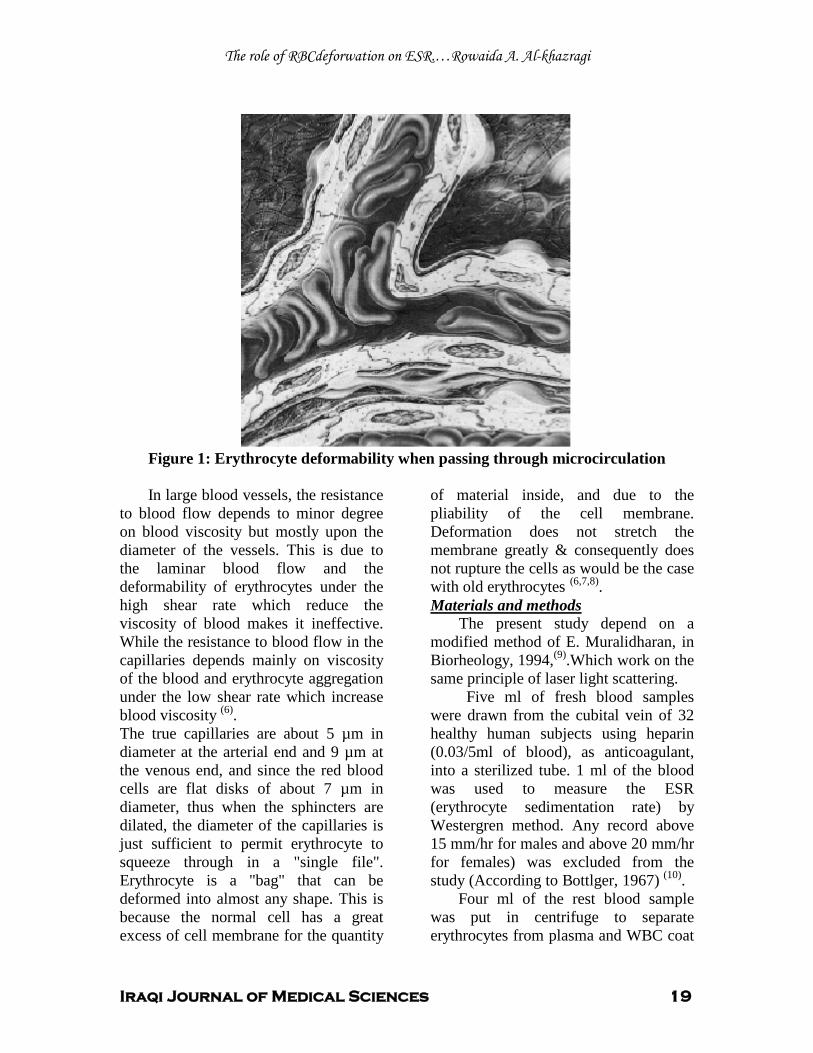
To prepare the sample, 800 µl of dextran ( mol. Wt.500.000) was added to phosphate buffered saline (P.B.S.) solution (50mM Sodium Phosphate, 3mM KCl, 90mM NaCl, 0.1g/dl D-glucose, PH 7.4), then 100 µl of bovine serum albumin of 0.5g/dl concentration was added to the tube, to prevent adhesion between RBCs and the wall of chamber, followed by addition of 100 µl of packed erythrocytes to get, after mixing, sample of 10% PCV. The experiments were carried out at room temperature. The system of the measurement is shown in Figure 2; it is compose of a linear polarized He- Ne laser source, of wave length 632.nm, (Griffin Co.), and
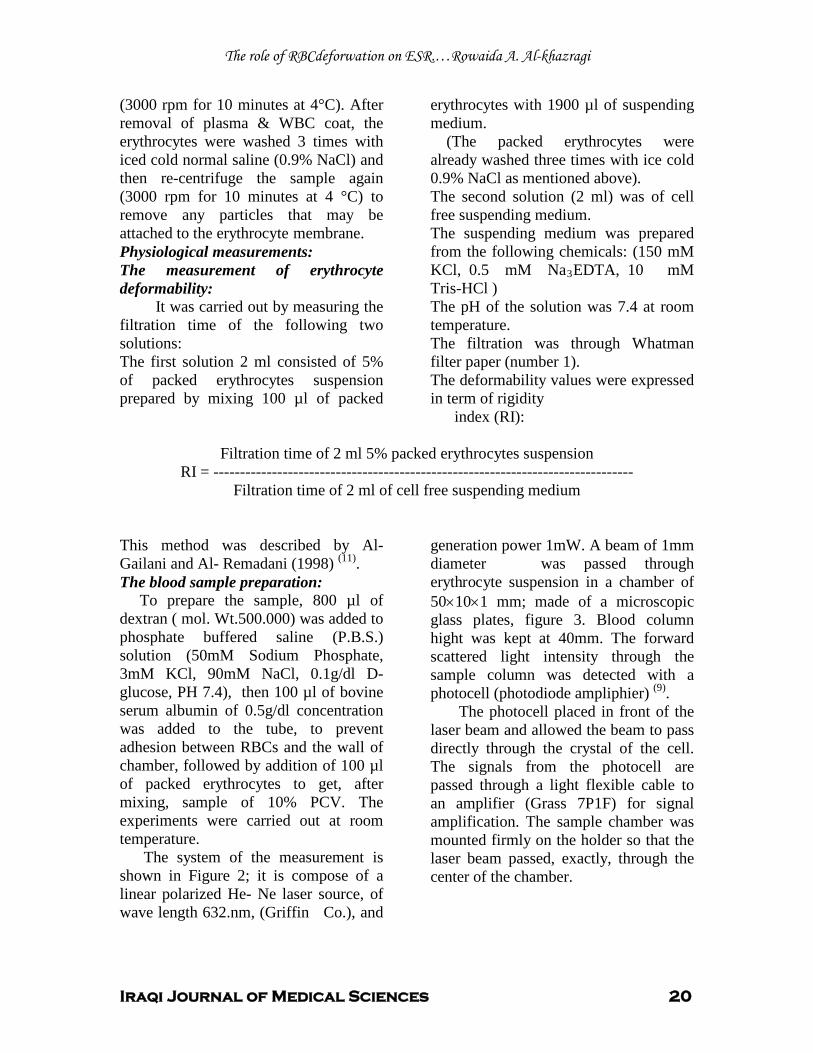
generation power 1mW. A beam of 1mm diameter was passed through erythrocyte suspension in a chamber of 50×10×1 mm; made of a microscopic glass plates, figure 3. Blood column hight was kept at 40mm. The forward scattered light intensity through the sample column was detected with a photocell (photodiode ampliphier) (9)
The photocell placed in front of the laser beam and allowed the beam to pass directly through the crystal of the cell. The signals from the photocell are passed through a light flexible cable to an amplifier (Grass 7P1F) for signal amplification. The sample chamber was mounted firmly on the holder so that the laser beam passed, exactly, through the center of the chamber.
.
The role of RBCdeforwation on ESR.…Rowaida A. Al-khazragi
Iraqi Journal of Medical Sciences 21
He-Ne laser source sample chamber photo-ampliphier x-y recorder (Grass 7P1F)
Figure.2: The system layout
The blood sample was gently introduced into the chamber by using a syring with long needle. Immediately
after the sample was introduced, the forward- light signal was continuously recorded by the system.
Figure 4 shows the pattern of rouleaux formation, one-dimensional aggregate and three- dimensional aggregate formation curve, with sample
of 10%PCV as it recorded by laser assessed aggregometry used in this study.
Results
1mm
1mm 10 mm
1mm Φ 40mm
Figure. 3: Schematic diagram of an arrangement of light scattering experimental
system (Muralidharan, 1994)
The role of RBCdeforwation on ESR.…Rowaida A. Al-khazragi
Iraqi Journal of Medical Sciences 22
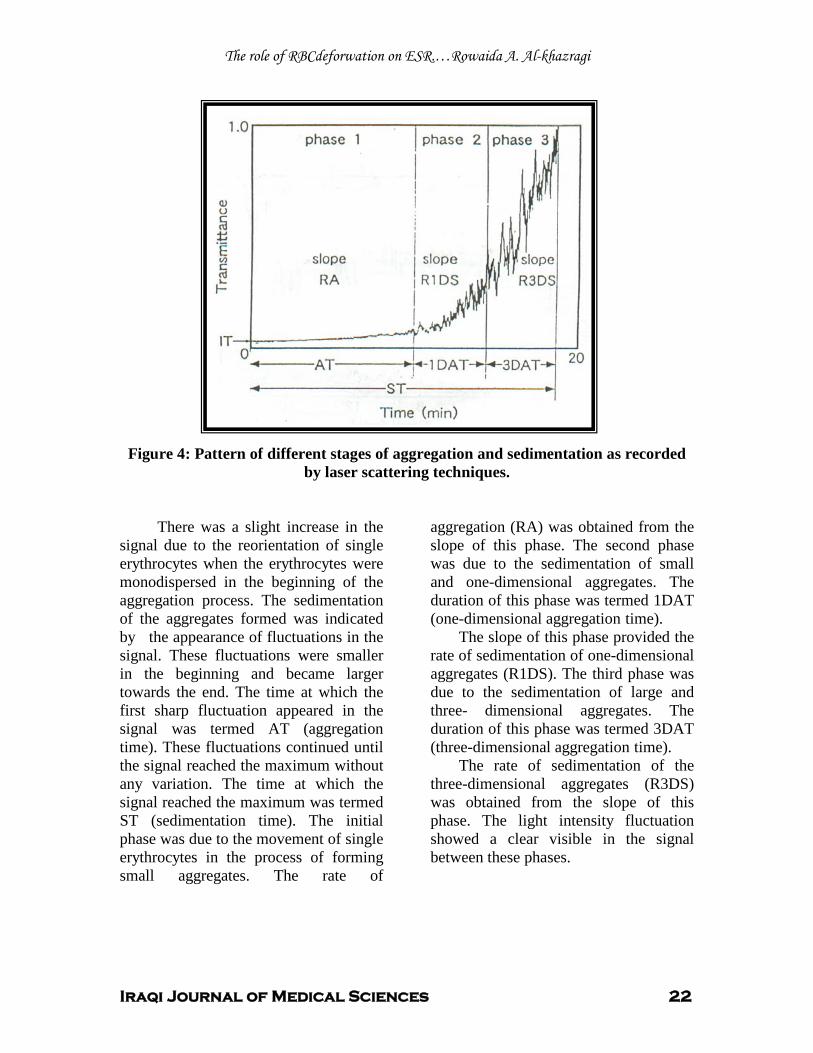
Figure 4: Pattern of different stages of aggregation and sedimentation as recorded by laser scattering techniques.
There was a slight increase in the signal due to the reorientation of single erythrocytes when the erythrocytes were monodispersed in the beginning of the aggregation process. The sedimentation of the aggregates formed was indicated by the appearance of fluctuations in the signal. These fluctuations were smaller in the beginning and became larger towards the end. The time at which the first sharp fluctuation appeared in the signal was termed AT (aggregation time). These fluctuations continued until the signal reached the maximum without any variation. The time at which the signal reached the maximum was termed ST (sedimentation time). The initial phase was due to the movement of single erythrocytes in the process of forming small aggregates. The rate of
aggregation (RA) was obtained from the slope of this phase. The second phase was due to the sedimentation of small and one-dimensional aggregates. The duration of this phase was termed 1DAT (one-dimensional aggregation time).
The slope of this phase provided the rate of sedimentation of one-dimensional aggregates (R1DS). The third phase was due to the sedimentation of large and three- dimensional aggregates. The duration of this phase was termed 3DAT (three-dimensional aggregation time).
The rate of sedimentation of the three-dimensional aggregates (R3DS) was obtained from the slope of this phase. The light intensity fluctuation showed a clear visible in the signal between these phases.
The role of RBCdeforwation on ESR.…Rowaida A. Al-khazragi
Iraqi Journal of Medical Sciences 23
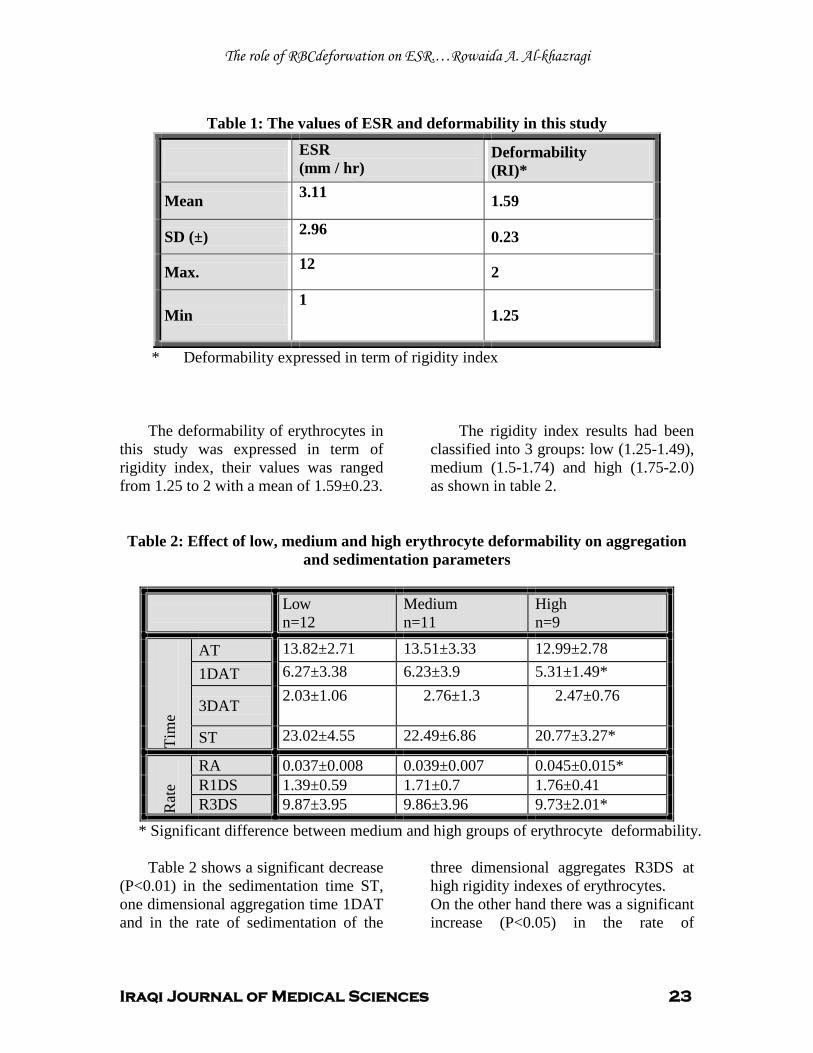
Table 1: The values of ESR and deformability in this study
Deformability (RI)*
ESR (mm / hr)
1.59 3.11 Mean
0.23 2.96 SD (±)
2 12 Max.
1.25 1
Min
* Deformability expressed in term of rigidity index
The deformability of erythrocytes in this study was expressed in term of rigidity index, their values was ranged from 1.25 to 2 with a mean of 1.59±0.23.
The rigidity index results had been classified into 3 groups: low (1.25-1.49), medium (1.5-1.74) and high (1.75-2.0) as shown in table 2.
Table 2: Effect of low, medium and high erythrocyte deformability on aggregation and sedimentation parameters
Low n=12
Medium n=11
High n=9
Tim
e
AT 13.82±2.71 13.51±3.33 12.99±2.78 1DAT 6.27±3.38 6.23±3.9 5.31±1.49*
3DAT 2.03±1.06 2.76±1.3 2.47±0.76
ST 23.02±4.55 22.49±6.86 20.77±3.27*
Rat
e
RA 0.037±0.008 0.039±0.007 0.045±0.015* R1DS 1.39±0.59 1.71±0.7 1.76±0.41 R3DS 9.87±3.95 9.86±3.96 9.73±2.01*
* Significant difference between medium and high groups of erythrocyte deformability.
Table 2 shows a significant decrease (P<0.01) in the sedimentation time ST, one dimensional aggregation time 1DAT and in the rate of sedimentation of the
three dimensional aggregates R3DS at high rigidity indexes of erythrocytes. On the other hand there was a significant increase (P<0.05) in the rate of
The role of RBCdeforwation on ESR.…Rowaida A. Al-khazragi
Iraqi Journal of Medical Sciences 24
aggregation RT at high rigidity indexes of erythrocytes.
Some investigators have pointed out the importance of cellular modifications to the erythrocyte aggregation especially in relation to erythrocyte deformability. The contributions of the cellular alterations to the erythrocyte aggregation are smaller in magnitude, but the influence is significant
Discussion
(5)
The major determinants of the ability of deformation (deformability) of erythrocyte are enhanced by:
.
a. Extracellular viscosity. (12)
b. Membrane stiffness. c. Cell geometry (surface area
/volume ratio). In the present study the
deformability expressed in term of rigidity index (membrane stiffness) of erythrocyte.
When we compared the deformability results (RI) in this study with the aggregation stages and sedimentation, there was a significant decrease in the time needed for one dimensional aggregate formation (1DAT) and for sedimentation and significant increase in the rate of aggregation at high (RI) of erythrocyte, this is due to the presence of the macromolecules, which play the main role in the first stage of the aggregation process. The macromolecules act as a bridge and permit the RBCs to slide on each other to form rouleaux in the suspending medium (13, 14)
On the other hand, there was a significant decrease in the rate of the third stage (3DAS) at high (RI) of erythrocyte, this is due to decreased the deformability of erythrocytes, because the third stage of aggregation process depend on the shape and the deformability of erythrocytes and
decreased the erythrocytes deformability made the size of the aggregate formed by erythrocytes of high (RI) are small, and the erythrocytes in this stage (three dimensional aggregates) are loosely packed
.
(15,16)
This study showed different values of deformability have causes different effects on the three stages of aggregation and in turn on sedimentation.
.
1. Muralidharan E. Simultaneous determination of hematocrit, aggregation size, and Sedimentation velocity by He-Ne Laser scattering. Biorheology. 1994; Vol. 31. No. (5), PP. 587-599.
References
2. Dintenfass L. Development of the Blood Viscosity fetors. In: Blood Viscosity, Hyperviscosity & Hypoviscosity, 1985; PP45-112. MTP press Limited, Lancaster. 3. Bertoluzzo S M, Bollini A, Rasia M, and Rayual A. Kinetic Model for Erythrocyte Aggregation. Blood Cells. Molecules and Diseases. 1999; Vol. 25 (22) PP. 339-349. 4. (ICSH) International Committee for Standardization in Hematology Expert Panel on Blood Rheology: Guidelines on Selection of Laboratory Test for Monitoring the Acute Phase Response. In: Journal of Clinical Pathology. 1988; Vol. 41 pp. 1203-1212. 5. Muralidharan E,Tateishi N, Maeda N. Simultaneous influence of deformability and macromolecules in the medium on erythrocyte aggregation: imultaneous influence of erythrocyte deformability and macromolecules in the medium on erythrocyte aggregation: a kinetic study by a laser scattering technique. Biochimica et Biophysica Acta.1994; 1194: 255-263. 6. Ganong W F .Review of medical physiology. 2oth edition, Lange Medical books /McGraw-Hill, USA. 2001; Pp556. 7. Timmerman H. Calcium modulation and clinical effect, profile of cyclandelate. Drugs. 1987; 33(2): 1-4. 8. Guyton A C and Hall J E. Textbook of medical physiology. 10th edition, W.B. Saunders Company, USA. 2000. 9. Muralidharan E, Tateish N, and Maeda N. A New Laser Photometric Technique for the Measurement of Erythrocyte Aggregation and Sedimentation Kinetics. Biorheology. 1994; Vol. 31. No. (3), PP. 277-285. 10. Bottilger L E and Svedberg CA (1967): Normal erythrocyte sedimentation rate and age.

The role of RBCdeforwation on ESR.…Rowaida A. Al-khazragi
Iraqi Journal of Medical Sciences 25
British medical Journal, 2: 85-87. Cited by Brigden, M.L. Clinical utility of erythrocyte sedimentation rate. American Family Physician. 1999; 60: 1443-1450. 11. Al-Gailani BT and Al-Remadani R A. (1998): Effect of glucose and insulin on the deformability of red blood cells of healthy subjects and patients with insulin dependent diabetes mellitus. Medical Science Research, 26: 749-752. Cited by Al-Gailani B T. The effect of ATP depletion and discocyte-echinocyte transformation on the physical properties of erythrocytes. Iraqi Journal of Community Medicine. 2001; 14(2): 317-321. 12. Hanss M, and Koutsouris D. Erythrocyte Deformability and Diabetes. Biophys. Acta.1984; Vol. 769: pp. 461-470. 13. Lerche D. Theoretical aspects of RBC aggregation and methods of experimental quantification. Internet address: http://www.lum-gmbh.de/ . Accessed at. 2001; 29/1/2004. 14. Shiga T, Maeda N, and Kon K. Erythrocyte rheology. Criticcal Reviews on Oncology, Hematology. 1990; 10: 119-148. 15. Chabanel A, Reinhart W, and Chien S. Increased resistance to membrane deformation of shape-trasformed human red blood cells. 1987. 16. Singh M and Kumaravel M. A computerized system for sequential analysis of aggregation of erythrocytes under dynamic conditions. Computers and Biomedical Research. 1994; 27: 325-336.
Iraqi Journal of Medical Sciences 26
Cystinuria in a group of children in Iraq
Shatha Hussain Ali CABP.
UAbstract Background: Cystinuria is an autosomal recessive defect in reabsorptive transport of Cystine and dibasic amino acids. Increased urinary excretion of Cystine, the least soluble of all amino acids, results in formation of stones. Objectives: we report our experience with management of cystinuria in a group of Iraqi children. Patients and Methods: from 1999 to 2006, all children with cystinuria were evaluated, treated and followed in Al – Kadhimiya Teaching Hospital. Results: Twenty three patients with cystinuria having calculi (16 males, 7 females) were treated. Their age ranged from 10 months to 18 years. Associated hyperuricosuria was recorded in 30.5%, hypercalciuria in 13% and hyperoxaluria in 4.3%. Follow up period ranged from 1 – 88 months. Nine patients were treated with increased oral fluids and alkalis only.
D–Penicillamine therapy was given to 13 patients. Side effect to penicillamine was noticed in 4 patients (22.2%). Captopril was given to 4 patients. Extracorporeal shock wave lithotripsy (ESWL) was performed in 8 patients, and 18 patients underwent open surgical procedures. The stone free rate was 55.6% with fluids and alkali alone, 58.3% with D–Penicillamine, 0% with Captopril and 50% with ESWL. Combined treatments were required in 45% of patients. Stone recurrence rate was 70%. Conclusion: Oral fluids and alkali was most successful when used in patients with mild disease. D–Penicillamine and ESWL had nearly equal rate of successful results. Keywords: cystinuria, chlidren, calculi, urolithiasis IRAQI J MED SCI, 2009; VOL.7 (2):26-34
UIntroduction
Cystinuria is an autosomal recessive defect in reabsorptive transport of Cystine and dibasic amino acids: Ornithine, Arginie and Lysine from the luminal fluid of the renal proximal tubules and small intestine P
(1 – 10)P.P
P
PIncreased urinary excretion of
Cystine (the least soluble of all amino acids) results in Cystine crystallization and formation of stones P
(1 – 10)P.
P
PCystinuria is the cause of 1 – 2% of
stones observed in adults and up to 10% of those occurring in children P
(1, 3, 4, 8)P.
Dept. Pediatrics,College of Medicine, Al– Nahrain University. Adress Correspondence to: Dr. Shatha Hussain Ali. P. O. Box 70074, Mobile: + 964 07901479929 E-mail: [email protected] Received: 14 P
thP December 2008, Accepted:6 P
thP
May 2009.
In 1966, Rosenberg et al, described three types of Cystinuria according to urinary phenotype: І, П, Ш P
(1 – 5, 8, 10)P.
A new classification of the disease by the International Cystinuria Consortium follows the chromosomal localization of the mutation with type an on chromosome 2, type B on chromosome 19 and type AB on both chromosomes P
(1,
4, 8)P. The only phenotypic manifestation of
Cystinuria is Cystine urolithiasis, begins in the first decades and often recurs throughout a patient’s life timeP
(1, 3, 4, 10)P.
Surgical intervention is often necessary, but the cornerstones of treatment is medical prevention of recurrent stone formation P
(1, 3, 4, 8, 10)P.
UAim of study To report our experience with
presentation, management, clinical
Cystinuria in children in Iraq… Shatha Hussain Ali
Iraqi Journal of Medical Sciences 27
course and outcome of a group of Iraqi children with Cystine urolithiasis.
This prospective study was conducted in the Pediatric Nephrology Clinic in Al - Kadhyimia Teaching Hospital in Baghdad between January 1999 and April 2006.
Patients and methods
Twenty-three children with Cystinuria, were evaluated, treated and followed.
Clerking included recording age, gender, age of onset of symptoms, age of diagnosis of stone disease, clinical presentation, past medical and surgical history, recurrence and family history of stone disease.
Every child was tested for plasma urea, creatinine, sodium, potassium, calcium, phosphorous, uric acid and alkaline phosphatase level. Their urine was analyzed by microscopy and cultured.
Twenty four hour urinary determination of calcium, oxalate and uric acid was done to all children. They remained on their usual diet. In the morning, their first specimen of urine was discarded; urine was then collected for 24 hours. In young children who are not toilet trained, urine was collected by use of adhesive urine bags. For older children, collection was into container.
Hypercalciuria (HCa) was defined as urine Calcium excretion of > 4 mg/ Kg/ 24 hr. (6, 11, 12, 13). Hyperoxaluria (HOx) was defined as urine Oxalate excretion of > 55 mg/ 1.73 m2/ 24 hr (6,
12, 13). Hyperuricosuria (HUr) was defined as Uric acid excretion of > 815 mg/ 1.73 m2/ 24 (6, 12, 13). Urine amino acid excretion was tested in all children using thin layer chromatography as well as Cyanide – Nitroprusside test (5, 14)
Stones, when available, were analyzed chemically.
.
Patients were diagnosed as having Cystinuria on the basis of one or more of the following criteria: 1. Cystine crystalluria: was observed in 2 patients (18.7%) on urinalysis (1, 4, 5, 8,
10, 12)
2. Positive Cyanide – Nitroprusside test in all patients.
.
(1, 4, 5, 8, 9, 12, 15)
3. Detection of urinary excretion of amino acids Cystine, Ornithine, Arginine and Lysine by thin layer Chromatography in all patients
.
(5, 10, 12,
14).
4. Cystine (pure or mixed) composition of calculi obtained from 10 patients by chemical analysis
.
(1, 4, 5)
All stones were documented radiologically by Renal Ultrasonography (US) and Intravenous Pyelography (IVP). Voiding Cystourethrography (VCUG) was done when Vesicoureteric Reflux (VUR) was suspected.
.
Treatment Programs included: 1. Oral fluids and Alkali: All patients were instructed to maintain a fluid intake throughout day and night to ensure at least 1.2 L – 2 L / m2 or 40 ml/ Kg/ day of urine daily. The urine should be kept very light in color approaching that of tap water making it a habit to observe this aspect with each voiding (16). Adequate hydration was monitored on follow up visits every 1-2 months by checking the specific gravity achieving 1.010 (1)
2.Alkalinization of urine to a PH at about 7.5 throughout the day and night was accomplished with oral administration of alkali in the form of Potassium Citrate 60 – 80 Meq/ day or Sodium Bicarbonate 0.2 g/ Kg/ day in divided doses. Dose was adapted to urinary pH. Checking urine PH was done by the patients at home using urine strip and in laboratory on follow up visits. Moderate salt intake was
.
Cystinuria in children in Iraq… Shatha Hussain Ali
Iraqi Journal of Medical Sciences 28
instructed to all patients, not to add salt to their diet (1, 3, 4, 8, 9, 10, 12). Limit intake to 50 mmol/ day (3)
3. D– Penicillamine (DP). : Starting dose of 20 mg/ Kg/ day was increased gradually up to 40 mg/ Kg/ day given orally in 2 - 4 divided doses with half the dose given at bed time
.
(1, 3, 4, 8, 12)
4. Captopril: Given orally in a dose of 2 mg/ Kg/ day with observation of blood pressure
. Most of the patients received 3 divided doses
(1, 3, 4)
5. Extracorporeal shock wave lithotripsy (ESWL): ESWL was performed using the Siemens Lithostar lithotripter. Youngest patient among our series was 12 month of age.
. The patients were given 2 divided doses.
6. Open Surgical Procedures done with cooperation of urology surgeons. Outcome of various treatment modalities were categorized as: stone free, no change, decreased size and increased stone size (5) .
Total number of patients was 23. Males were 16, females were 7. Their age ranged from 10 months to 18 years (median = 46 months and mean of 69.7 ± 12.8 months). The age at onset of first symptom attributable to stone disease ranged from 2 to 132 months (median = 17 months and mean of 35.1 ± 7.9 months). Age at the time of diagnosis of Cystinuria ranged from 2 to 132 months (median = 17 months and mean of 38.6 ± 8 months). Sixteen patients were diagnosed as cystinuria at their initial clinical presentation. Majority of patients (78.3%) had the onset of stone disease before 5 years of age. Sixteen patients (69.6%) recalled a family history of stone disease, 12 of 16 (75%) had parental consanguinity. The clinical presentation is shown in table 1. Most patients presented with passing stones
spontaneously (52.2%) and gross hematuria (47.8%). Four patients presented with failure to thrive (FTT), one of them had associated celiac disease, the 2nd had recurrent UTI, the 3rd catch up growth on follow up and he was stone free and the 4
Results
th
Calculi were located in the left Kidney of 13 patients (56.6%), in right kidney of 5 patients (21.7%) and bilaterally in 4 (17.4%). One patient had vesical and left ureteric stones in addition to both kidneys (4.3%).
was lost to follow. Associated culture proven Urinary Tract Infection (UTI) was present in 9 patients (39.1%), 3 of them were symptomatic. None had vesicoureteric reflux (VUR). No anatomical anomalies were detected on imaging studies.
Staghorn calculi were seen in 4 patients (17.4%). It was bilateral in 2 of them; with recurrent UTI while it was unilateral in the other 2 with sterile urine. Stones were analyzed from 10 patients (43.5%). They were composed of Cystine in 4, mixed Cystine with Calcium Phosphate or Oxalate in 4, Cystine with Uric acid in 1 and mixed Cystine, Uric acid and Calcium Phosphate in 1, see table 2. In 4 out of 6 patients with mixed calculi there were associated metabolic disorders (66.6%). Overall associated HUr was recorded in 7 patients (30.4%), HCa in 3 (13%) and HOx in one (4.3%).
The length of follow up ranged from 1 to 88 months (median = 9 months and mean = 28.7 ± 6.6 months). No follow up information were available in 3 patients. Ten patients were observed for 3 years.
Nine patients were treated with increased oral fluids and alkali. Three of those 9 patients were stone free at beginning of this therapy. In 1, the stone
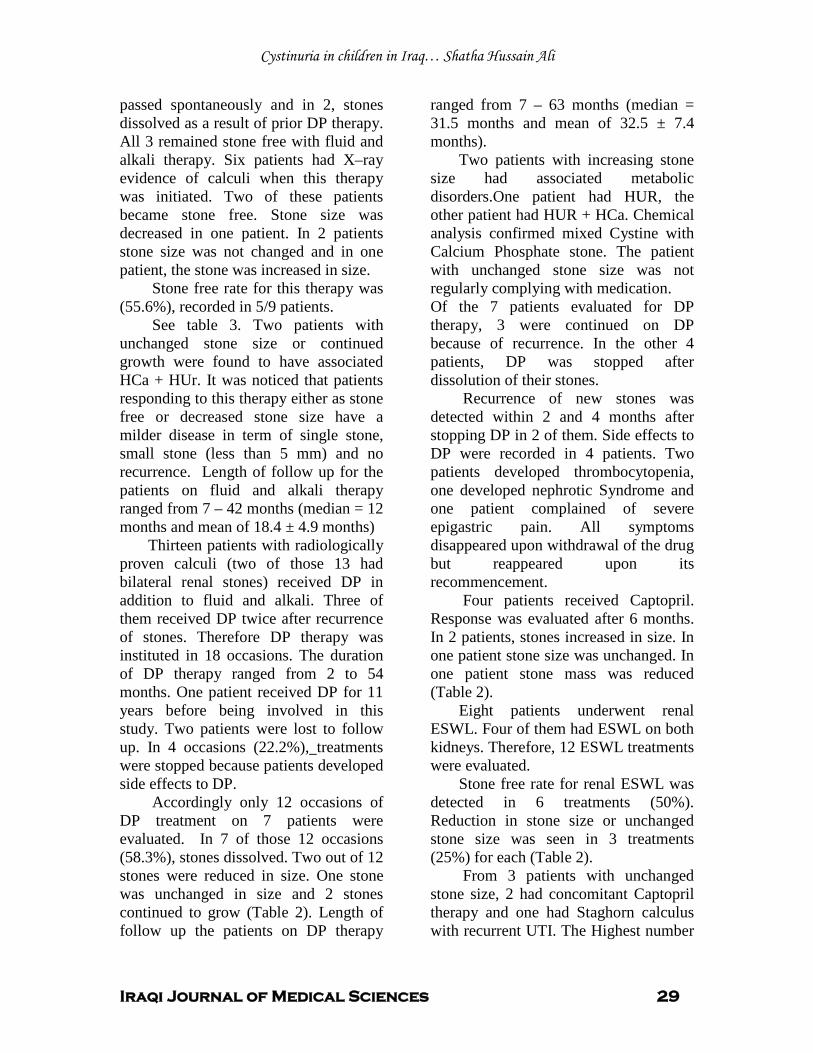
Cystinuria in children in Iraq… Shatha Hussain Ali
Iraqi Journal of Medical Sciences 29
passed spontaneously and in 2, stones dissolved as a result of prior DP therapy. All 3 remained stone free with fluid and alkali therapy. Six patients had X–ray evidence of calculi when this therapy was initiated. Two of these patients became stone free. Stone size was decreased in one patient. In 2 patients stone size was not changed and in one patient, the stone was increased in size.
Stone free rate for this therapy was (55.6%), recorded in 5/9 patients.
See table 3. Two patients with unchanged stone size or continued growth were found to have associated HCa + HUr. It was noticed that patients responding to this therapy either as stone free or decreased stone size have a milder disease in term of single stone, small stone (less than 5 mm) and no recurrence. Length of follow up for the patients on fluid and alkali therapy ranged from 7 – 42 months (median = 12 months and mean of 18.4 ± 4.9 months)
Thirteen patients with radiologically proven calculi (two of those 13 had bilateral renal stones) received DP in addition to fluid and alkali. Three of them received DP twice after recurrence of stones. Therefore DP therapy was instituted in 18 occasions. The duration of DP therapy ranged from 2 to 54 months. One patient received DP for 11 years before being involved in this study. Two patients were lost to follow up. In 4 occasions (22.2%), treatments were stopped because patients developed side effects to DP.
Accordingly only 12 occasions of DP treatment on 7 patients were evaluated. In 7 of those 12 occasions (58.3%), stones dissolved. Two out of 12 stones were reduced in size. One stone was unchanged in size and 2 stones continued to grow (Table 2). Length of follow up the patients on DP therapy
ranged from 7 – 63 months (median = 31.5 months and mean of 32.5 ± 7.4 months).
Two patients with increasing stone size had associated metabolic disorders.One patient had HUR, the other patient had HUR + HCa. Chemical analysis confirmed mixed Cystine with Calcium Phosphate stone. The patient with unchanged stone size was not regularly complying with medication. Of the 7 patients evaluated for DP therapy, 3 were continued on DP because of recurrence. In the other 4 patients, DP was stopped after dissolution of their stones.
Recurrence of new stones was detected within 2 and 4 months after stopping DP in 2 of them. Side effects to DP were recorded in 4 patients. Two patients developed thrombocytopenia, one developed nephrotic Syndrome and one patient complained of severe epigastric pain. All symptoms disappeared upon withdrawal of the drug but reappeared upon its recommencement.
Four patients received Captopril. Response was evaluated after 6 months. In 2 patients, stones increased in size. In one patient stone size was unchanged. In one patient stone mass was reduced (Table 2).
Eight patients underwent renal ESWL. Four of them had ESWL on both kidneys. Therefore, 12 ESWL treatments were evaluated.
Stone free rate for renal ESWL was detected in 6 treatments (50%). Reduction in stone size or unchanged stone size was seen in 3 treatments (25%) for each (Table 2).
From 3 patients with unchanged stone size, 2 had concomitant Captopril therapy and one had Staghorn calculus with recurrent UTI. The Highest number
Cystinuria in children in Iraq… Shatha Hussain Ali
Iraqi Journal of Medical Sciences 30
of ESWL treatments was 7 on a left kidney in a patient with recurrent bilateral calculi.
Three ESWL treatments were performed in each of 5 patients. One ESWL treatment was performed in each of 3 patients. Length of follow up of the patients on ESWL ranged from 4 – 80 months (median = 47 months and mean of 40.9 ± 8.7 months)
Twelve patients had a total of 18 open surgical removals of stones. Seven (38.9%) surgical procedures were performed in 5 patients before referral to Al–Kadhymia hospital. One of those 5 had 3 open surgeries on the left Kidney.
Thirteen (72.2%) operations were renal, 3 (16.7%) on the ureter and 2 (11.1%) on the Bladder. Fifteen surgeries were done before medical therapy while 3 were done after medical treatment.
From 20 patient’s follow up data, 12 patients (45%) required combined treatments in which more than one treatment modality was used. Fourteen patients developed 27 episodes of recurrence of stone disease (70%), one of them had 4 episodes of recurrence, 4 had 3, 2 had 2 and 7 patients had one recurrence.
Table 1: Clinical presentation of 23 patients with cystinuria
Clinical presentation No. of patients (%) Passing stones/ gravels 12 52.2 Gross hematuria 11 47.8 UTI 9 39.1
8 Abdominal Pain 34.8 Dysuria 6 26.1 Failure to thrive 4 17.4
*Patient may had more than one clinical presentation
Table 2: Stone chemical analysis of 10 patients STONE COMPOSITION No.
Pure Cystine 4 Cystine + Calcium Phosphate or Calcium Oxalate 4 Cystine + Uric acid 1 Cystine + Uric acid + Calcium Phosphate 1
Table 3: Treatment modalities and clinical outcome Treatment No. of
treatments Stone free
Reduced in size
No change in size
Increased in size
Fluid and Alkali
9 5 (55.5%)
1 (11.1%) 2 (22.2%) 1 (11.1%)
D Penicillamine
12 7 (58.3%)
2 (16.7%) 1 (8.3%) 2 (16.7%)
Captopril 4 0 (0%) 1 (25%) 1 (25%) 2 (50%) ESWL 12 6 (50%) 3 (25%) 3 (25%) 0 (0%)
Cystinuria in children in Iraq… Shatha Hussain Ali
Iraqi Journal of Medical Sciences 31
The genetic transport defect in cystinuria exists from birth and stone formation begins in the first decades of life in a rate of 80% and continues life long.
Discussion
(3, 4, 9, 10) This was reflected in our study by early onset of stone disease among the studied group. Some data reported equal incidence between sex (1,
8), other studies reported higher rates among males (5, 17). Males often have early appearance of stones, more severely affected and produce significantly more stones than females (1,
4, 8)
High rate of parental consanguinity which is common in our community and family history of stone disease is obvious because of autosomal recessive inheritance pattern of the disease
, these findings might lead to early presentation and diagnosis of the disease and will be reflected as higher rates in males.
(1, 3, 4, 6,
7, 8, 12). Dahlberg et al reported 50% of family history of stone disease among his series (5)
An interesting finding was the presentation of 4 patients with failure to thrive in our study. Andrwes was the first to suggest that cystinuric patients were shorter than normal, Colliss and associates also reported that the average height of 44 cystinuric patients was 2.5 cm less than that of the normal population, he postulated that patients with Cystinuria were at slight nutritional disadvantage as a result of urinary losses and defective gastrointestinal absorption of Lysine, an essential amino acid
.
(5). Al–Hermi et al described failure to thrive as the presenting feature in 1 of 3 cystinuria cases in Bahrain (18). A recent epidemiological study from UK revealed that the median height and weight of children with renal stones on presentation was lower than average,
claimed that those children often have feeding and growth problems (19)
Similar to our results, associated UTI was recorded in one third of Cystinuric patients by several repots, as the presenting complaint or as a complication of stone disease
. Concurrent illness may also be contributing factors for reduced growth as we noticed in our study.
(1, 3, 5, 6, 8)
Infection with urease splitting organisms represents a major reason for failure of medical therapy and the need for surgery to eliminate all fragments of the calculus in order to sterilize the urinary tract
(6)
Staghorn calculi are well recognized radiological appearance with Cystinuria
.
(1, 9, 10, 18). The permanent excretion of excessive amount of Cystine is spontaneously associated with the relentless formation of stones which can have a staghorn development (3). Most often, these stones now are treated with combination of percutaneous nephrolithotomy / ESWL / second look nephroscopy, termed "sandwich therapy " ,which precludes the need for renal open surgery (1, 3, 4, 18). Nearly similar to our results, pure cystine stones were observed in 60 – 80% of cases (1, 4)
Sakhaee et al observed that HCa, HUr and/ or Hypocitraturia may accompany Cystinuria, thus contributing to stone formation
.
(3) Avoidance of foods with a very high Methionine content; which is the precursor of Cystine, could lower urinary Cystine excretion, achieving one goal of treatment. However; most authors believe that such dietary restriction is not advisable for children (3, 4, 12). Low salt diet to about 1 mmol / Kg / day was effective in reducing urinary Cystine concentration in children, however long term
Cystinuria in children in Iraq… Shatha Hussain Ali
Iraqi Journal of Medical Sciences 32
compliance even with modest salt restriction is often poor(3, 4, 12). Because high sodium intake increases cystine excretion, potassium citrate was preferred for most of the studied patients
A high fluid intake remains the most important factor for the reduction of urinary Cystine concentration which should be distributed throughout day and night
(1, 3, 8, 10).
(3, 4, 7, 10). It was calculated that urine excretion of > 3 – 4 Liters/ day (1.2 – 2 liters/ M2/ day or 40 ml/ Kg/ day in children) is necessary to prevent stone formation (1, 3, 9, 12). Urine dilution alone is rarely sufficient and sustained alkalinization to PH of about 7.5 is often required to obtain effective Cystine solubilization (3, 4, 7, 10, 12). The first stone dissolution by alkilinization of urine was reported in 1924, and alkilinization has been the mainstream treatment for over 50 years (9). Alkaline urine can prevent precipitation of cystine calculi and even aid in dissolution (1). Dent et al assessed the efficacy of large urine volume with alkali (Sodium or Potassium Bicarbonate) on Cystinurics. He reported that 12 of 18 stones of his series either dissolved or patients remained stone free (9)
In a study from Japan, in 3 cases out of 15 children with cystinuria, calculi disappeared by medical therapy alone
(17)
We could not correlate our results with urine Cystine level; due to lack of laboratory resources. In Mayo clinic series; successful therapy was obtained in 10 out of 30 patients treated with oral fluid and alkali only
.
(5)
For stone free patients; first line therapy is the conservative approach, is adequate for stone prevention
.
(1, 3, 5)
When conservative measures fail, the application of chelating agents that transform Cystine into a highly soluble Thiol–Cysteine mixed disulfide may be added. The most widely used drugs are DP and α – mercaptopropionyl – glycine or Tiopronin (TP), both drugs are equally effective
. This observation was highlighted in our study as 3 patients who did not have stones at
onset of conservative therapy, continued to be stone free.
(3, 4, 7 – 10, 12)
DP was introduced as a treatment for Cystinuria in 1963
.
(9). Over the next few years, there were many small published series demonstrating reduction in Cystine excretion, stone dissolution and reduction in recurrence not controlled by oral fluids and alkalinization (9). DP is best suited for stone prevention after surgical debulking of stone burden (1). This observation was noticed in 4 occasions in our study. The same was observed in 3 out of 24 patients in Mayo clinic, where 10 patients had complete dissolution of calculi. Stone mass was reduced in 5, no change in stone size in 3 and stones continue to grow in another three (5). Prevalence rate of adverse reactions to DP is approximately 20 – 50% in several studies (1, 3, 4, 5, 7 - 10). Higher rate of side effect (85.7%) to DP was reported in a Japanese Study (17). Coexisting metabolic disorders and presence of mixed calculi were emphasized as the most common reason for failure of DP therapy (3, 5) TP is preferred by most physicians in treatment of cystinuria, because of it’s less side effects and can be used in patients who develop allergic reactions to DP (1, 3, 4, 8 – 10)
Compared to the small series in this study, several studies failed to observe a significant effect of Captopril on Cystine stones formation
Being unavailable in our country, TP was not used for the studied group.
(3, 9, 20).
Cystinuria in children in Iraq… Shatha Hussain Ali
Iraqi Journal of Medical Sciences 33
Because of its low morbidity, ESWL can be offered as first line treatment for Cystine stones in children (1, 4)
Cystine stones often require urological intervention when they cause symptoms, obstruction, and increase in size
.
(1, 3). Although Cystine stones respond less to ESWL than Calcium stones, the stone free rate after ESWL is higher even for large ones in children than adults(4). Because of their hardness and homogenous amino acid composition, most Cystine stones require multiple cessions to achieve acceptable stone free rates (1, 3)
Stone free rate following ESWL was 43% in a Japanese study with an average of 5.9 sessions
. This observation was also highlighted in this study. The response to ESWL is recorded in this study as the final result of completing treatments. Medical treatment was used in all patients underwent ESWL.
(17)
Open surgery should be considered for cases with complex staghorn calculi, difficult anatomy and simultaneous urological abnormalities
.
(4). As many patients will suffer recurrence of stones within a few years and need repeated urological intervention, minimally invasive procedures should be preferred to open surgery whenever possible (1, 3) . In a study from Japan, 17 lithotomies were performed in 13 out of 15 patients (17)
Treatment of patients with Cystinuria requires close co operation between the urologist and the nephrologists
(1, 3, 4)
Regular medical treatment is mandatory because of the relentless tendency of cystine stones to recur despite improved urological techniques of stone removal
.
(1, 3)
The main deficiency of this study is in the inability to quantitatively measure urine cystine, an important tool in the assessment of treatment efficiency. However it was believed that fellow up on stone formation rate provide a real picture of the clinical outcome.
.
In conclusion, oral fluids and alkali were most successful when used prophylactically in the stone free patients. D-Penicillamine and ESWL had nearly equal rate of successful results. Failure of treatment should alarm the possibility of coexisting metabolic disorders and UTI as a complicating problem. Combined treatments were frequently required in cystinuric children.
1. Biyani CS, Cartledge J, Cystinuria, Medicine WebMD, Last updated: Jan. 20, 2007. www.emedicine.com
References
2. Langen H et al Renal polyamine excretion, tubular amino acid reabsorption and molecular genetics in cystinuria, Pediatr Nephrol 2000. 4: 376 – 384. 3. Joly D, Rieu P, Mejean A, Gagnadoux M, Daudon M, Jungers P. Treatment of cystinuria. Pediatr Nephrol, 1999 . 13:945 – 950 4. Knoll T, Zollner A, Wendt – Nordahl G, Michel MS, Alken P . Cystinuria in childhood and adolescence: recommendations for diagnosis, treatment, and follow – up. Pediatr Nephrol, 2005. 20: 19 – 24 5. Dahlberg PJ, Van Den Berg CJ, Kurtz SB, Wilson DM, Smith LH . clinical features and management of cystinuria. Mayo Clinic Proceedings; 1977. 52(9): 533 – 542 6. Polinsky MS, Kaiser BA, Baluarte HJ. urolithiasis in childhood. In: Gruskin AB (ed). The pediatric clinics of north america (Pediatric Nephrology). Saunders, Philadelphia, 1987, 34 (3): 683 – 710. 7. Minevich E. Pediatric urolithiasis. Pediatric clinics of north america (Pediatric urology), Saunders, Philadelphia, 48 (6), Dec, 2001: 1571 – 1585 . 8. Zelikovic I. Aminoaciduria and glycosuria. In: Avner ED, Harmon WE, Niaudet P (eds) Pediatric nephrology, 5th edition. Lippincott Williams and Wilkins, Baltimore, 2004, pp 701 – 728.
Cystinuria in children in Iraq… Shatha Hussain Ali
Iraqi Journal of Medical Sciences 34
9. Becker G. cystine stone guidwlines. The CARI Guidelines – Caring for Australians with Renal Impairment Kidney Stones, 2006. [www.cari.org.au] 10. Goldfarb DS . Cystinuria. Encyclopedia of life sciences [Pubmed] .2005. www.els.net Macmillan London. Interscience. 11. Elder JS. Urinary lithiasis. In: Behrman RE, Kliegman RM, Jenson HB (eds) Nelson textbook of pediatrics, 17th edn. Saunders, Philadelphia, 2004. pp 1822–1826 12. Laufer J, Boichis H. Urolithiasis in children: current medical management. Pediatr Nephrol , 1989, 3: 317 – 331 13. Milliner DS, Murphy ME. Urolithiasis in pediatric patients. Mayo Clin Proc, 1993, 68:241–248 14. Newman DJ, Price CP. Renal function and nitrogen metabolites. In: Burtis CA, Ashwood ER (eds) Tietz textbook of clinical chemistry, 3rd edn. Saunders, Philadelphia, 1999. Chapter 35, pp 1204–1270 15. Finocchiaro R, et al. Usefulness of cyanide nitroprusside test in detecting incomplete recessive heterozygotes for cystinuria: a standardized dilution procedure. Urological Research, 26 (6) December, 1998, pp 401 – 405. 16. David A, Zackson MD. The treatment and prevention of cystine stones by forced hydration and strong urinary alkalinization. Cystinuria support network. www.cystinuria.com . 17. Asanuma H, Nakai H, Takeda M, Shishido S, Kawamura T, Nagakura K, Yamafuji M. clinical study on cystinuria in children – the stone management and the prevention of calculi recurrence. Nippon Hinyokika Gakkai Zasshi. 1998, Sep; 89 (9): 758 – 765 18. Al – Hermi B, Al – Kameli A, Aal A. Cystinuria in children in Bahrain. Saudi J Kidney Transplant; 2002, 13 (2): 171 – 175. 19. Coward RJM, Peters CJ, Duffy PG, Corry D, Kellett MJ, Choong S, Hoff WG vant s Epidemiology of pediatric renal stone disease in the UK. Arch Dis Child. 2003, 88: 962–965. 20. Coulthard M, Richardson J, Fleetwood A. Captopril is not clinically useful in reducing the cystine load in cystinuria or cystinosis. Pediatr Nephrol. 1991, 5: 98
Iraqi Journal of Medical Sciences 35
Cd30 molecule expression in sera and on t cells of trophoblast tissue from women with recurrent spontanious abortion
Nidhal Abdul-Mohymen P
1P PhD, Amal HussainP
2P PhD.
UAbstract Background: Immune responses during pregnancy showP
Pa distinct shift towards Th2-
type reactions occurs, especiallyP
Pat the feto-
maternal interface. CD30 has been described as being preferentially expressed, and released, by human T cells producing the Th2-type cytokines. Objective: To determine the level of soluble CD30 (sCD30) in serum and in the trophoblasts of patients with recurrent spontaneous abortion (RSA). Materials and methods: A total of sixty one women attending the Obstetrics department in al- kadhemia hospital, age range from (23.9 - 28.5years), were enrolled in the current study and were further classified into three categories: Group A: 35 women included cases with recurrent spontaneous abortion, group B: 16 women included non- recurrent spontaneous abortion (non-RSA): group C: 10 women was Control (successful pregnancy).
From each subject blood sample and placental tissues were collected and serum was seperated for the estimation of soluble CD30 (sCD 30) levels using ELISA method and trophoblasts tissues (an image for the local microenvironment) were screened to determine the levels of CD30 using immunohistochemistry. Results: Trophoblast expression of CD30 and sCD30, showed a highly significant increased values for both patients groups (p<0.001) when compared with control group. Conclusion: It is likely that there may be an association betweenP
Pnormal pregnancy and
CD30 density on the cell surface. Key words: recurrent spontaneous abortion, CD30, mmunohistochemistry, ELISA IRAQI J MED SCI, 2009; VOL.7 (2):35-40
UIntroduction
Successful human pregnancy appears to be an immunological paradox,P
Pin that the fetus represents a
semi-allograft developing inP
Pthe
potentially hostile environment of the maternal immune system P
(1-3)P One
important mechanism P
Pinvolves the
down-regulation of the cellular immune response,P
Pwhich has been shown to be
dependent upon the suppression ofP
P T-
helper (Th)1 and T-cytotoxic (Tc)1cells,which produceP
Pinterleukin(
IL-2), interferon (IFN)-γ, and tumor necrosis factor P
P(TNF)-β, and the up-
P
1PDept. Medical Microbiology, College of
Medicine, Al-Nahrain University, P
2P Dept.
Medical Microbiology, College of Medicine, Al- Mustansiryia University. Adress Correspondence to: Dr. Nidhal AbdulMohymen. E- mail: [email protected] Received: 12 P
thP March 2008, Accepted: 13 P
thP
April 2009.
regulation of Th2 and Tc2 cells, which produceP
PIL-4, IL-6, IL-10 and IL-13 P
(4-7)P.
Previous investigations P
Pof
Th1/Th2 immune responses during pregnancy were able to show P
Pthat a
distinct shift towards Th2-type reactions occurs, especiallyP
Pat the feto-
maternal interface P
(8-12)P. CD30 has been
described as being preferentially expressed, and released, by human T cells producing the Th2-type cytokines P
(13,14)P. Surface CD30 is cleaved
proteolytically, resulting in the release of the soluble form of the molecule (sCD30) by CD30-expressing cells P
(15)P.
Since CD30 has been reported to be associated with Th2-type reactivity, we measured soluble CD30 in the serum and the density of CD30 on the surface of T cells of normal pregnant women and in women undergoing abortion ; to clarify if there is any association between normal pregnancy
Cd30 and recurrent spontanious abortion …Nidhal Abdul-Mohymen etal
Iraqi Journal of Medical Sciences 36
and CD30 density on the cell surface we designed this study. 1TUSubjects, materials and methods
Sixty one women attending the Obstetrics and Gynecology department of Al-Kadhemia Teaching Hospital in Baghdad between December 2004 and August 2005 were the subject of studying. They included 35 women with 3-6 consecutive abortin; group A (RSA), 16 women with abortion for the first or second time; group B, 10 pregnant women who had at least two previous normal pregnancies;group C.
Trophoblastic tissue was collected from the evacuation of retained pieces during the procedure of curettage and placed in 10% formaldehyde. Two to three paraffin embedded blocks were prepared for each patient. Staining with haematoxyline and eosin was carried out to decide which block can be used in the study (only sections that contained trophoplastic tissues were included. These samples were subjected for immunohistochemical staining (IHC) protocols with the anti CD30 marker according to P
(16)P. The expression
of CD30 was measured by counting the number of positive trophoblastic cells that gave brown cytoplasmic staining under light microscope. The extent of the IHC signal in the villi was determined in 10 fields (100 X magnification). In each field the total number of villi were counted and the extent of cytoplasmic staining of the trophoblast cells in a given villous was determined as a percent. The total staining score was divided by the number of whole villi per field in 10
fields P
(17)P so, the percentage of
positively stained villi in the 10 fields was calculated for each case by taking the mean of the percentage of the positivity stained villi in the 10 fields. In each field the total number of villi was counted and the extent of staining of the cytotrophoblast and syncytiotro-phoblast in a given villous was scored as: score 3 (75-100%); 2 (25-75%); or 1 (<25%). Detection of soluble CD30 by ELISA:
Sample collection: Five ml of venous blood was collected from each subject group and serum was separated and stored at -20 P
oPC until used.
The ELISA test was perfomed,using two anti- CD30 monoclonal antibobies (Primary and secondary )antibodies which were the product of DAKO.Cut –off value was calculated according to P
(18)P.
UStatistical Analysis The ANOVA analysis program,
chi-square and the relationship between the indicators was measured qualitatively by using the correlation coefficient. UResults Correlation between abortion and CD30:
In thirty five women with RSA (group A), a negative significant correlation (p<0.05) between abortion and CD30 in sera and trophoblast tissues (r=-0.651; r=-0.496, respectively), was found, (Table 1). The data also showed a negative significant correlation(r=-0.529; p≤0.05) between abortion and sCD30 in group (B).
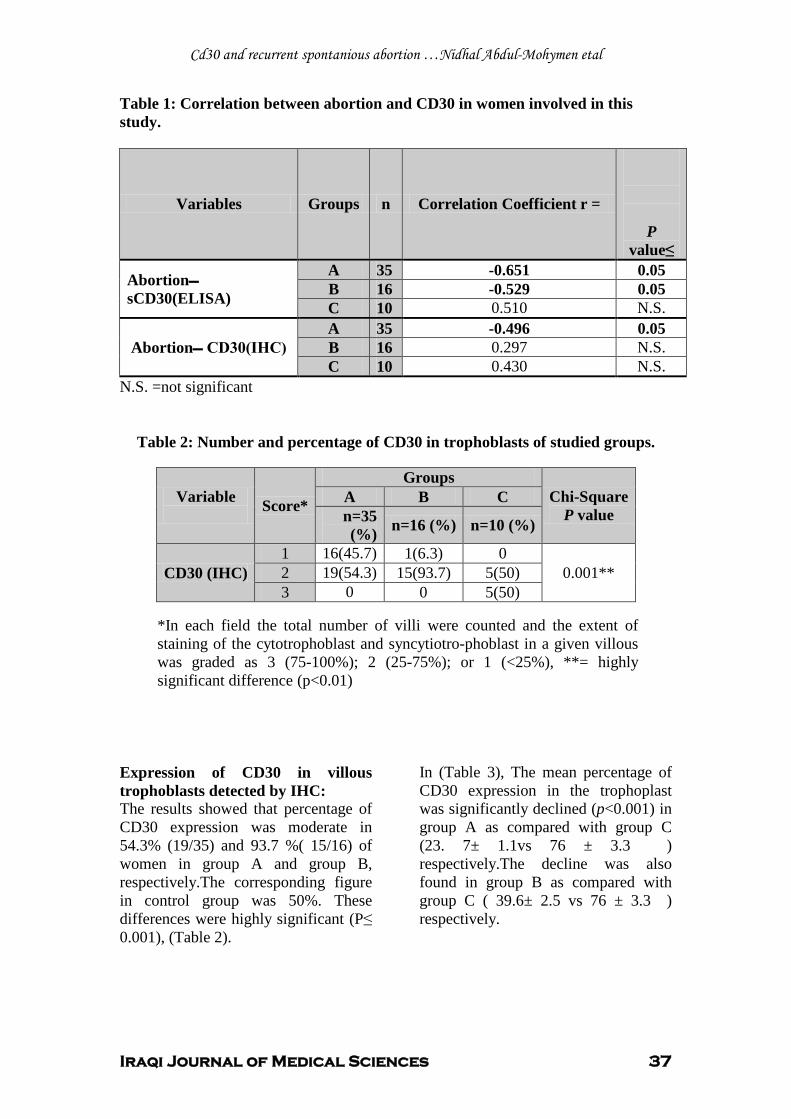
Cd30 and recurrent spontanious abortion …Nidhal Abdul-Mohymen etal
Iraqi Journal of Medical Sciences 37
Table 1: Correlation between abortion and CD30 in women involved in this study.
N.S. =not significant
Table 2: Number and percentage of CD30 in trophoblasts of studied groups.
*In each field the total number of villi were counted and the extent of staining of the cytotrophoblast and syncytiotro-phoblast in a given villous was graded as 3 (75-100%); 2 (25-75%); or 1 (<25%), **= highly significant difference (p<0.01)
Expression of CD30 in villous trophoblasts detected by IHC: The results showed that percentage of CD30 expression was moderate in 54.3% (19/35) and 93.7 %( 15/16) of women in group A and group B, respectively.The corresponding figure in control group was 50%. These differences were highly significant (P≤ 0.001), (Table 2).
In (Table 3), The mean percentage of CD30 expression in the trophoplast was significantly declined (p<0.001) in group A as compared with group C (23. 7± 1.1vs 76 ± 3.3 ) respectively.The decline was also found in group B as compared with group C ( 39.6± 2.5 vs 76 ± 3.3 ) respectively.
P
value≤
Correlation Coefficient r = n Groups Variables
0.05 -0.651 35 A Abortion sCD30(ELISA) 0.05 -0.529 16 B
N.S. 0.510 10 C 0.05 -0.496 35 A
Abortion CD30(IHC) N.S. 0.297 16 B N.S. 0.430 10 C
Variable Score*
Groups Chi-Square
P value A B C n=35 (%) n=16 (%) n=10 (%)
CD30 (IHC) 1 16(45.7) 1(6.3) 0
0.001** 2 19(54.3) 15(93.7) 5(50) 3 0 0 5(50)
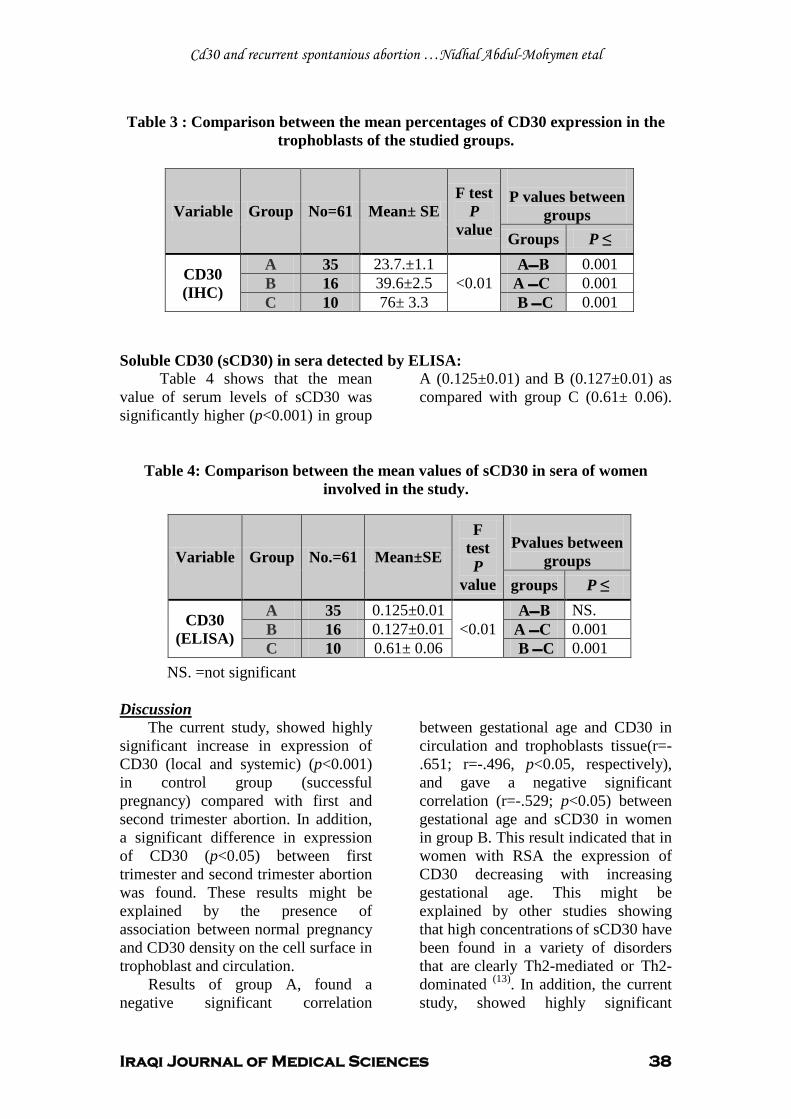
Cd30 and recurrent spontanious abortion …Nidhal Abdul-Mohymen etal
Iraqi Journal of Medical Sciences 38
Table 3 : Comparison between the mean percentages of CD30 expression in the
trophoblasts of the studied groups.
Soluble CD30 (sCD30) in sera detected by ELISA: Table 4 shows that the mean value of serum levels of sCD30 was significantly higher (p<0.001) in group
A (0.125±0.01) and B (0.127±0.01) as compared with group C (0.61± 0.06).
Table 4: Comparison between the mean values of sCD30 in sera of women involved in the study.
NS. =not significant
1TUDiscussion The current study, showed highly
significant increase in expression of CD30 (local and systemic) (p<0.001) in control group (successful pregnancy) compared with first and second trimester abortion. In addition, a significant difference in expression of CD30 (p<0.05) between first trimester and second trimester abortion was found. These results might be explained by the presence of association betweenP
Pnormal pregnancy
and CD30 density on the cell surface in trophoblast and circulation.
Results of group A, found a negative significant correlation
between gestational age and CD30 in circulation and trophoblasts tissue(r=-.651; r=-.496, p<0.05, respectively), and gave a negative significant correlation (r=-.529; p<0.05) between gestational age and sCD30 in women in group B. This result indicated that in women with RSA the expression of CD30 decreasing with increasing gestational age. This might be explained by other studies showing that high concentrations P
Pof sCD30 have
been found in a variety of disorders that areP
Pclearly Th2-mediated or Th2-
dominated P
(13)P. In addition, the current
study, showed highly significant
P values between
groups F test
P value
Mean± SE No=61 Group Variable
P ≤ Groups 0.001 AB
<0.01 23.7.±1.1 35 A CD30
(IHC) 0.001 C A 39.6±2.5 16 B 0.001 C B 76± 3.3 10 C
Pvalues between
groups
F test P
value
Mean±SE No.=61 Group Variable
P ≤ groups NS. AB
<0.01 0.125±0.01 35 A CD30
(ELISA) 0.001 C A 0.127±0.01 16 B 0.001 C B 0.61± 0.06 10 C
Cd30 and recurrent spontanious abortion …Nidhal Abdul-Mohymen etal
Iraqi Journal of Medical Sciences 39
difference (p<0.001) between CD30 expression in trophoblasts tissue in three groups of investigated women. However, previous reports showed that CD30 expression was associated with differentiation and activation pathway of human T cells producing Th2 –type cytokine (14, 19)
Previous reports showed that CD30, was a member of tumor necrosis factor receptor superfamily TNFR
.
(19) and can give signals through the activation of the nuclear factor-κB (NFκB), which is an important transcriptional factor, regulating the pro-inflammatory cytokines, which were shown to be down-regulating during pregnancy, a mechanism that is essential for the maintenance of the Type2 cytokine profile required for pregnancy success (20). High concentrations of sCD30 have been found in a variety of disorders that are clearly Th2-mediated or Th2-dominated. Since pregnancy appears to be a Th2-biased condition it is likely that the skew towards Th2-bias seen in peripheral blood cells may be reflected by increased concentrations of sCD30 in the blood (13, 19)
Moreover, the expression of CD30 in trophoblatic tissue was highly significant increased (p<0.001) in women with non-RSA (group B) compared with RSA (group A), but no significant difference (p>0.05) was found in the levels of sCD30between the mentioned groups. This result might be associated with level of cytokine and CD30 within local microenviro-nment and the peripheral circulation. The variation of expression suggests a possible role for hormones, preferably progesterone, in the regulation of CD30 expression , This would be a novel mechanism of CD30 induction
.
(21) , progesterone produce an immunomodulatory protein known as progesterone –induced blocking factor(PIBF) which induces increased
production of Th2 cytokines (22), therefore apart from the systemic changes in the maternal immune response, local immunomodulation at the feto-maternal interface via wide array of hormones and cytokines, and immune effector cells also play a critical role in maintaining the balance of the desirable immune response (23)
UReferences 1. Medawar PB. Some immunological and endocrinological problems raised by the evolution of viviparity in vertebrates. Symp Soc Exp Biol .1953; 11:320-338. 2. Clark DA, Ding J, Chaouat G, Coulam C B, August C and Levy G A The emerging role of immunoregulation of fibrinogen-related procoagulant fgl2 in the success of spontaneous abortion of early pregnancy in mice and humans. Am J Reprod Immunol. 1999; 162:12-19. 3. Trowsdale J and Betz A G Mother’s little helpers: mechanisms of maternal-fetal tolerance. Nat Immunol. 2006; 7: 241–246. 4. Saito S Cytokine network at the feto-maternal interface. J Reprod Immunol. 2000; 47:87-103. 5. Ng S C, Gilman-Sachs A, Thaker P, Beaman K D, Beer A E and Kwak-Kim J. Expression of intracellular Th1 and Th2 cytokines in women with recurrent spontaneous abortion, implantation failu-res after IVF/ET or normal pregnancy. Am J Reprod Immunol. 2002;48(2):77-86 6. Daher S, Denardi K A G, Blotta M H S L, Mamonib R L. Cytokines in recurrent pregnancy loss. J Reprod Immunol. 2004; 62:151–157. 7. Shimada S, Nishida R,Takeda M, Iwabuchi K. Natural killer, helper and cytotoxic T cells in the decidua from sporadic miscarriage. Am J Reprod Immunol.2006; 56 (3): 193-200 8. Lim K J, Odukoya O A, Ajjan R A, Li T C, Weetman A P and Cooke I D. Profile of cytokine mRNA expression in peri-implantation human endometrium. Mol Hum Reprod. 1998; 4:77-81. 9. Piccinni M P, Beloni L, Livi C, Maggi E, Scarselli G and Romagnani S. Defective production of both leukemia inhibitory factor and type 2 T-helper cytokines by decidual T cells in unex-plained recurrent abortions. Nat Med.1998; 4:1020-1024. 10. Saito S, Sasaki M and Sasaki Y. Quantitative analysis of peripheral blood Th0, Thl, Th2 and the Thl: Th2 cell ratio during normal human pregnancy and pre-eclampsia.
Cd30 and recurrent spontanious abortion …Nidhal Abdul-Mohymen etal
Iraqi Journal of Medical Sciences 40
Clin Exp Immunol. 1999; 117: 550-555.
.
11. Tsuda H, Michimata T and Hayakawa S A. Th2 Chemokine. TARC, produced by trophoblasts and endometrial gland cells, regulates the infiltration of CCR4+ T lymphocytes into human decidua at early pregnancy. Am J Reprod Immunol. 2002; 48: 1-8. 12. Sargent I L, Borzychowski A M and Redman CW. NK cells and human pregnancy an inflammatory view. TRENDS in Immunology. 2006; 27(9):399-404. 13. Romagnani S, Del Prete G, Maggi E. CD30 and type 2 T helper (Th2) responses. J. Leukoc. Biol. 1995; 57:726–730. 14. Gaspal F M C, Kim M Y, McConnell M, Raykundalia C, Bekiaris V and Lane P J L. Mice deficient in OX40 and CD30 signals lack memory antibody responses because of deficient CD40 T cell memory. J Imunol.2005; 174(7):3891-96. 15. Smith C A. CD30 antigen, a marker for Hodgkin's lymphoma, is a receptor whose ligand defines an emerging family of cytokines with homology to TNF. Cell. 1993; 73:1349–1360. 16. Michimata T, Ogasawara M S and Tsuda H. Distribution of endometrial NK cells, B cells, T cells and Th2/Tc2 cells fail predict pregnancy outcome following recurrent abortion. Am J Reprod Immunol. 2002; 47: 196-202. Moffet-King, A. Natural killer cells and presnancy. Nat Rev Immunol. 2002; 2: 656-663 17. Hennessy A, Pilmore H L, Simmons L A and Painter D M. A Deficiency of placental IL-10 in preeclampsia. J Immunol.1999; 163: 3491-3495. 18. Al-Murrani W K, Al-Shummari A, Al-Obaidi A and Mustafa A M. New approach for the calculation of cut-off point (value) in immunological and diagnostic tests. Iraqi J Microbiol.2000; 12:1-9. 19. Del Prete G, De Carli M, Almerigogna F, Daniel CK. Preferential expression of CD30 by human CD4+ T cells producing Th2-type cytokines. FASEB J.1995; 9: 81–86. 20. McCracken S A, Gallery E and Morris J M. Pregnancy-specific down-regulation of NF-
B Expression in T cells in humans is essential for the maintenance of the cytokine profile required for pregnancy success. J Immunol. 2004; 172:4583-4591. 21. Tamiolakis D,Papadopoulos N, Lambropoulou M. Ber-H2 (CD30) Immunohistochemical staining of human fetal tissues. Int J Biol Sci. 2005; 1(4): 135–140. 22. Szekeres-Bartho J and Wegmann T G. A progesterone dependent immuno-modulatory
protein alters the Thl/Th2 balance. J Reprod Immunol. 1996; 31: 81-95. 23. Moffet-King A. Natural killer cells and pregnancy. Nat Rev Immunol. 2002; 2: 656-663
Iraqi Journal of Medical Sciences 41
Pattern of mycobacterium tuberculosis drug resistance in previously treated cases in Iraq
Mustafa Nema FICMS; CABMS ,Hashim M. Al-Kadimy FRCP.
Background: The resistance of certain Mycobacterium tuberculosis strains to anti-tuberculosis drugs is not a new phenomenon. It is man-made amplification of natural phenomenon.
Abstract
Objectives: 1- To provide scientifically based information on the burden of Mycobacterium tuberculosis drug resistance in Iraq. 2- To compare the pattern of this resistance in Iraq with that in the other countries. Methods: A total 411 patients with pulmonary tuberculosis who have already received at least one month of anti-tuberculosis therapy were selected. Sputum cultures and drug sensitivity tests for Mycobacterium tuberculosis were arranged.
Results: Resistance to rifampicin, isoniazid, streptomycin and ethambutol was noted in 52 (24.4%), 22 (10.3%), 21 (9.9%) and 8 (3.8%) of isolates respectively. Multidrug and four-drug resistance was found in 52 (24.4%) and 24 (11.3%) respectively. Rifampicin resistance in any form was noted in 146 (68.5%). Conclusion: The magnitude of Mycobacterium tuberculosis drug resistance in Iraq found to be relatively high. Key wards: tuberculosis; antituberculous drugs resistance; multidrug resistance; drug resistance IRAQI J MED SCI, 2009; VOL.7 (2): 41-49
The emergence of resistance to antimicrobials is a natural biological occurrence. Drug resistance can be divided to: Drug resistance among new cases ( primary resistance) referred to presence of resistant isolates of tuberculosis (TB) in patients who deny or having no evidence of, prior anti-TB treatment (for as much as 1 month), drug resistance among previously treated cases ( acquired resistance) which is the presence of resistant isolates of tuberculosis in patients who, in response to direct questioning, admit having been treated for tuberculosis for period of 1 month or more, and combined prevalence of drug resistance which is the prevalence of
Introduction
Al-Kadimia University Hospital. Adress Correspondence to: Dr. Mustafa Nema. E- mail: [email protected] mobile: +964 7707 882 782 Received: 26th December 2006, Accepted: 6th
resistance in the population surveyed regardless of prior treatment
May 2009.
(1)
In 1995, WHO estimated that 50 million people were infected with drug-resistant strains of Mycobacterium tuberculosis
. Polyresistance means resistance to more than one drug other than multidrug resistance.
(2)
Drug resistance is less likely to occur in directly observed therapy (DOT)
. In 1997, the World Health Organization (WHO), the International Union against Tuberculosis and Lung disease (IUATLD) and several partners worldwide release the first report of Global Project on Anti-tuberculosis Drug Resistance Surveillance (DRS). This report presented data from 35 geographical settings (surveyed between 1994 and 1996) using standard epidemiological and laboratory guidelines. These data covered 16% of the world notified TB cases.
(3). The survey in Islamic
Pattern of Mycobacterium TB Resistance…. mustafa Nema etal
Iraqi Journal of Medical Sciences 42
Republic of Iran demonstrated high prevalence of multidrug resistant-TB (5%) and any rifampicin (R) resistance (50%). Drug resistance is not a problem in Oman, nor is it in Morocco. Iraq was not included in this project.
The majority of isoniazid (H) resistant strains show mutations of the katG gene (50%) followed by mutation locus resistance in inhA (25%) of total H resistance. Mutation loci for rifampicin resistance is rpoB (97%), for streptomycin (S) is rpsL (60%), for ethambutol (E) is embAB (50%) and for pyrizinamide (Z) is pcrA with unknown revalence(4,5).
A total of 411 randomly selected cluster of patients included. All have pulmonary TB and had already received at least one month of anti-TB therapy. The study was conducted from February 2005 to August 2006. All patients selected were sputum positive isolates of M. tuberculosis (using standard Zeihl-Nelson stain method). Culture and sensitivity then arranged for patient’s sputum samples.
Methods
Setting: Institute of tuberculosis and chest disease in Baghdad, receiving patients from all hospitals all over the country, and the first treating facility for a large population in Baghdad. It is the only facility that has performs culture and drug susceptibility testing for Mycobacterium tuberculosis (MTB) in Iraq. Bacteriological methods
Löwenstein-Jensein (L-J) culture medium was used for culturing sputum. Identification of the strains was based on the niacin production test, the nitrate reduction test, the amniobenzoic acid (500mg/l) and the thiophene carboxylic acid (2mg/l) resistance test. Species other than the pathogenic species of
MTB complex were excluded from analysis, e.g. rapid grower species that grow within three days.
Cultures that yield MTB then subjected to drug sensitivity tests. Drug sensitivity test was performed using the proportion method on L-J medium.
Using the proportion method, resistance was expressed as percentage of colonies that grew on critical concentrations of the drugs which were prepared as follows: H: 0.2 µg/ml, R: 40 µg/ml, E: 2 µg/ml and S: 4 µg/ml. The criterion for resistance to a particular drug was growth of 1% of the population on medium containing the critical concentration. The results of the tests recorded on standardized laboratory forms.
Radiometric BACTEC MGIT 960 (Becton Dickinson) method, started to be in work since 2002 in Iraq, used for both mycobacterial detection and drug susceptibility testing. Using this method, resistance was expressed as growth concentration in each tube containing the following concentrations (compared to growth control): H: 0.1 µg/ml, R: 1 µg/ml, E: 5 µg/ml and S: 1 µg/ml.
Screening for the human immune deficiency virus (HIV) was not part of this study. Statistical analysis
SPSS ® version 10.0.5 for Windows to analyze the data. The Student t-test was used to calculate continuous variables. A P value of 0.05 was considered significant.
Three hundred-eleven (73%) were males and 100 (24.3%) were females. The median age of the patients was 34 years. Mean age = 35.4 ± 10.4 years with a male: female ratio of 3:1. The age group most commonly encountered in
Results
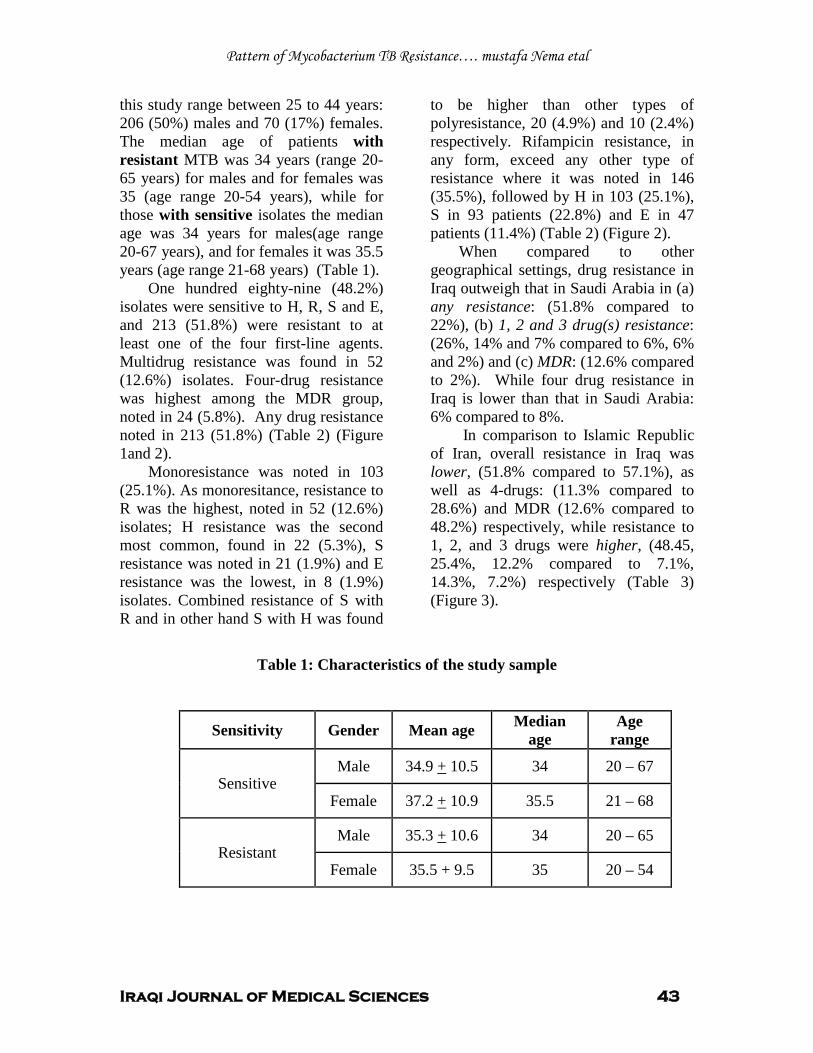
Pattern of Mycobacterium TB Resistance…. mustafa Nema etal
Iraqi Journal of Medical Sciences 43
this study range between 25 to 44 years: 206 (50%) males and 70 (17%) females. The median age of patients with resistant MTB was 34 years (range 20-65 years) for males and for females was 35 (age range 20-54 years), while for those with sensitive isolates the median age was 34 years for males(age range 20-67 years), and for females it was 35.5 years (age range 21-68 years) (Table 1).
One hundred eighty-nine (48.2%) isolates were sensitive to H, R, S and E, and 213 (51.8%) were resistant to at least one of the four first-line agents. Multidrug resistance was found in 52 (12.6%) isolates. Four-drug resistance was highest among the MDR group, noted in 24 (5.8%). Any drug resistance noted in 213 (51.8%) (Table 2) (Figure 1and 2).
Monoresistance was noted in 103 (25.1%). As monoresitance, resistance to R was the highest, noted in 52 (12.6%) isolates; H resistance was the second most common, found in 22 (5.3%), S resistance was noted in 21 (1.9%) and E resistance was the lowest, in 8 (1.9%) isolates. Combined resistance of S with R and in other hand S with H was found
to be higher than other types of polyresistance, 20 (4.9%) and 10 (2.4%) respectively. Rifampicin resistance, in any form, exceed any other type of resistance where it was noted in 146 (35.5%), followed by H in 103 (25.1%), S in 93 patients (22.8%) and E in 47 patients (11.4%) (Table 2) (Figure 2).
When compared to other geographical settings, drug resistance in Iraq outweigh that in Saudi Arabia in (a) any resistance: (51.8% compared to 22%), (b) 1, 2 and 3 drug(s) resistance: (26%, 14% and 7% compared to 6%, 6% and 2%) and (c) MDR: (12.6% compared to 2%). While four drug resistance in Iraq is lower than that in Saudi Arabia: 6% compared to 8%.
In comparison to Islamic Republic of Iran, overall resistance in Iraq was lower, (51.8% compared to 57.1%), as well as 4-drugs: (11.3% compared to 28.6%) and MDR (12.6% compared to 48.2%) respectively, while resistance to 1, 2, and 3 drugs were higher, (48.45, 25.4%, 12.2% compared to 7.1%, 14.3%, 7.2%) respectively (Table 3) (Figure 3).
Table 1: Characteristics of the study sample
Sensitivity Gender Mean age Median age
Age range
Sensitive Male 34.9 + 10.5 34 20 – 67
Female 37.2 + 10.9 35.5 21 – 68
Resistant Male 35.3 + 10.6 34 20 – 65
Female 35.5 + 9.5 35 20 – 54
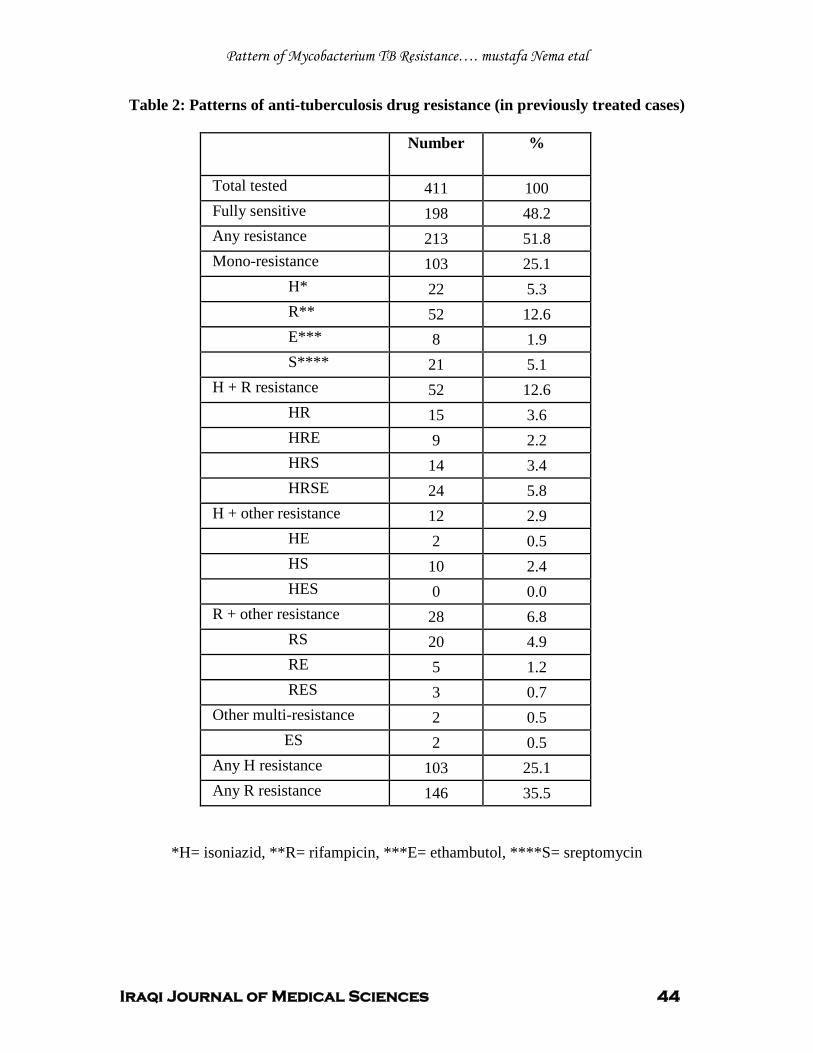
Pattern of Mycobacterium TB Resistance…. mustafa Nema etal
Iraqi Journal of Medical Sciences 44
Table 2: Patterns of anti-tuberculosis drug resistance (in previously treated cases)
Number %
Total tested 411 100 Fully sensitive 198 48.2 Any resistance 213 51.8 Mono-resistance 103 25.1 H* 22 5.3 R** 52 12.6 E*** 8 1.9 S**** 21 5.1 H + R resistance 52 12.6 HR 15 3.6 HRE 9 2.2 HRS 14 3.4 HRSE 24 5.8 H + other resistance 12 2.9 HE 2 0.5 HS 10 2.4 HES 0 0.0 R + other resistance 28 6.8 RS 20 4.9 RE 5 1.2 RES 3 0.7 Other multi-resistance 2 0.5 ES 2 0.5 Any H resistance 103 25.1 Any R resistance 146 35.5
*H= isoniazid, **R= rifampicin, ***E= ethambutol, ****S= sreptomycin
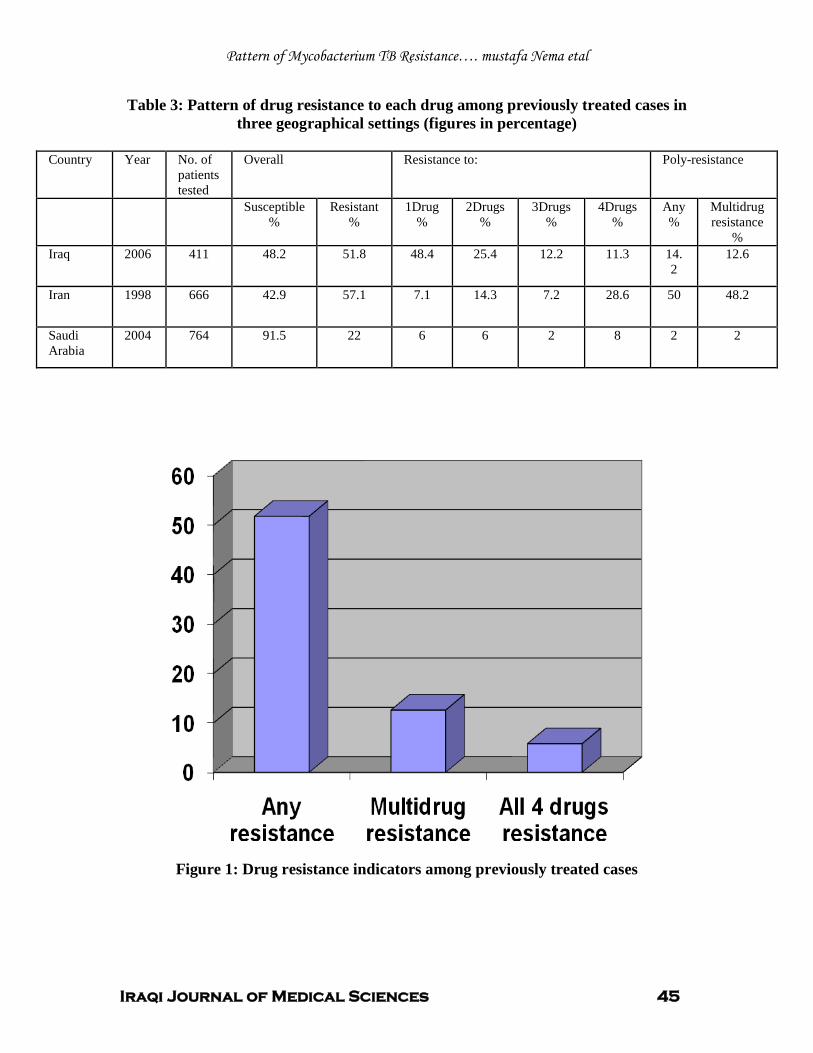
Pattern of Mycobacterium TB Resistance…. mustafa Nema etal
Iraqi Journal of Medical Sciences 45
Table 3: Pattern of drug resistance to each drug among previously treated cases in three geographical settings (figures in percentage)
Country Year No. of
patients tested
Overall Resistance to: Poly-resistance
Susceptible %
Resistant %
1Drug %
2Drugs %
3Drugs %
4Drugs %
Any %
Multidrug resistance
% Iraq 2006 411 48.2 51.8 48.4 25.4 12.2 11.3 14.
2 12.6
Iran 1998 666 42.9 57.1 7.1 14.3 7.2 28.6 50 48.2
Saudi Arabia
2004 764 91.5 22 6 6 2 8 2 2
Figure 1: Drug resistance indicators among previously treated cases
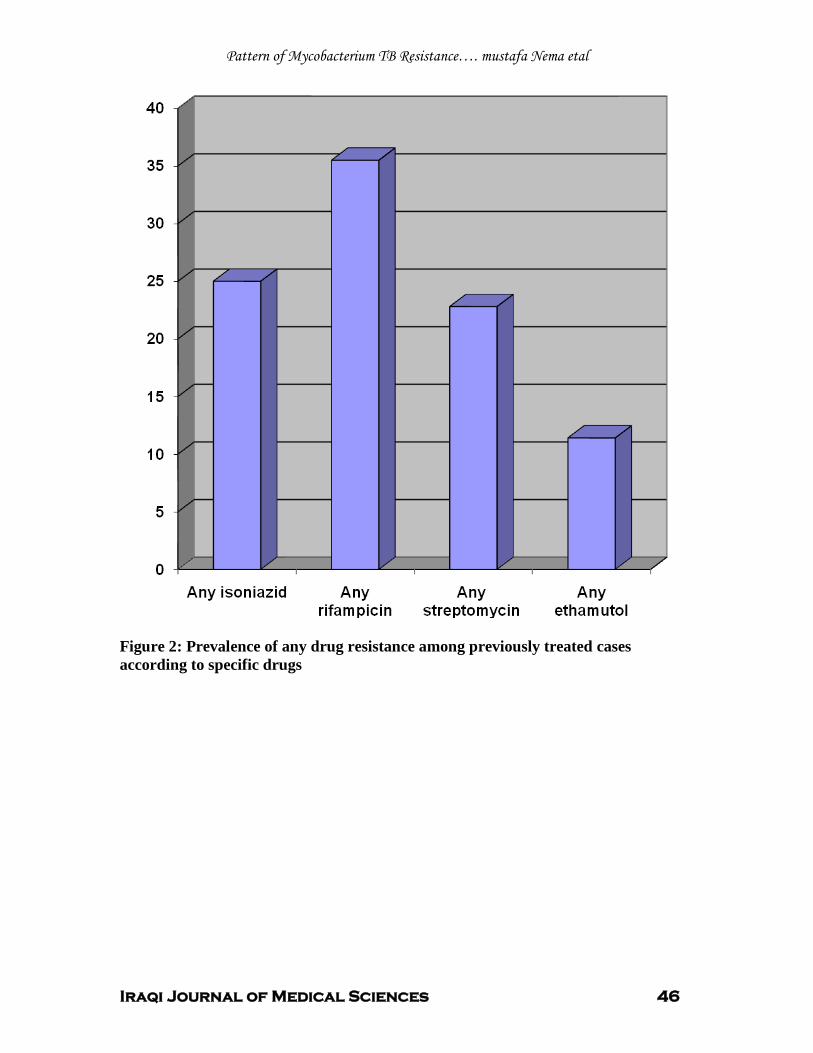
Pattern of Mycobacterium TB Resistance…. mustafa Nema etal
Iraqi Journal of Medical Sciences 46
Figure 2: Prevalence of any drug resistance among previously treated cases according to specific drugs
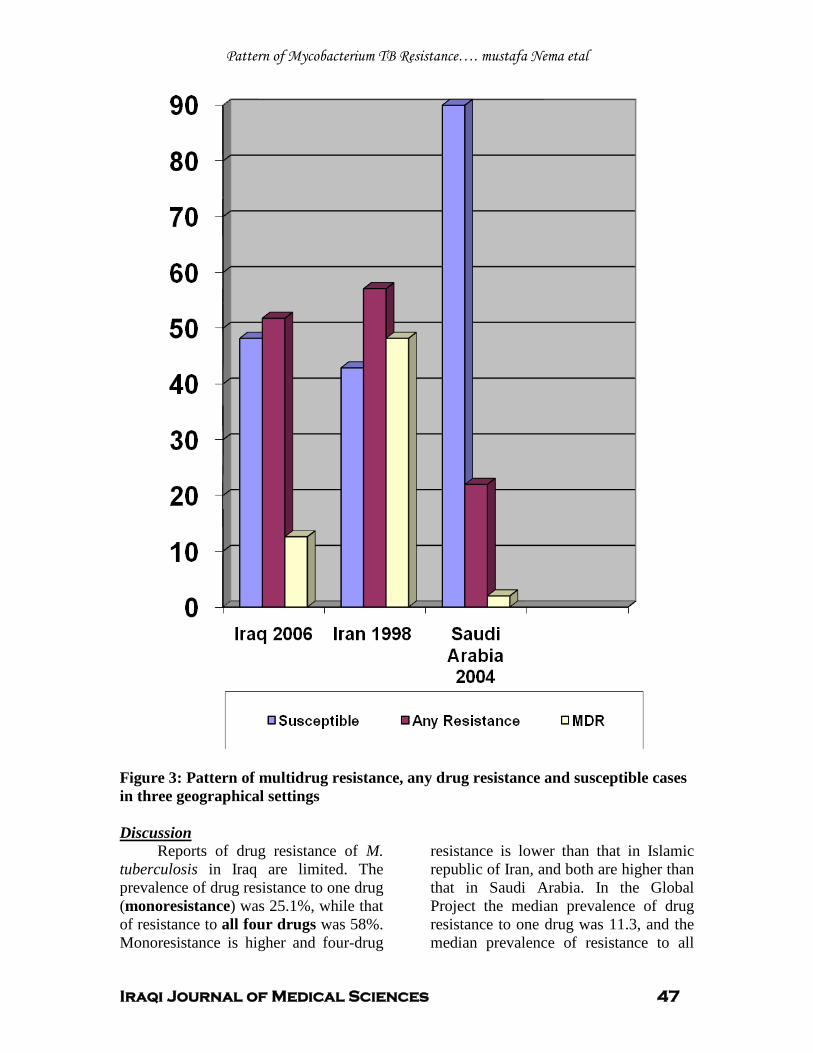
Pattern of Mycobacterium TB Resistance…. mustafa Nema etal
Iraqi Journal of Medical Sciences 47
Figure 3: Pattern of multidrug resistance, any drug resistance and susceptible cases in three geographical settings
Reports of drug resistance of M. tuberculosis in Iraq are limited. The prevalence of drug resistance to one drug (monoresistance) was 25.1%, while that of resistance to all four drugs was 58%. Monoresistance is higher and four-drug
resistance is lower than that in Islamic republic of Iran, and both are higher than that in Saudi Arabia. In the Global Project the median prevalence of drug resistance to one drug was 11.3, and the median prevalence of resistance to all
Discussion
Pattern of Mycobacterium TB Resistance…. mustafa Nema etal
Iraqi Journal of Medical Sciences 48
four drugs was 1.8 (6)
Any drug resistance among previously treated cases found to be 51.8% which is higher than that in Saudi Arabia (22%)
.
(7) and lower than that in Islamic Republic of Iran (57.1%). This type of resistance falls in the median value when compared to other countries in Global Project which is ranged from 0% in Finland to 93.8% in Uruguay with a median prevalence of 23.3 %( 8)
Increases in prevalence of any resistance may reflect an environment that favors the acquisition of additional resistance and can lead to future increases in MDR
.
(1)
High number of drug-resistance among previously treated cases seen in this study may be related to high number of resistant strains circulating the in the community due to very high pool of previously treated cases.
.
MDR-TB among previously treated cases was 12.6%. It is ranged from 0% in 4 geographical settings in Global Project, to 48.2% in Islamic republic of Iran. The median prevalence in Global Project was 9.3%9. In Saudi Arabia it is 14 %( 7). The most powerful predictor of MDR-TB was a history of past treatment, which was usually accompanied by inadequate drug regimen (10)
Monoresistance to rifampicin (R) was (12.6%) outweighing other types of monoresistance (H, E, and S), but is lower than that found Egypt (21.7%)P
(1)
Pand it was not recorded in Islamic Republic of Iran nor in Saudi Arabia P
(7,8)P.
In addition, relatively high prevalence of any rifampicin resistance (35.5%), the most powerful anti-tuberculosis drug and a key determinant of MDR-TB, was reported. It is higher than that recorded in Egypt (7%)P
(1)P and Saudi Arabia
(14%)P
(7)P but lower than that in Islamic
Republic of Iran (50%)P
(8) Rifampicin might be used in Iraq,
unexpectedly, to treat other types of infections, like brucellosis and geneto-urinary infections as well as incorrectly prescribed or taken by patients - singly or inappropriately combined - with other anti-TB; therefore, high level of resistance to this very important anti-TB drug could be produced.
Any resistance to streptomycin (S) was observed in 22.8%, lower than the value found in Egypt (23.6%)P
(1) Pand Iran
(39.3%)P
(8)P but higher than Saudi
(12%)P
(7)P.
Any resistance to ethambutol (E) was noted in 11.4%, which is more than Saudi 10%P
(7)P, but lower than Iran
32.1%P
(8)P, and Egypt (30.9%)P
(1)P.
Polyresistance was noted in 23% of isolates, which is higher than that found in Saudi (1%)P
(7)P, and lower than that
found in Iran (50%)P
(8)P.
When compared to other geographical settings, drug resistance in Iraq outweighs that in Saudi regarding any resistance (51.8 compared to 22%), while it is lower than that in Iran (57.1%). Resistance to one drug was 25.1 which is more than that in Iran and Saudi (7.1 and 6 respectively). Tow and three drug resistance were found to be 13.1 and 6.3%. Both percents are higher than that found Saudi (6 and 2%) and lower than Iran (6% and 14.3 respectively).
In comparison to Islamic Republic of Iran, overall resistance in Iraq was lower (51.8% compared to 57.1%), as well as 4-drug resistance (5.8% compared to 28.6%) and MDR (12.6% compared to 48.2%) while resistance to 1, 2, 3 drug(s) were higher, (48.45, 25.4%, 12.2% compared to 7.1%, 14.3%, 7.1%), (Table 3) (Figure 3).
From total cases sampled, cases
Pattern of Mycobacterium TB Resistance…. mustafa Nema etal
Iraqi Journal of Medical Sciences 49
with any resistance exceed those who were sensitive by about 3%. This may be regarded as a bias related to the drawback of this study in the way of collecting samples, where patient with TB suspected of having some problem (resistance or other complications), were referred to the single institute from different country cities, therefore, the high number of resistance cases found.
.
Many factors acting locally, affect TB control and drug resistance prevalence. These include non-use of DOT regimen in Iraq, effect of war and other social and economic limitations. Acknowledgment
My thanks and gratefulness to Dr. Hashim Al- Kadimy and Dr. Ahmed Asmer for their advices and cooperations.
1. WHO/IUATLD Global Project on Anti-Tuberculosis Drug Resistance Surveillance. Anti-tuberculosis drug resistance in the world: third global report/ the WHO/IUATLD Global Project on Anti-Tuberculosis Drug Resistance Surveillance, 2002.
References
2. Public Health Service Cooperative Investigation. Prevalence of drug resistance in previously untreated patients. American Review of Respiratory Diseases,1964,89 :327-336. 3. Mendez A, Sterling T F, Frieden T R. The relationship between delayed or incomplete treatment and all cause mortality in patients with tuberculosis. JAMA 1996, 276: 1223-1228. 4. Fujino T, Hasegawa N, Satou R, et al. Attributable factors to the emergence of multi-drug resistant Mycobacterium tuberculosis based on the observation of consecutive drug resistance test results. Kekkaku 1998, 73: 471-476. 5. Ismen MD. Drug resistant tuberculosis. In: Ismen MD. A clinician’s guide to tuberculosis. Philadelphia: Lippincott William &Wilkins, 2000: p325. 6. World Health Organization. Anti-tuberculosis drug resistance in the world. The WHO/IUATLD Global Project on Anti-tuberculosis Drug Resistance Surveillance. WHO Report. Geneva,
Switzerland, 2000. 7. Drug resistance patterns of Mycobacterium tuberculosis in Riyadh, Saudi Arabia Kordy F N, Al-Thawadi S, Alrajhi A. INT J TUBERC LUNG DIS 2004, IUATLD 8(8):1007–1011. 8. Afranio L, Luis S, Eduardo W, et al. Retreatment Tuberculosis Cases. Factors Associated With Drug Resistance and Adverse Outcomes. CHEST 1997,111:1162-67. 9. Center of Disease Control WHO/IUATLD Global project on anti-tuberculosis drug resistance surveillance. TB Notes 1997, 4: 15-18. 10. Rattan A, Kalia A, Ahmad N. Multi-drug resistant Mycobacterium tuberculosis: molecular perspectives. Emerg Infect Dis 1998, 4: 195-209
Iraqi Journal of Medical Sciences 50
Immunophenotyphing of Peripheral Blood Lymphocytes to person Exposed to electromagnetic fields
Rafid Abdul -Wahid MSc.
Background: There is considerabl evidence relating electromagnetic fields (EMFs) exposure to reduce immune system competence .and these changes associated with cell growth control, differentiation and proliferation of cells of immune system, trans membrane signaling cascades, gap junction communication, immune system action.
Abstract
Objective: to investigate the Phenotyping of peripheral blood lymphocytes of volunteer’s exposed at least 10 years to electromagnetic fields (EMFs) induced by transmission power lines Subjects and methods: fourty five volunteer’s aged between 25 and 65 Years, exposed for at least 10 years to electromagnetic fields (EMFs) induced by
in their residential area ,
transmission power lines in their residential area and Fifteen male of similar age unexposed, away from the transmission power lines as a control group were used in this study . The electromagnetic fields (EMFs) (with range of 50 Hz) beside the homes of the volunteer’s. This study carried out in three different are as of Baghdad included (Al –Bladyat, Hay al-adel and Al-Dorra cities) , The groups of this study were divided into three sub- groups according to the distance away from the towers of transmission
Results: A statistically significant reduction of PBL percentage bearing CD3,CD4,CD19,CD56(P<0.01) between the exposed volunteers and control ;.except CD8 which showed no significant different between these groups . the mean percentage of CD4
power lines (1) range: from 1 to 25 meter (2) from 25 to 50 meter (3) from 50 to 75 meter . Phenotyping of peripheral blood lymphocytes had been done by direct immunofluorescent microscopy using anti –CD 3(for T-cells detection), anti-CD4 (for T- helper-cells), anti CD8 (for T-cytotoxic/suppressor cells), anti CD21 (for B-cells) and anti CD56 (for natural killer cells).
+/CD8+
Conclusion: we postulated that the chronic exposure to electromagnetic fields from power lines caused suppression in immune system.
ratio in exposed volunteers groups was significantly (P<0.01) lowered in comparison to control group .
Keywords: Electromagnetic felid, CD4, CD8, CD21, CD56, Lymphocytes, phenotyping IRAQI J MED SCI, 2009; VOL.7 (2): 50-58
Biology has preceded electronic physics because brains and cells use oscillating ion currents for controlling the release of neurotransmitters and in the cell to cell communication systems. Biological systems detect and respond to external ELF signals using their built-in receiving and decoding systems (cell-to-cell communication)
Introduction
(1)
.
Dept. Biochemical engineering, Al-Khwarizmi college, Baghdad University. Adress Correspondence to: Rafid Abdul -Wahid E- mail: [email protected] Received: 8th March 2009, Accepted: 19th
In the last five years a large number of experiments have clearly shown various biological and medical effects of (EMFs) at the cellular level, Both human and animal studies report large immunological changes after exposure to environmental levels of electromagnetic fields (EMFs)
May 2009.
(2)
There is considerable evidence relating EMFs exposure to reduce immune system competence. Many of these evidence show that EMFs -caused changes in processes associated with cell growth control, differentiation and proliferation of cells of immune system, trans membrane signaling cascades, gap
.
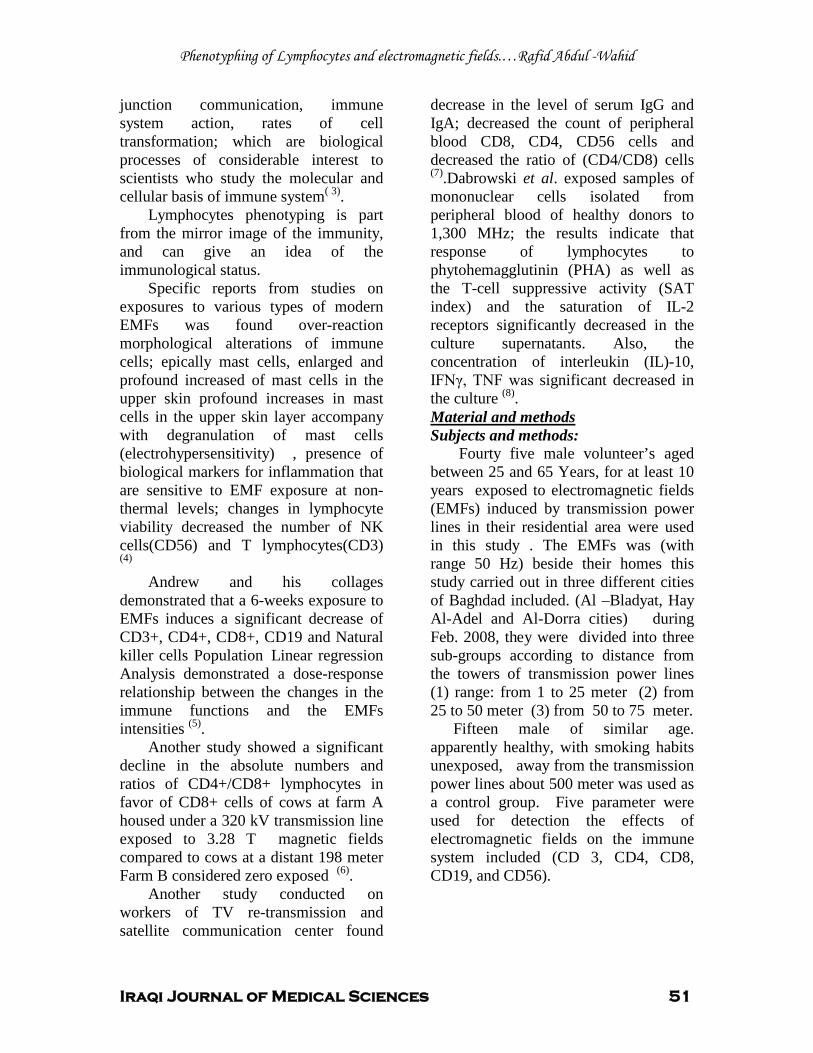
Phenotyphing of Lymphocytes and electromagnetic fields.…Rafid Abdul -Wahid
Iraqi Journal of Medical Sciences 51
junction communication, immune system action, rates of cell transformation; which are biological processes of considerable interest to scientists who study the molecular and cellular basis of immune system( 3)
Lymphocytes phenotyping is part from the mirror image of the immunity, and can give an idea of the immunological status.
.
Specific reports from studies on exposures to various types of modern EMFs was found over-reaction morphological alterations of immune cells; epically mast cells, enlarged and profound increased of mast cells in the upper skin profound increases in mast cells in the upper skin layer accompany with degranulation of mast cells (electrohypersensitivity) , presence of biological markers for inflammation that are sensitive to EMF exposure at non-thermal levels; changes in lymphocyte viability decreased the number of NK cells(CD56) and T lymphocytes(CD3) (4)
2TAndrew and his collages demonstrated that 2Ta 6-weeks exposure to EMFs induces a significant decrease of CD3+, CD4+, CD8+, CD19 and Natural killer cells Population Linear regression Analysis demonstrated a dose-response relationship between the changes in the immune functions and the EMFs intensities P
(5)P.
Another study showed a significant decline in the absolute numbers and ratios of CD4+/CD8+ lymphocytes in favor of CD8+ cells of cows at farm A housed under a 320 kV transmission line exposed to 3.28 T magnetic fields compared to cows at a distant 198 meter Farm B considered zero exposed P
(6)P.
Another study conducted on workers of TV re-transmission and satellite communication center found
decrease in the level of serum IgG and IgA; decreased the count of peripheral blood CD8, CD4, CD56 cells and decreased the ratio of (CD4/CD8) cells P
(7)P.Dabrowski et al. exposed samples of
mononuclear cells isolated from peripheral blood of healthy donors to 1,300 MHz; the results indicate that response of lymphocytes to phytohemagglutinin (PHA) as well as the T-cell suppressive activity (SAT index) and the saturation of IL-2 receptors significantly decreased in the culture supernatants. Also, the concentration of interleukin (IL)-10, IFNγ, TNF was significant decreased in the culture P
(8)P.
UMaterial and methods Subjects and methods:
Fourty five male volunteer’s aged between 25 and 65 Years, for at least 10 years exposed to electromagnetic fields (EMFs) induced by 0Ttransmission power lines 0Tin their residential area were used in this study . The EMFs was (with range 50 Hz) beside their homes this study carried out in three different cities of Baghdad included. (Al –Bladyat, Hay Al-Adel and Al-Dorra cities) during Feb. 2008, they were divided into three sub-groups according to distance from the towers of 0Ttransmission0T power lines (1) range: from 1 to 25 meter (2) from 25 to 50 meter (3) from 50 to 75 meter.
Fifteen male of similar age. apparently healthy, with smoking habits unexposed, away from the transmission power lines about 500 meter was used as a control group. Five parameter were used for detection the effects of electromagnetic fields on the immune system included (CD 3, CD4, CD8, CD19, and CD56).
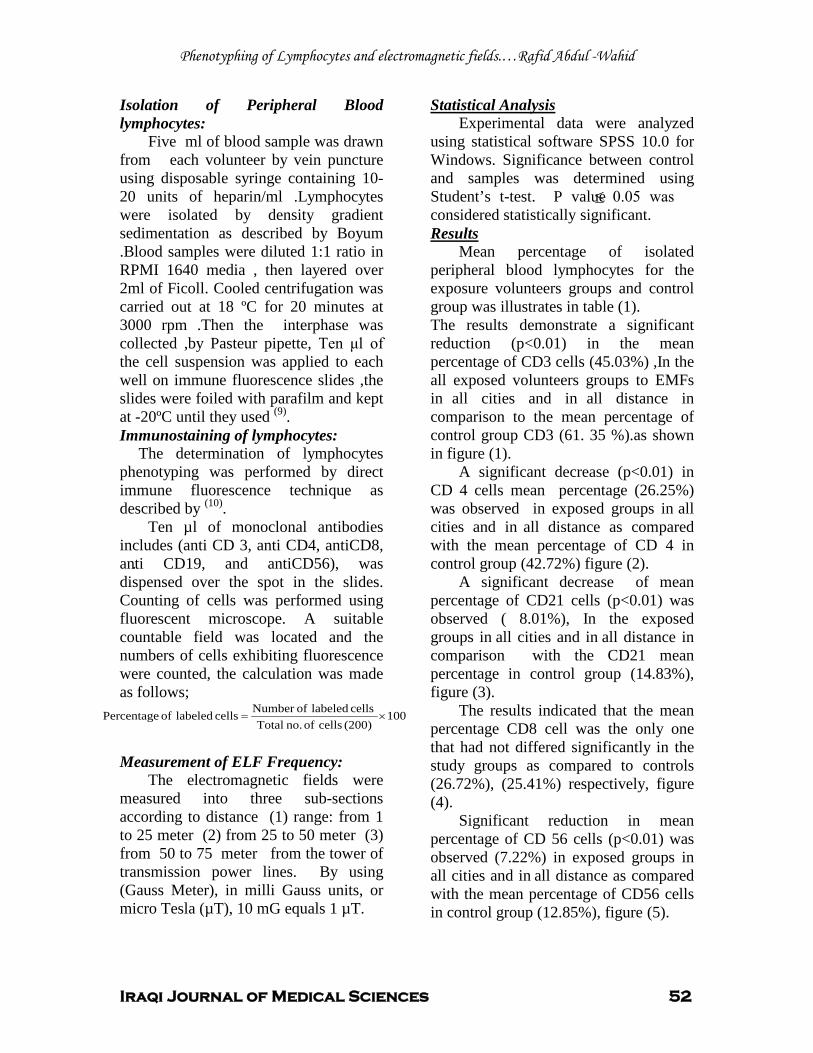
Phenotyphing of Lymphocytes and electromagnetic fields.…Rafid Abdul -Wahid
Iraqi Journal of Medical Sciences 52
Isolation of Peripheral Blood lymphocytes:
.
Five ml of blood sample was drawn from each volunteer by vein puncture using disposable syringe containing 10-20 units of heparin/ml .Lymphocytes were isolated by density gradient sedimentation as described by Boyum .Blood samples were diluted 1:1 ratio in RPMI 1640 media , then layered over 2ml of Ficoll. Cooled centrifugation was carried out at 18 ºC for 20 minutes at 3000 rpm .Then the interphase was collected ,by Pasteur pipette, Ten μl of the cell suspension was applied to each well on immune fluorescence slides ,the slides were foiled with parafilm and kept at -20ºC until they used (9)
Immunostaining of lymphocytes: .
The determination of lymphocytes phenotyping was performed by direct immune fluorescence technique as described by (10)
Ten µl of monoclonal antibodies includes (anti CD 3, anti CD4, antiCD8, anti CD19, and antiCD56), was dispensed over the spot in the slides. Counting of cells was performed using fluorescent microscope. A suitable countable field was located and the numbers of cells exhibiting fluorescence were counted, the calculation was made as follows;
.
100(200) cells of no. Total
cells labeled ofNumber cells labeled of Percentage ×=
Measurement of ELF Frequency:
The electromagnetic fields were measured into three sub-sections according to distance (1) range: from 1 to 25 meter (2) from 25 to 50 meter (3) from 50 to 75 meter from the tower of transmission power lines.
By using (Gauss Meter), in milli Gauss units, or micro Tesla (µT), 10 mG equals 1 µT.
Experimental data were analyzed using statistical software SPSS 10.0 for Windows. Significance between control and samples was determined using Student’s t-test. P value ≤ 0.05 was considered statistically significant.
Statistical Analysis
Mean percentage of isolated peripheral blood lymphocytes for the exposure volunteers groups and control group was illustrates in table (1).
Results
The results demonstrate a significant reduction (p<0.01) in the mean percentage of CD3 cells (45.03%) ,In the all exposed volunteers groups to EMFs in all cities and in
A significant decrease (p<0.01) in CD 4 cells mean percentage (26.25%) was observed in exposed groups in
all distance in comparison to the mean percentage of control group CD3 (61. 35 %).as shown in figure (1).
all cities and in
A significant decrease of mean percentage of CD21 cells (p<0.01) was observed ( 8.01%), In the exposed groups in
all distance as compared with the mean percentage of CD 4 in control group (42.72%) figure (2).
all cities and in
The results indicated that the mean percentage CD8 cell was the only one that had not differed significantly in the study groups as compared to controls (26.72%), (25.41%) respectively, figure (4).
all distance in comparison with the CD21 mean percentage in control group (14.83%), figure (3).
Significant reduction in mean percentage of CD 56 cells (p<0.01) was observed (7.22%) in exposed groups in
all cities and in all distance as compared with the mean percentage of CD56 cells in control group (12.85%), figure (5).
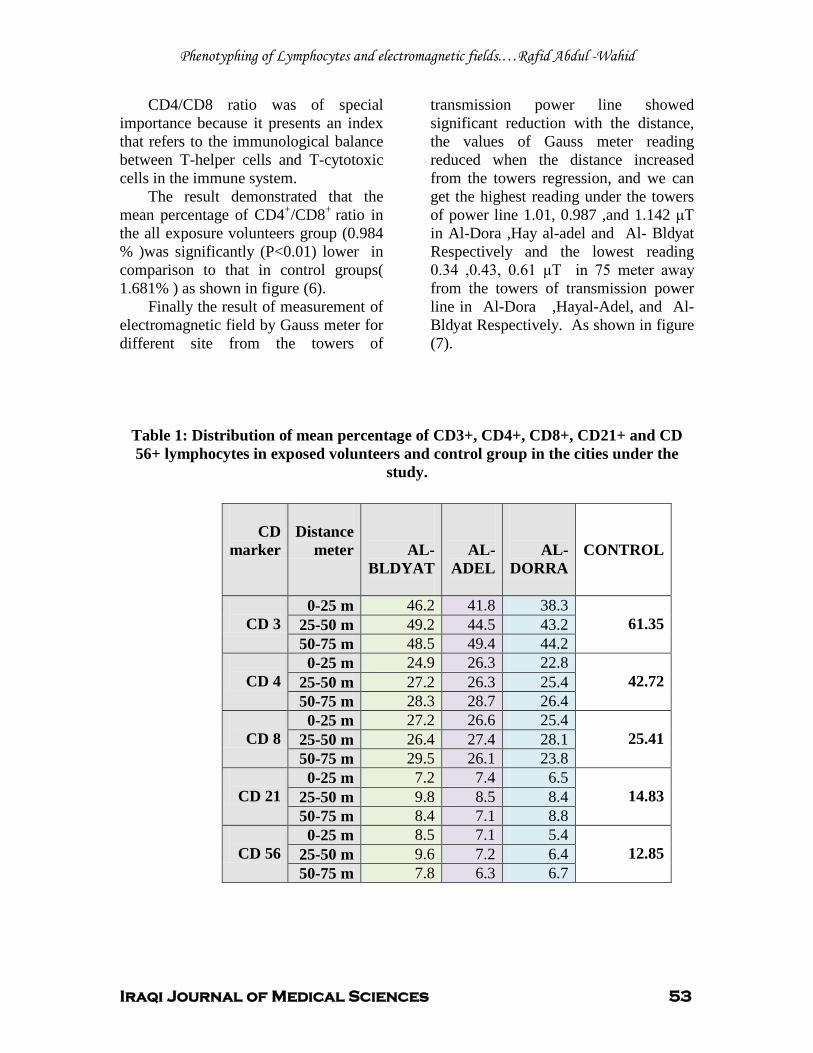
Phenotyphing of Lymphocytes and electromagnetic fields.…Rafid Abdul -Wahid
Iraqi Journal of Medical Sciences 53
CD4/CD8 ratio was of special importance because it presents an index that refers to the immunological balance between T-helper cells and T-cytotoxic cells in the immune system.
The result demonstrated that the mean percentage of CD4+/CD8+
Finally the result of measurement of electromagnetic field by Gauss meter for different site from the towers of
transmission power line showed significant reduction with the distance, the values of Gauss meter reading reduced when the distance increased from the towers regression, and we can get the highest reading under the towers of power line 1.01, 0.987 ,and 1.142 μT in Al-Dora ,Hay al-adel and Al- Bldyat Respectively and the lowest reading 0.34 ,0.43, 0.61 μT in 75 meter away from the towers of transmission power line in Al-Dora ,Hayal-Adel, and Al- Bldyat Respectively. As shown in figure (7).
ratio in the all exposure volunteers group (0.984 % )was significantly (P<0.01) lower in comparison to that in control groups( 1.681% ) as shown in figure (6).
Table 1: Distribution of mean percentage of CD3+, CD4+, CD8+, CD21+ and CD 56+ lymphocytes in exposed volunteers and control group in the cities under the
study.
CD
marker
Distance
meter
AL-BLDYAT
AL-ADEL
AL-DORRA
CONTROL
CD 3
0-25 m 46.2 41.8 38.3 61.35 25-50 m 49.2 44.5 43.2
50-75 m 48.5 49.4 44.2
CD 4 0-25 m 24.9 26.3 22.8
42.72 25-50 m 27.2 26.3 25.4 50-75 m 28.3 28.7 26.4
CD 8
0-25 m 27.2 26.6 25.4 25.41 25-50 m 26.4 27.4 28.1
50-75 m 29.5 26.1 23.8
CD 21 0-25 m 7.2 7.4 6.5
14.83 25-50 m 9.8 8.5 8.4 50-75 m 8.4 7.1 8.8
CD 56
0-25 m 8.5 7.1 5.4 12.85 25-50 m 9.6 7.2 6.4
50-75 m 7.8 6.3 6.7
Phenotyphing of Lymphocytes and electromagnetic fields.…Rafid Abdul -Wahid
Iraqi Journal of Medical Sciences 54
Figure1: the mean percentage of CD3 marker of PBL in all exposure and control
groups with distance in meter
Figure 2: the mean percentage of CD4 marker of PBL in all exposure and control
groups with distance in meter.
Figure 3: the mean percentage of CD21 marker of PBL in all exposure and control
groups with distance in meter
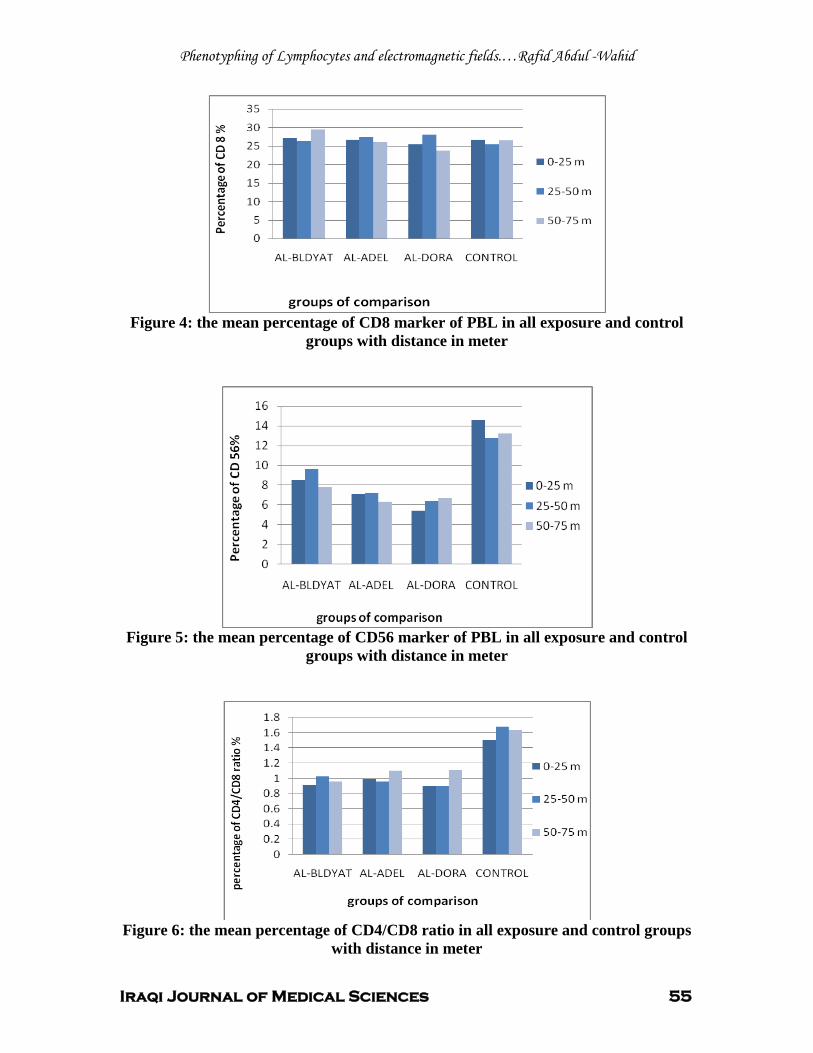
Phenotyphing of Lymphocytes and electromagnetic fields.…Rafid Abdul -Wahid
Iraqi Journal of Medical Sciences 55
Figure 4: the mean percentage of CD8 marker of PBL in all exposure and control
groups with distance in meter
Figure 5: the mean percentage of CD56 marker of PBL in all exposure and control
groups with distance in meter
Figure 6: the mean percentage of CD4/CD8 ratio in all exposure and control groups
with distance in meter
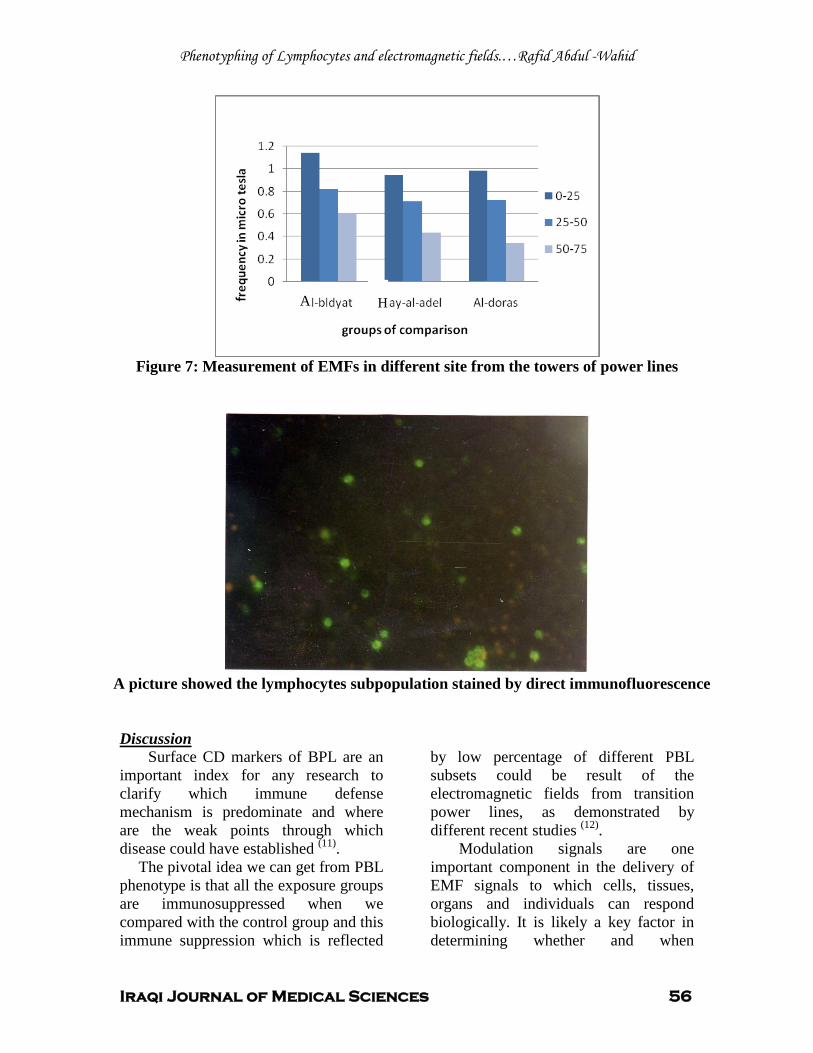
Phenotyphing of Lymphocytes and electromagnetic fields.…Rafid Abdul -Wahid
Iraqi Journal of Medical Sciences 56
Figure 7: Measurement of EMFs in different site from the towers of power lines
A picture showed the lymphocytes subpopulation stained by direct immunofluorescence UDiscussion
Surface CD markers of BPL are an important index for any research to clarify which immune defense mechanism is predominate and where are the weak points through which disease could have established P
(11)P.
The pivotal idea we can get from PBL phenotype is that all the exposure groups are immunosuppressed when we compared with the control group and this immune suppression which is reflected
by low percentage of different PBL subsets could be result of the electromagnetic fields from transition power lines, as demonstrated by different recent studies P
(12)P.
Modulation signals are one important component in the delivery of EMF signals to which cells, tissues, organs and individuals can respond biologically. It is likely a key factor in determining whether and when
A H
Phenotyphing of Lymphocytes and electromagnetic fields.…Rafid Abdul -Wahid
Iraqi Journal of Medical Sciences 57
biological reactivity might be occurring (13)
We hypothesed that the frequency bands between 50 -60 Hz have been to alter immune responses and intercellular communication between lymphocytes such as altering the balance of cytokines, which regulate the growth of cells and determine whether the immune system will produce cells to proliferation and these reflected by the decrease in mean percentage of CD3, CD4, CD21, CD56, and the ratio of CDl4CD8
.
(14)
The cell membrane of lymphocytes contains docking ports on its surface called receptors that allow the cell to pick up distant chemical signals (cytokines, lymphokines ,hormones, neurotransmitters) sent by other Cells through the blood stream and local chemical signals generated by components of immune cells ,we think that many of these cell receptors also function as antennas for particular frequencies of electromagnetic fields and thus might lead to modulate the cell membrane receptor-mediated enzyme cascade in pre-B lymphocytes, with the implication and programmed-cell-death (apoptosis), cell cycle kinetics ,and cytokine expression
.
(15)
Also exposure to EMFs may alter gene and/or protein expression in certain cell types, mRNA functions, immune responses and intercellular communication and this process may altered genes that responsible for the proliferation of different cell type of immune system such as Lymphocytes
.
(16)
There is epidemiologic evidence that extremely low frequency (ELF ≤ 50 Hz) magnetic fields (MF) exposure associated with a decrease in melatonin production. (Melatonin is a hormone produced primarily by the pineal gland,
located in the center of the brain), and this hormone has been found to protect cells, hemopoietic system tissues and organs against oxidative damage induced by a variety of free radical generating agents and processes
.
(17) . According to this decrease damage to hemopoietic tissue, growth factors, cytokines, and genes involved in, apoptosis, signaling pathways and DNA repair might occur, which may decrease the percentage of lymphocytes subpopulations (18)
Several studies demonstrated that EMFs have genotoxic effects
.
on human and animals. Significant increases in
DNA damage including single and double strand breaks and cross-link chromosome conformation and micronucleus formation. Leaks in the membranes surrounding lysosomes could release digestive enzymes, including DNAase (an enzyme that destroys DNA). This explained the serious damage done to the DNA in cells by electromagnetic fields signals (19)
(EMFS) might interfere with regulation of the onset of differentiation and proliferation of B cell and apoptopic processes of actively proliferating cells. This mechanism reflects the low percentage of CD 21 and other subpopulation of lymphocytes
.
(20)
Finally we think that the chronic exposure to electromagnetic fields from power lines caused suppression in immune system which demonstrated in the results from the significant reduction in CD4/CD8 ratio as compared with this ratio in control group because the lower CD4/CD8 ratio the more immune suppression expected
as shown in the results.
(21). also we think that the more important mechanisms which caused immune suppression included DNA breaks in single or double strands and /or modulation signals
Phenotyphing of Lymphocytes and electromagnetic fields.…Rafid Abdul -Wahid
Iraqi Journal of Medical Sciences 58
between immunological cells and cytokines whom responsible for the differentiation and proliferation of immune systems such as interlukines ,interferon ,Th1,and Th2.(22)
.
1. Adey WR. .Biological effects of electromagnetic fields. J. Cell. Biochem. 1993; 51. 410- 416
References
2. Elekesn E, Thuroczy G, Szabo LD. Effect on the immune system of mice exposed chronically to 50 Hz amplitude-modulated 2.45 GHz microwaves. Bioelectromagnetics 1996; 17(3):246-248. 3. Kolomytseva MP, Gapeev AB,Sadovnikov VB, Chemeris NK . Suppression of nonspecific resistance of the body under the effect of extremely high frequency electromagnetic radiation of low intensity.[Article in Russian]. Biofizika. 2002; 47(1):71-77. 4. Novoselova EG, Fesenko EE, Makar VR, Sadovnikov VB. Microwaves and cellular immunity. II. Immunostimulating effects of microwaves and naturally occurrin antioxidant nutrients. Bioelectrochem Bioenerg 1999; 49(1):37-42. 5. Andrew A, Marino
6. Balode Z. Assessment of radio-frequency electromagnetic radiation by the micronucleus test in bovine peripheral erythrocytes .Sci Total Environ 1996; 180(1):81-85, 7. Dmoch A and Moszczynsk P. Levels of immunoglobulin and subpopulations of T Lymphocytes and NK cells in men occupationally exposed to microwave radiatiooccupationally ed to micrwave radiation infrequencies of 6-12 GHz] [Article in Polish]. Med Pr1998; 49(1):45-49. 8. Dabrowski MP, Stankiewicz W,Kubacki R. Immunotropic effects in cultured human blood mononuclear cells pre-exposed to low-level 1300 MHz pulse-modulated microwave field, Electromag. Biol. Med.2003; 22:1-13.31 9. Boyum A .isolation of mononuclear cells and granulocytes from human blood ,Scand J.clin.Lab.Invest .1968;,121(suppl.97):77:89 10. Rieux L, Bahadoran P, Brousse N, etal. Highly restricted human T- cell repertoire in peripheral blood and tissue-infiltrating
lymphocytes in Omenn's syndrome. J. Clin. Invest. 1998, 102: 312-321. 11. Roitt I, Brostoff J, and Male D. Immunology. 6 P
thP edition. Mosby, Harcourt Publishers limited
2002. 12. Holmboe G, and Johansson O. Combi in persons with the physical impairment electro hypersensitivity, in Swedish).Medicinsk Access2005; 1: 58-63. 13. Carrubba S, Frilot C, Chesson A, Marino A .EMFs-induced animal and human brain activity changes Neuroscience.2007; 144:356-67. 14. Chagnaud L and Veyret B. In vivo exposure of rats to GSM-modulated microwaves: flow cytometry analysis of lymphocyte subpopulations and of mitogenstimulation. Int J Radiat Biol 1999; 75(1):111-113. 15. Nikolova T, Czyz J, Rolletschek A, Blyszczuk P. Fuchs. Electromagnetic fields affect transcript levels of apoptosis-related genes in embryonic stem cell-derived neural progenitor cells. ASEB J. 2005;19(12):1686-1688, 16. Remondini D, Nylund R, Reivinen J, etal. Gene expression changes in human cells after exposure tomobile phone microwaves. Proteomics 2006; 6(17):4745-54. 17. Davis S, Mirick DK, Chen C, Stanczyk FZ. Effects of 60-Hz magnetic field exposure onnocturnal 6-sulfatoxymelatonin, estrogens, luteinizing hormone, and follicle-stimulating hormone in healthy reproductive-age women: results of a crossover trial. Ann Epidemiol 2006; 16:622-631. 18. Vijayalaxmi G,and Reiter RJ. Herman. Melatonin and radioprotection from genetic damage: DNA damage in human blood lymphocytes. Mutat Res 1996; 371:221-228. 19. Ivancsits S, Diem E, Jahn O, Rüdiger H. Intermittent extremely low frequencyelectromagnetic fields cause DNA damage in a dose dependent way. Int Arch Occup Env Health2003b; 76:431-436. 20. Pirozzoli MC, Marino C, Lovisolo, et al .Effects of 50 Hz electromagnetic field exposure on apoptosis and differentiation in a neuroblastoma cell line. Bioelectromagnetics, 2003; 24: 510–16 21. Letessier E M, Sacchi M, Johnson T. the absence of lymphoid suppression cells in tumor –involved lymph nodes of patients with cancer .Cell. Immunol 1990; 130:446-458 22. Cousins DJ, Lee TH, Staynov DZ. Cytokine coexpression during human Th1/Th2 cell differentiation: direct evidencefor coordinated expression of Th2 cytokines. J Immunol 2002; 169:2498–2506.
Iraqi Journal of Medical Sciences 59
Ultra structural study of Carboxylester hydrolases activity in the interneuron of the mammalian spinal cord
Ali Abdul-Sattar Abdul-Rhman PhD.
Background: Neurosciences mainly focused on the enzymatic pattern of the neurons, however, in this study the demonstration of certain carboxylaser hydrolases (Alph naphthyl butyrate esterases) activity in the Intrinsic spinal networks neurons (central pattern generator) was performed.
Abstract
Objective: Interneurons or Renshow cells assume autoinhibitor functions, which dampens the a-motoneurons through negative feedback circuit, in addition to that they receive an input from higher centers through which it modify reflex responses to peripheral stimuli by facilitating or inhibiting different populations of interneurons ,however, this issue modulates the performence of specific movement performed by a-motoneurons. Materials and methods: α – naphthyl butyrate used as a broad spectrum substrate in treating minced tissue block of gray matter of the spinal cord in the Rabbit prior to their traetment with the usual way to be examined lateron with the electron micrscopy . Result: Reactivity was clearly evident in a form of deep stained granules in the nuclear matrex
,mitochondera and ,RER , and in certain preneuclear region ,however, the reactivity was varied in the mitochondrea in different neurons examined. Conclusion: Rescentely the term, central pattern generators was used, which address the Intrinsic spinal networks of interneurones that control the timing and pattern of the muscle activity underlying locomotion in mammals,however the effect of the higher centers that modulates the type & tone of movement through those neurons elucidate function which was varied from excitatory-inhibitory, flexor-extensor. The reactivity of those enzymes and their different isoformes that migth have an effect on the molecular and genetic pattern of neurotransmitres were discussed in this study . Keywords: Interneurons,Central pattern generator, Alpha naphthyl butyrate,esterase, Spinal cord
IRAQI J MED SCI, 2009; VOL.7 (2): 59-60
Carboxylester hydrolases has been implicated in a wide range of novel dynamic functions which has been modulated according to the neuronal functions, development and regeneration
Introduction
(1).SinceThose are widely distributed in mammalian tissues, especially those with higher metabolic activity like brain, and spinal cord(2)
.
Dept. Human Anatomy, college of Medicine, Al– Nahrain University. Adress Correspondence to: Dr. Ali Abdul-Sattar Abdul-Rhman E- mail: [email protected] Received: 17th December 2008, Accepted: 20th
They are present as a complex tissue-specific mixture of various components, each of which presumably has a tissue-specific biological role
May 2009.
(3). However the metabolic function and the natural substrate of most carboxylester hydrolases in the different tissues are obscure (4)
Interneuron’s assumes autoinhibitor functions, which dampens the α-motoneurons through negative feedback circuit, in addition to that they receive an input from higher centers through which it modify reflex responses to peripheral stimuli by facilitating or inhibition different populations of interneurons
.
(5), however, this issue need profound
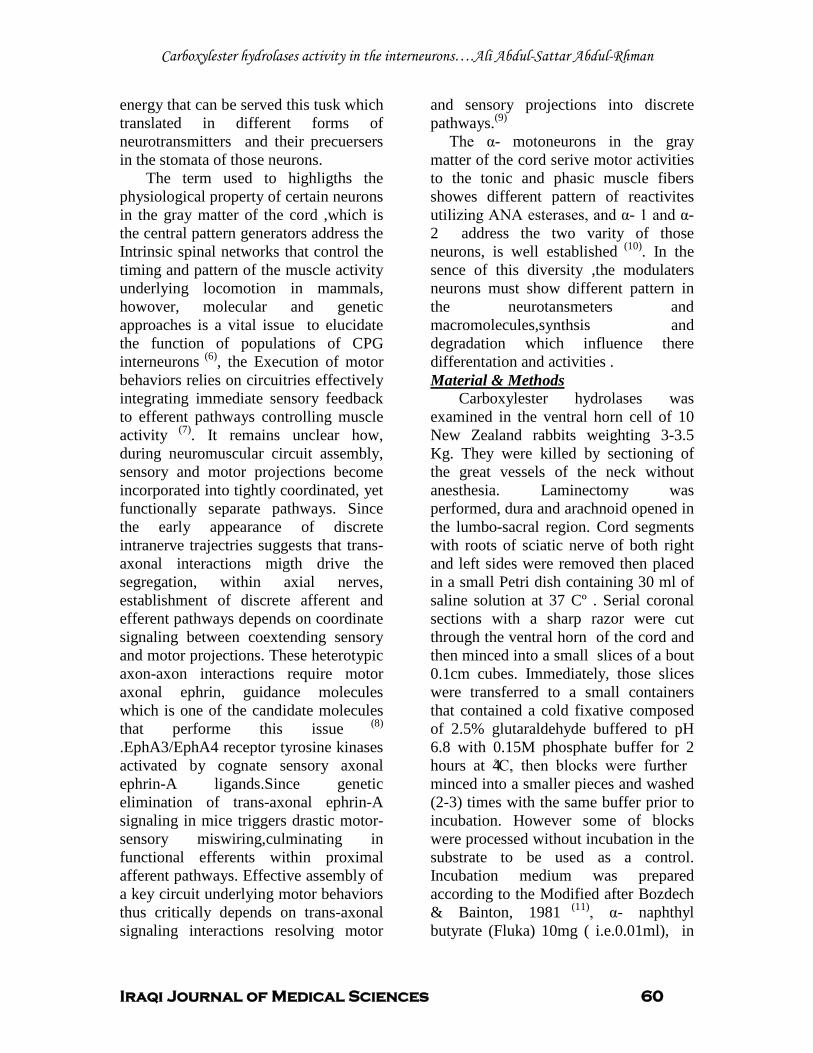
Carboxylester hydrolases activity in the interneurons….Ali Abdul-Sattar Abdul-Rhman
Iraqi Journal of Medical Sciences 60
energy that can be served this tusk which translated in different forms of neurotransmitters and their precuersers in the stomata of those neurons.
The term used to highligths the physiological property of certain neurons in the gray matter of the cord ,which is the central pattern generators address the Intrinsic spinal networks that control the timing and pattern of the muscle activity underlying locomotion in mammals, howover, molecular and genetic approaches is a vital issue to elucidate the function of populations of CPG interneurons (6), the Execution of motor behaviors relies on circuitries effectively integrating immediate sensory feedback to efferent pathways controlling muscle activity (7). It remains unclear how, during neuromuscular circuit assembly, sensory and motor projections become incorporated into tightly coordinated, yet functionally separate pathways. Since the early appearance of discrete intranerve trajectries suggests that trans-axonal interactions migth drive the segregation, within axial nerves, establishment of discrete afferent and efferent pathways depends on coordinate signaling between coextending sensory and motor projections. These heterotypic axon-axon interactions require motor axonal ephrin, guidance molecules which is one of the candidate molecules that performe this issue (8) .EphA3/EphA4 receptor tyrosine kinases activated by cognate sensory axonal ephrin-A ligands.Since genetic elimination of trans-axonal ephrin-A signaling in mice triggers drastic motor-sensory miswiring,culminating in functional efferents within proximal afferent pathways. Effective assembly of a key circuit underlying motor behaviors thus critically depends on trans-axonal signaling interactions resolving motor
and sensory projections into discrete pathways.(9)
The α- motoneurons in the gray matter of the cord serive motor activities to the tonic and phasic muscle fibers showes different pattern of reactivites utilizing ANA esterases, and α- 1 and α- 2 address the two varity of those neurons, is well established
(10). In the sence of this diversity ,the modulaters neurons must show different pattern in the neurotansmeters and macromolecules,synthsis and degradation which influence there differentation and activities .
Carboxylester hydrolases was examined in the ventral horn cell of 10 New Zealand rabbits weighting 3-3.5 Kg. They were killed by sectioning of the great vessels of the neck without anesthesia. Laminectomy was performed, dura and arachnoid opened in the lumbo-sacral region. Cord segments with roots of sciatic nerve of both right and left sides were removed then placed in a small Petri dish containing 30 ml of saline solution at 37 Cº . Serial coronal sections with a sharp razor were cut through the ventral horn of the cord and then minced into a small slices of a bout 0.1cm cubes. Immediately, those slices were transferred to a small containers that contained a cold fixative composed of 2.5% glutaraldehyde buffered to pH 6.8 with 0.15M phosphate buffer for 2 hours at 4C, then blocks were further minced into a smaller pieces and washed (2-3) times with the same buffer prior to incubation. However some of blocks were processed without incubation in the substrate to be used as a control. Incubation medium was prepared according to the Modified after Bozdech & Bainton, 1981
Material & Methods
(11), α- naphthyl butyrate (Fluka) 10mg ( i.e.0.01ml), in
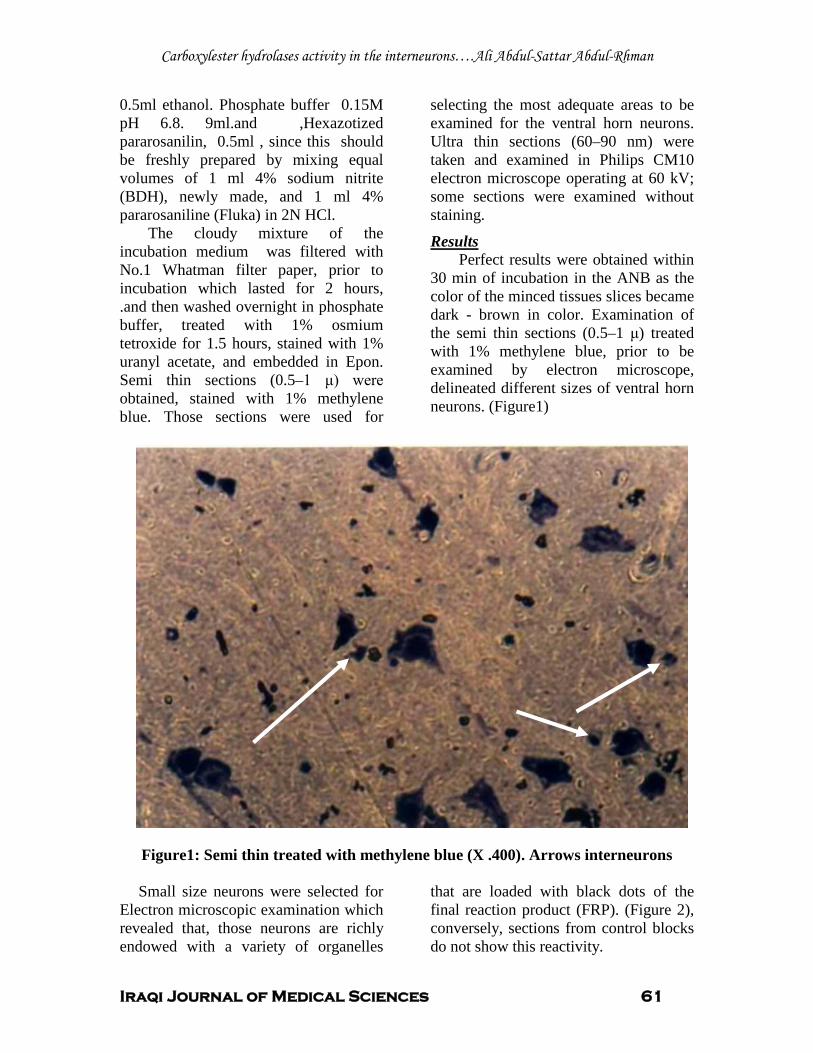
Carboxylester hydrolases activity in the interneurons….Ali Abdul-Sattar Abdul-Rhman
Iraqi Journal of Medical Sciences 61
0.5ml ethanol. Phosphate buffer 0.15M pH 6.8. 9ml.and ,Hexazotized pararosanilin, 0.5ml , since this should be freshly prepared by mixing equal volumes of 1 ml 4% sodium nitrite (BDH), newly made, and 1 ml 4% pararosaniline (Fluka) in 2N HCl.
The cloudy mixture of the incubation medium was filtered with No.1 Whatman filter paper, prior to incubation which lasted for 2 hours, .and then washed overnight in phosphate buffer, treated with 1% osmium tetroxide for 1.5 hours, stained with 1% uranyl acetate, and embedded in Epon. Semi thin sections (0.5–1 μ) were obtained, stained with 1% methylene blue. Those sections were used for
selecting the most adequate areas to be examined for the ventral horn neurons. Ultra thin sections (60–90 nm) were taken and examined in Philips CM10 electron microscope operating at 60 kV; some sections were examined without staining.
Perfect results were obtained within 30 min of incubation in the ANB as the color of the minced tissues slices became dark - brown in color. Examination of the semi thin sections (0.5–1 μ) treated with 1% methylene blue, prior to be examined by electron microscope, delineated different sizes of ventral horn neurons. (Figure1)
Results
Figure1: Semi thin treated with methylene blue (X .400). Arrows interneurons Small size neurons were selected for
Electron microscopic examination which revealed that, those neurons are richly endowed with a variety of organelles
that are loaded with black dots of the final reaction product (FRP). (Figure 2), conversely, sections from control blocks do not show this reactivity.
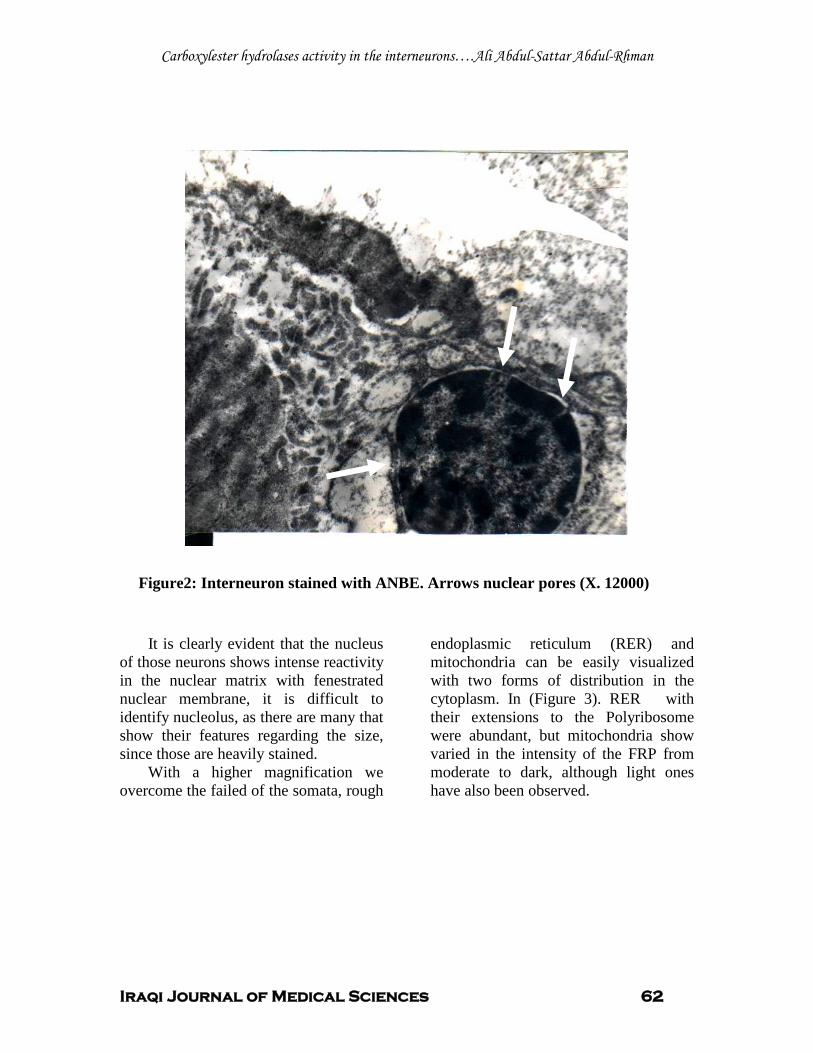
Carboxylester hydrolases activity in the interneurons….Ali Abdul-Sattar Abdul-Rhman
Iraqi Journal of Medical Sciences 62
Figure2: Interneuron stained with ANBE. Arrows nuclear pores (X. 12000)
It is clearly evident that the nucleus of those neurons shows intense reactivity in the nuclear matrix with fenestrated nuclear membrane, it is difficult to identify nucleolus, as there are many that show their features regarding the size, since those are heavily stained.
With a higher magnification we overcome the failed of the somata, rough
endoplasmic reticulum (RER) and mitochondria can be easily visualized with two forms of distribution in the cytoplasm. In (Figure 3). RER with their extensions to the Polyribosome were abundant, but mitochondria show varied in the intensity of the FRP from moderate to dark, although light ones have also been observed.
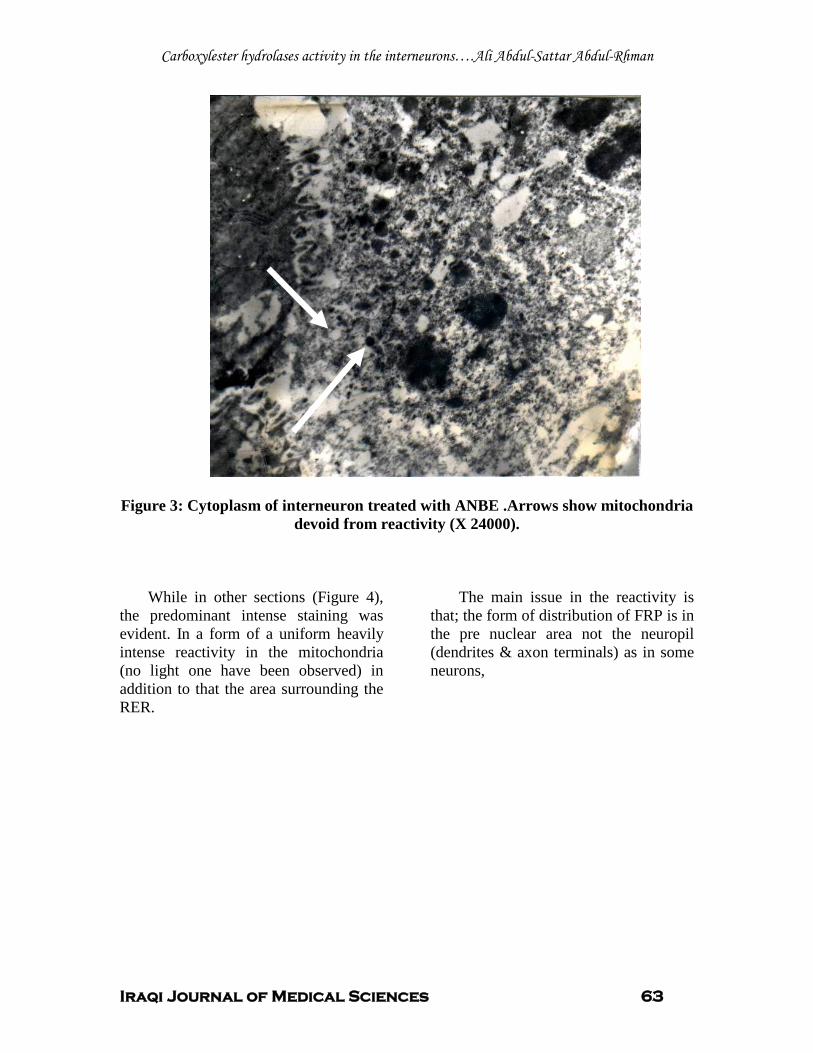
Carboxylester hydrolases activity in the interneurons….Ali Abdul-Sattar Abdul-Rhman
Iraqi Journal of Medical Sciences 63
Figure 3: Cytoplasm of interneuron treated with ANBE .Arrows show mitochondria
devoid from reactivity (X 24000).
While in other sections (Figure 4), the predominant intense staining was evident. In a form of a uniform heavily intense reactivity in the mitochondria (no light one have been observed) in addition to that the area surrounding the RER.
The main issue in the reactivity is that; the form of distribution of FRP is in the pre nuclear area not the neuropil (dendrites & axon terminals) as in some neurons,
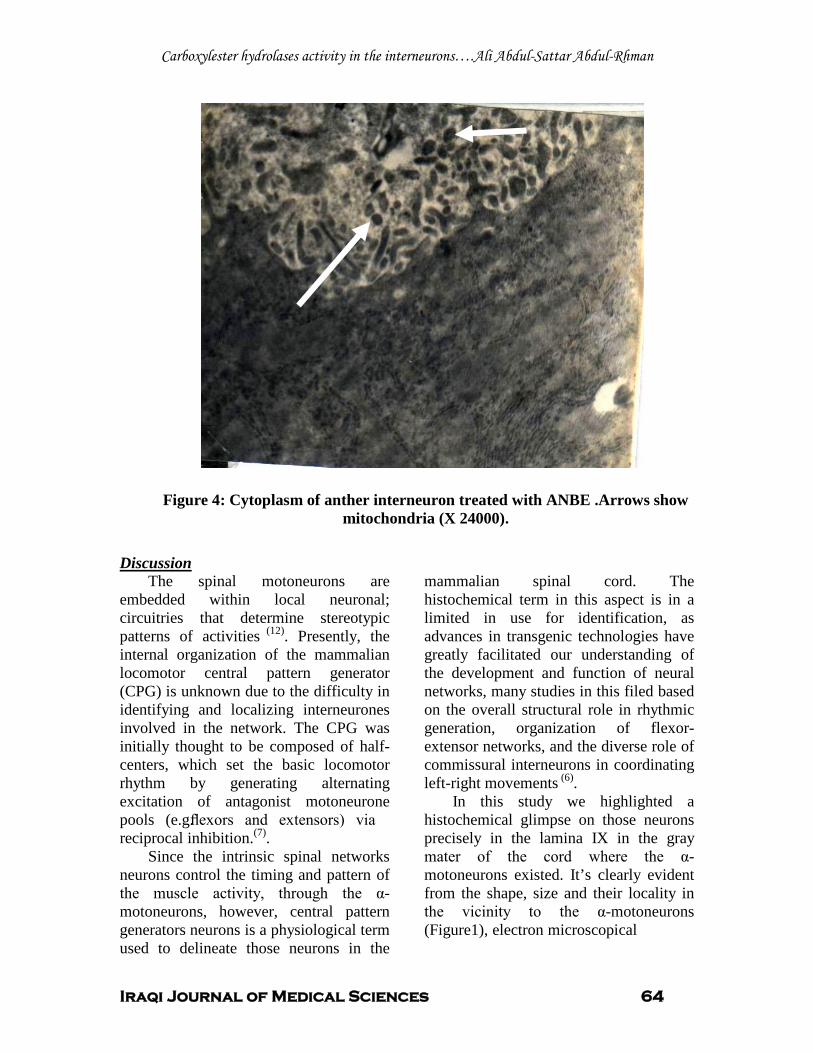
Carboxylester hydrolases activity in the interneurons….Ali Abdul-Sattar Abdul-Rhman
Iraqi Journal of Medical Sciences 64
Figure 4: Cytoplasm of anther interneuron treated with ANBE .Arrows show mitochondria (X 24000).
The spinal motoneurons are embedded within local neuronal; circuitries that determine stereotypic patterns of activities
Discussion
(12). Presently, the internal organization of the mammalian locomotor central pattern generator (CPG) is unknown due to the difficulty in identifying and localizing interneurones involved in the network. The CPG was initially thought to be composed of half-centers, which set the basic locomotor rhythm by generating alternating excitation of antagonist motoneurone pools (e.g. flexors and extensors) via reciprocal inhibition.(7)
Since the intrinsic spinal networks neurons control the timing and pattern of the muscle activity, through the α-motoneurons, however, central pattern generators neurons is a physiological term used to delineate those neurons in the
mammalian spinal cord. The histochemical term in this aspect is in a limited in use for identification, as advances in transgenic technologies have greatly facilitated our understanding of the development and function of neural networks, many studies in this filed based on the overall structural role in rhythmic generation, organization of flexor-extensor networks, and the diverse role of commissural interneurons in coordinating left-right movements
.
(6)
In this study we highlighted a histochemical glimpse on those neurons precisely in the lamina IX in the gray mater of the cord where the α- motoneurons existed. It’s clearly evident from the shape, size and their locality in the vicinity to the α-motoneurons (Figure1), electron microscopical
.
Carboxylester hydrolases activity in the interneurons….Ali Abdul-Sattar Abdul-Rhman
Iraqi Journal of Medical Sciences 65
reading indicates, tremendous activity of those neurons in the synthesis of transgenes for the different profile of carboxyl ester hydrolysis precursors regarding the ANB esterase, as utilized in this study which is visualized in the nucleus as huge black dots in the nuclear matrix, and the abundant nuclear pores in the nuclear membrane indicating active transportation of these precursors (Figure 2) (13)
The observation of Gallarda, et al 2008, about the segregation of axial nerve into motor and sensory fibers was based on the initial interactions between median medial column axon that extened to axial target and dorsal root ganglia neurites eventually resolve into sharply segregated proximal motor-sensory pathways,since the use of many polypaptide like nerve growth factor and neurotrophin-3, to select for nocioeptive and proprioceptive classes of sensory neurons,respectively ,they found that effective segregation of sensory and motor projections occurred irrespective of sensory subtype .Nevertheless motor axon of media medial column more frequently crossed into proprioceptive explants compared with nocioceptive cultures, homotypic (e.g. motor-motor) co-cultures failed to display axon segregation, stressing the heterotypic natuer of the underlying interactions.
.
On cellular bases the segregation of peripheral nerve fibers in to sensory and motor is well established due to the trans-axonal interactions (14).However axon-axon interaction have been implicated in olfactory and retinal axon targeting in Drosophila and mouse (15)
To address the two forms of reactivity in the cytoplasm of interneurons on histochemical bases utilizing ANBE as a substrate (Figure 3 .4 ),this prompts the question of the two
verities of interneurons ,in the cytoplasm precisely in the mitochondria ( Figure 3) some of them were devoid from reactivity while in (Figure4) all the mitochondria shows reactivity.
.
The important issue is that, trans axonal reaction were inducted through the CPG neurons on α-motoneurons with two version in the reactivity of the ANB esterase which is one form of carboxylester hydrolases as, this form of carboxyl ester share in the synthesis and degradation of macromolecules formation in order to segregate motor axons that serve tonic or phasic muscle fibers. In this study it is an easy way in our histochemical practice to donate the trans-axonal interactions on motor nerve fibers with two forms of action modalities via ANB esterase, and CPG1, CPG 2 neurons in the gray matter of the mammalian cord is easily addressed via the activity of this form of carboxyl ester.
1. Dupree JL, Bigbee JW. Acetylcholinesterase inhibitor treatment delays recovery from axotomy in cultured dorsal root ganglion neurons. Journal of Neurocytology, 1996; May. 8 (25) 439-454.
References
2. Deimling OV & Böcking A. Esterases in histochemistry and ultrahistochemistry. Histochem J, 1976; 8: 215-252. 3. Luppa H & Andrä J. Histochemistry of carboxyl ester hydrolases: Problems and possibilities. Histochemical Journal. 1983; 15: 111-137. 4. Oliver C, Lewis PR, & Stoward PJ. Esterases. In: Stoward PJ 7 Pearse AGE (Eds.) Histochemistry Theoretical and Applied.Vol III: Enzyme Histochemistry .4th ed. Churchill Livingstone. Edinburgh. 1991; pp219-239. 5. Kandel ER, Schwartz JH, & Jessell TM, (Eds.). Principles of Neural Science 4th edition .Mc Graw-Hill. 2000; pp.713- 755. 6. Ole Kiehn. Locomotor circuits in the mammalian spinal cord. Annual Review of Neuroscience. 2006; Vol. 29: 279-306. 7. Rybak I A, Stecina K, Shevtsova NA, McCrea DA. Modelling spinal circuitry involved in locomotor pattern generation: insights from the effects of afferent stimulation. J Physiol. 2006; 577.2. pp 617-639.

Carboxylester hydrolases activity in the interneurons….Ali Abdul-Sattar Abdul-Rhman
Iraqi Journal of Medical Sciences 66
8. Simon J B, Butt. Line Lundfald, and Ole Kiehn. EphA4 defines a class of excitatory locomotor-related interneurons. 14098 –14103, PNAS September 27, 2005; vol. 102 no. 39. 9. Gallarda B W, Bonanomi D, Müller D, Brown A, Alaynick W A, Andrews S E, Lemke G, et al.Segregation of Axial Motor and Sensory Pathways via Heterotypic Trans-Axonal Signaling. Science Vol. 320. no. 5873.2008; pp. 233 – 236 10. Al Taii A A, Al Azzawi H T. A histochemical study on the α-motoneurons of the spinal cord of the rabbit. M.Sc. Thesis College of Medicin Baghdad uni. (1989). 11. Bozedech MJ & Bainton DF .Identification of α-naphthyl butyrate esterase as a plasma membrane ectoenzyme of monocytes and as a direct intracellular membrane-bound organelle in lymphocytes. J. of Exper. Med. 1981; 153: 182. 12. Goulding M, Pfaff SL. Curr, Opin: Development of circuits that generate simple rhythmic behaviors in vertebrates. Neurobiol: 15. 14. 2005. 13. Junqueira L C, Carneiro J .Text & Atlas. Basic Histology 11th ed. McGraw-Hill. 2005; pp 51-65. 14. Honig MG, Farse P A, Camilli S J. The spatial relationships among cutaneous, muscle sensory and motoneuron axons during development of the chick hindlimb. Development .1998; 125. 995. 15. Luo L & Flanagan J G. Development of continuous and discrete neural maps. Neuron, 2007; 56. 284.
Iraqi Journal of Medical Sciences 67
A study for the correlation between eosinophil Derived Neurotoxin (EDN) and asthma.
Shehab.A.Lafei1PhD, Nidhal Abdul-Mohymen2 PhD, Amer Al-Najjar3
PhD.
Background: Eosinophil Derived Neurotoxin (EDN) has been used to assess eosinophil cells activity and to monitor inflammation in asthmatic patients.
Abstract
Objective: Study the correlation between Eosinophil Derived Neurotoxin (EDN) and asthma. Materials and methods: Eosinophil Derived Neurotoxin (EDN) was extracted from eosinophils taken from patients with eosinophilic leukemia.This extract was conducted to study its biological effects (Gordon phenomena) and detection of antibodies against it in urine samples of diagnosed asthmatic patients.
Results: One of the two tested rabbits with the extracted EDN test material showed the signs and symptoms of Gordon phenomenon during the second day after injection and continued to show complete paralysis within the fifth day .Patients urine results showed that it contained a higher values of END than the control subjects urine . Conclusion: Results revealed that EDN is a product that can be used as a monitor for asthma. Key words: EDN, asthma, ELISA. IRAQI J MED SCI, 2009; VOL.7 (2):67-74
Pathophysiological changes of asthma are different , complex and involve interactions of several cellular and humoral mediators
Introduction
(1,2,3 ).Among the important cells types is the eosinophils.Four different cationic proteins and one neutral protein have been isolated from eosinophil. These products show potency to be a markers of the severity of inflammation (4,5).Major Basic Protein (MBP), constitutes the core of eosinophil granule and showed cytotoxicity to several helminthes, protozoa and bacteria (6,7). It increases the hyperactivity on bronchial smooth muscle contraction in rabbits (8)
A positive correlation have been observed between the concentration of
.
1Dept. Microbiology, college of Medicine Al-Anbar University, 2Dept. Microbiology college of Medicine Al-Nahrain University, 3
Adress Correspondence to: Dr. Nidhal AbdulMohymen.
Dept. Microbiology, college of Medicine Al- Al Mustansiyria University.
E- mail: [email protected] Received: 3rd December 2008, Accepted: 6th
MBP and the number of thedesquamated epithelial in bronchoalveolar lavage as well as the degree of airway hyperresponsiveness in individuals
May 2009.
(9)
MBP may induce airway hyperresponsiveness through its ability to inhibit binding of acetylcholine to muscarinic M2 receptors, resulting in the release of acetylcholine
.
(10).Eosinophil Cationic Protein (ECP) , is a granule protein belongs to RNA–ase superfamily, it shows ribonuclease -3 activity. This protein is rich with arginine and its molecular weight is 18-21 KD (11)
ECP has many biological activities it elicits Gordon phenomenon when injected intrathecally in rabbits
.
(12, 13). It is able to release histamine from Mast cells (14). Eosinophil Derived Neurotoxin EDN or eosinophil Protein x (EPX):- It is a glycosilated single chain with protein with molecular weight of 18-21 KD. It is a member of ribonuclease -A- activity (13, 15). Although EDN shows high sequence homology to ECP, it has
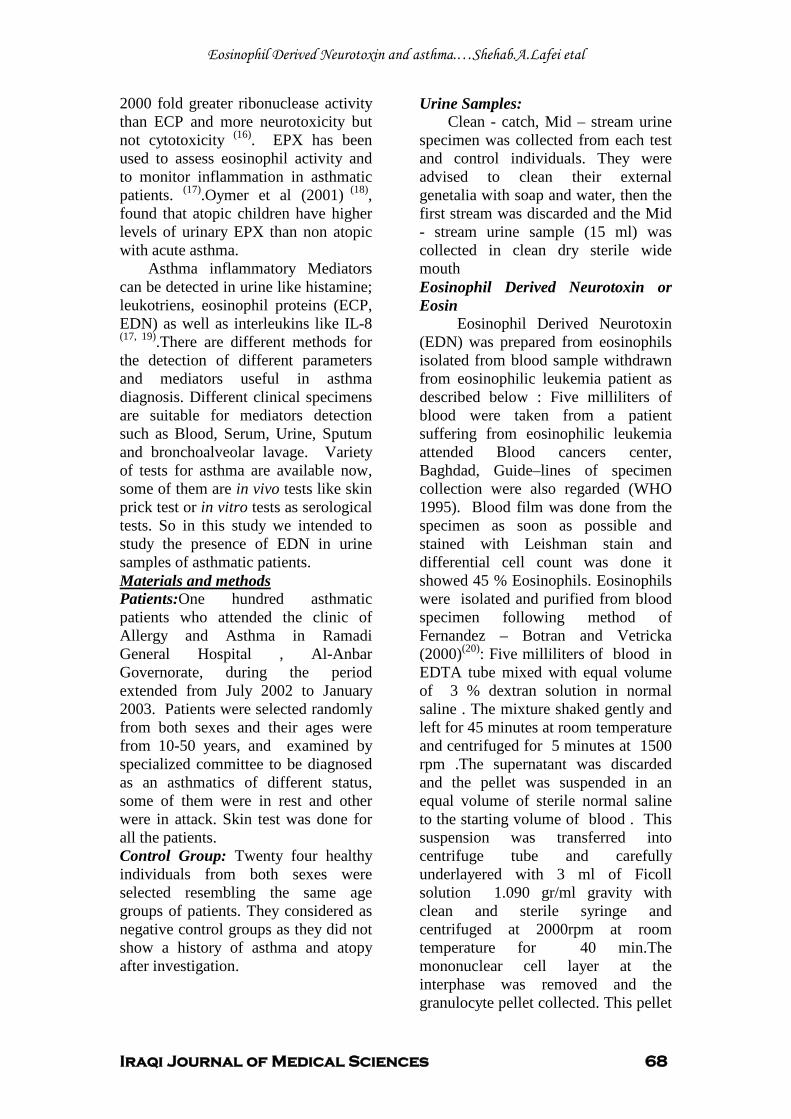
Eosinophil Derived Neurotoxin and asthma.…Shehab.A.Lafei etal
Iraqi Journal of Medical Sciences 68
2000 fold greater ribonuclease activity than ECP and more neurotoxicity but not cytotoxicity (16). EPX has been used to assess eosinophil activity and to monitor inflammation in asthmatic patients. (17).Oymer et al (2001) (18)
Asthma inflammatory Mediators can be detected in urine like histamine; leukotriens, eosinophil proteins (ECP, EDN) as well as interleukins like IL-8
, found that atopic children have higher levels of urinary EPX than non atopic with acute asthma.
(17, 19).There are different methods for the detection of different parameters and mediators useful in asthma diagnosis. Different clinical specimens are suitable for mediators detection such as Blood, Serum, Urine, Sputum and bronchoalveolar lavage. Variety of tests for asthma are available now, some of them are in vivo tests like skin prick test or in vitro tests as serological tests. So in this study we intended to study the presence of EDN in urine samples of asthmatic patients. Materials and methodsPatients:One hundred asthmatic patients who attended the clinic of Allergy and Asthma in Ramadi General Hospital , Al-Anbar Governorate, during the period extended from July 2002 to January 2003. Patients were selected randomly from both sexes and their ages were from 10-50 years, and examined by specialized committee to be diagnosed as an asthmatics of different status, some of them were in rest and other were in attack. Skin test was done for all the patients.
Control Group: Twenty four healthy individuals from both sexes were selected resembling the same age groups of patients. They considered as negative control groups as they did not show a history of asthma and atopy after investigation.
Urine Samples: Clean - catch, Mid – stream urine
specimen was collected from each test and control individuals. They were advised to clean their external genetalia with soap and water, then the first stream was discarded and the Mid - stream urine sample (15 ml) was collected in clean dry sterile wide mouth Eosinophil Derived Neurotoxin or Eosin
Eosinophil Derived Neurotoxin (EDN) was prepared from eosinophils isolated from blood sample withdrawn from eosinophilic leukemia patient as described below : Five milliliters of blood were taken from a patient suffering from eosinophilic leukemia attended Blood cancers center, Baghdad, Guide–lines of specimen collection were also regarded (WHO 1995). Blood film was done from the specimen as soon as possible and stained with Leishman stain and differential cell count was done it showed 45 % Eosinophils. Eosinophils were isolated and purified from blood specimen following method of Fernandez – Botran and Vetricka (2000)(20): Five milliliters of blood in EDTA tube mixed with equal volume of 3 % dextran solution in normal saline . The mixture shaked gently and left for 45 minutes at room temperature and centrifuged for 5 minutes at 1500 rpm .The supernatant was discarded and the pellet was suspended in an equal volume of sterile normal saline to the starting volume of blood . This suspension was transferred into centrifuge tube and carefully underlayered with 3 ml of Ficoll solution 1.090 gr/ml gravity with clean and sterile syringe and centrifuged at 2000rpm at room temperature for 40 min.The mononuclear cell layer at the interphase was removed and the granulocyte pellet collected. This pellet
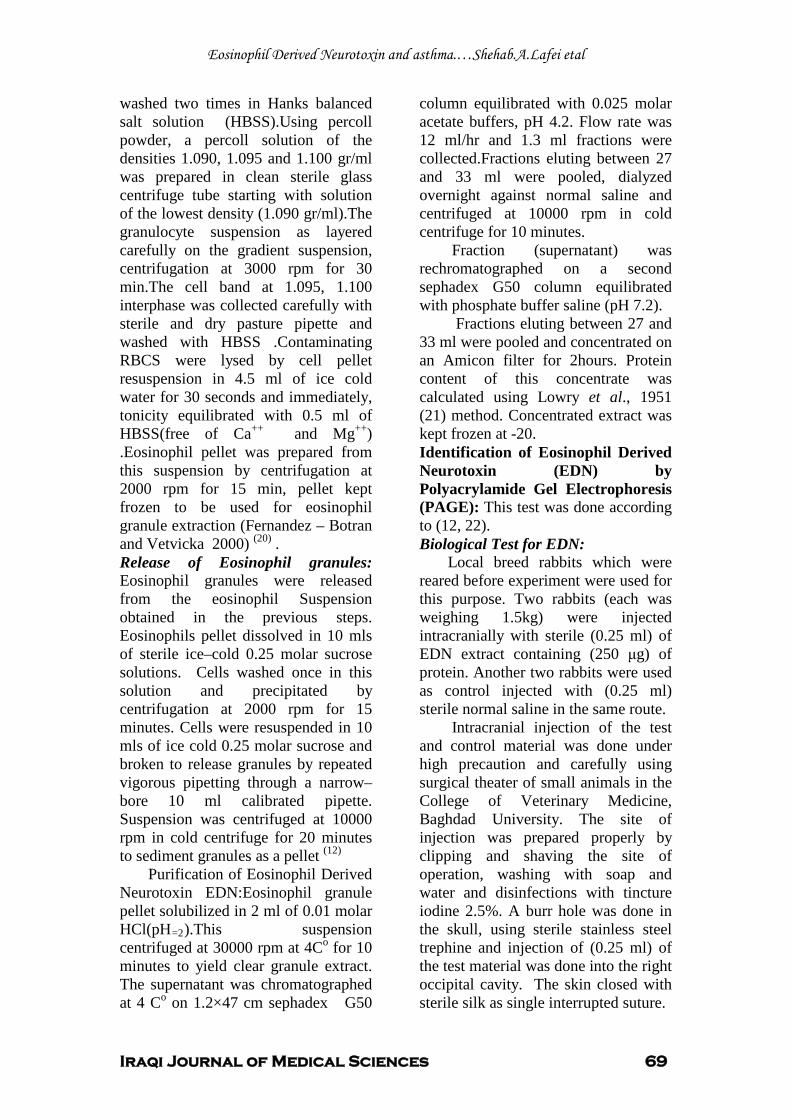
Eosinophil Derived Neurotoxin and asthma.…Shehab.A.Lafei etal
Iraqi Journal of Medical Sciences 69
washed two times in Hanks balanced salt solution (HBSS).Using percoll powder, a percoll solution of the densities 1.090, 1.095 and 1.100 gr/ml was prepared in clean sterile glass centrifuge tube starting with solution of the lowest density (1.090 gr/ml).The granulocyte suspension as layered carefully on the gradient suspension, centrifugation at 3000 rpm for 30 min.The cell band at 1.095, 1.100 interphase was collected carefully with sterile and dry pasture pipette and washed with HBSS .Contaminating RBCS were lysed by cell pellet resuspension in 4.5 ml of ice cold water for 30 seconds and immediately, tonicity equilibrated with 0.5 ml of HBSS(free of Ca++ and Mg++) .Eosinophil pellet was prepared from this suspension by centrifugation at 2000 rpm for 15 min, pellet kept frozen to be used for eosinophil granule extraction (Fernandez – Botran and Vetvicka 2000) (20)
Release of Eosinophil granules: Eosinophil granules were released from the eosinophil Suspension obtained in the previous steps. Eosinophils pellet dissolved in 10 mls of sterile ice–cold 0.25 molar sucrose solutions. Cells washed once in this solution and precipitated by centrifugation at 2000 rpm for 15 minutes. Cells were resuspended in 10 mls of ice cold 0.25 molar sucrose and broken to release granules by repeated vigorous pipetting through a narrow–bore 10 ml calibrated pipette. Suspension was centrifuged at 10000 rpm in cold centrifuge for 20 minutes to sediment granules as a pellet
.
(12)
Purification of Eosinophil Derived Neurotoxin EDN:Eosinophil granule pellet solubilized in 2 ml of 0.01 molar HCl(pHR=2R).This suspension centrifuged at 30000 rpm at 4C P
oP for 10
minutes to yield clear granule extract. The supernatant was chromatographed at 4 C P
oP on 1.2×47 cm sephadex G50
column equilibrated with 0.025 molar acetate buffers, pH 4.2. Flow rate was 12 ml/hr and 1.3 ml fractions were collected.Fractions eluting between 27 and 33 ml were pooled, dialyzed overnight against normal saline and centrifuged at 10000 rpm in cold centrifuge for 10 minutes.
Fraction (supernatant) was rechromatographed on a second sephadex G50 column equilibrated with phosphate buffer saline (pH 7.2).
Fractions eluting between 27 and 33 ml were pooled and concentrated on an Amicon filter for 2hours. Protein content of this concentrate was calculated using Lowry et al., 1951 (21) method. Concentrated extract was kept frozen at -20. Identification of Eosinophil Derived Neurotoxin (EDN) by Polyacrylamide Gel Electrophoresis (PAGE): This test was done according to (12, 22). Biological Test for EDN:
Local breed rabbits which were reared before experiment were used for this purpose. Two rabbits (each was weighing 1.5kg) were injected intracranially with sterile (0.25 ml) of EDN extract containing (250 μg) of protein. Another two rabbits were used as control injected with (0.25 ml) sterile normal saline in the same route.
Intracranial injection of the test and control material was done under high precaution and carefully using surgical theater of small animals in the College of Veterinary Medicine, Baghdad University. The site of injection was prepared properly by clipping and shaving the site of operation, washing with soap and water and disinfections with tincture iodine 2.5%. A burr hole was done in the skull, using sterile stainless steel trephine and injection of (0.25 ml) of the test material was done into the right occipital cavity. The skin closed with sterile silk as single interrupted suture.
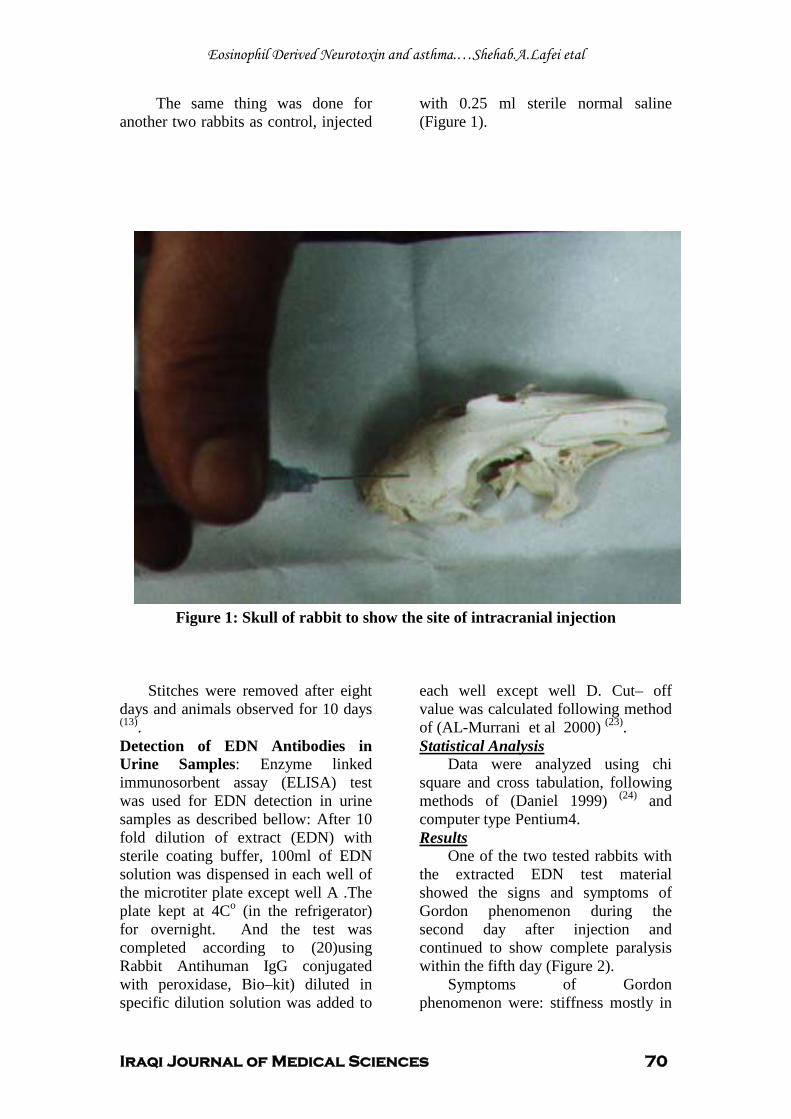
Eosinophil Derived Neurotoxin and asthma.…Shehab.A.Lafei etal
Iraqi Journal of Medical Sciences 70
The same thing was done for another two rabbits as control, injected
with 0.25 ml sterile normal saline (Figure 1).
.
Figure 1: Skull of rabbit to show the site of intracranial injection
Stitches were removed after eight
days and animals observed for 10 days (13)
Detection of EDN Antibodies in Urine Samples: Enzyme linked immunosorbent assay (ELISA) test was used for EDN detection in urine samples as described bellow: After 10 fold dilution of extract (EDN) with sterile coating buffer, 100ml of EDN solution was dispensed in each well of the microtiter plate except well A .The plate kept at 4C
.
o (in the refrigerator) for overnight. And the test was completed according to (20)using Rabbit Antihuman IgG conjugated with peroxidase, Bio–kit) diluted in specific dilution solution was added to
each well except well D. Cut– off value was calculated following method of (AL-Murrani et al 2000) (23).
Data were analyzed using chi square and cross tabulation, following methods of (Daniel 1999)
Statistical Analysis
(24) and computer type Pentium4.
One of the two tested rabbits with the extracted EDN test material showed the signs and symptoms of Gordon phenomenon during the second day after injection and continued to show complete paralysis within the fifth day (Figure 2).
Results
Symptoms of Gordon phenomenon were: stiffness mostly in
Eosinophil Derived Neurotoxin and asthma.…Shehab.A.Lafei etal
Iraqi Journal of Medical Sciences 71
the fore limbs and dropped to the floor. Complete ataxia later and the animal showed good appetite. Animals were injected with sterile normal saline did
not show any sign or symptom or even any abnormality due to post–operative complications (Figure 3).
Figure 2: Positive Gordon test
Figure 3: Negative Gordon test in control rabbit
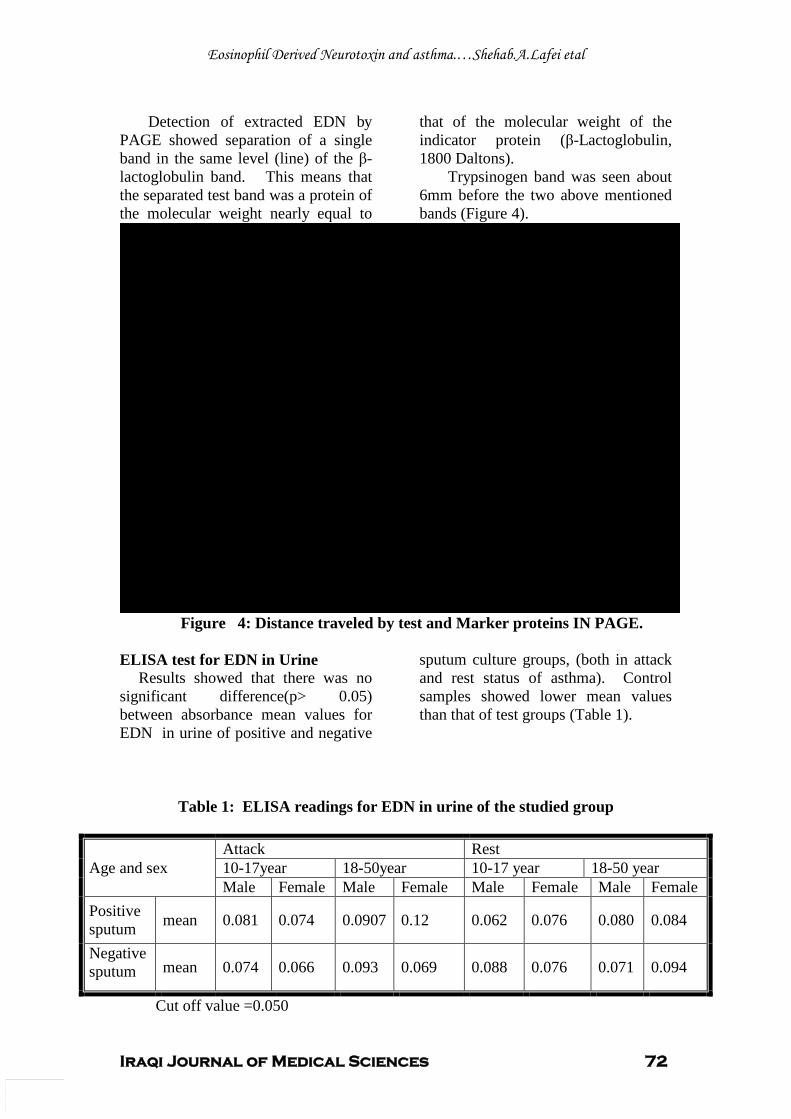
Eosinophil Derived Neurotoxin and asthma.…Shehab.A.Lafei etal
Iraqi Journal of Medical Sciences 72
Detection of extracted EDN by PAGE showed separation of a single band in the same level (line) of the β-lactoglobulin band. This means that the separated test band was a protein of the molecular weight nearly equal to
that of the molecular weight of the indicator protein (β-Lactoglobulin, 1800 Daltons).
Trypsinogen band was seen about 6mm before the two above mentioned bands (Figure 4).
0
5
10
15
20
25
M1:Trypsinogen MW 24000 Daltons
M2: B. Lactoglobulin MW 18000 Daltons
T: Test Material (Eosinophil Derived Neurotoxin, EDN)
Mig
ratio
n di
stan
ce
Figure 4: Distance traveled by test and Marker proteins IN PAGE. ELISA test for EDN in Urine
Results showed that there was no significant difference(p> 0.05) between absorbance mean values for EDN in urine of positive and negative
sputum culture groups, (both in attack and rest status of asthma). Control samples showed lower mean values than that of test groups (Table 1).
Table 1: ELISA readings for EDN in urine of the studied group
Age and sex Attack Rest 10-17year 18-50year 10-17 year 18-50 year Male Female Male Female Male Female Male Female
Positive sputum mean 0.081 0.074 0.0907 0.12 0.062 0.076 0.080 0.084
Negative sputum mean 0.074 0.066 0.093 0.069 0.088 0.076 0.071 0.094
Cut off value =0.050
Eosinophil Derived Neurotoxin and asthma.…Shehab.A.Lafei etal
Iraqi Journal of Medical Sciences 73
Polyacrylamide gel electrophoresis of eosinophil derived neuroprotein (EDN) extracted from eosinophilic patient showed one band with molecular weight approximately to 18000 Daltons, this result was nearly similar to that gained by (13,15).
Discussion
Extracted EDN showed Gordon phenomenon in one of the two tested rabbits and this was lower than that of (12), this difference might be due to: Purity of extracted EDN, difference in the breed of the rabbits (in this study local breed rabbits was used) which might be less sensitive to EDN than the New Zeland rabbits were used by (13). Results obtained showed no significant difference between absorbance mean values of EDN in urine of patients with positive culture and that of patients with negative sputum culture, this might be due to the efficacy of allergens and infective agents in both groups to induce EDN release via eosinophil activation (19). A number of studies have indicated that the assessment of eosinophil-derived proteins in various body fluids could be used for monitoring disease activity of asthma. Due to the relationship between levels of eosinophil proteins in serum/urine samples and lung function, as well as significant concentration differences between symptomatic and asymptomatic asthmatics, the assessment of eosinophil proteins in serum or urine samples appear to be more appropriate in monitoring disease activity (17, 18)
Different studies mentioned that EDN may be considered as an inflammatory mediator for many reactions in addition to asthma such as endocarditis, entritis and dermatitis
.
(25,
26, 27)
.
1. Branes K et al. Gene Gene interaction in asthma seen for first time. Unisci, Daily University News (Internet) ( 2000 ) .
References
2. Crompton KG, Haslett C, Chilvers RE .Diseases of the respiratory system. In Davidosn's principles and practice of medicine, 18th
3. Jang A S, Choi I S, Park C S. Immunohistochemically stained activated eosinophils in sputum in patients with asthma. Respiration, 2000; Vol. 67(2): 183-188.
ed., 1999; p.326-334. Churchill Livingston pub. Philadelphia U.S.A.
4. Sedgwick Julie B, Vrtis Rose F, Jansen Kristyn J, Kita Hirohito, Bartemes Kathleen, Busse William W. Peripheral blood eosinophils from patients with allergic asthma contain increased intracellular eosinophil-derived neurotoxin. Journal of allergy and clinical immunology. 2004; vol. 114(3): 568-574. 5. Egesten A, Alumets J, Von Mecklenbug C, et al .Localization of ECP, MBP and EPO by immunelectron microscopic technique J. Histochem. Cytochem. 1986; Vol. 34: 1399-1403. 6. Akerman V, Marini M, Vittori E. Detection of cytokines and their cell sources in bronchial biopsy. Specimens from asthmatic patients chest. 1994; Vol. 105 No.3: 687-696. 7. Lehrer R ,Szlarek D, Barton A, Ganz T , Hamann K J , and Gleich GJ. Antibacterial properties of Eosinophil Major Basic protein and ECP. J. Imm. 1989; Vol . 142:4428-4434. 8. Gleich GJL, Adlophson CR .The eosinophil leukocyte: Structure and function Adv. Immunol, 1986; vol. 39: 477-253. 9. Wardlaw A J, Dunnette S, Gleich G J, et al. Eosinophils and mast cell in bronchoalveolar lavage in subjects with mild asthma. Am. Rev. Resp. Dis. 1988l; Vol. 137: 62-69. 10. Jacoby D B, Gleich G J, and Frayer A D. Human eosinophil major basic protein is an endogenous allosteric antagonist at the inhibitory muscarinic M2 receptor. J. Clin. Invest. 1993; Vol. 91: 1314-1318. 11. Fernandez, Benitez M. The role infection asthma. Allergol Immunopathol (Madr). May Jun. 2001; vol. 29(3): 147-51. (Internet). 12. Durack D T, Ackerman S J, Loegering D A, and Gleich G J. Purification of human eosinophil derved neurotoxin. Proc. Natt. Acd. Sci. USA. 1981; Vol. 78: 5165-5169. 13. Durack D T, Sum S M, and Klebanoff S J. Neurotoxicity of human eosinophils. Proc. Nutl. Acad. Sci. WA. 1979; 76: 1443-1447. 14. Zheutlin L M, Akerman S J, Gleich G J, and Thomas L L. Stimulation of basophil and rat Mast Cell histamine release by eosinophil
Eosinophil Derived Neurotoxin and asthma.…Shehab.A.Lafei etal
Iraqi Journal of Medical Sciences 74
granule derived Cationic Proteins. J. Immunol. 1984; Vol 133:2180-2185. 15. Slifman R N, Venge P, Peterson C B, Mckear D J, and Gleich G J .Human Eosinophil Derived Neurotoxin and Eosinophil protein X are likely the same protein. J. Imm. 1989; Vol. 143: 2317-2322. 16. Rosenberg H F and Dyer KD. Diversity among the primate EDN genes: A specific carboxyl-terminal sequence is necessary for enhanced ribonuclease activity. Nucleic Acid Res. 1997; Vol. 25: 3532-3536. 17. Severien C, Artlich A, Janas S, Becher G. Urinary excretion of leucotrien E4 and Epx in children with atopic asthma. Eurp. Resp. J. 2000; Vol. 16: 588-592. 18. Oymer K, Havnen J, and Halvorson T, Bjerknes R. Eosinophil Counts and Urinary EPX in children hospitalized for Wheezing during the First year of life: Prediction of recurrent Wheezing. Acta. Pediatr. 2001; Vol 90 (8): 843. 19. Oymer K, and Bijerknes K. Urinary EPX in children with asthma influence of atopy and airway infections pediatric All. Imm. 2001; Vol. 12:34-41. 20. Fernandez Botran R and Vetvicka V.Advanced methods in immunology.CRC press NewYork.USA, (2000). 21. Lowry O H, Rosenbrough NJ, Farr A L and randall R J.Protein measurement with folin phenol Ausubel F., Brent R., Kingstone R., Moore D., Struhkle K (1987): Electrophoretic seperation of proteins in current protocols on molecular Biology. (1951); Vol.2:10-2-3. Green publication. 22. Ausubel F, Brent R, Kingstone R, Moore D, Struhkle K .Electrophoretic seperation of proteins in current protocols on molecular Biology. 1987; Vol.2:10-2-3. Green publication. 23. Al-Murrani W K, Al-Shammari A, Al-Obaidi A, Mustafa A M. New approach for the calculation of the cut off point in immunological and diagnostic tests. Iraqi J. of Microbiology. 2000; Vol. 12(1): 1-8. 24. Daniel W W.Biostatics.: A Foundation for analysis in health sciences. 1999; P. 354. 5 th. ed. Published by John ,Wiley & Sons ,Inc .New York USA. 25. Rice G E, Reimert C M, Bendtzen K L. Eosinophil cationic protein and Epx: Human amniotic fluid content ratios and gestational tissue content at term. Placenta. 1998; Vol. 19: 181-195. 26. Majamaa H,Laine S, Miettinen A.Eosinophil protein and ECP as mediators of intestinal inflammation in infants with atopic eczema and food allergy. Clin .Exp.Aller. 1999; Vol .29(1):1502.
27. Johansson O ,Liangy W, Marcusson J A, Reimert CM .ECP and EDN –Immunoreactive eosinophils in prurigo nodularis Arch .of Deratological , Res.2000; .Vol .292 (8): 371-378 (Midline) .
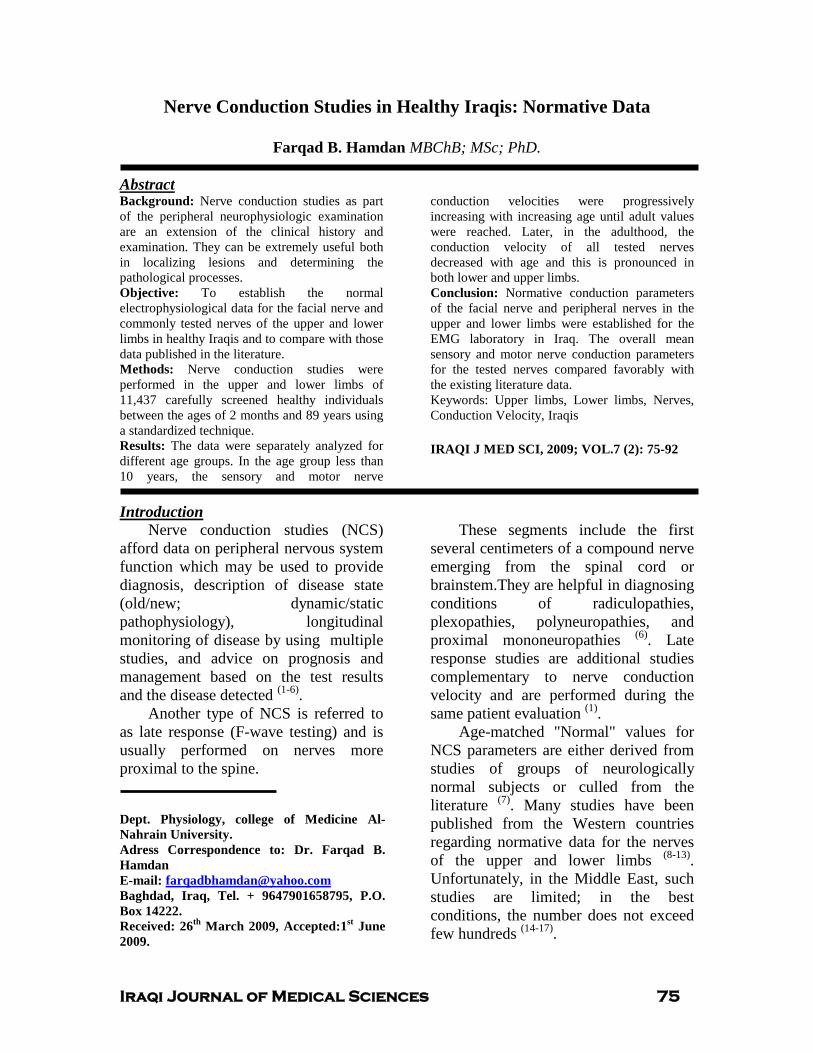
Iraqi Journal of Medical Sciences 75
Nerve Conduction Studies in Healthy Iraqis: Normative Data
Farqad B. Hamdan MBChB; MSc; PhD.
UAbstract Background: Nerve conduction studies as part of the peripheral neurophysiologic examination are an extension of the clinical history and examination. They can be extremely useful both in localizing lesions and determining the pathological processes. Objective: To establish the normal electrophysiological data for the facial nerve and commonly tested nerves of the upper and lower limbs in healthy Iraqis and to compare with those data published in the literature. Methods: Nerve conduction studies were performed in the upper and lower limbs of 11,437 carefully screened healthy individuals between the ages of 2 months and 89 years using a standardized technique. Results: The data were separately analyzed for different age groups. In the age group less than 10 years, the sensory and motor nerve
conduction velocities were progressively increasing with increasing age until adult values were reached. Later, in the adulthood, the conduction velocity of all tested nerves decreased with age and this is pronounced in both lower and upper limbs. Conclusion: Normative conduction parameters of the facial nerve and peripheral nerves in the upper and lower limbs were established for the EMG laboratory in Iraq. The overall mean sensory and motor nerve conduction parameters for the tested nerves compared favorably with the existing literature data. Keywords: Upper limbs, Lower limbs, Nerves, Conduction Velocity, Iraqis IRAQI J MED SCI, 2009; VOL.7 (2): 75-92
UIntroduction
Nerve conduction studies (NCS) afford data on peripheral nervous system function which may be used to provide diagnosis, description of disease state (old/new; dynamic/static pathophysiology), longitudinal monitoring of disease by using multiple studies, and advice on prognosis and management based on the test results and the disease detected P
(1-6)P.
Another type of NCS is referred to as late response (F-wave testing) and is usually performed on nerves more proximal to the spine.
Dept. Physiology, college of Medicine Al-Nahrain University. Adress Correspondence to: Dr. Farqad B. Hamdan E-mail: [email protected] Baghdad, Iraq, Tel. + 9647901658795, P.O. Box 14222. Received: 26 P
thP March 2009, Accepted:1 P
stP June
2009.
These segments include the first several centimeters of a compound nerve emerging from the spinal cord or brainstem.They are helpful in diagnosing conditions of radiculopathies, plexopathies, polyneuropathies, and proximal mononeuropathies P
(6)P. Late
response studies are additional studies complementary to nerve conduction velocity and are performed during the same patient evaluation P
(1)P.
Age-matched "Normal" values for NCS parameters are either derived from studies of groups of neurologically normal subjects or culled from the literature P
(7)P. Many studies have been
published from the Western countries regarding normative data for the nerves of the upper and lower limbs P
(8-13)P.
Unfortunately, in the Middle East, such studies are limited; in the best conditions, the number does not exceed few hundreds P
(14-17)P.
Nerve Conduction Studies in Healthy Iraqis…. Farqad B. Hamdan
Iraqi Journal of Medical Sciences 76
For the last few decades, electrophysiology laboratories have been applying standard values used by the US, Canada and Europe to diagnose different neurological problems.
This study is therefore intended to obtain a set of data from a large scale of healthy Iraqis in order to establish reference values for the local EMG laboratory and to compare Iraqi values with worldwide published data.
There are a number of physical parameters that require correction or allowance for when establishing normative electrophysiological data. The most important is temperature i.e., the motor nerve conduction velocity (MNCV) is reduced by approximately 1 m/s per °C temperature fall. Some measures of conduction require correction for limb length or height. Finally nerve conduction data alter with age. The motor conduction slows by 0.4–1.7 m/s per decade after 20 years and the sensory by 2–4 m/s (7)
This paper provides normative electrophysiological data for the facial, median, ulnar, radial, musculocuatneous, axillary, femoral, common peroneal, and tibial nerves in healthy individuals at different age groups using standard distances and temperature control.
.
Eleven thousands and four hundred thirty seven healthy individuals, aged 2 months to 89 years (36.39±15.36), were included in this cross-sectional study. They comprised 6,325 women with an average age of (38.05±13.79 years) and 5,112 men with an average age of (34.11±17.04 years).
Subjects and Methods
Two thousands and four hundred forty four subjects were specifically recruited as normal. The rest were felt normal, so an informed consent was taken from them or their parents or
relatives to do multiple nerve conductions on the normal limb(s).
The data were collected from individuals attending the EMG unit at Al-Kadhimiya Teaching Hospital, Baghdad-Iraq for neurophysiologic assessment during a 14-year period (1992-2006). All individuals were screened for inclusion criteria that comprised normal neurological physical examination, normal laboratory findings regarding serum sugar, electrolytes and renal function. A standardized questionnaire was used to exclude those with a history of systemic or neuromuscular diseases.
The following individuals were excluded: those with a history of alcohol abuse or medications that might affect the results, and those with a history of diabetes, hypothyroidism and systemic diseases. None of the individuals were taking any medication at the time of conducting the EMG study.
A basic neurological examination was performed to assess muscle power, stretch reflexes and sensations both superficial and deep. Room temperature was maintained at 25 °C. The EMG study was performed with the subject lying comfortably in the supine position. A standardized technique was used to obtain and record action potentials for motor and sensory functions (18)
A 4-channel electromyography machine (Dantec, Denmark) was set as follows: for motor nerve conduction, the low cut filter was 2–5 Hz and the high cut was 10 KHz. For sensory nerve conduction, low cut: 5–10 Hz, high cut: 2–3 KHz; the amplification between 20,000 and 100,000 times; electrode impedance was kept below 5 kΩ; sweep speed for sensory nerve conduction: 1–2 ms/ division while for motor nerve conduction: 2–5 ms/ division; and a
.
Nerve Conduction Studies in Healthy Iraqis…. Farqad B. Hamdan
Iraqi Journal of Medical Sciences 77
stimulus duration of 50 μs to 1000 μs and current 0–100 mA are required for effective nerve stimulation. Supramaximal stimulation (10%–30% more than the current required for maximal action potential) was used.
Data were collected for the following parameters: distal latency measured from the onset of action potential, conduction velocity, and amplitude of compound muscle action potential (CMAPA) and sensory nerve action potential (SNAPA) were measured from positive peak to the negative peak.
The following nerves were evaluated: for motor nerve conduction velocity– facial, median, ulnar, radial, axillary, musculocutaneous, tibial, common peroneal, and femoral nerves; for sensory nerve conduction velocity (SNCV) – median, ulnar, radial, musculocutaneous, tibial, and superficial peroneal nerves were evaluated.
The motor nerves were examined orthodromically and stimulated with bipolar surface stimulating electrode (Dantec 13L36) at two points along its course. The action potential was recorded with a concentric needle electrode (Dantec 13L50) placed close to the motor point of the muscle. A ground electrode (Dantec 13S93) was placed between the stimulating and recording electrodes. The MNCV was calculated using the distance between points of two stimulations by latency of that segment.
Stimulation of facial nerve was achieved at a point just below the ear and anterior to the mastoid process. Its motor response was recorded from orbicularis oris muscle. Distal median and ulnar stimulations were performed 8 cm proximal to the needle electrode. The site was medial to flexor carpi radialis tendon for the median nerve while
posterior to flexor carpi ulnaris tendon for the ulnar nerve. Proximal median nerve stimulation was performed medial to biceps brachii tendon at the elbow crease. For ulnar nerve, proximal stimulation was just distal to the medial epicondyle of the humerus with the elbow in 70° flexion. Recordings of the muscle response for the median and ulnar nerves were done from abductor pollicis brevis and abductor digiti minimi muscles, respectively.
The radial nerve was stimulated distally at the lateral edge of extensor carpi ulnaris muscle, 8 to 10 cm proximal to the styloid process of the ulna and the recording from extensor indicis muscle. Proximally, radial nerve was stimulated between brachioradialis and the tendon of biceps brachii 6 cm proximal to the lateral epicondyle of the humerus. The musculocutaneous and axillary nerves were stimulated at the posterior cervical triangle 3 to 6 cm above the clavicle just behind sternocleidomastoid muscle. Muscle action potentials were recorded from biceps brachii and deltoid muscles, respectively.
For deep peroneal motor nerve conduction evaluation, the recordings were obtained from extensor digitorum brevis. The stimulation was given at the ankle distally and 2 cm distal to the fibular neck (below knee) proximally. Motor conduction study of the tibial nerve recorded the muscle response from abductor hallucis muscle after stimulation at the popliteal fossa and at the ankle posterior to the medial malleolus. The femoral nerve was stimulated below the inguinal ligament and lateral to the femoral artery. Motor conduction was recorded from rectus femoris muscle 14 and 30 cm distal to the point of stimulation.
Nerve Conduction Studies in Healthy Iraqis…. Farqad B. Hamdan
Iraqi Journal of Medical Sciences 78
Sensory nerve conduction was measured antidromically. The SNCV was measured by stimulating at a single site. The sensory conduction velocity was calculated by dividing the distance between the stimulating and the recording sites by latency.
The active ring electrode (Dantec 13L69) was placed over the 1st, 2nd and 5th digit to record responses along the radial, median and ulnar nerves, respectively. The reference electrode was placed about 4 cm distal to the active electrode. Median nerve stimulation was performed at 13 cm proximal to the active electrode and medial to flexor carpi radialis tendon. For the ulnar nerve, stimulation was performed 10 cm proximal to the active electrode and posterior to the flexor carpi ulnaris tendon. Radial nerve stimulation was performed 10 cm proximal to the active electrode along the lateral border of the radius.
The musculocutaneous was stimulated between the tendon of biceps brachii medially and brachioradialis laterally. The Self adhesive disposable surface recording electrode (Dantec C13L20) was placed 12 cm distal to the point of stimulation over the course of the nerve in the forearm and along the straight line from the stimulus point to the radial artery at the wrist.
Sensory conduction studies of the tibial nerve (medial planter nerve) from the first toe with ring electrodes and antidromic stimulation at the ankle (at the same site that elicits the motor response). The superficial peroneal nerve was stimulated against the anterior edge of the fibulae 12 cm proximal to the active surface electrode located just medial to the lateral malleolus at the ankle.
Because of difference in length of the upper and lower limbs among individuals and thus differences in length of the reflex arc, the disparity was taken into account. In order to quantify individual differences, the distance between the anterior superior iliac spine and the lateral malleolus for the lower limbs and the distance between the seventh cervical spinous process and the wrist for the upper limbs were considered.
Data were processed using the Statistical Package for Social Sciences (SPSS). Descriptive statistics for continuous variables included the mean and the standard deviation. Correlation coefficient (r) was used (P value < 0.05) to assess the relation between the age of the subjects and the conduction velocity of the nerves studied.
Data were separately analyzed for each age group. In the age group less than 10 years, the SNCV and MNCV of median, ulnar, radial, tibial, and common peroneal nerves progressively increased (positively correlated) with increasing age until they reached adult values. Late in the adulthood (age groups 60 years and above), the conduction velocity of all the nerves tested decreased with age (negatively correlated).
Results
The mean and standard deviation for the tested nerves are summarized in tables 1 through 9. Tables 10 through 19 show a comparison between the results of the present study and those reported by others worldwide.
This study examined nerve conduction parameters of multiple nerves in the upper and lower limbs of a
Discussion
Nerve Conduction Studies in Healthy Iraqis…. Farqad B. Hamdan
Iraqi Journal of Medical Sciences 79
healthy sample in Iraq under standardized conditions. The aim is to provide normative and reference values for Iraqi EMG labs. A comparison was made between the results obtained in this study and other published data with a special emphasis on studies that used standardized techniques and recorded the age of the subjects (8, 9, 13, 14, 16, 17, 19-39)
Age has been widely accepted to have an influence on nerve conduction velocity. Consequently, many laboratories have produced normative nerve conduction velocity values which are divided according to age groups. Many investigators have attempted to study the association between aging and nerve velocities, both motor and sensory
.
(40-44). In this study, the statistically significant increment or decrement of NCV with age collaborates with the findings of other researchers (45-
49)
The motor parameters of the facial nerve as recorded in this study generally coincide with the results of other researchers
.
(19-21). The motor latency of axillary nerve was in close proximity to that reported by Kraft (22). The SNCV values of musculocutaneous were close to the values reported by other workers (23-25), while the SL and SNAPA values were less than the reported values by Kraft (22) and Spindler and Felsenthal (25)
For the femoral nerve motor latency, our data were in close proximity to those reported by
(table 10).
Uludag et al. (15) and Gassel (26); whereas the DML and MNCV are far less than that reported by the latter worker and Johnson et al. (27)
For the median sensory parameters (table 11), the SNCV is less than that reported by Hennessey et al.
(table 10).
(8) and Karagoz et al. (28) but similar to the results of Shehab (14), Awang et al. (16)
and Kimura (18). Moreover, the recorded SNAPA is less than that reported by Shehab (14) and higher than that of Hennessey et al. (8), Kimura (18), and Karagoz et al. (28)
On the other hand, the results of the motor parameters were more favorable with the almost similar MNCV results of others
.
(8, 14, 16, 18, 28). The median nerve CMAPA in this study was similar to that of Hennessey et al. (8) and Shehab (14), but higher than that of Kimura (18) and Karagoz et al. (28)
The data of ulnar SNCV were in agreement with the findings of Shehab
.
(14) and Kimura (18) but less than those reported by others (16, 27). Ulnar SNAPA was similar to the results of Shehab (14) but rather higher than that of other researchers (18, 28). The motor data of ulnar nerve showed a good similarity with those reported by Shehab (14), Kimura (18), Karagoz et al. (28), and Buschbacher (29). Apart from this, the MNCV was higher as compared to that of Awang et al. (16) and the CMAPA was also higher in comparison to that of Shehab (14) and Kimura (18)
Concerning the results of radial nerve (table 11), the SNCV, MNCV, and CMAPA values were in close proximity to the findings of Shehab
(table 11).
(14), Jebsen (30), and Trojaborg and Sinrup (31). On the other hand, the SNAPA was higher than that reported by Falco et al. (9), Johnson et al. (13), Shehab (14), and Trojaborg and Sinrup (31)
In table 12, it can be observed that the sensory and motor CV of the tibial nerve was favorable with the results of Kimura
.
(18), Buschbacher (32), Budak (33), and Antunes et al. (34). However, the SNAPA and CMAPA were higher than that reported by Antunes et al. (34) and Kimura (18), respectively. On the contrary, the CMAPA was less than that
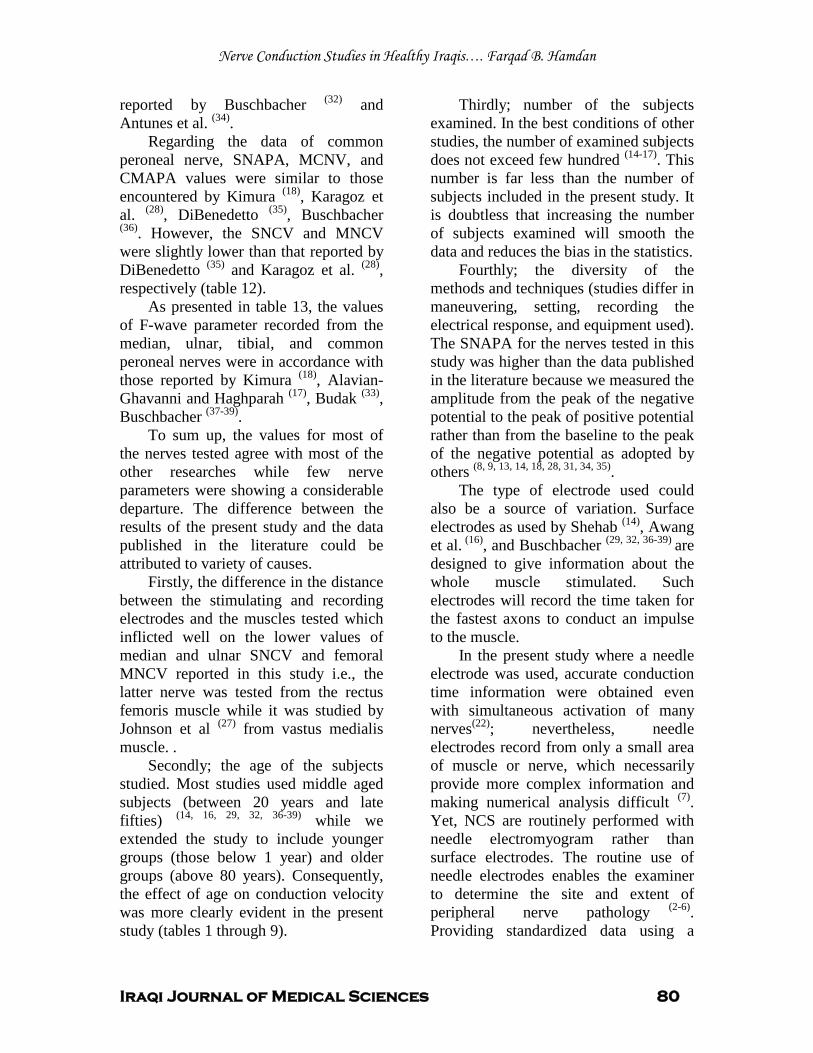
Nerve Conduction Studies in Healthy Iraqis…. Farqad B. Hamdan
Iraqi Journal of Medical Sciences 80
reported by Buschbacher (32) and Antunes et al. (34)
Regarding the data of common peroneal nerve, SNAPA, MCNV, and CMAPA values were similar to those encountered by Kimura
.
(18), Karagoz et al. (28), DiBenedetto (35), Buschbacher (36). However, the SNCV and MNCV were slightly lower than that reported by DiBenedetto (35) and Karagoz et al. (28)
As presented in table 13, the values of F-wave parameter recorded from the median, ulnar, tibial, and common peroneal nerves were in accordance with those reported by Kimura
, respectively (table 12).
(18), Alavian-Ghavanni and Haghparah (17), Budak (33), Buschbacher (37-39)
To sum up, the values for most of the nerves tested agree with most of the other researches while few nerve parameters were showing a considerable departure. The difference between the results of the present study and the data published in the literature could be attributed to variety of causes.
.
Firstly, the difference in the distance between the stimulating and recording electrodes and the muscles tested which inflicted well on the lower values of median and ulnar SNCV and femoral MNCV reported in this study i.e., the latter nerve was tested from the rectus femoris muscle while it was studied by Johnson et al (27)
Secondly; the age of the subjects studied. Most studies used middle aged subjects (between 20 years and late fifties)
from vastus medialis muscle. .
(14, 16, 29, 32, 36-39)
Thirdly; number of the subjects examined. In the best conditions of other studies, the number of examined subjects does not exceed few hundred
while we extended the study to include younger groups (those below 1 year) and older groups (above 80 years). Consequently, the effect of age on conduction velocity was more clearly evident in the present study (tables 1 through 9).
(14-17)
Fourthly; the diversity of the methods and techniques (studies differ in maneuvering, setting, recording the electrical response, and equipment used). The SNAPA for the nerves tested in this study was higher than the data published in the literature because we measured the amplitude from the peak of the negative potential to the peak of positive potential rather than from the baseline to the peak of the negative potential as adopted by others
. This number is far less than the number of subjects included in the present study. It is doubtless that increasing the number of subjects examined will smooth the data and reduces the bias in the statistics.
(8, 9, 13, 14, 18, 28, 31, 34, 35)
The type of electrode used could also be a source of variation. Surface electrodes as used by Shehab
.
(14), Awang et al. (16), and Buschbacher (29, 32, 36-39)
In the present study where a needle electrode was used, accurate conduction time information were obtained even with simultaneous activation of many nerves
are designed to give information about the whole muscle stimulated. Such electrodes will record the time taken for the fastest axons to conduct an impulse to the muscle.
(22); nevertheless, needle electrodes record from only a small area of muscle or nerve, which necessarily provide more complex information and making numerical analysis difficult (7). Yet, NCS are routinely performed with needle electromyogram rather than surface electrodes. The routine use of needle electrodes enables the examiner to determine the site and extent of peripheral nerve pathology (2-6). Providing standardized data using a
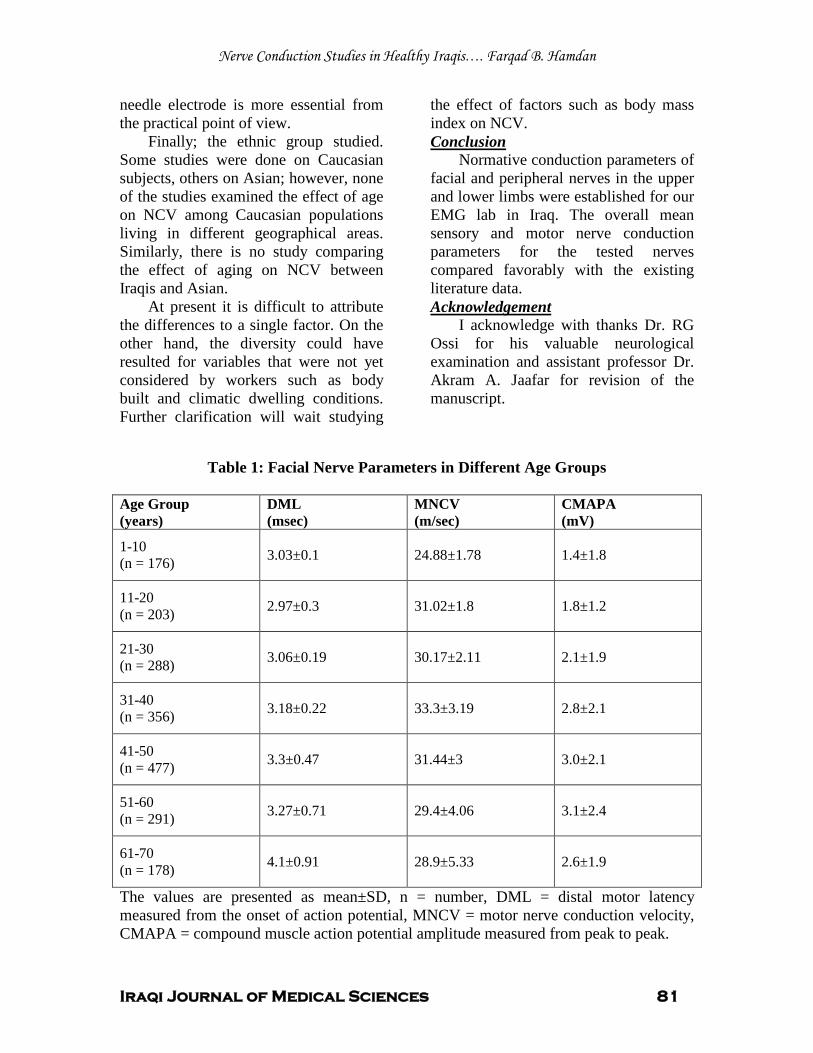
Nerve Conduction Studies in Healthy Iraqis…. Farqad B. Hamdan
Iraqi Journal of Medical Sciences 81
needle electrode is more essential from the practical point of view.
Finally; the ethnic group studied. Some studies were done on Caucasian subjects, others on Asian; however, none of the studies examined the effect of age on NCV among Caucasian populations living in different geographical areas. Similarly, there is no study comparing the effect of aging on NCV between Iraqis and Asian.
At present it is difficult to attribute the differences to a single factor. On the other hand, the diversity could have resulted for variables that were not yet considered by workers such as body built and climatic dwelling conditions. Further clarification will wait studying
the effect of factors such as body mass index on NCV.
Normative conduction parameters of facial and peripheral nerves in the upper and lower limbs were established for our EMG lab in Iraq. The overall mean sensory and motor nerve conduction parameters for the tested nerves compared favorably with the existing literature data.
Conclusion
I acknowledge with thanks Dr. RG Ossi for his valuable neurological examination and assistant professor Dr. Akram A. Jaafar for revision of the manuscript.
Acknowledgement
Table 1: Facial Nerve Parameters in Different Age Groups
Age Group (years)
DML (msec)
MNCV (m/sec)
CMAPA (mV)
1-10 (n = 176) 3.03±0.1
24.88±1.78
1.4±1.8
11-20 (n = 203)
2.97±0.3
31.02±1.8
1.8±1.2
21-30 (n = 288)
3.06±0.19
30.17±2.11
2.1±1.9
31-40 (n = 356)
3.18±0.22
33.3±3.19
2.8±2.1
41-50 (n = 477)
3.3±0.47
31.44±3
3.0±2.1
51-60 (n = 291)
3.27±0.71
29.4±4.06
3.1±2.4
61-70 (n = 178)
4.1±0.91
28.9±5.33
2.6±1.9
The values are presented as mean±SD, n = number, DML = distal motor latency measured from the onset of action potential, MNCV = motor nerve conduction velocity, CMAPA = compound muscle action potential amplitude measured from peak to peak.
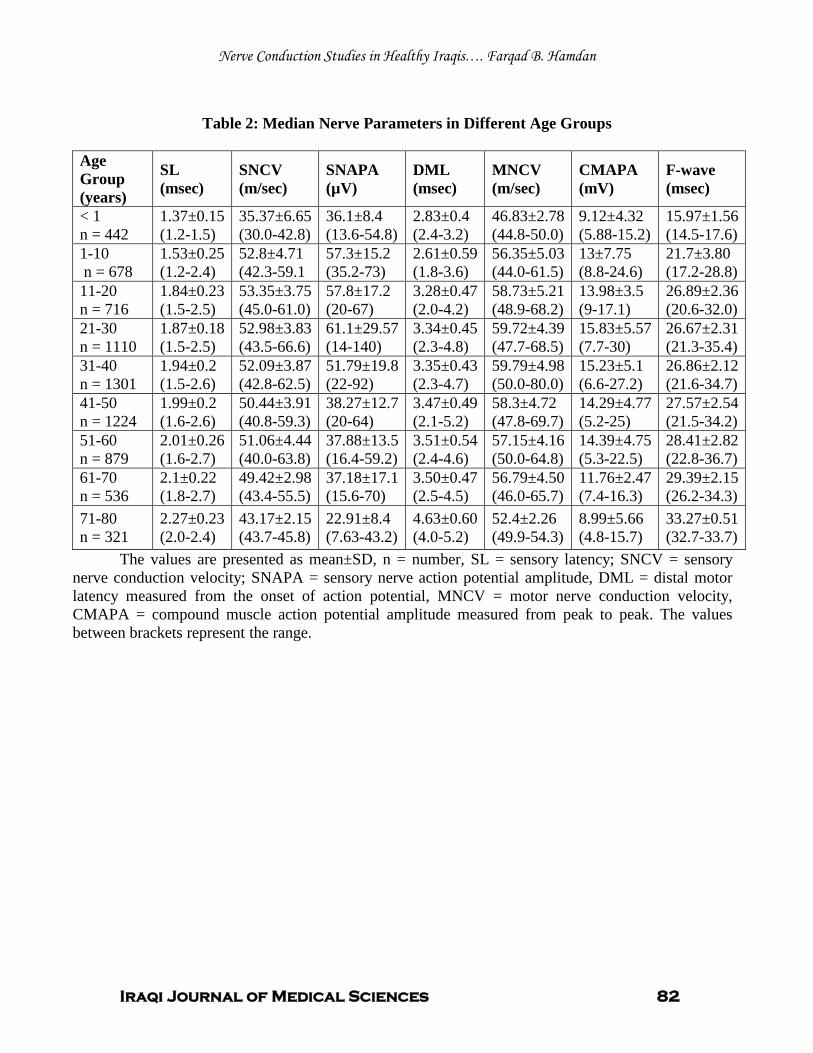
Nerve Conduction Studies in Healthy Iraqis…. Farqad B. Hamdan
Iraqi Journal of Medical Sciences 82
Table 2: Median Nerve Parameters in Different Age Groups
Age Group (years)
SL (msec)
SNCV (m/sec)
SNAPA (µV)
DML (msec)
MNCV (m/sec)
CMAPA (mV)
F-wave (msec)
< 1 n = 442
1.37±0.15 (1.2-1.5)
35.37±6.65 (30.0-42.8)
36.1±8.4 (13.6-54.8)
2.83±0.4 (2.4-3.2)
46.83±2.78 (44.8-50.0)
9.12±4.32 (5.88-15.2)
15.97±1.56 (14.5-17.6)
1-10 n = 678
1.53±0.25 (1.2-2.4)
52.8±4.71 (42.3-59.1
57.3±15.2 (35.2-73)
2.61±0.59 (1.8-3.6)
56.35±5.03 (44.0-61.5)
13±7.75 (8.8-24.6)
21.7±3.80 (17.2-28.8)
11-20 n = 716
1.84±0.23 (1.5-2.5)
53.35±3.75 (45.0-61.0)
57.8±17.2 (20-67)
3.28±0.47 (2.0-4.2)
58.73±5.21 (48.9-68.2)
13.98±3.5 (9-17.1)
26.89±2.36 (20.6-32.0)
21-30 n = 1110
1.87±0.18 (1.5-2.5)
52.98±3.83 (43.5-66.6)
61.1±29.57 (14-140)
3.34±0.45 (2.3-4.8)
59.72±4.39 (47.7-68.5)
15.83±5.57 (7.7-30)
26.67±2.31 (21.3-35.4)
31-40 n = 1301
1.94±0.2 (1.5-2.6)
52.09±3.87 (42.8-62.5)
51.79±19.8 (22-92)
3.35±0.43 (2.3-4.7)
59.79±4.98 (50.0-80.0)
15.23±5.1 (6.6-27.2)
26.86±2.12 (21.6-34.7)
41-50 n = 1224
1.99±0.2 (1.6-2.6)
50.44±3.91 (40.8-59.3)
38.27±12.7 (20-64)
3.47±0.49 (2.1-5.2)
58.3±4.72 (47.8-69.7)
14.29±4.77 (5.2-25)
27.57±2.54 (21.5-34.2)
51-60 n = 879
2.01±0.26 (1.6-2.7)
51.06±4.44 (40.0-63.8)
37.88±13.5 (16.4-59.2)
3.51±0.54 (2.4-4.6)
57.15±4.16 (50.0-64.8)
14.39±4.75 (5.3-22.5)
28.41±2.82 (22.8-36.7)
61-70 n = 536
2.1±0.22 (1.8-2.7)
49.42±2.98 (43.4-55.5)
37.18±17.1 (15.6-70)
3.50±0.47 (2.5-4.5)
56.79±4.50 (46.0-65.7)
11.76±2.47 (7.4-16.3)
29.39±2.15 (26.2-34.3)
71-80 n = 321
2.27±0.23 (2.0-2.4)
43.17±2.15 (43.7-45.8)
22.91±8.4 (7.63-43.2)
4.63±0.60 (4.0-5.2)
52.4±2.26 (49.9-54.3)
8.99±5.66 (4.8-15.7)
33.27±0.51 (32.7-33.7)
The values are presented as mean±SD, n = number, SL = sensory latency; SNCV = sensory nerve conduction velocity; SNAPA = sensory nerve action potential amplitude, DML = distal motor latency measured from the onset of action potential, MNCV = motor nerve conduction velocity, CMAPA = compound muscle action potential amplitude measured from peak to peak. The values between brackets represent the range.
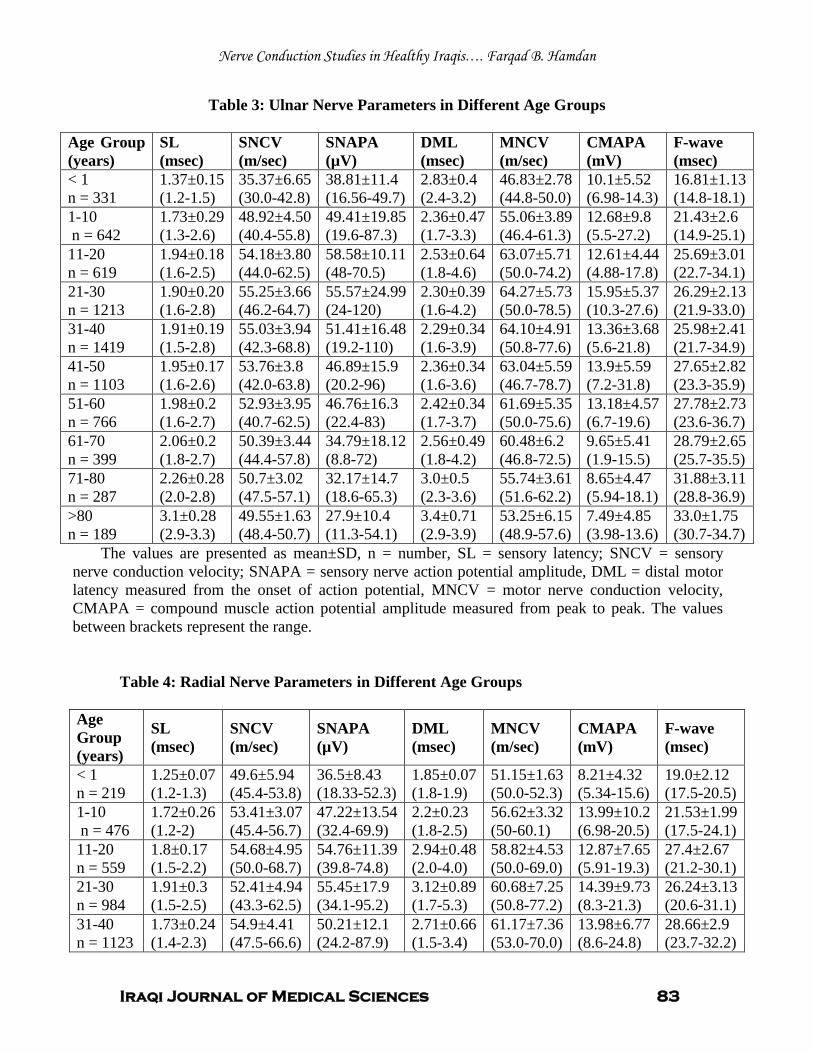
Nerve Conduction Studies in Healthy Iraqis…. Farqad B. Hamdan
Iraqi Journal of Medical Sciences 83
Table 3: Ulnar Nerve Parameters in Different Age Groups
Age Group (years)
SL (msec)
SNCV (m/sec)
SNAPA (µV)
DML (msec)
MNCV (m/sec)
CMAPA (mV)
F-wave (msec)
< 1 n = 331
1.37±0.15 (1.2-1.5)
35.37±6.65 (30.0-42.8)
38.81±11.4 (16.56-49.7)
2.83±0.4 (2.4-3.2)
46.83±2.78 (44.8-50.0)
10.1±5.52 (6.98-14.3)
16.81±1.13 (14.8-18.1)
1-10 n = 642
1.73±0.29 (1.3-2.6)
48.92±4.50 (40.4-55.8)
49.41±19.85 (19.6-87.3)
2.36±0.47 (1.7-3.3)
55.06±3.89 (46.4-61.3)
12.68±9.8 (5.5-27.2)
21.43±2.6 (14.9-25.1)
11-20 n = 619
1.94±0.18 (1.6-2.5)
54.18±3.80 (44.0-62.5)
58.58±10.11 (48-70.5)
2.53±0.64 (1.8-4.6)
63.07±5.71 (50.0-74.2)
12.61±4.44 (4.88-17.8)
25.69±3.01 (22.7-34.1)
21-30 n = 1213
1.90±0.20 (1.6-2.8)
55.25±3.66 (46.2-64.7)
55.57±24.99 (24-120)
2.30±0.39 (1.6-4.2)
64.27±5.73 (50.0-78.5)
15.95±5.37 (10.3-27.6)
26.29±2.13 (21.9-33.0)
31-40 n = 1419
1.91±0.19 (1.5-2.8)
55.03±3.94 (42.3-68.8)
51.41±16.48 (19.2-110)
2.29±0.34 (1.6-3.9)
64.10±4.91 (50.8-77.6)
13.36±3.68 (5.6-21.8)
25.98±2.41 (21.7-34.9)
41-50 n = 1103
1.95±0.17 (1.6-2.6)
53.76±3.8 (42.0-63.8)
46.89±15.9 (20.2-96)
2.36±0.34 (1.6-3.6)
63.04±5.59 (46.7-78.7)
13.9±5.59 (7.2-31.8)
27.65±2.82 (23.3-35.9)
51-60 n = 766
1.98±0.2 (1.6-2.7)
52.93±3.95 (40.7-62.5)
46.76±16.3 (22.4-83)
2.42±0.34 (1.7-3.7)
61.69±5.35 (50.0-75.6)
13.18±4.57 (6.7-19.6)
27.78±2.73 (23.6-36.7)
61-70 n = 399
2.06±0.2 (1.8-2.7)
50.39±3.44 (44.4-57.8)
34.79±18.12 (8.8-72)
2.56±0.49 (1.8-4.2)
60.48±6.2 (46.8-72.5)
9.65±5.41 (1.9-15.5)
28.79±2.65 (25.7-35.5)
71-80 n = 287
2.26±0.28 (2.0-2.8)
50.7±3.02 (47.5-57.1)
32.17±14.7 (18.6-65.3)
3.0±0.5 (2.3-3.6)
55.74±3.61 (51.6-62.2)
8.65±4.47 (5.94-18.1)
31.88±3.11 (28.8-36.9)
>80 n = 189
3.1±0.28 (2.9-3.3)
49.55±1.63 (48.4-50.7)
27.9±10.4 (11.3-54.1)
3.4±0.71 (2.9-3.9)
53.25±6.15 (48.9-57.6)
7.49±4.85 (3.98-13.6)
33.0±1.75 (30.7-34.7)
The values are presented as mean±SD, n = number, SL = sensory latency; SNCV = sensory nerve conduction velocity; SNAPA = sensory nerve action potential amplitude, DML = distal motor latency measured from the onset of action potential, MNCV = motor nerve conduction velocity, CMAPA = compound muscle action potential amplitude measured from peak to peak. The values between brackets represent the range.
Table 4: Radial Nerve Parameters in Different Age Groups
Age Group (years)
SL (msec)
SNCV (m/sec)
SNAPA (µV)
DML (msec)
MNCV (m/sec)
CMAPA (mV)
F-wave (msec)
< 1 n = 219
1.25±0.07 (1.2-1.3)
49.6±5.94 (45.4-53.8)
36.5±8.43 (18.33-52.3)
1.85±0.07 (1.8-1.9)
51.15±1.63 (50.0-52.3)
8.21±4.32 (5.34-15.6)
19.0±2.12 (17.5-20.5)
1-10 n = 476
1.72±0.26 (1.2-2)
53.41±3.07 (45.4-56.7)
47.22±13.54 (32.4-69.9)
2.2±0.23 (1.8-2.5)
56.62±3.32 (50-60.1)
13.99±10.2 (6.98-20.5)
21.53±1.99 (17.5-24.1)
11-20 n = 559
1.8±0.17 (1.5-2.2)
54.68±4.95 (50.0-68.7)
54.76±11.39 (39.8-74.8)
2.94±0.48 (2.0-4.0)
58.82±4.53 (50.0-69.0)
12.87±7.65 (5.91-19.3)
27.4±2.67 (21.2-30.1)
21-30 n = 984
1.91±0.3 (1.5-2.5)
52.41±4.94 (43.3-62.5)
55.45±17.9 (34.1-95.2)
3.12±0.89 (1.7-5.3)
60.68±7.25 (50.8-77.2)
14.39±9.73 (8.3-21.3)
26.24±3.13 (20.6-31.1)
31-40 n = 1123
1.73±0.24 (1.4-2.3)
54.9±4.41 (47.5-66.6)
50.21±12.1 (24.2-87.9)
2.71±0.66 (1.5-3.4)
61.17±7.36 (53.0-70.0)
13.98±6.77 (8.6-24.8)
28.66±2.9 (23.7-32.2)
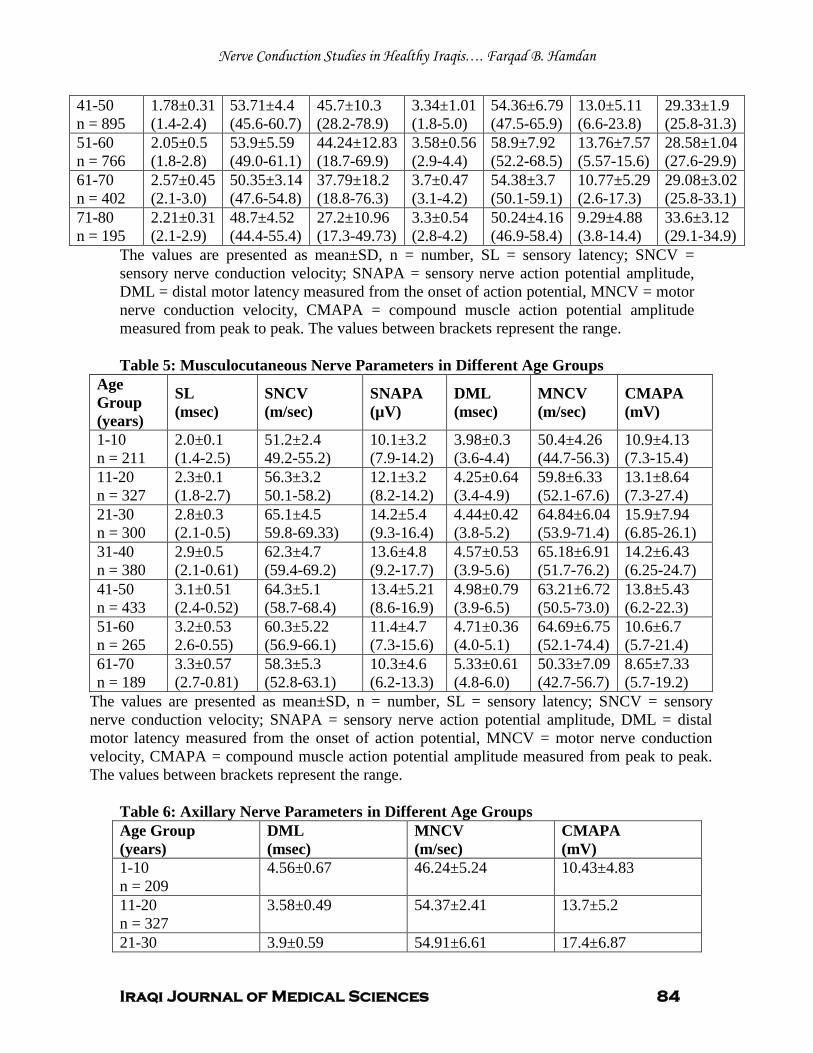
Nerve Conduction Studies in Healthy Iraqis…. Farqad B. Hamdan
Iraqi Journal of Medical Sciences 84
41-50 n = 895
1.78±0.31 (1.4-2.4)
53.71±4.4 (45.6-60.7)
45.7±10.3 (28.2-78.9)
3.34±1.01 (1.8-5.0)
54.36±6.79 (47.5-65.9)
13.0±5.11 (6.6-23.8)
29.33±1.9 (25.8-31.3)
51-60 n = 766
2.05±0.5 (1.8-2.8)
53.9±5.59 (49.0-61.1)
44.24±12.83 (18.7-69.9)
3.58±0.56 (2.9-4.4)
58.9±7.92 (52.2-68.5)
13.76±7.57 (5.57-15.6)
28.58±1.04 (27.6-29.9)
61-70 n = 402
2.57±0.45 (2.1-3.0)
50.35±3.14 (47.6-54.8)
37.79±18.2 (18.8-76.3)
3.7±0.47 (3.1-4.2)
54.38±3.7 (50.1-59.1)
10.77±5.29 (2.6-17.3)
29.08±3.02 (25.8-33.1)
71-80 n = 195
2.21±0.31 (2.1-2.9)
48.7±4.52 (44.4-55.4)
27.2±10.96 (17.3-49.73)
3.3±0.54 (2.8-4.2)
50.24±4.16 (46.9-58.4)
9.29±4.88 (3.8-14.4)
33.6±3.12 (29.1-34.9)
The values are presented as mean±SD, n = number, SL = sensory latency; SNCV = sensory nerve conduction velocity; SNAPA = sensory nerve action potential amplitude, DML = distal motor latency measured from the onset of action potential, MNCV = motor nerve conduction velocity, CMAPA = compound muscle action potential amplitude measured from peak to peak. The values between brackets represent the range. Table 5: Musculocutaneous Nerve Parameters in Different Age Groups
Age Group (years)
SL (msec)
SNCV (m/sec)
SNAPA (µV)
DML (msec)
MNCV (m/sec)
CMAPA (mV)
1-10 n = 211
2.0±0.1 (1.4-2.5)
51.2±2.4 49.2-55.2)
10.1±3.2 (7.9-14.2)
3.98±0.3 (3.6-4.4)
50.4±4.26 (44.7-56.3)
10.9±4.13 (7.3-15.4)
11-20 n = 327
2.3±0.1 (1.8-2.7)
56.3±3.2 50.1-58.2)
12.1±3.2 (8.2-14.2)
4.25±0.64 (3.4-4.9)
59.8±6.33 (52.1-67.6)
13.1±8.64 (7.3-27.4)
21-30 n = 300
2.8±0.3 (2.1-0.5)
65.1±4.5 59.8-69.33)
14.2±5.4 (9.3-16.4)
4.44±0.42 (3.8-5.2)
64.84±6.04 (53.9-71.4)
15.9±7.94 (6.85-26.1)
31-40 n = 380
2.9±0.5 (2.1-0.61)
62.3±4.7 (59.4-69.2)
13.6±4.8 (9.2-17.7)
4.57±0.53 (3.9-5.6)
65.18±6.91 (51.7-76.2)
14.2±6.43 (6.25-24.7)
41-50 n = 433
3.1±0.51 (2.4-0.52)
64.3±5.1 (58.7-68.4)
13.4±5.21 (8.6-16.9)
4.98±0.79 (3.9-6.5)
63.21±6.72 (50.5-73.0)
13.8±5.43 (6.2-22.3)
51-60 n = 265
3.2±0.53 2.6-0.55)
60.3±5.22 (56.9-66.1)
11.4±4.7 (7.3-15.6)
4.71±0.36 (4.0-5.1)
64.69±6.75 (52.1-74.4)
10.6±6.7 (5.7-21.4)
61-70 n = 189
3.3±0.57 (2.7-0.81)
58.3±5.3 (52.8-63.1)
10.3±4.6 (6.2-13.3)
5.33±0.61 (4.8-6.0)
50.33±7.09 (42.7-56.7)
8.65±7.33 (5.7-19.2)
The values are presented as mean±SD, n = number, SL = sensory latency; SNCV = sensory nerve conduction velocity; SNAPA = sensory nerve action potential amplitude, DML = distal motor latency measured from the onset of action potential, MNCV = motor nerve conduction velocity, CMAPA = compound muscle action potential amplitude measured from peak to peak. The values between brackets represent the range.
Table 6: Axillary Nerve Parameters in Different Age Groups Age Group (years)
DML (msec)
MNCV (m/sec)
CMAPA (mV)
1-10 n = 209
4.56±0.67
46.24±5.24
10.43±4.83
11-20 n = 327
3.58±0.49
54.37±2.41
13.7±5.2
21-30 3.9±0.59 54.91±6.61 17.4±6.87
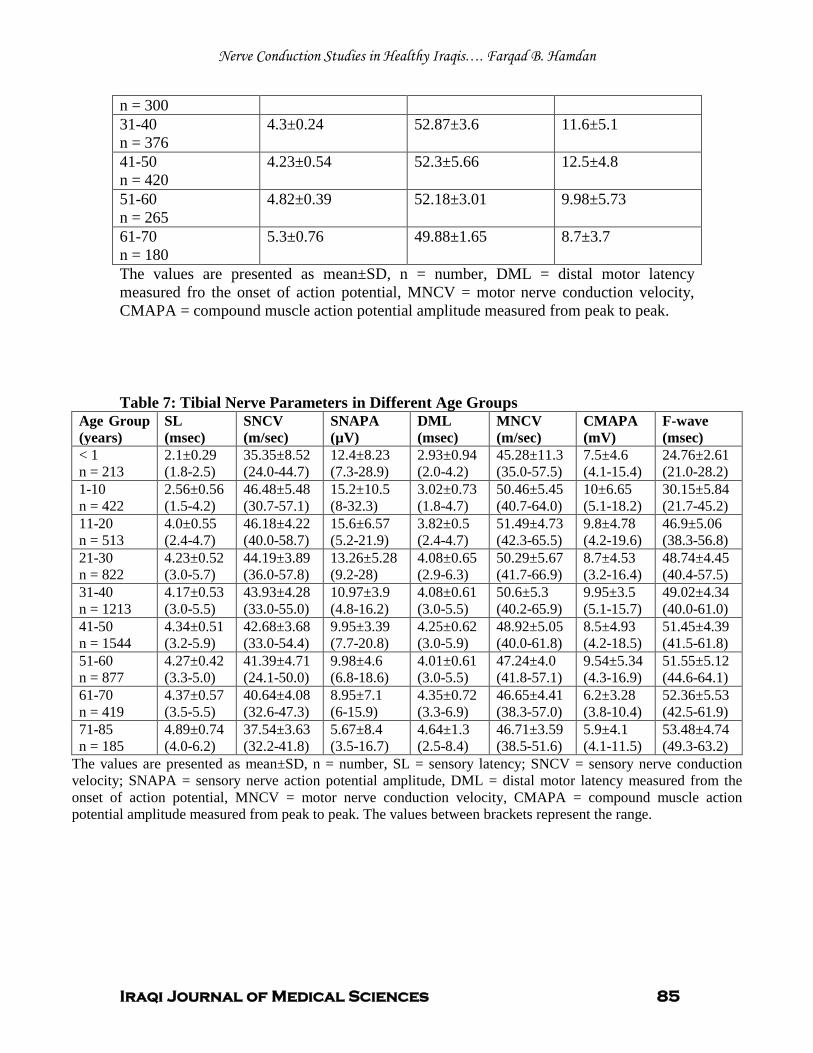
Nerve Conduction Studies in Healthy Iraqis…. Farqad B. Hamdan
Iraqi Journal of Medical Sciences 85
n = 300 31-40 n = 376
4.3±0.24
52.87±3.6
11.6±5.1
41-50 n = 420
4.23±0.54
52.3±5.66
12.5±4.8
51-60 n = 265
4.82±0.39
52.18±3.01
9.98±5.73
61-70 n = 180
5.3±0.76
49.88±1.65
8.7±3.7
The values are presented as mean±SD, n = number, DML = distal motor latency measured fro the onset of action potential, MNCV = motor nerve conduction velocity, CMAPA = compound muscle action potential amplitude measured from peak to peak. Table 7: Tibial Nerve Parameters in Different Age Groups
Age Group (years)
SL (msec)
SNCV (m/sec)
SNAPA (µV)
DML (msec)
MNCV (m/sec)
CMAPA (mV)
F-wave (msec)
< 1 n = 213
2.1±0.29 (1.8-2.5)
35.35±8.52 (24.0-44.7)
12.4±8.23 (7.3-28.9)
2.93±0.94 (2.0-4.2)
45.28±11.3 (35.0-57.5)
7.5±4.6 (4.1-15.4)
24.76±2.61 (21.0-28.2)
1-10 n = 422
2.56±0.56 (1.5-4.2)
46.48±5.48 (30.7-57.1)
15.2±10.5 (8-32.3)
3.02±0.73 (1.8-4.7)
50.46±5.45 (40.7-64.0)
10±6.65 (5.1-18.2)
30.15±5.84 (21.7-45.2)
11-20 n = 513
4.0±0.55 (2.4-4.7)
46.18±4.22 (40.0-58.7)
15.6±6.57 (5.2-21.9)
3.82±0.5 (2.4-4.7)
51.49±4.73 (42.3-65.5)
9.8±4.78 (4.2-19.6)
46.9±5.06 (38.3-56.8)
21-30 n = 822
4.23±0.52 (3.0-5.7)
44.19±3.89 (36.0-57.8)
13.26±5.28 (9.2-28)
4.08±0.65 (2.9-6.3)
50.29±5.67 (41.7-66.9)
8.7±4.53 (3.2-16.4)
48.74±4.45 (40.4-57.5)
31-40 n = 1213
4.17±0.53 (3.0-5.5)
43.93±4.28 (33.0-55.0)
10.97±3.9 (4.8-16.2)
4.08±0.61 (3.0-5.5)
50.6±5.3 (40.2-65.9)
9.95±3.5 (5.1-15.7)
49.02±4.34 (40.0-61.0)
41-50 n = 1544
4.34±0.51 (3.2-5.9)
42.68±3.68 (33.0-54.4)
9.95±3.39 (7.7-20.8)
4.25±0.62 (3.0-5.9)
48.92±5.05 (40.0-61.8)
8.5±4.93 (4.2-18.5)
51.45±4.39 (41.5-61.8)
51-60 n = 877
4.27±0.42 (3.3-5.0)
41.39±4.71 (24.1-50.0)
9.98±4.6 (6.8-18.6)
4.01±0.61 (3.0-5.5)
47.24±4.0 (41.8-57.1)
9.54±5.34 (4.3-16.9)
51.55±5.12 (44.6-64.1)
61-70 n = 419
4.37±0.57 (3.5-5.5)
40.64±4.08 (32.6-47.3)
8.95±7.1 (6-15.9)
4.35±0.72 (3.3-6.9)
46.65±4.41 (38.3-57.0)
6.2±3.28 (3.8-10.4)
52.36±5.53 (42.5-61.9)
71-85 n = 185
4.89±0.74 (4.0-6.2)
37.54±3.63 (32.2-41.8)
5.67±8.4 (3.5-16.7)
4.64±1.3 (2.5-8.4)
46.71±3.59 (38.5-51.6)
5.9±4.1 (4.1-11.5)
53.48±4.74 (49.3-63.2)
The values are presented as mean±SD, n = number, SL = sensory latency; SNCV = sensory nerve conduction velocity; SNAPA = sensory nerve action potential amplitude, DML = distal motor latency measured from the onset of action potential, MNCV = motor nerve conduction velocity, CMAPA = compound muscle action potential amplitude measured from peak to peak. The values between brackets represent the range.
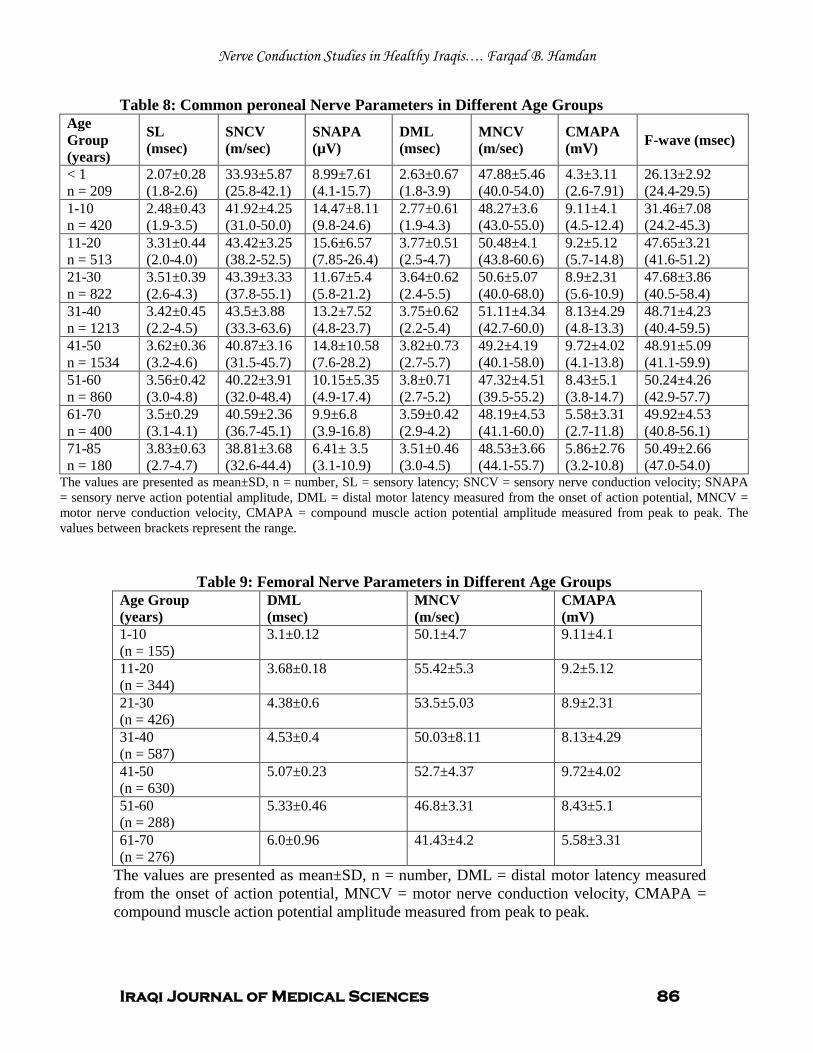
Nerve Conduction Studies in Healthy Iraqis…. Farqad B. Hamdan
Iraqi Journal of Medical Sciences 86
Table 8: Common peroneal Nerve Parameters in Different Age Groups Age Group (years)
SL (msec)
SNCV (m/sec)
SNAPA (µV)
DML (msec)
MNCV (m/sec)
CMAPA (mV) F-wave (msec)
< 1 n = 209
2.07±0.28 (1.8-2.6)
33.93±5.87 (25.8-42.1)
8.99±7.61 (4.1-15.7)
2.63±0.67 (1.8-3.9)
47.88±5.46 (40.0-54.0)
4.3±3.11 (2.6-7.91)
26.13±2.92 (24.4-29.5)
1-10 n = 420
2.48±0.43 (1.9-3.5)
41.92±4.25 (31.0-50.0)
14.47±8.11 (9.8-24.6)
2.77±0.61 (1.9-4.3)
48.27±3.6 (43.0-55.0)
9.11±4.1 (4.5-12.4)
31.46±7.08 (24.2-45.3)
11-20 n = 513
3.31±0.44 (2.0-4.0)
43.42±3.25 (38.2-52.5)
15.6±6.57 (7.85-26.4)
3.77±0.51 (2.5-4.7)
50.48±4.1 (43.8-60.6)
9.2±5.12 (5.7-14.8)
47.65±3.21 (41.6-51.2)
21-30 n = 822
3.51±0.39 (2.6-4.3)
43.39±3.33 (37.8-55.1)
11.67±5.4 (5.8-21.2)
3.64±0.62 (2.4-5.5)
50.6±5.07 (40.0-68.0)
8.9±2.31 (5.6-10.9)
47.68±3.86 (40.5-58.4)
31-40 n = 1213
3.42±0.45 (2.2-4.5)
43.5±3.88 (33.3-63.6)
13.2±7.52 (4.8-23.7)
3.75±0.62 (2.2-5.4)
51.11±4.34 (42.7-60.0)
8.13±4.29 (4.8-13.3)
48.71±4.23 (40.4-59.5)
41-50 n = 1534
3.62±0.36 (3.2-4.6)
40.87±3.16 (31.5-45.7)
14.8±10.58 (7.6-28.2)
3.82±0.73 (2.7-5.7)
49.2±4.19 (40.1-58.0)
9.72±4.02 (4.1-13.8)
48.91±5.09 (41.1-59.9)
51-60 n = 860
3.56±0.42 (3.0-4.8)
40.22±3.91 (32.0-48.4)
10.15±5.35 (4.9-17.4)
3.8±0.71 (2.7-5.2)
47.32±4.51 (39.5-55.2)
8.43±5.1 (3.8-14.7)
50.24±4.26 (42.9-57.7)
61-70 n = 400
3.5±0.29 (3.1-4.1)
40.59±2.36 (36.7-45.1)
9.9±6.8 (3.9-16.8)
3.59±0.42 (2.9-4.2)
48.19±4.53 (41.1-60.0)
5.58±3.31 (2.7-11.8)
49.92±4.53 (40.8-56.1)
71-85 n = 180
3.83±0.63 (2.7-4.7)
38.81±3.68 (32.6-44.4)
6.41± 3.5 (3.1-10.9)
3.51±0.46 (3.0-4.5)
48.53±3.66 (44.1-55.7)
5.86±2.76 (3.2-10.8)
50.49±2.66 (47.0-54.0)
The values are presented as mean±SD, n = number, SL = sensory latency; SNCV = sensory nerve conduction velocity; SNAPA = sensory nerve action potential amplitude, DML = distal motor latency measured from the onset of action potential, MNCV = motor nerve conduction velocity, CMAPA = compound muscle action potential amplitude measured from peak to peak. The values between brackets represent the range.
Table 9: Femoral Nerve Parameters in Different Age Groups Age Group (years)
DML (msec)
MNCV (m/sec)
CMAPA (mV)
1-10 (n = 155)
3.1±0.12
50.1±4.7
9.11±4.1
11-20 (n = 344)
3.68±0.18
55.42±5.3
9.2±5.12
21-30 (n = 426)
4.38±0.6
53.5±5.03
8.9±2.31
31-40 (n = 587)
4.53±0.4
50.03±8.11
8.13±4.29
41-50 (n = 630)
5.07±0.23
52.7±4.37
9.72±4.02
51-60 (n = 288)
5.33±0.46
46.8±3.31
8.43±5.1
61-70 (n = 276)
6.0±0.96
41.43±4.2
5.58±3.31
The values are presented as mean±SD, n = number, DML = distal motor latency measured from the onset of action potential, MNCV = motor nerve conduction velocity, CMAPA = compound muscle action potential amplitude measured from peak to peak.
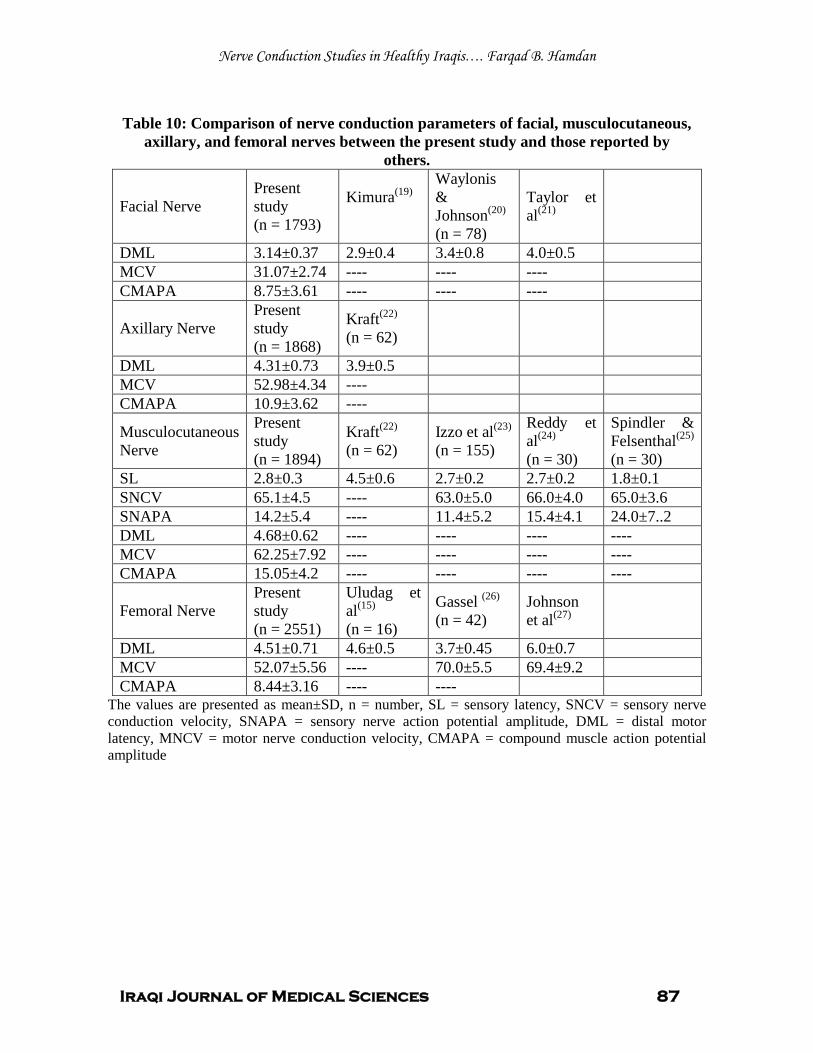
Nerve Conduction Studies in Healthy Iraqis…. Farqad B. Hamdan
Iraqi Journal of Medical Sciences 87
Table 10: Comparison of nerve conduction parameters of facial, musculocutaneous,
axillary, and femoral nerves between the present study and those reported by others.
Facial Nerve Present study (n = 1793)
Kimura
(19) Waylonis & Johnson(n = 78)
(20) Taylor et al (21)
DML 3.14±0.37 2.9±0.4 3.4±0.8 4.0±0.5 MCV 31.07±2.74 ---- ---- ---- CMAPA 8.75±3.61 ---- ---- ----
Axillary Nerve Present study (n = 1868)
Kraft(n = 62)
(22)
DML 4.31±0.73 3.9±0.5 MCV 52.98±4.34 ---- CMAPA 10.9±3.62 ----
Musculocutaneous Nerve
Present study (n = 1894)
Kraft(n = 62)
(22) Izzo et al(n = 155)
(23) Reddy et al(n = 30)
(24) Spindler & Felsenthal(n = 30)
(25)
SL 2.8±0.3 4.5±0.6 2.7±0.2 2.7±0.2 1.8±0.1 SNCV 65.1±4.5 ---- 63.0±5.0 66.0±4.0 65.0±3.6 SNAPA 14.2±5.4 ---- 11.4±5.2 15.4±4.1 24.0±7..2 DML 4.68±0.62 ---- ---- ---- ---- MCV 62.25±7.92 ---- ---- ---- ---- CMAPA 15.05±4.2 ---- ---- ---- ----
Femoral Nerve Present study (n = 2551)
Uludag et al(n = 16)
(15) Gassel (n = 42)
(26) Johnson et al (27)
DML 4.51±0.71 4.6±0.5 3.7±0.45 6.0±0.7 MCV 52.07±5.56 ---- 70.0±5.5 69.4±9.2 CMAPA 8.44±3.16 ---- ----
The values are presented as mean±SD, n = number, SL = sensory latency, SNCV = sensory nerve conduction velocity, SNAPA = sensory nerve action potential amplitude, DML = distal motor latency, MNCV = motor nerve conduction velocity, CMAPA = compound muscle action potential amplitude

Nerve Conduction Studies in Healthy Iraqis…. Farqad B. Hamdan
Iraqi Journal of Medical Sciences 88
Table 11: Comparison of nerve conduction parameters of median, ulnar, and radial nerves between the present study and those reported by others.
Median Nerve
Present study (n = 5766)
Hennessey et al(n = 44)
(8) Shehab(n = 50)
(14) Awang et al(n = 250)
(16) Kimura(n = 65)
(18) Karagoz et al(n = 17)
(28)
SL 1.93±0.22 2.5±0.2 2.3±0.3 ---- 2.84±0.34 ---- SNCV 51.9±4.04 61.2±4.3 56.6±7.6 54.04±7.02 56.2±5.8 61.4±3.0 SNAPA 49.5±23.1 31.4±8.2 71.3±23.9 ---- 38.5±15.6 36.6±6.6 DML 3.39±0.47 3.2±0.4 3.1±0.3 ---- 3.49±0.34 ---- MNCV 58.97±4.8 59.5±4.4 56.5±3.5 54.71±5.69 57.7±4.9 59.3±3.2 CMAPA 14.8±4.92 12.1±3.8 11.1±2.8 ---- 7.0±3.0 8.3±1.4
Ulnar Nerve
Present study (n = 5519)
Shehab(n = 50)
(14) Awang et al(n = 250)
(16) Kimura(n = 65)
(18) Karagoz et al(n = 17)
(28) Buschbacher(n = 248)
(29)
SL 1.94±0.19 2.0±0.2 2.0±0.2 2.54±0.29 ---- ---- SNCV 54.2±3.97 52.1±7.5 52.1±7.5 54.8±5.3 58.5±3.7 ---- SNAPA 50.1±19.8 59.2±17.6 59.2±17.6 35.0±13.4 29.7±4.0 ---- DML 2.35±0.39 2.4±0.3 2.4±0.3 2.59±0.39 ---- 3.0±0.3 MNCV 63.2±5.61 60.4±5.2 60.4±5.2 58.7±5.1 59.7±3.7 61.0 CMAPA 13.8±4.86 9.2±2.2 9.2±2.2 5.7±2.0 12.3±2.0 11.6±2.1
Radial Nerve
Present study (n = 4729)
Falco et al(n = 51)
(9) Johnson et al(n = 78)
(13) Shehab(n = 50)
(14) Jebsen(n = 49)
(30) Trojaborg & Sinrup(31)
SL 1.94±0.33 2.0±0.2 2.4±0.2 1.95±0.3 ---- ---- SNCV 53.44±4.42 ---- ---- 53.1±8.7 ---- 58.0±6.0 SNAPA 26.9±13.98 16.5±13.8 12.0±1.0 18.6±5.5 ---- 13.0±7.5 DML 3.27±0.72 ---- ---- ---- ---- ---- MNCV 58.84±6.32 ---- ---- ---- 61.1±5.9 62.0±5.1 CMAPA 16.1±5.23 ---- ---- ---- ---- 14.0±8.8
The values are presented as mean±SD, n = number, SL = sensory latency, SNCV = sensory nerve conduction velocity, SNAPA = sensory nerve action potential amplitude, DML = distal motor latency, MNCV = motor nerve conduction velocity, CMAPA = compound muscle action potential amplitude
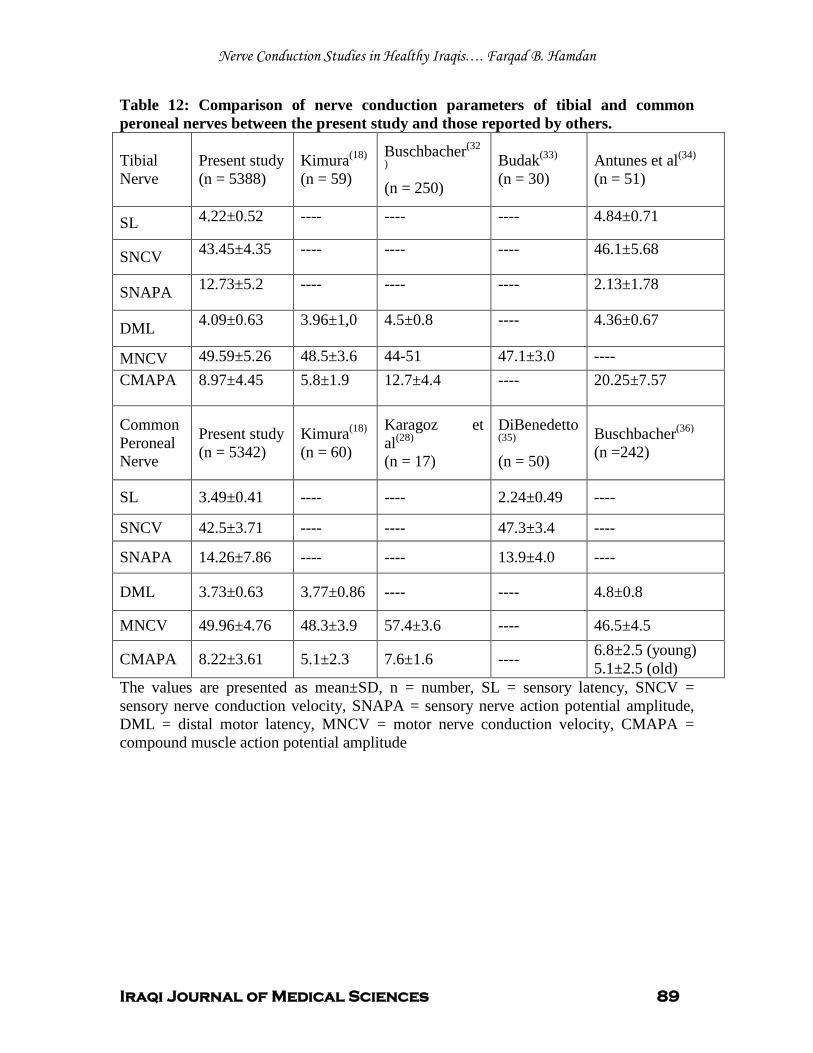
Nerve Conduction Studies in Healthy Iraqis…. Farqad B. Hamdan
Iraqi Journal of Medical Sciences 89
Table 12: Comparison of nerve conduction parameters of tibial and common peroneal nerves between the present study and those reported by others.
Tibial Nerve
Present study (n = 5388)
Kimura(n = 59)
(18) Buschbacher
(n = 250)
(32
) Budak(n = 30)
(33) Antunes et al(n = 51)
(34)
SL 4.22±0.52 ---- ---- ---- 4.84±0.71
SNCV 43.45±4.35 ---- ---- ---- 46.1±5.68
SNAPA 12.73±5.2 ---- ---- ---- 2.13±1.78
DML 4.09±0.63 3.96±1,0 4.5±0.8 ---- 4.36±0.67
MNCV 49.59±5.26 48.5±3.6 44-51 47.1±3.0 ---- CMAPA 8.97±4.45 5.8±1.9 12.7±4.4 ---- 20.25±7.57
Common Peroneal Nerve
Present study (n = 5342)
Kimura(n = 60)
(18) Karagoz et al(n = 17)
(28) DiBenedetto
(n = 50) (35) Buschbacher
(n =242) (36)
SL 3.49±0.41 ---- ---- 2.24±0.49 ----
SNCV 42.5±3.71 ---- ---- 47.3±3.4 ----
SNAPA 14.26±7.86 ---- ---- 13.9±4.0 ----
DML 3.73±0.63 3.77±0.86 ---- ---- 4.8±0.8
MNCV 49.96±4.76 48.3±3.9 57.4±3.6 ---- 46.5±4.5
CMAPA 8.22±3.61 5.1±2.3 7.6±1.6 ---- 6.8±2.5 (young) 5.1±2.5 (old)
The values are presented as mean±SD, n = number, SL = sensory latency, SNCV = sensory nerve conduction velocity, SNAPA = sensory nerve action potential amplitude, DML = distal motor latency, MNCV = motor nerve conduction velocity, CMAPA = compound muscle action potential amplitude
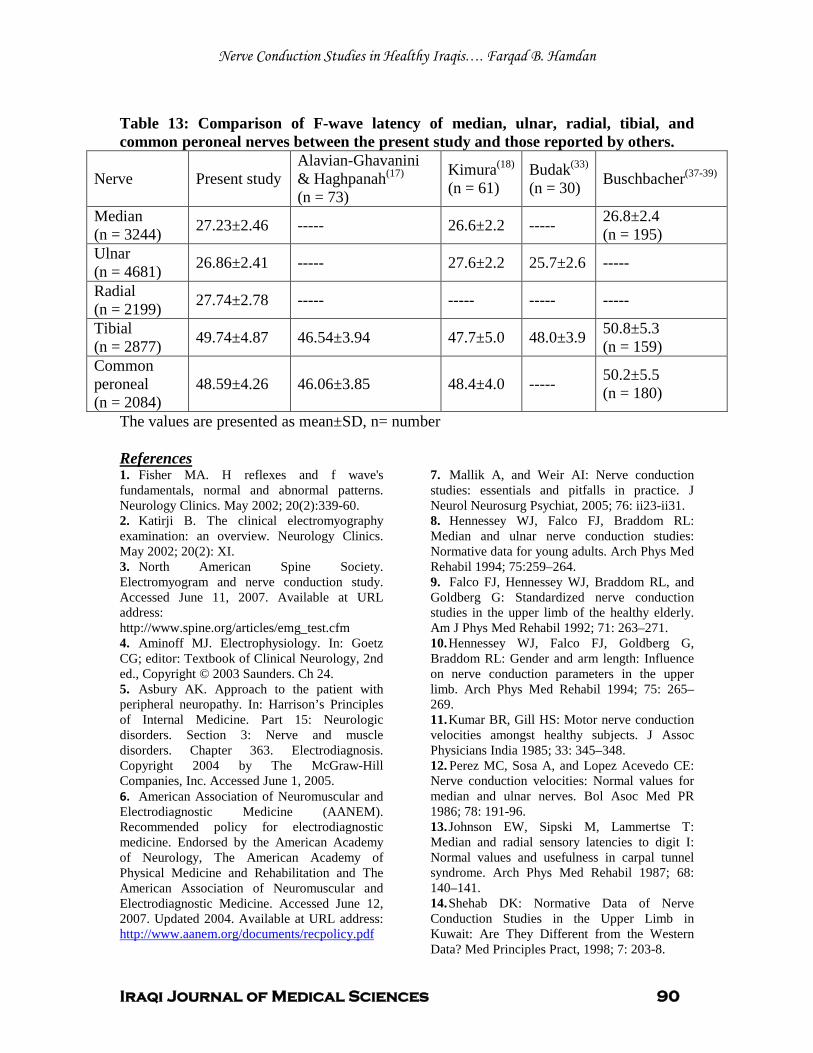
Nerve Conduction Studies in Healthy Iraqis…. Farqad B. Hamdan
Iraqi Journal of Medical Sciences 90
Table 13: Comparison of F-wave latency of median, ulnar, radial, tibial, and common peroneal nerves between the present study and those reported by others.
Nerve Present study Alavian-Ghavanini & Haghpanah(n = 73)
(17) Kimura(n = 61)
(18) Budak(n = 30)
(33) Buschbacher(37-39)
Median (n = 3244) 27.23±2.46 ----- 26.6±2.2 ----- 26.8±2.4
(n = 195) Ulnar (n = 4681) 26.86±2.41 ----- 27.6±2.2 25.7±2.6 -----
Radial (n = 2199) 27.74±2.78 ----- ----- ----- -----
Tibial (n = 2877) 49.74±4.87 46.54±3.94 47.7±5.0 48.0±3.9 50.8±5.3
(n = 159) Common peroneal (n = 2084)
48.59±4.26 46.06±3.85 48.4±4.0 ----- 50.2±5.5 (n = 180)
The values are presented as mean±SD, n= number
1. Fisher MA. H reflexes and f wave's fundamentals, normal and abnormal patterns. Neurology Clinics. May 2002; 20(2):339-60.
References
2. Katirji B. The clinical electromyography examination: an overview. Neurology Clinics. May 2002; 20(2): XI. 3. North American Spine Society. Electromyogram and nerve conduction study. Accessed June 11, 2007. Available at URL address: http://www.spine.org/articles/emg_test.cfm 4. Aminoff MJ. Electrophysiology. In: Goetz CG; editor: Textbook of Clinical Neurology, 2nd ed., Copyright © 2003 Saunders. Ch 24. 5. Asbury AK. Approach to the patient with peripheral neuropathy. In: Harrison’s Principles of Internal Medicine. Part 15: Neurologic disorders. Section 3: Nerve and muscle disorders. Chapter 363. Electrodiagnosis. Copyright 2004 by The McGraw-Hill Companies, Inc. Accessed June 1, 2005. 6. American Association of Neuromuscular and Electrodiagnostic Medicine (AANEM). Recommended policy for electrodiagnostic medicine. Endorsed by the American Academy of Neurology, The American Academy of Physical Medicine and Rehabilitation and The American Association of Neuromuscular and Electrodiagnostic Medicine. Accessed June 12, 2007. Updated 2004. Available at URL address: http://www.aanem.org/documents/recpolicy.pdf
7. Mallik A, and Weir AI: Nerve conduction studies: essentials and pitfalls in practice. J Neurol Neurosurg Psychiat, 2005; 76: ii23-ii31. 8. Hennessey WJ, Falco FJ, Braddom RL: Median and ulnar nerve conduction studies: Normative data for young adults. Arch Phys Med Rehabil 1994; 75:259–264. 9. Falco FJ, Hennessey WJ, Braddom RL, and Goldberg G: Standardized nerve conduction studies in the upper limb of the healthy elderly. Am J Phys Med Rehabil 1992; 71: 263–271. 10. Hennessey WJ, Falco FJ, Goldberg G, Braddom RL: Gender and arm length: Influence on nerve conduction parameters in the upper limb. Arch Phys Med Rehabil 1994; 75: 265–269. 11. Kumar BR, Gill HS: Motor nerve conduction velocities amongst healthy subjects. J Assoc Physicians India 1985; 33: 345–348. 12. Perez MC, Sosa A, and Lopez Acevedo CE: Nerve conduction velocities: Normal values for median and ulnar nerves. Bol Asoc Med PR 1986; 78: 191-96. 13. Johnson EW, Sipski M, Lammertse T: Median and radial sensory latencies to digit I: Normal values and usefulness in carpal tunnel syndrome. Arch Phys Med Rehabil 1987; 68: 140–141. 14. Shehab DK: Normative Data of Nerve Conduction Studies in the Upper Limb in Kuwait: Are They Different from the Western Data? Med Principles Pract, 1998; 7: 203-8.
Nerve Conduction Studies in Healthy Iraqis…. Farqad B. Hamdan
Iraqi Journal of Medical Sciences 91
15. Uludag B, Ertekin C, Turman AB, Demir D, Kiylioglu N: Proximal and distal motor nerve conduction in obturator and femoral nerves. Arch Phys Med Rehabil, 2000 Sep; 81(9): 1166-70. 16. Awang MS, Abdullah JM, Abdullah MR, Tahir A, Tharakan J, Parasad A, and Abdul Razak S: Nerve conduction study of healthy Asian Malays: The influence of age on median, ulnar, and sural nerves. Med Sci Monit, 2007; 13(7): 330-332. 17. Alavian-Ghavanini MR & Haghpana S: Normal values of F-wave in lower extremities of 73 healthy individuals in Iran. Electromyograph Clin Neurophysiol, 2000; 40: 375-9. 18. Kimura J: Electrodiagnosis in Diseases of Nerve and Muscle: Principles and Practice, 3rd
19. Kimura J: Conduction abnormalities of the facial and trigeminal nerves in polyneuropathy. Muscle Nerve, 1982; 5: S142.
ed Philadelphia, Davis, 2001; p.p. 131-168, 180, 412, 413.
20. Waylonis GW, Johnson EW: Facial nerve conduction delay. Arch Phys Med Rehabil, 1964; 45: 539-47. 21. Taylor N, Jebsen RH, Tenckhoff HA: Facial nerve conduction latency in chronic renal insufficiency. Arch Phys Med Rehabil, 1970; 51: 259-63. 22. Kraft GH: Axillary, musculocutaneous, and suprascapular nerve latency studies. Arch Phys Med Rehabil, 1972; 53: 383-7. 23. Izzo KL, Aravabhumi S, Jafri A, Sobel E, and Demopoulous JT: Median and lateral antebrachial cutaneous nerves: Standardization of technique, reliability, and age effect on healthy subjects. Arch Phys Med Rehabil, 1985; 66: 592-7. 24. Reddy MP: Conduction studies of the medial cutaneous nerve of the forearm. Arch Phys Med Rehabil, 1983; 64: 209-11. 25. Spindler, HA, Felsenthal G: Sensory conduction in the musculocutaneous nerve. Arch Phys Med Rehabil, 1978; 59: 20-23. 26. Gassel MM: A study of femoral nerve conduction time. Arch Neurol, 1963; 6: 57-64. 27. Johnson EW, Wood PK, and Powers II: Femoral nerve conduction studies. Arch Phys Med Rehabil, 1968; 49: 528. 28. Karagoz E, Tanridag T, Karlikaya G, Midi I, and Elmaci NT: The electrophysiology of diabetic neuropathy. Internet J Neurol, 2005; 5(1): . 29. Buschbacher RM: Ulnar nerve motor conduction to the abductor digiti minimi. Am J Phys Med Rehabil. 1999 Nov-Dec; 78(6 Suppl):S9-14.
30. Jebsen RH: Motor conduction velocity in proximal and distal segments of the radial nerve. Arch Phys Med Rehabil, 1966; 47: 597-602. 31. Trojaborg W, and Sinrup EH: Motor and sensory conduction in different segments of the radial nerve in normal subjects. J Neurol Neurosurg Psychiat, 1969; 32: 354-9. 32. Buschbacher RM: Tibial nerve conduction to the flexor digiti minimi brevis. Update On Nerve Conduction Studies. Am J Phys Med Rehabil, 1999 November/December; 78(6) Supplement: S21-S25. 33. Budak F, Efendi H, Apaydin R, Bilen N, and Komsuoglu S: The F response parameters in Behcet’s disease. Electromyogr Clin Neurophysiol, 2000; 40: 45-8. 34. Antunes AC, Maciel Nobrega JA, and Mastrocola Manzano G: Nerve conduction study of the medial and planter nerves. Electromyogr Clin Neurophysiol, 2000; 40: 135-8. 35. DiBenedetto M: Sensory nerve conduction in lower extremities. Arch Phys Med Rehabil, 1970; 51: 253-8. 36. Buschbacher RM: Peroneal nerve motor conduction to the extensor digitorum brevis. Am J Phys Med Rehabil. 1999 Nov-Dec; 78(6 Suppl):S26-31. 37. Buschbacher RM: Median nerve F-wave latencies recorded from the abductor pollicis brevis. Am J Phys Med Rehabil. 1999 Nov-Dec; 78(6 Suppl):S32-7. 38. Buschbacher RM: Tibial nerve F-waves recorded from the abductor hallucis. Am J Phys Med Rehabil. 1999 Nov-Dec; 78(6 Suppl):S43-7. 39. Buschbacher RM: Peroneal nerve F-wave latencies recorded from the extensor digitorum brevis. Am J Phys Med Rehabil. 1999 Nov-Dec; 78(6 Suppl):S48-52. 40. Robinson LR, Rubner DE, Wohl PW, Fujimoto WY, Stolov WC: Influences of height and gender on normal nerve conduction studies. Arch Phys Med Rehabil 1993; 74: 1134–1138. 41. Akataki K, Mita K, Watakabe M, and Ito K: Age-related changes in motor unit activation strategy in force production. A mechanomyographic investigation. Muscle Nerve, 2002; 25: 505-12. 42. Rivner MH, Swift TR, and Malik K: Influence of age and height on nerve conduction. Muscle Nerve, 2001; 24(9): 1134-41. 43. Tong HC, Werner RA, Franblau A: Effect of aging on sensory nerve conduction study parameters. Muscle Nerve, 2004; 29(5): 716-20. 44. Salerno DF, Werner RA, and Albers JW: Reliability of nerve conduction studies among
Nerve Conduction Studies in Healthy Iraqis…. Farqad B. Hamdan
Iraqi Journal of Medical Sciences 92
active workers. Muscle Nerve, 1999; 22: 1372-79. 45. Flack B, Stålberg E, and Bischoff C: sensory nerve conduction studies with surface electrodes. Methods in Clinical Neurophysiology, 1994; 5: 1-20. 46. Lang AH, Puusa A, Hynninen P et al: Evolution of nerve conduction velocity in later childhood and adolescence. Muscle Nerve, 1985; 8: 38-43. 47. Konishi H: Motor nerve conduction studies in median and ulnar nerves in old adults over 80 years of age. Nippon Seikeigeka Gakkai Zasshi, 1982; 56(4): 305-20. 48. Ganeriwal SK, Reddy BV, Surdi AD et al: Influence of age on motor nerve conduction. Indian J Physiol Pharmachol, 1983; 27(4): 337-41. 49. Stetson DS, Albers JW, Silverstein BA, Wolfe RA: Effects of age, sex, and anthropometric factors on nerve conduction measures. Muscle Nerve, 1992; 15: 1095-1104.

Iraqi Journal of Medical Sciences 93
Endoscopic Sinus Surgery versus Conventional Method in Management of Naso-Ethmoidal polyps and Their Associated Intranasal Abnormalities
Hiwa As’ad Rawandzi FICMS; CABS (ENT).
Abstract Background: This is a prospective and comparative clinical study, implemented in department of Otolaryngology –Sulaimani Teaching Hospital, from Aug. 1st 2006 to Nov. 1st 2007. Objectives: This study was carried out to compare the influences and outcomes of endoscopic sinus surgery versus conventional intranasal method in management of patients with nasal polyps, which is the most common intranasal swelling. Methods: The sample of the study includes 50 patients’ aged 12-75 yeas old that are managed for nasal polyp, thirty patients managed by conventional method and twenty patients were managed by endoscopic sinus surgery.Patients are observed postoperatively by symptomatic score and endoscopically
Results: Endoscopic sinus surgery resulted in better improvement in symptoms,better treatment of other associated sinonasal pathologies, less complication rate,and less recurrence rate than conventional polyoectomy.On the other hand endoscopic sinus surgery is more technically demanding and needs more operative time than the conventional way. Conclusion: We concluded from the study that Endoscopic Sinus surgery is better than conventional intranasal polypectomy, as endoscopy provides approximate field of vision and illumination, good access, hidden pathology are revealed and managed, and complication, recurrent rate are less. Keywords: nasal polyp, conventional polypectomy, endoscopic sinus surgery. IRAQI J MED SCI, 2009; VOL.7 (2):93-103
Introduction
The introduction of endoscopes in sinus surgery has brought about a revolution in the approach to surgery of paranasal sinuses. This technical achievement has been critical in the evolution of a functional philosophy of sinus surgery which was introduced by Messerklinger (1978) and Wigand (1981) and further refined by Stammberger (1986) (1)
Endoscopic sinus surgery is a minimally invasive technique in which sinus air cells and sinus ostia are opened under direct visualization
.
(2)
.
Teaching Hospital, College of Medicine, University of Sulaimani. Adress Correspondence to: Dr. Hiwa As’ad Abdulkareem. College of Medicine/University of Sulaimaniyah. E.mail: [email protected] Cell phone: 07701580087 Received: 3rd April 2008, Accepted: 1st
Most rhinologists agree that Endoscopic Sinus Surgery should be a “disease-directed” and mucosal-sparing operation, recognizing the principle of the
potential for re-establishing drainage and mucosal recovery of the dependent sinuses
June 2009.
(3)
The ability to treat paranasal sinus disease and the nasal cavity has been revolutionized by endoscopes and computed tomographic scanning (CT). Endoscopes have made it possible to examine the nose thoroughly from the anterior nares to the postnasal space
.
(2)
Endoscopy also used for therapeutic purposes for patients who are correctly documented disease have failed to respond to appropriate medical therapy like chronic rhinosinusitis and nasal polyp with preservation of mucosal and bony framework in critical areas of the nasal cavity
.
(4)
CT scanning identifies the anatomic relationships of the key structures (orbital contents, optic nerve and carotid artery) to the diseased areas. A process that is vital for surgical planning. CT also defines the extent of disease in any individual sinus, as well as any underlying anatomic abnormalities that may predispose a patient to sinusitis and nasal polyp
.
(2).

Endoscopic Sinus Surgery ,Naso-Ethmoidal polyps ….Hiwa As’ad Rawandzi
Iraqi Journal of Medical Sciences 94
The reasons and concepts supporting the use of FESS have recently become widely accepted. The term "functional" was introduced to distinguish this type of endoscopic surgery from nonendoscopic, "conventional" procedures; the goal of FESS is to return the mucociliary drainage of the sinuses to normal function. The paranasal sinuses are maintained in a healthy state by ventilation through the individual ostia and by a mucociliary transport mechanism that keeps a continuous protective layer of mucus flowing out of the sinuses (1, 2, and 5)
Nasal Polyps are parts of an inflammatory reaction involving the mucosa of the nose and paranasal sinuses. Nasal polyps are evaginations of the nasal mucosa attached by a pedicle arising from the ethmoidal sinuses, middle turbinate, maxillary sinuses and some times from the septum
.
(6)
Types: .
• Simple. • Neoplastic.
o Benign. o Malignant.
There are 5 main theories of
pathogenesis:
1. Bernoulli phenomenon. 2. Polysaccharide changes. 3. Vasomotor imbalance. 4. Infection. 5. Allergy (8)
No single predisposing disease can be implicated in the formation of polyps, though they may be associated with several other diseases, notably non-allergic (intrinsic) asthma and aspirin intolerance or sensitivity
.
(9)
The association of asthma and nasal polyps has been noted by numerous authors. What is also recognized, but much less often cited, is that this association is strongest in women
.
In advanced cases the external nose may be broadened, the condition is known as “frog-face”
(10).
On examining the interior of the nose, attention should first be directed to the region of the middle turbinate, though in obvious cases a view of this part will be obscured by the multiple grey polypoidal masses. They are insensitive to probing, mobile on their pedicles, and may totally fill the nose bilaterally.
Posterior rhinoscopy should also be done; the nose can be looked perfectly normal anteriorly in the presence of a large choanal polyp, the narrow pedicle of which cannot be seen in the middle meatus
• There is no specific hematological, biochemical or immunological investigations that are required apart from those involved in the general work up of cases prior to surgery.
(12).
• Radiology Plain radiographs of the paranasal
sinuses demonstrated by the conventional three views will show the extent of the disease in the nose and paranasal sinuses to some extent. A CT_ scan will give more information, particularly the anatomical detail (8)
Management: .
The treatment of nasal polyposis is a debatable subject. Surgical or medical treatment or both have been recommended as the treatment of choice. A.Medical treatment:
According to the “Position statement on nasal polyps,” medical treatment should be used for at least 1 month before surgery is contemplated in patients with typical nasal polyposis because some studies have indicated that in those patients who respond to medical treatment , no additional treatment is necessary(13)
Steroids are the cornerstone for treating NP. This can range from topical steroid sprays or drops in mild to moderate polyposis, to a short course of systemic steroids in severely affected patients
.
(14)
Both oral corticosteroids and topical nasal corticosteroids are effective in shrinking polyps and controlling their
.
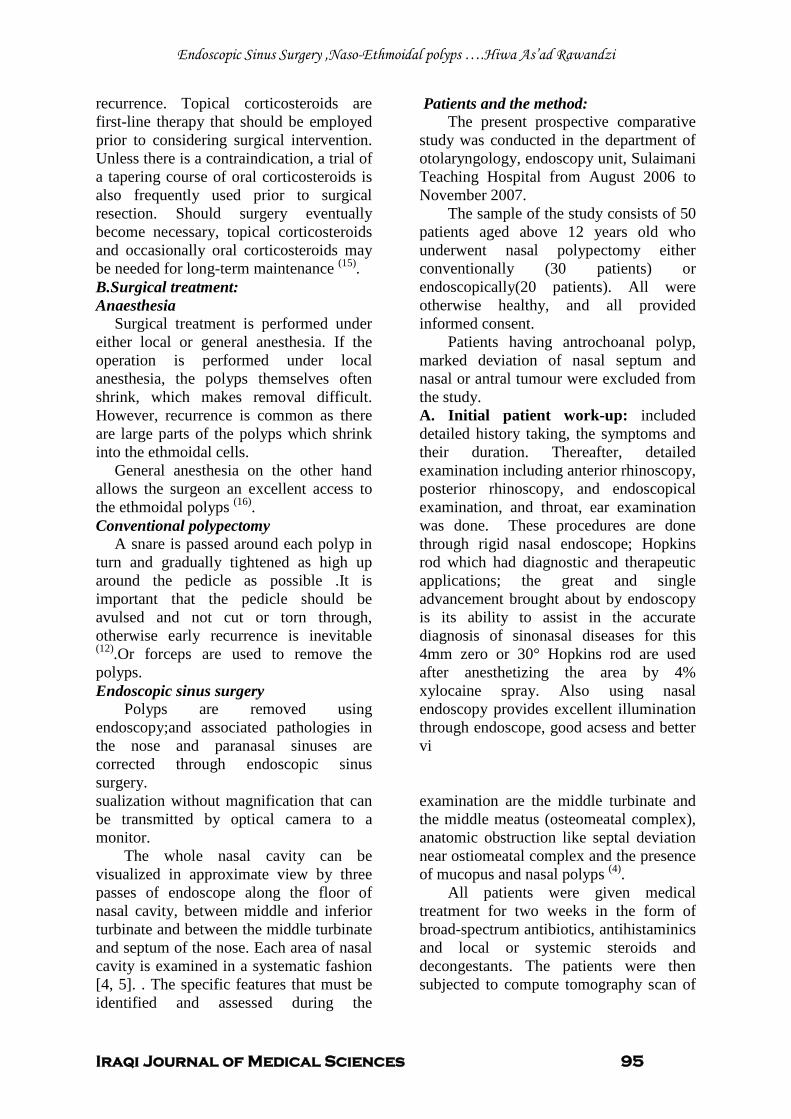
Endoscopic Sinus Surgery ,Naso-Ethmoidal polyps ….Hiwa As’ad Rawandzi
Iraqi Journal of Medical Sciences 95
recurrence. Topical corticosteroids are first-line therapy that should be employed prior to considering surgical intervention. Unless there is a contraindication, a trial of a tapering course of oral corticosteroids is also frequently used prior to surgical resection. Should surgery eventually become necessary, topical corticosteroids and occasionally oral corticosteroids may be needed for long-term maintenance (15)
B.Surgical treatment: .
Anaesthesia Surgical treatment is performed under
either local or general anesthesia. If the operation is performed under local anesthesia, the polyps themselves often shrink, which makes removal difficult. However, recurrence is common as there are large parts of the polyps which shrink into the ethmoidal cells.
General anesthesia on the other hand allows the surgeon an excellent access to the ethmoidal polyps (16)
Conventional polypectomy .
A snare is passed around each polyp in turn and gradually tightened as high up around the pedicle as possible .It is important that the pedicle should be avulsed and not cut or torn through, otherwise early recurrence is inevitable (12)
Endoscopic sinus surgery
.Or forceps are used to remove the polyps.
Polyps are removed using endoscopy;and associated pathologies in the nose and paranasal sinuses are corrected through endoscopic sinus surgery.
Patients and the method: The present prospective comparative
study was conducted in the department of otolaryngology, endoscopy unit, Sulaimani Teaching Hospital from August 2006 to November 2007.
The sample of the study consists of 50 patients aged above 12 years old who underwent nasal polypectomy either conventionally (30 patients) or endoscopically(20 patients). All were otherwise healthy, and all provided informed consent.
Patients having antrochoanal polyp, marked deviation of nasal septum and nasal or antral tumour were excluded from the study. A. Initial patient work-up: included detailed history taking, the symptoms and their duration. Thereafter, detailed examination including anterior rhinoscopy, posterior rhinoscopy, and endoscopical examination, and throat, ear examination was done. These procedures are done through rigid nasal endoscope; Hopkins rod which had diagnostic and therapeutic applications; the great and single advancement brought about by endoscopy is its ability to assist in the accurate diagnosis of sinonasal diseases for this 4mm zero or 30° Hopkins rod are used after anesthetizing the area by 4% xylocaine spray. Also using nasal endoscopy provides excellent illumination through endoscope, good acsess and better vi
sualization without magnification that can be transmitted by optical camera to a monitor.
The whole nasal cavity can be visualized in approximate view by three passes of endoscope along the floor of nasal cavity, between middle and inferior turbinate and between the middle turbinate and septum of the nose. Each area of nasal cavity is examined in a systematic fashion [4, 5]. . The specific features that must be identified and assessed during the
examination are the middle turbinate and the middle meatus (osteomeatal complex), anatomic obstruction like septal deviation near ostiomeatal complex and the presence of mucopus and nasal polyps (4)
All patients were given medical treatment for two weeks in the form of broad-spectrum antibiotics, antihistaminics and local or systemic steroids and decongestants. The patients were then subjected to compute tomography scan of
.
Endoscopic Sinus Surgery ,Naso-Ethmoidal polyps ….Hiwa As’ad Rawandzi
Iraqi Journal of Medical Sciences 96
paranasal sinuses- both axial and coronal views. B.Definate treatment:The patients are divided into two groups:. 1.Twenty patients underwent endoscopic sinus surgery for nasal polyps. The extent of surgery was decided based on the findings in pre-operative endoscopy and CT scan of paranasal sinuses. Uncinectomy, removal of lateral wall of concha bullosa, anterior ethmoidectomy, posterior ethmoidectomy, middle meatus antrostomy and/or clearance of frontal recess were performed in the second group of patients. Sphenoid sinus ostium was widened only if CT scan showed evidence of its involvement. Along with this any significant anatomical abnormality was also noted and taken in consideration during surgery. 2.Thirty patients underwent conventional intranasal polypectomy.A snare is passed around each polyp in turn and gradually tightened as high up around the pedicle and avulsed;or forceps are used to remove polyps. C. Post operative follow up: At the time of discharge from the hospital, the patients
were given systemic antibiotic for 10 days along with decongestant drops. Steroid nasal spray was advised in all cases. Alkaline nasal douching was also advised. Patients were advised follow-up one week later, six weeks and three months. Subjective assessment for symptomatic improvement was done and objective results were assessed by check endoscopy. The results were then compiled. Statistical analysis
The data are analysed by using StatCalc, version 5.3.4, by chi square analysis, P value less than 0.05 regarded as significant. Results
The first operative group is composed of 13 males and 7 females and the second operative group consists of 20 males and 10 females.
The mean age of first operative group is 34.3 years while the mean age of second operative group is 37.9 years. There is no significant difference between the two groups regarding the age and sex, p value 0.38 (see table 1).
Table 1: patient’s characteristics Distribution of number, age and sex between the two groups.
Group I: endoscopic sinus surgery group. Group II: conventional intranasal polypectomy group. SD = Standard deviation * = p value = 0.38
characteristics group I group II Number of patients 20 30
Mean age (years) ± SD* 34.3±13.09 37.9±14.78
Sex (M: F) ratio 1.85:1 2:1
Residence (urban /Rural)ratio 1.5:1 1.5:1
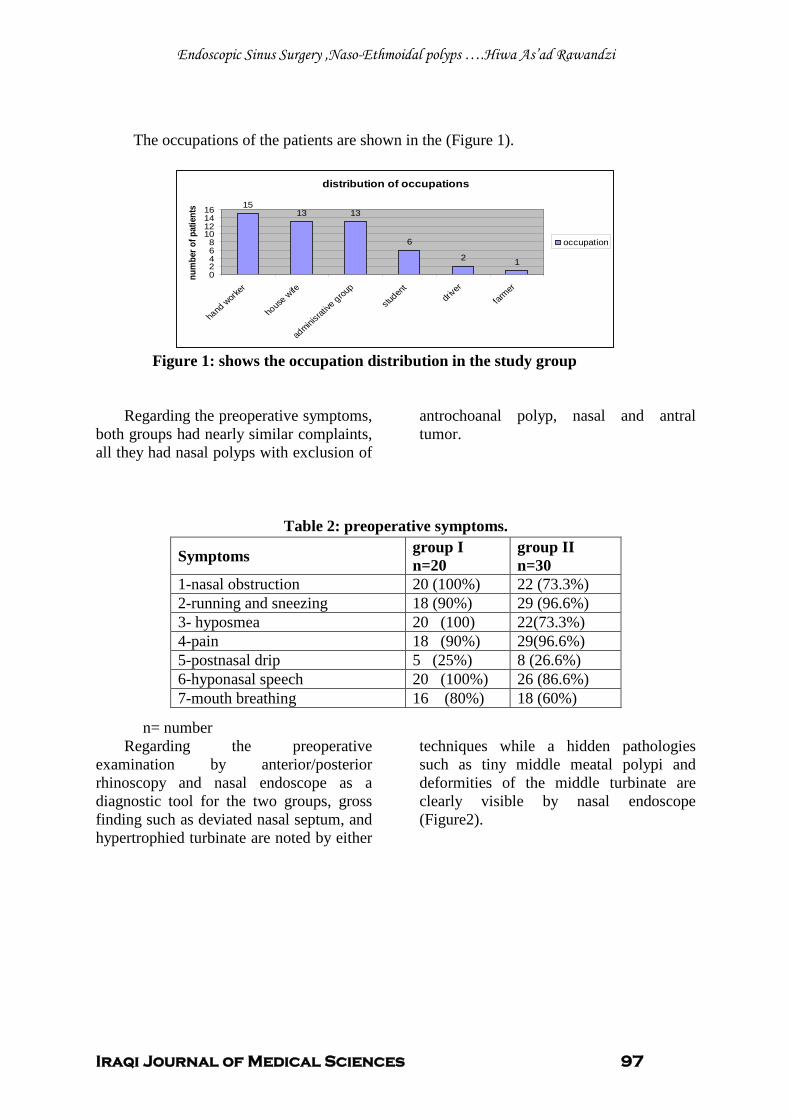
Endoscopic Sinus Surgery ,Naso-Ethmoidal polyps ….Hiwa As’ad Rawandzi
Iraqi Journal of Medical Sciences 97
The occupations of the patients are shown in the (Figure 1).
distribution of occupations
1513 13
6
2 102468
10121416
hand
worker
house
wife
adminis
rative
group
studen
tdri
ver
farmer
num
ber o
f pat
ient
s
occupation
Figure 1: shows the occupation distribution in the study group
Regarding the preoperative symptoms, both groups had nearly similar complaints, all they had nasal polyps with exclusion of
antrochoanal polyp, nasal and antral tumor.
Table 2: preoperative symptoms.
n= number Regarding the preoperative
examination by anterior/posterior rhinoscopy and nasal endoscope as a diagnostic tool for the two groups, gross finding such as deviated nasal septum, and hypertrophied turbinate are noted by either
techniques while a hidden pathologies such as tiny middle meatal polypi and deformities of the middle turbinate are clearly visible by nasal endoscope (Figure2).
Symptoms group I n=20
group II n=30
1-nasal obstruction 20 (100%) 22 (73.3%) 2-running and sneezing 18 (90%) 29 (96.6%) 3- hyposmea 20 (100) 22(73.3%) 4-pain 18 (90%) 29(96.6%) 5-postnasal drip 5 (25%) 8 (26.6%) 6-hyponasal speech 20 (100%) 26 (86.6%) 7-mouth breathing 16 (80%) 18 (60%)
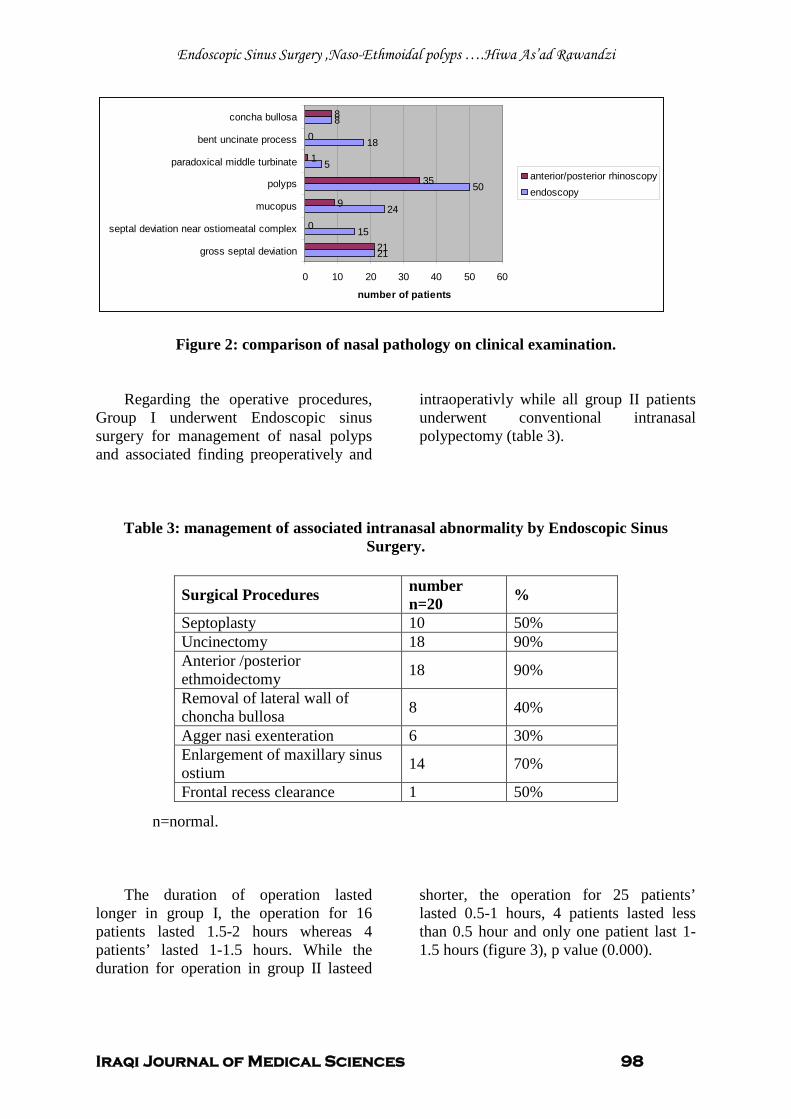
Endoscopic Sinus Surgery ,Naso-Ethmoidal polyps ….Hiwa As’ad Rawandzi
Iraqi Journal of Medical Sciences 98
21
15
24
50
5
18
8
21
0
9
35
1
0
8
0 10 20 30 40 50 60
gross septal deviation
septal deviation near ostiomeatal complex
mucopus
polyps
paradoxical middle turbinate
bent uncinate process
concha bullosa
number of patients
anterior/posterior rhinoscopyendoscopy
Figure 2: comparison of nasal pathology on clinical examination.
Regarding the operative procedures, Group I underwent Endoscopic sinus surgery for management of nasal polyps and associated finding preoperatively and
intraoperativly while all group II patients underwent conventional intranasal polypectomy (table 3).
Table 3: management of associated intranasal abnormality by Endoscopic Sinus Surgery.
n=normal.
The duration of operation lasted longer in group I, the operation for 16 patients lasted 1.5-2 hours whereas 4 patients’ lasted 1-1.5 hours. While the duration for operation in group II lasteed
shorter, the operation for 25 patients’ lasted 0.5-1 hours, 4 patients lasted less than 0.5 hour and only one patient last 1-1.5 hours (figure 3), p value (0.000).
Surgical Procedures number n=20 %
Septoplasty 10 50% Uncinectomy 18 90% Anterior /posterior ethmoidectomy 18 90%
Removal of lateral wall of choncha bullosa 8 40%
Agger nasi exenteration 6 30% Enlargement of maxillary sinus ostium 14 70%
Frontal recess clearance 1 50%
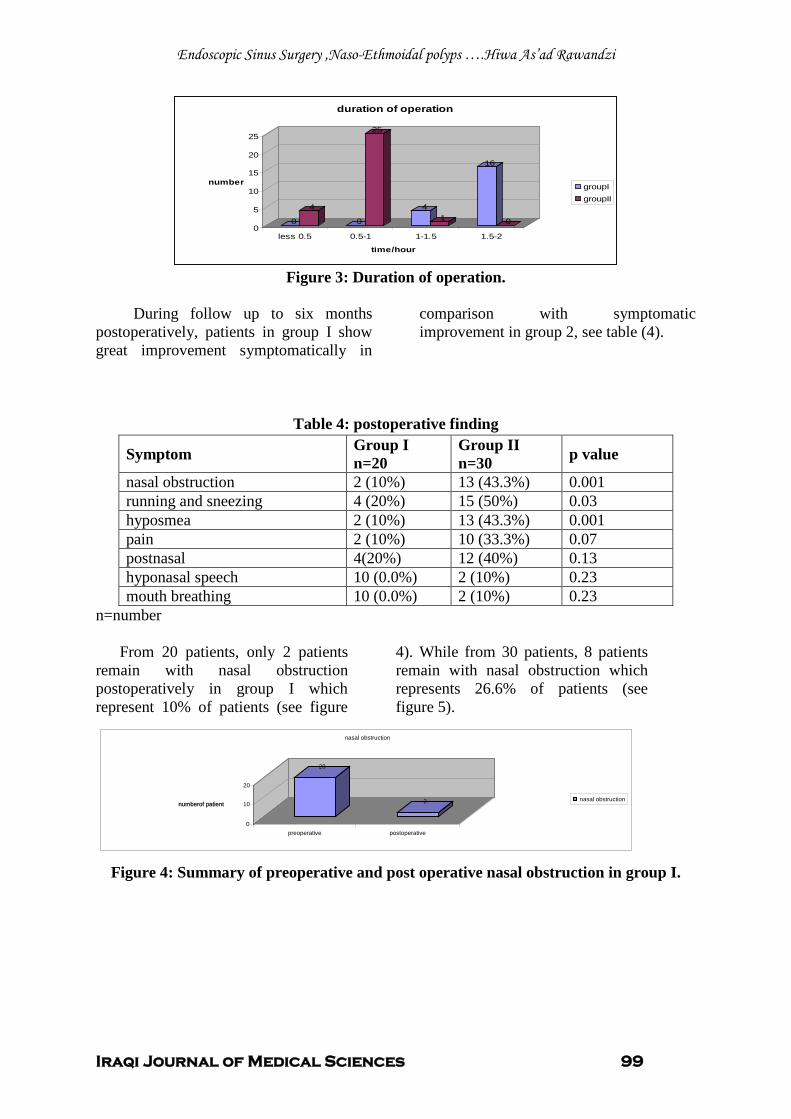
Endoscopic Sinus Surgery ,Naso-Ethmoidal polyps ….Hiwa As’ad Rawandzi
Iraqi Journal of Medical Sciences 99
0
4
0
25
41
16
00
5
10
15
20
25
number
less 0.5 0.5-1 1-1.5 1.5-2
time/hour
duration of operation
groupIgroupII
Figure 3: Duration of operation.
During follow up to six months
postoperatively, patients in group I show great improvement symptomatically in
comparison with symptomatic improvement in group 2, see table (4).
Table 4: postoperative finding
n=number
From 20 patients, only 2 patients remain with nasal obstruction postoperatively in group I which represent 10% of patients (see figure
4). While from 30 patients, 8 patients remain with nasal obstruction which represents 26.6% of patients (see figure 5).
Figure 4: Summary of preoperative and post operative nasal obstruction in group I.
Symptom Group I n=20
Group II n=30 p value
nasal obstruction 2 (10%) 13 (43.3%) 0.001 running and sneezing 4 (20%) 15 (50%) 0.03 hyposmea 2 (10%) 13 (43.3%) 0.001 pain 2 (10%) 10 (33.3%) 0.07 postnasal 4(20%) 12 (40%) 0.13 hyponasal speech 10 (0.0%) 2 (10%) 0.23 mouth breathing 10 (0.0%) 2 (10%) 0.23
20
2
0
10
20
numberof patient
preoperative postoperative
nasal obstruction
nasal obstruction
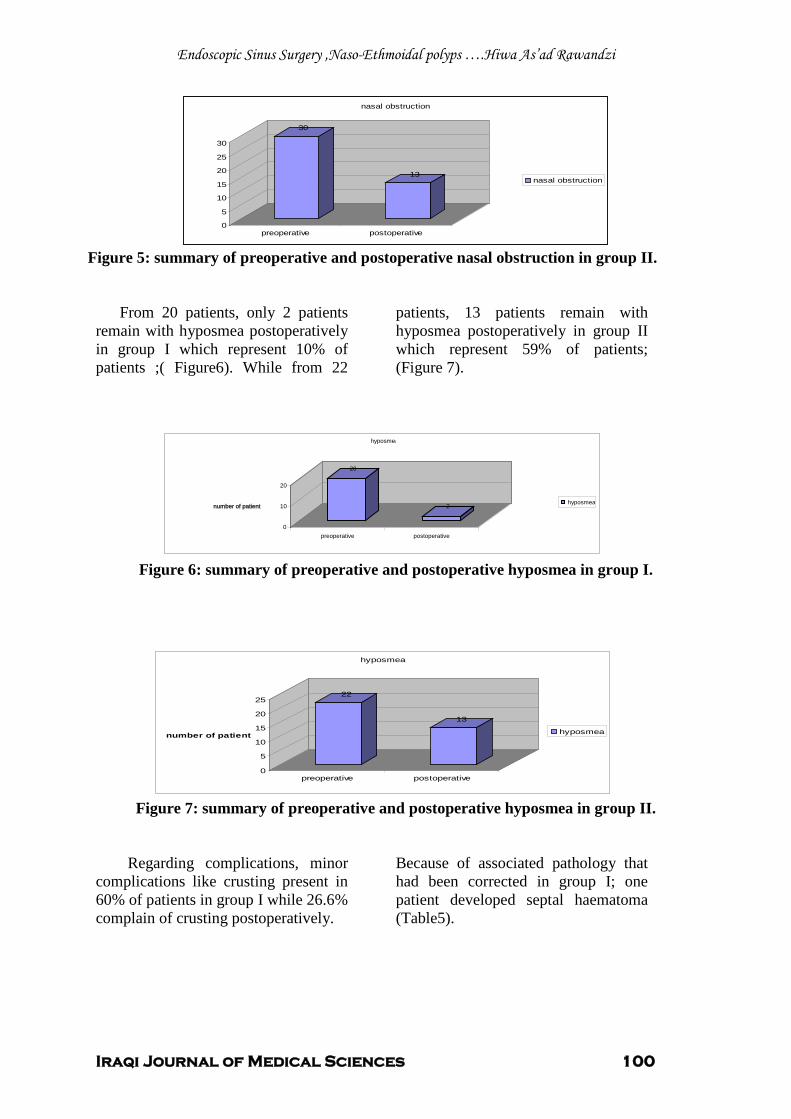
Endoscopic Sinus Surgery ,Naso-Ethmoidal polyps ….Hiwa As’ad Rawandzi
Iraqi Journal of Medical Sciences 100
30
13
0
5
10
15
20
25
30
preoperative postoperative
nasal obstruction
nasal obstruction
Figure 5: summary of preoperative and postoperative nasal obstruction in group II.
From 20 patients, only 2 patients remain with hyposmea postoperatively in group I which represent 10% of patients ;( Figure6). While from 22
patients, 13 patients remain with hyposmea postoperatively in group II which represent 59% of patients; (Figure 7).
Figure 6: summary of preoperative and postoperative hyposmea in group I.
Figure 7: summary of preoperative and postoperative hyposmea in group II.
Regarding complications, minor complications like crusting present in 60% of patients in group I while 26.6% complain of crusting postoperatively.
Because of associated pathology that had been corrected in group I; one patient developed septal haematoma (Table5).
22
13
0
5
10
15
20
25
number of patient
preoperative postoperative
hyposmea
hyposmea
20
2
0
10
20
number of patient
preoperative postoperative
hyposmea
hyposmea
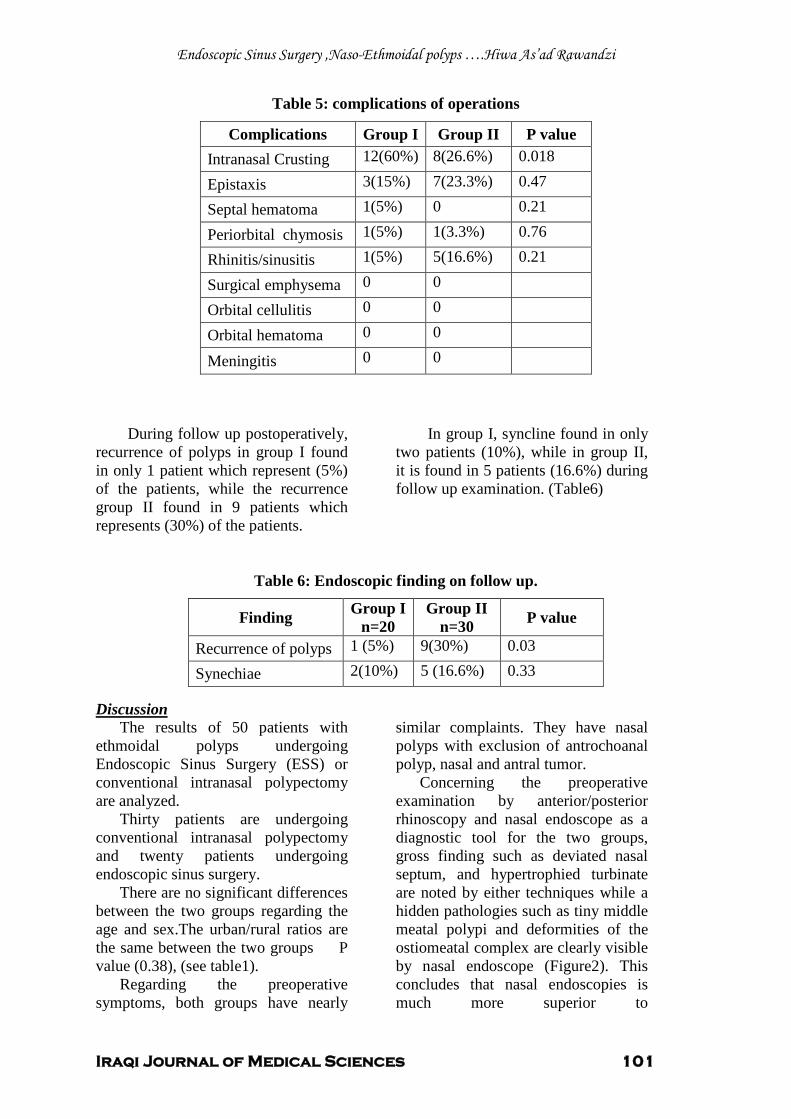
Endoscopic Sinus Surgery ,Naso-Ethmoidal polyps ….Hiwa As’ad Rawandzi
Iraqi Journal of Medical Sciences 101
Table 5: complications of operations
During follow up postoperatively, recurrence of polyps in group I found in only 1 patient which represent (5%) of the patients, while the recurrence group II found in 9 patients which represents (30%) of the patients.
In group I, syncline found in only two patients (10%), while in group II, it is found in 5 patients (16.6%) during follow up examination. (Table6)
Table 6: Endoscopic finding on follow up. Discussion
The results of 50 patients with ethmoidal polyps undergoing Endoscopic Sinus Surgery (ESS) or conventional intranasal polypectomy are analyzed.
Thirty patients are undergoing conventional intranasal polypectomy and twenty patients undergoing endoscopic sinus surgery.
There are no significant differences between the two groups regarding the age and sex.The urban/rural ratios are the same between the two groups P value (0.38), (see table1).
Regarding the preoperative symptoms, both groups have nearly
similar complaints. They have nasal polyps with exclusion of antrochoanal polyp, nasal and antral tumor.
Concerning the preoperative examination by anterior/posterior rhinoscopy and nasal endoscope as a diagnostic tool for the two groups, gross finding such as deviated nasal septum, and hypertrophied turbinate are noted by either techniques while a hidden pathologies such as tiny middle meatal polypi and deformities of the ostiomeatal complex are clearly visible by nasal endoscope (Figure2). This concludes that nasal endoscopies is much more superior to
Complications Group I Group II P value Intranasal Crusting 12(60%) 8(26.6%) 0.018
Epistaxis 3(15%) 7(23.3%) 0.47
Septal hematoma 1(5%) 0 0.21
Periorbital chymosis 1(5%) 1(3.3%) 0.76
Rhinitis/sinusitis 1(5%) 5(16.6%) 0.21
Surgical emphysema 0 0
Orbital cellulitis 0 0
Orbital hematoma 0 0
Meningitis 0 0
Finding Group I n=20
Group II n=30 P value
Recurrence of polyps 1 (5%) 9(30%) 0.03
Synechiae 2(10%) 5 (16.6%) 0.33
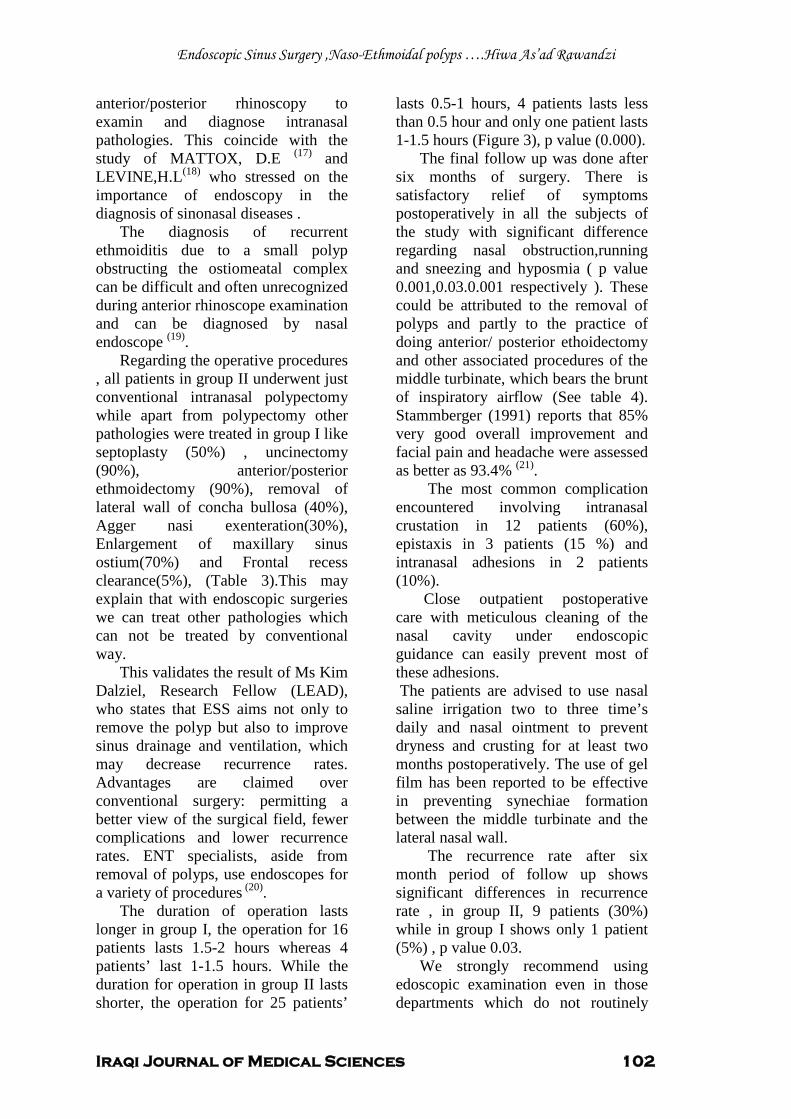
Endoscopic Sinus Surgery ,Naso-Ethmoidal polyps ….Hiwa As’ad Rawandzi
Iraqi Journal of Medical Sciences 102
anterior/posterior rhinoscopy to examin and diagnose intranasal pathologies. This coincide with the study of MATTOX, D.E (17) and LEVINE,H.L(18)
The diagnosis of recurrent ethmoiditis due to a small polyp obstructing the ostiomeatal complex can be difficult and often unrecognized during anterior rhinoscope examination and can be diagnosed by nasal endoscope
who stressed on the importance of endoscopy in the diagnosis of sinonasal diseases .
(19)
Regarding the operative procedures , all patients in group II underwent just conventional intranasal polypectomy while apart from polypectomy other pathologies were treated in group I like septoplasty (50%) , uncinectomy (90%), anterior/posterior ethmoidectomy (90%), removal of lateral wall of concha bullosa (40%), Agger nasi exenteration(30%), Enlargement of maxillary sinus ostium(70%) and Frontal recess clearance(5%), (Table 3).This may explain that with endoscopic surgeries we can treat other pathologies which can not be treated by conventional way.
.
This validates the result of Ms Kim Dalziel, Research Fellow (LEAD), who states that ESS aims not only to remove the polyp but also to improve sinus drainage and ventilation, which may decrease recurrence rates. Advantages are claimed over conventional surgery: permitting a better view of the surgical field, fewer complications and lower recurrence rates. ENT specialists, aside from removal of polyps, use endoscopes for a variety of procedures (20)
The duration of operation lasts longer in group I, the operation for 16 patients lasts 1.5-2 hours whereas 4 patients’ last 1-1.5 hours. While the duration for operation in group II lasts shorter, the operation for 25 patients’
lasts 0.5-1 hours, 4 patients lasts less than 0.5 hour and only one patient lasts 1-1.5 hours (Figure 3), p value (0.000).
.
The final follow up was done after six months of surgery. There is satisfactory relief of symptoms postoperatively in all the subjects of the study with significant difference regarding nasal obstruction,running and sneezing and hyposmia ( p value 0.001,0.03.0.001 respectively ). These could be attributed to the removal of polyps and partly to the practice of doing anterior/ posterior ethoidectomy and other associated procedures of the middle turbinate, which bears the brunt of inspiratory airflow (See table 4). Stammberger (1991) reports that 85% very good overall improvement and facial pain and headache were assessed as better as 93.4% (21)
The most common complication encountered involving intranasal crustation in 12 patients (60%), epistaxis in 3 patients (15 %) and intranasal adhesions in 2 patients (10%).
.
Close outpatient postoperative care with meticulous cleaning of the nasal cavity under endoscopic guidance can easily prevent most of these adhesions. The patients are advised to use nasal saline irrigation two to three time’s daily and nasal ointment to prevent dryness and crusting for at least two months postoperatively. The use of gel film has been reported to be effective in preventing synechiae formation between the middle turbinate and the lateral nasal wall.
The recurrence rate after six month period of follow up shows significant differences in recurrence rate , in group II, 9 patients (30%) while in group I shows only 1 patient (5%) , p value 0.03.
We strongly recommend using edoscopic examination even in those departments which do not routinely
Endoscopic Sinus Surgery ,Naso-Ethmoidal polyps ….Hiwa As’ad Rawandzi
Iraqi Journal of Medical Sciences 103
perform endoscopic sinus surgery, as it often reveals hidden pathologies.
Endoscopic sinus surgery is better than conventional intranasal polypectomy because of other pathologies can be treated like high septal deviation, tiny polyp obstructing the ostiomeatal complex and better ventilation and drainage of nose and paranasal sinuses.
The recurrence rate and complication are less if compared with conventional intranasal polypectomy.
It’s a minimally invasive surgery, has approximate field of vision and illumination and good acsess if compared with conventional intranasal polypoectomy, but it needs well trained and expert surgeon.
References 1. Via Y,and Glassgold J. Functional EndoscopicSinusSurgery.Shtuttgart :Theime.1997. 2. Slack R,and Bates G. AAFP Home Page ,News & Publications , Journals and American Family Physician® .New york:Fox.2003. 3. Roy R. Endoscopic sinus surgery dissection manual .Berlin :Springer.2002. 4. Mackay I,and Lund V. Scott Brown;s otolaryngology .Bath: Butterworth Heinemann.1997. 5. Lane P, Kennedy D. Ballenger’s Manual of Otorhinolaryngology Head and Neck Surgery.New york: Theime.2003. 6. Picado C.Nasal polyposis,clinical and experimentalallergy reviews .Shtuttgart :Theime.2001. 7. Gray R,and Hawthorne M.Synopsis of otolaryngology.Cambridge:Butterworth Heinemann.1992. 8. Drakely A.Nasal polyps,Scotts Browns Otolaryngology.Bath:Butterworth Heineman.1997 9. . Lund V.Diagnosis and treatment of nasal polyps, BMJ 1995; 311:1411-1414. 10. Collins M.,Pang Y.,and Wilson J._Clinical. Otolaryngol. Environmental risk factors and gender in nasal polyposis .Berlin:Springer.2002. 11. Alobid1 A, Ben P.,and BernaW. Nasal polyposis and its impact on quality of life.New Delhi: Jaypee Brothers.2005 12. Colman B.Disease of the nose,throat and ear,and head and neck .London: ELBS with Churchill Livingstone.1992.
13. Blomqvist E,and Änggård A. Allergy and clinical immunology.New Delhi: Jaypee Brothers.2000. 14. Rinia1 A, Kostamo F. Allergy, Nasal polyposis: a cellular-based approach to answering questions. New Delhi: Jaypee Brothers.2007. 15. Lane A,and Kennedy D. Ballenger’s Manual of Otorhinolaryngology Head and Neck Surgery, Sinusitis and polyposis.New york :Theime.2003. 16. Maran A. Logan turners, Diseases of the nose, throat and ear.Bath: Butterworth Heinemann.1992. 17. Mattox, D.E. diagnostic endoscopy of the nose Allergy preceeding.New York: Theime.1988. 18. Levine,H.L.Office diagnosis of nasal and sinus disorders using rigid nasal endoscopey.In:Otolaryngology-Head and neck surgery.Berlin :Springer.2004. 19. Dale H, and Steven D.Shaver,Endoscopic paranasal sinus surgery.New york :Theime.2004. 20. Dalziel M. Health Technology Assessment.New Delhi: Jaypee Brothers. 2003. 21. Mackay I,and Lund V.Scott Browns otolaryngology .Bath: Butterworth Heinemann.1997 .
Iraqi Journal of Medical Sciences 104
Pulmonary Hypertension in Patients with Chronic Renal Failure
Jawad Kadhem Manuti FICMS .
Background: Pulmonary hypertension (PH) comprises a group of clinical and pathophysiological entities with similar features but a variety of underlying causes. Many etiologies causing PH have been reported, and one of the background disease seen with patients with PH is chronic renal failure (CRF).
Abstract
Objective: To evaluate the prevalence of pulmonary hypertension in patient with chronic renal failure in predialysis state and in uremic patients undergoing hemodialysis Patients and methods: One hundred patients had complaining chronic renal failure. 50 patients on conservative treatment and 50 patients on hemodialysis evaluated clinically and by echocardiography for the presence of pulmonary hypertension Results: The prevalence of pulmonary hypertension >35 mmHg was found in 33% of patients with chronic renal failure. the patients
with pulmonary hypertension had significantly lower albumin and arteriovenous fistula and long duration of dialysis Conclusion: This study demonstrated that 42% of patients with chronic renal failure receiving regular hemodialysis have pulmonary hypertension and 24% of patients with chronic renal failure in predialysis have pulmonary hypertension. The presence of pulmonary hypertension was related to the low level of albumin, presence of arteriovenous fistula and long duration of hemodialysis. Keywords: Pulmonary hypertension, hemodialysis, predialysis, echocardiography. IRAQI J MED SCI, 2009; VOL.7 (2):104-108
Pulmonary hypertension is characterized by elevated pulmonary arterial pressure and secondary right ventricular failure. It is life threatening condition with a poor prognosis if untreated. pulmonary hypertension is defined as a mean pulmonary pressure greater than 25 mmHg at rest or 30 mmHg with exercise as measured by right heart catheterization
Introduction
(1)
Pulmonary hypertension (PH) comprises a group of clinical and pathophysiological entities with similar features but a variety of underlying causes. Many etiologies causing PH have been reported, and one of the background disease seen with patients with PH in chronic renal failure (CRF).
.
Dept. medicine, Dialysis unit, college of Medicine Al-Nahrain University, Al-Kadhmiya Teaching Hospital. Adress Correspondence to: Dr. Jawad Kadhem Manuti. E-mail:Received: 22
[email protected] nd February 2009, Accepted:8th
however, the pathogenesis of pulmonary hypertension(PH) in this group of patients is not explained satisfactorily
June 2009.
(2)
Chronic hemodialysis patients are exposed to continuous pulmonary insults of multifactorial origin. there are several explanations for the development of pulmonary arterial pressure (PAP) in CRF. High cardiac output (CO) resulting from the arteriovenous fistula (AVF) may increase pulmonary artery pressure (PAP)
.
(3)
Metabolic and hormonal derangements caused by chronic renal failure may lead to pulmonary arterial vasoconstriction. Moreover, pulmonary calcification in chronic dialysis patients has been associated with pulmonary dysfunction. Besides, fluid overload and anemia may cause PH. Since 1966, arteriovenous fistula (AVF), developed by Brescia and Cimino, has provided the best vascular
.
Pulmonary hypertension in chronic renal failure… Jawad K. Manuti
Iraqi Journal of Medical Sciences 105
access allowing long-term hemodialysis increased PAP was found in chronic renal failure patients with surgically created arteriovenous fistula (4)
Patients with PH may develop right ventricular failure with features of systemic venous congestion, pleural effusion, and ascites. it can also result in reduced systemic arterial pressure and intradialytic hypotension
(5).
The study was performed in AL-Nahrain College of Medicine in AL-Kadhmiya Teaching Hospital during the period of August 2008 to February 2009. One hundred patients (60 male and 40 female) involved in this study of different age group ranging from ( 10 to 70) years (mean of age 37.3 year) complaining chronic renal failure. 50 patients on regular hemodialysis and 50 in predialysis (conservative treatment).
Patients And Methods
Exclusion criteria for this patient includes chronic obstructive lung disease, interstitial lung disease, chest wall disease , primary pulmonary hypertension , previous pulmonary embolism, collagen vascular disease, left to right shunt and moderate or sever mitral or aortic valve disease.
Each patient underwent full clinical evaluation with special emphasis on any clinical condition that predisposes to pulmonary hypertension, chest radiography, and pulmonary function tests (PFTs), standard 12-lead electrocardiography (ECG), and echocardiography before enrollment to the study and repeated after 6 month. Two-dimensional and M-mode, Doppler echocardiography was performed in all patients. In the presence of tricuspid regurgitation, continuous-wave Doppler echocardiography was used to estimate the systolic pulmonary artery pressure(PAP). Systolic right ventricular (or pulmonary artery)
pressure was calculated using the modified Bernoulli equation: PAP = 4 x (tricuspid systolic jet)² + 10 mmHg (estimated right atrial pressure).pulmonary hypertension( PH) was defined as a systolic PAP > 35 mmHg(6)
Patients general data (age, sex, comorbidity, medication used), data regarding the kidney disease (etiology of renal disease, duration of renal failure, duration of hemodialysis therapy) and data pertaining to the arteriovenous fistula (AVF) (duration and location of arteriovenous fistula (AVF) were recorded directly from the patients. Laboratory investigations included blood urea nitrogen, creatinine, serum calcium, phosphorus, hemoglobin, hematocrit and protein
.
Patients were followed for at least 6 months. During follow-up, patients with end-stage renal disease (ESRD) who were maintained on chronic hemodialysis therapy were dialyzed for 3 hour 3 times per week.
Statistical analysis was performed using chi-square test. at level of significance p≤o.o5 regarded as statistically significant.
UResults The echocardiography findings in
patients complaining chronic renal failure are presented in Table 1 and 2.
Pulmonary hypertension (>35mmHg) was found in 12(24%) patients in predialysis (on conservative treatment) and 21(42%) patients under hemodialysis procedure.
Pulmonary artery pressure values are presented as in table 1. Mild pulmonary pressure (35---50mmHg) presented in 22% of the patients. While pulmonary pressure more than 50mmHg was finding in 11% patients.
Data on 33 patients with pulmonary hypertension compared with 67 patients without pulmonary hypertension in table 2. There was no significant difference between both
Pulmonary hypertension in chronic renal failure… Jawad K. Manuti
Iraqi Journal of Medical Sciences 106
groups, with regard to the sex, hemoglobin level and ejection fraction (p.>0.05).
Albumin level, presence of arteriovenous fistula and duration of hemodialysis associated with high significant pulmonary hypertension (p. <0.05).
All patients had normal baseline cardiac output as expressed by ejection fraction.
Pericardial effusion was observed in 17(34%) patients in predialysis on (conservative treatment) and 28(56%) patients receiving hemodialysis.
Table 1:Systolic pulmonary artery pressure(PAP) in chronic renal failure
predialysis hemodialysis percentage Total patients 50 50 PAP ≤35 (mmHg) 38 29 67% PAP—35--50 (mmHg) 9 13 22% PAP-- ≥ 50 (mmHg) 3 8 11%
Table 2:Echocardiography finding in patient with chronic renal failure Abnormal Echocardiography finding
predialysis No.= 50
Hemodialysis No. = 50
Pulmonary artery pressure>35mmhg
11 19
Ejection fraction mean ±SD(%)
57± 6 58 ± 3
Pericardial effusion 34% 56%
Left ventricular pressure overload
74% 86%
Ischemic heart disease 22% 30%
Table 3:Clinical and laboratory data in patient with normal pulmonary arterial
pressure (PAP)group 1 versus patient with high PAP group 2 Variables Group 1 Group 2 P value Patients number 67 33 Male/female 32/25 18/15 Hemoglobin mean ±SD 10 ± 2g/dL 9 ± 2g/dL >0.05 Albumin mean ±SD 4.6 ± 1.3 g/dL 3.3±0.4g/dL <0.05 Ejection fraction ±SD 49% ± 4% 47% ± 11% >0.05 Duration of dialysis 0----2 year 6 month ---2
year <0.05
Presence of AVF 7 26 <0.05 Systolic blood pressure mmHg
135—180 mmHg
120—190 mmHg
>0.05
Diastolic blood pressure mmHg
70—110 mmHg 75—130 mmHg >0.05
Pulmonary hypertension in chronic renal failure… Jawad K. Manuti
Iraqi Journal of Medical Sciences 107
Although there are probably genetic determinants, environmental exposures and acquired disorders that predispose the patients to pulmonary arterial hypertension, it is clear that none of the factors alone is sufficient to activate the pathways essential for the development of this vascular disease. Pulmonary hypertension (PH) involves vasoconstriction and obliteration of the lumen of small vessels in the lungs by plexiform lesions resulting in increased resistance to flow.
Discussion
In this study, the prevalence of pulmonary hypertension as defined by Doppler echocardiography assessment of tricuspid valve was almost 21(42%) in hemodialysis patients and 12(24%) in predialysis.
(7, 8)
The reported prevalence of pulmonary hypertension disease in other study range from 26% to40 %( 9)
We compared the clinical and biochemical variables of the patients with different severity and without pulmonary hypertension in chronic renal failure. The patients with pulmonary hypertension had significantly lower albumin, presence of arteriovenous fistula and more than 6 month duration of dialysis (p. value < 0.05). There was no significant deference between hemodialysis and predialysis groups according to ejection fraction, systolic and diastolic pressure, hemoglobin and hematocrit levels (p. value >0.05).
Arteriovenous fistula(AVF), used for hemodialysis access, causes a large left to-right shunt whose capacity often increases with time, and this shunt causes left ventricular failure by imposing an extra volume load on the left ventricle.
In other study, Yigla et al evaluated the incidence of PH in 58 end stage renal disease (ESRD)
patients using Doppler echocardiography. Almost 40% of patients had systolic PAP above 35 mmHg, and their cardiac output was significantly higher compared with hemodialysis patients without PH. Because the study population had no obvious cause for PH, they assumed that some factors, such as the size or the location of arteriovenous fistulae are involved in the mechanism that increases cardiac output and contribute to the pathogenesis of pulmonary hypertension(PH)(4)
Pulmonary hypertension (PHT) has an insidious nature and results in extremely serious morbidity. Early detection of the disease is necessary before the development of significant pathophysiological changes. Despite the possibility of common mediators for all the mechanisms of pulmonary hypertension, there are clear differences observed in the potential reversibility of pathophysiological responses of the three components of pulmonary artery pressure that include volume of pulmonary blood flow, resistance in the pulmonary vascular bed and pulmonary venous pressure
.
(10)
Pulmonary hypertension has an insidious nature and results in serious morbidity and mortality so that early detection of pulmonary hypertension is necessary before the development of significant pathophysiological changes.
.
1. Lewis J., William H. overview of pulmonary hypertension: 2007 uptodate.
References
2. Havlucu Y. , Kursat S. , Ekmekci C. , Celik P. , Pulmonary hypertension in patient with chronic renal failure :Respiration 2007 ; 74:503-510 3. Okura H. , Takatsu Y.: high output failure as cause of pulmonary hypertension .Inter. Med. 1994; 363-365 4. Yigla M., Nakhoul F, Sabag A, Tov N, Reisner A, pulmonary hypertension in patient with end stage renal disease. Chest 2003; 123: 1577-1582.
Pulmonary hypertension in chronic renal failure… Jawad K. Manuti
Iraqi Journal of Medical Sciences 108
5. Tarrass F, Benjelloun M, Hachim K, Benghanem M, B Ramdani B,Pulmonary hypertension in patients with end-stage renal disease. Indian J Nephrol 2005;15: 223-226 6. Robyn H, Barst R, Mcgoon M, Torbicki A, Sitbon O, Krowka M. Diagnosis and differential assessment of pulmonary arterial hypertension. Journal of the American College of Cardiology7. Soroush-Yari A, Burstein S, Hoo GW, Santi ago SM: Pulmonary hypertension in men with thyrotoxicosis. Respiration 2005; 72:90-94
,2004; 43(12): 40-47
8. Kolilekas L, Gallis P, Liasis N, Anagnostopoulos GK, Eleftheriadis I: Unusual case of pulmonary hypertension. Respiration 2006; 73: 117-119. 9. Abolghasemi R, Sang-sefidi J, Miri R, Soluk M: Pulmonary Hypertension in Hemodialysis patients; Iranian Journal of Kidney Disease, Vol 1, supp.1 2007: 9 10. Galie N, Manes A, Branzi A: Evalution of pulmonary arterial hypertension. curr opin cardiol. 2004;19(6):575-581
Iraqi Journal of Medical Sciences 109
Morphometric study on the Ag-NOR changes in skeletal muscle resident cells with aging
May Fadhil Majid Al-Habib PhD, Huda Rashid Kareem MSc .
Background: Aging is the deterioration of mature organism resulting from time dependent irreversible changes. The effects of aging on skeletal muscle cells have not been much-elucidated using Ag-NOR analysis.
Abstract
Objectives: This study aims to demonstrate the effects of aging on Ag-NOR in morphometric & counting aspects. Materials and methods: The Extensor digitorum longus muscle of forty Albino male rats with age ranging from 27 days up 18 month were studied. Paraffin blocks were performed & sectioned. Ag –Nor stained sections were de-waxed, rehydrted, developer solution was used. Morphometric Analysis of the Ag-NOR stained nuclei through using a soft wear GLI (Global lab image 2) with a microscope connected to PC Unit, a software used to analyze the picture that seen through the microscope, nuclear area, nuclear perimeter, and roundness were calculated,&
counting of the number of Ag-NOR stained nucleoli per stained cells. Results: In neonate age group, the nuclei have high affinity to the stain. High proportion of nuclei can be recognized, with the higher count of Ag-NORs per cells. • In adult age groups the affinity to the stain is reduced, the nucleus appears to have smaller count of Ag-NORs per cells. • In old age group the staining intensity seem to be highly reduced, the nucleus seem to have single, rounded Ag-NOR. Conclusion: A significance differences is seen in Ag NORs
Key words: Skeletal muscle, Ag NOR. Morphometry.
in cells of skeletal muscle fibers with aging demonstrated by counting and morphometric method of Ag-NOR analysis.
IRAQI J MED SCI, 2009; VOL.7 (2):109-115
UIntroduction
Aging is defined as the deterioration of mature organism resulting from time dependent irreversible changes in all members of species, such that with the passage of time they became increasingly unable to cope with the stress of the environment, and their increasing the probability of death P
(1)P. Recent theory
of aging based on telomere uncapping at senescence P
(2). Two aspects of muscle cell phenotype may be affected by aging:
1. The proliferative capacity. 2. The ability to differentiate P
(3)P.
Dept. Human Anatomy, Section of Histology and Embryology, college of Medicine Al-Nahrain University. Adress Correspondence to: Dr. May Fadhil Majid Al Habib Kadhmiya, Baghdad – Iraq P.O.Box 14222 E-mail: [email protected] U Received: 18 P
thP December 2008, Accepted: 3 P
rdP
June 2009.
Nucleolar organizer regions (NORs) are loops of DNA, which contain ribosomal RNA genes. They are transcripted by RNA polymerase I, and are of vital importance for ultimate synthesis of protein. Ag-NORs are acidic proteins associated to the NORs, which are selectively stained by silver colloid technique P
(4)P.
Ag-NORs are related to the proliferative capacity, reflecting essentially cell cycle speed. The increase in their number would signify a shorter time of cell cycle P
(5)P.
The number of NOR at any given stage of cell cycle appears to be inversely proportional to the cell cycle time, thus the higher the amount of NOR, the shorter the cycle time P
(6)P, and the faster
the rapidity of cell proliferation as recognized by (Brugal in 1994) P
(7)P.
However, the effects of aging on skeletal muscles have not been much-elucidated morphometricly. This study
Morphometric Ag-NOR changes in skeletal muscle with aging…May F. Al-Habib etal
Iraqi Journal of Medical Sciences 110
aims to demonstrate the effects of aging on Ag-NOR in morphometric aspects.
UMaterials and methods Animal housing and sampling:
A sample of forty Albino rats (Rattus norvegicus) of male rats was selected for this study, their age ranging from (27-day) up to (18- month).
They were divided into three age groups: A. 1P
stP age group (Neonate: 1P
stP month of
life). B. P
2ndP age group (Adult animals: 6-12
month old). C. 3rd age group (Old animals: More than 12-month old). Sacrificed animal were killed with chloroform .Extensor digitorum longus muscle was selected for the study, it was taken out by cutting it from it's both ends, and divided transversely into two halves and put into a fixative P
(8)P.
General histological preparation of paraffin blocks:
Fixation done by using fisher fixative for 12 hours sections then Paraffin blocks were prepared P
(9)P &
sectioned at (5-6µM) thickness using Richert –Jung 3030 –mot Biocut microtome.
Ag –Nor (Argyrophilic nucleolar organizer region):
Sections were stained with Ag-Nor according to Ploton et.al P
(10)P.
Morphometric Analysis of the Ag-NOR stained nuclei:
Through using a soft wear GLI (Global lab image 2) in which a microscope is connected to PC Unit, and a software is used that analyze the picture that is seen through the microscope ,and captured to be stored in the digital memory. Displayed by the monitor, and analyzed by the
software options. The nuclear area, nuclear perimeter, and roundness were calculated through encircling the nucleus that are stained with Ag-NOR by the marker through using the mouse of the computer, and set the software options, the results were expressed in an excel work sheet. Morphometric analysis of the Ag-NOR stained area had been studied by Lorand- & Carvalho 1998 P
(11)P and was considered
a valuable index for the nuclear activity yet, perimeter and roundness coefficient were used for the first time in this study.
Counting of Ag-NOR stained nucleoli: Considering the enumeration of each silver stained dot per cell directly at the microscope focusing through the section thickness at very high magnification (100X) according to the recommendation of Crocker et., al 1989 P
(12)P.
UResults
All examined sections stained with silver nitrate Ag-NOR stain in this study show adequate staining, but variation in the staining intensity among the different age groups was noticed. In neonate age group, the nuclei have high affinity to the stain ,they stained darkly brown, and the muscle fibers stained light brown, high proportion of nuclei can be recognized per section (Figure 1) the nucleus itself seem to have multiple Ag-NOR stained nucleoli that are small sized, rounded ,solitary, darkly stained structures, can be seen through focusing at the site of the nucleus at a high magnification (Figure4, Table 2) the morphometric analysis of the mean nuclear area show the largest value in neonate, the mean nuclear perimeter also is very high, and the nuclei are nearly rounded in shape since mean roundness value is high (as the value of
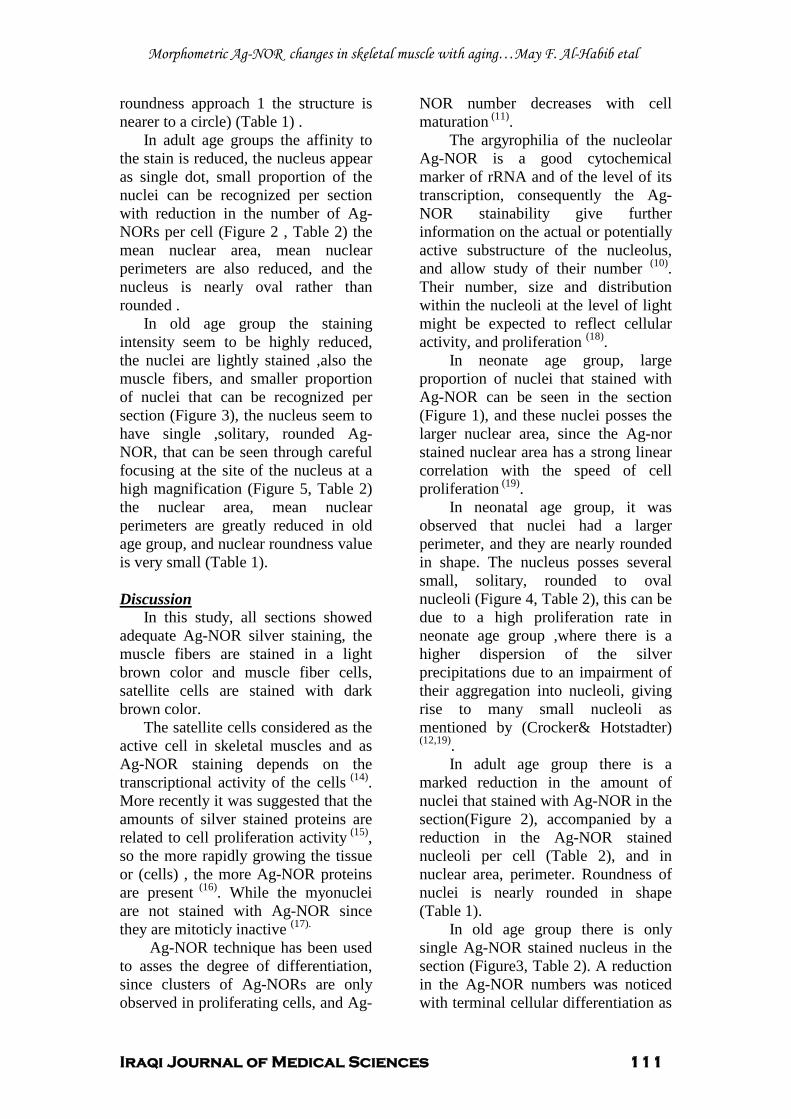
Morphometric Ag-NOR changes in skeletal muscle with aging…May F. Al-Habib etal
Iraqi Journal of Medical Sciences 111
roundness approach 1 the structure is nearer to a circle) (Table 1) .
In adult age groups the affinity to the stain is reduced, the nucleus appear as single dot, small proportion of the nuclei can be recognized per section with reduction in the number of Ag-NORs per cell (Figure 2 , Table 2) the mean nuclear area, mean nuclear perimeters are also reduced, and the nucleus is nearly oval rather than rounded .
In old age group the staining intensity seem to be highly reduced, the nuclei are lightly stained ,also the muscle fibers, and smaller proportion of nuclei that can be recognized per section (Figure 3), the nucleus seem to have single ,solitary, rounded Ag-NOR, that can be seen through careful focusing at the site of the nucleus at a high magnification (Figure 5, Table 2) the nuclear area, mean nuclear perimeters are greatly reduced in old age group, and nuclear roundness value is very small (Table 1).
UDiscussion
In this study, all sections showed adequate Ag-NOR silver staining, the muscle fibers are stained in a light brown color and muscle fiber cells, satellite cells are stained with dark brown color.
The satellite cells considered as the active cell in skeletal muscles and as Ag-NOR staining depends on the transcriptional activity of the cells P
(14)P.
More recently it was suggested that the amounts of silver stained proteins are related to cell proliferation activityP
(15)P,
so the more rapidly growing the tissue or (cells) , the more Ag-NOR proteins are present P
(16)P. While the myonuclei
are not stained with Ag-NOR since they are mitoticly inactive P
(17).P
Ag-NOR technique has been used to asses the degree of differentiation, since clusters of Ag-NORs are only observed in proliferating cells, and Ag-
NOR number decreases with cell maturationP
(11)P.
The argyrophilia of the nucleolar Ag-NOR is a good cytochemical marker of rRNA and of the level of its transcription, consequently the Ag-NOR stainability give further information on the actual or potentially active substructure of the nucleolus, and allow study of their number P
(10)P.
Their number, size and distribution within the nucleoli at the level of light might be expected to reflect cellular activity, and proliferation P
(18)P.
In neonate age group, large proportion of nuclei that stained with Ag-NOR can be seen in the section (Figure 1), and these nuclei posses the larger nuclear area, since the Ag-nor stained nuclear area has a strong linear correlation with the speed of cell proliferationP
(19)P.
In neonatal age group, it was observed that nuclei had a larger perimeter, and they are nearly rounded in shape. The nucleus posses several small, solitary, rounded to oval nucleoli (Figure 4, Table 2), this can be due to a high proliferation rate in neonate age group ,where there is a higher dispersion of the silver precipitations due to an impairment of their aggregation into nucleoli, giving rise to many small nucleoli as mentioned by (Crocker& Hotstadter)P
(12,19)P. In adult age group there is a
marked reduction in the amount of nuclei that stained with Ag-NOR in the section(Figure 2), accompanied by a reduction in the Ag-NOR stained nucleoli per cell (Table 2), and in nuclear area, perimeter. Roundness of nuclei is nearly rounded in shape (Table 1).
In old age group there is only single Ag-NOR stained nucleus in the section (Figure3, Table 2). A reduction in the Ag-NOR numbers was noticed with terminal cellular differentiation as
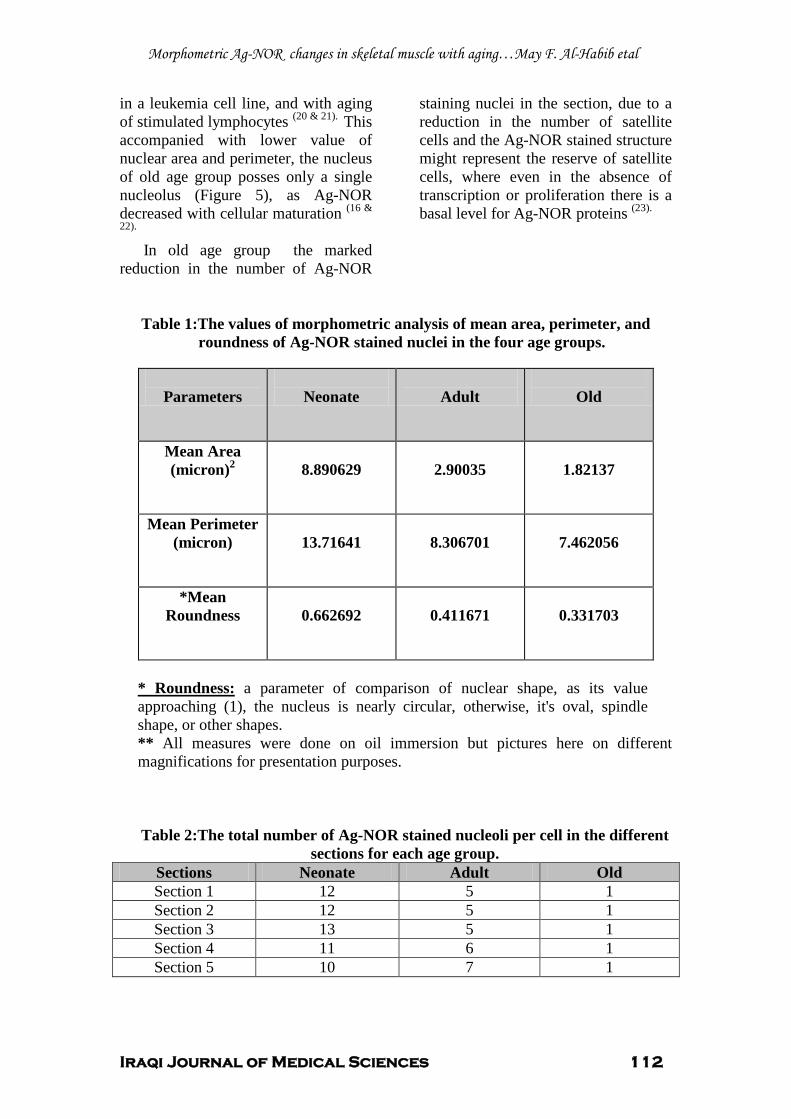
Morphometric Ag-NOR changes in skeletal muscle with aging…May F. Al-Habib etal
Iraqi Journal of Medical Sciences 112
in a leukemia cell line, and with aging of stimulated lymphocytes P
(20 & 21). PThis
accompanied with lower value of nuclear area and perimeter, the nucleus of old age group posses only a single nucleolus (Figure 5), as Ag-NOR decreased with cellular maturation P
(16 &
22). In old age group the marked
reduction in the number of Ag-NOR
staining nuclei in the section, due to a reduction in the number of satellite cells and the Ag-NOR stained structure might represent the reserve of satellite cells, where even in the absence of transcription or proliferation there is a basal level for Ag-NOR proteins P
(23).
Table 1:The values of morphometric analysis of mean area, perimeter, and roundness of Ag-NOR stained nuclei in the four age groups.
U* Roundness:U a parameter of comparison of nuclear shape, as its value approaching (1), the nucleus is nearly circular, otherwise, it's oval, spindle shape, or other shapes. ** All measures were done on oil immersion but pictures here on different magnifications for presentation purposes.
Table 2:The total number of Ag-NOR stained nucleoli per cell in the different sections for each age group.
Sections Neonate Adult Old Section 1 12 5 1 Section 2 12 5 1 Section 3 13 5 1 Section 4 11 6 1 Section 5 10 7 1
Parameters
Neonate
Adult
Old
Mean Area (micron)P
2
8.890629
2.90035
1.82137
Mean Perimeter (micron)
13.71641
8.306701
7.462056
*Mean Roundness
0.662692
0.411671
0.331703
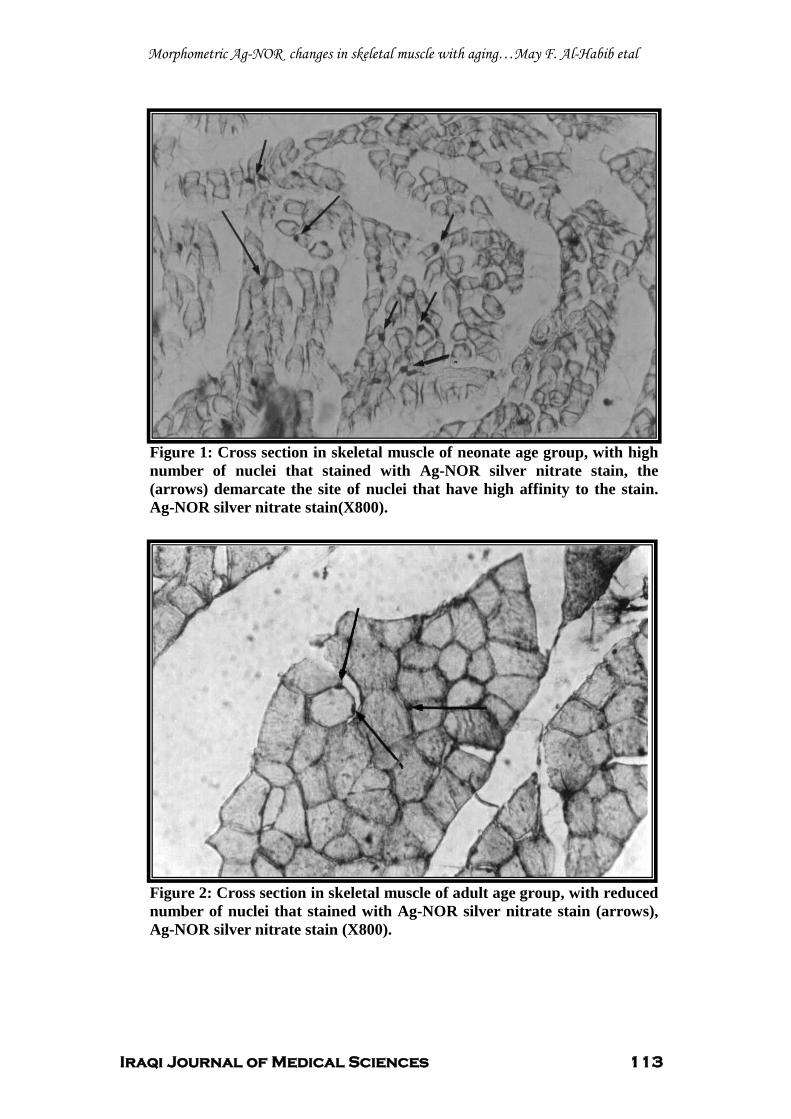
Morphometric Ag-NOR changes in skeletal muscle with aging…May F. Al-Habib etal
Iraqi Journal of Medical Sciences 113
Figure 1: Cross section in skeletal muscle of neonate age group, with high number of nuclei that stained with Ag-NOR silver nitrate stain, the (arrows) demarcate the site of nuclei that have high affinity to the stain. Ag-NOR silver nitrate stain(X800).
Figure 2: Cross section in skeletal muscle of adult age group, with reduced number of nuclei that stained with Ag-NOR silver nitrate stain (arrows), Ag-NOR silver nitrate stain (X800).
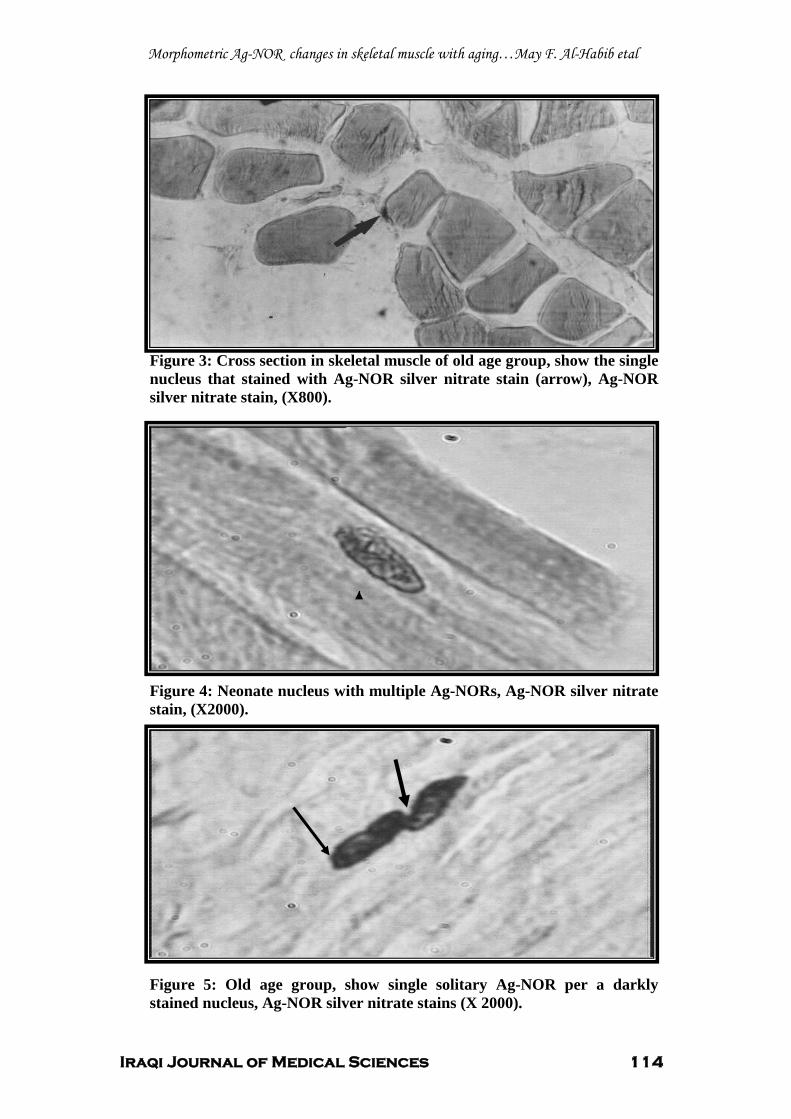
Morphometric Ag-NOR changes in skeletal muscle with aging…May F. Al-Habib etal
Iraqi Journal of Medical Sciences 114
Figure 3: Cross section in skeletal muscle of old age group, show the single nucleus that stained with Ag-NOR silver nitrate stain (arrow), Ag-NOR silver nitrate stain, (X800).
Figure 4: Neonate nucleus with multiple Ag-NORs, Ag-NOR silver nitrate stain, (X2000).
Figure 5: Old age group, show single solitary Ag-NOR per a darkly stained nucleus, Ag-NOR silver nitrate stains (X 2000).
Morphometric Ag-NOR changes in skeletal muscle with aging…May F. Al-Habib etal
Iraqi Journal of Medical Sciences 115
UReferences 1. Jarret A. The physiology and pathophysiology of the skin. Vol I, the epidermis. London: By academic press incorporation. 1974. 2. Porath N, Ben Ittai, Weinberg, Robert .A. When cells get stressed: an integrative view of cellular senescence. The clinical investigation J. 2004 Jan; 113 (1): 8-13. 3. Peterson CA. Cell culture systems as a tool for studying age related changes in skeletal muscles. Gerontol-A-Biol-Sci-Med-Sci J. 1995Nov; 50: 142-144. 4. Tere D. Ag-NOR staining & quantification. Micron J. 2000; 31: 127-131. 5. Caulet-Maugendre S, Patey M, Granier E. Quantitative analysis of cellular proliferative activity in 35 T-cell Nonhogkin's Lymphoma. .Analytical and quantitative cytology and histology J. 1996 Oct. 18(5): 338. 6. Suresh UR, Chawner L, Buckely CH, Fox H. Do Ag-NOR count reflect cellular ploidy or cellular proliferation. A study of trophoplastic tissue. Pathol J. 1990; 160:213-215. 7. Brugal G. Interpretation of proliferation markers. Inc:compendium on the computerized cytology and histology laboratory. Chicago, tutorial of cytology 1994:234-240. 8. Hebbel R, Thromberg MW. Anatomy & embryology of laboratory rat. Germanny: ed/ verlag. 1986; 2nd. 9. Bancroft JD, Stevens A. Theory & practice of Histological techniques. Edinburgh: Churchilliving stone, 2 P
ndP edition 1989.
10. Ploton D, Menager M, Jeannesson P. Improvement in the staining and in the visualization of the Argyrophilic proteins of the nucleolar organizer region at the optical level. Histochemical J 1986; 18: 5-14. 11. Lorand Metz, Carvalho M.A, Metz C. Relation ship between morphometric analysis of nucleolar organizer regions and cell proliferation in acute leukemias. Cytometry J.1998(35):51-56. 12. Crocker J, Boldy DAR, Egan M J. How should we count Ag-NORs? Proposal for a standardized approach. pathol J1989 (158): 185-188. 13. Moreno F J, Rodrigo R M, Garcia- Herdugo G. Ag-NOR protein and rDNA transcriptional activity in plant cells. Histochem& Cytochem J. 1990; 381:879-1887. 14. Sirri V, Roussel P, Hernandez- Verdun D. The Ag-NOR proteins. A quantitative and qualitative changes during the cell cycle. Micron J 2000; 31: 121-126. 15. Derenzini M, Tere D. Standardization of inter phase Ag-NOR measurement by mean of
an automated image analyzer system using lymphocyte as internal control. Pathol J. 1991; 165: 337-342. 16. Allbrook D, Han M, Hellmuth, A. Population of muscle satellite cells in relation to age and mitotic activity. Pathology J.1971; 3: 233-243. 17. Egan, MJ, Crocker J. Evaluation of nucleolar organizer regions in pulmonary pathology. Thorax J.1990; 45: 225-232. 18. Derenzini M, Thiry M, Goessens G . Ultrastructural cytochemistry of the mammalian cell nucleolus. Histoch-cytochem J.1990; 38 (9): 1237-1256. 19. Hotstadter F, Knüchel I, Rüschoff J: Cell proliferation assessment in oncology. Virchows Arch .1995; 427: 323-341. 20. Reeves BR, Casey G, and Honeycomb JR. Correlation of differentiation state of silver staining nucleolar organizer regions in promeylocytic leukemia cell line HL-60. .Cancer cytogenesis .1984;13:159-166. 21. Das BC, Rani R, Mita AB, Luthra UK. The number of silver staining NORs (rRNA) in lymphocytes of newborns and its relation ship to human development. Mech- Ageing-Devel .1986; 130:117-123. 22. O'fner D, Hittman A, March C. Relationship between quantities of silver stained Ag NORs and population doubling time in ten breast cancer cell lines. Pathol- Res- Pract .1992; 188: 742- 746. 23. Roussel P, Hernandez-Verdune D. Identification of Ag-NOR protein, markers of proliferation related to ribosome gene activity. Exp. cell. Res. 1994; 214:465-472.
Iraqi Journal of Medical Sciences 116
Trace Elements Homeostasis in Preeclampsia
Faisal Gh. Al-Rubaye MBChB; MSc ; PhD.
UAbstract Background: Preeclampsia is a form of high blood pressure with proteinuria manifested during pregnancy, it is a common major complication causing significant morbidity and mortality; however, its etiology is unknown. Moreover, data on mineral and trace elements homeostasis and on cation pattern during pregnancy are conflicting. Also, the status of ionized calcium and magnesium during pregnancy and its complication, preeclampsia, has not been described adequately. Objective: to demonstrate the pattern of minerals and trace elements during preeclampsia with respect to normal pregnancy. Subject and methods: the present study is a cross-sectional case-control study included measurement of minerals (calcium and magnesium) in 60 patients with preeclampsia. They were classified into two groups according to the gestational age: o Preeclamptics in the second trimester G1: (n=30). o Preeclamptics in the third trimester G2: (n=30,). The results are compared with 60 apparently healthy pregnant controls. They were classified according to the gestational age into two groups:
o Pregnants in the second trimester G3: (n=30). o Pregnants in the third trimester G4: (n=30). Results: show that serum corrected calcium, serum magnesium and serum zinc were significantly reduced accompanied by significant high serum copper in pre-eclamptics when compared with that of normal pregnants. Conclusion : preeclamptics (in different gestational age groups) altered mineral and trace element status when compared with healthy pregnants matched with their age and gestational age.
All preeclamptics had certain factors that reduce vasodilation, enhance vasospasm and trigger oxidative stress supported by the finding of low level of ionized magnesium (which is essential for maintenance of vascular tone), low ionized calcium level (which is essential for the synthesis of endothelial-derived NO), high copper level (which generates highly reactive oxygen species) and low zinc level (which is essential for antioxidant function). Key words: preeclampsia, calcium, magnesium, zinc, copper. IRAQI J MED SCI, 2009; VOL.7 (2):116-123
UIntroduction
Preeclampsia (PE) is defined as the onset of hypertension and the presence of proteinuria during pregnancy, usually occurring after the 20th week of gestation in a previously normotensive woman and resolving completely by the sixth week after delivery of fetus P
(1,2)P.
Dept. Chemistry & Biochemistry, College of Medicine, Al-Nahrain University. Adress Correspondence to: Dr. Faisal Gh. Al-Rubaye. E- mail: [email protected] Mobile: 07702640792 Received: 18 P
thP January 2009, Accepted: 3 P
rdP
June 2009.
The pathophysiology of preeclampsia is thought to represent a defective response to the physiologic demands of normal pregnancyP
(2,3)P.
Normal pregnancy is associated with profound changes in maternal homeostasis P
(4)P. The endpoint of these
changes is to provide the fetus with the necessary environment for growth and the mother with adequate protection against pregnancy complication P
(4)P.
During normal pregnancy, maternal plasma total calcium concentrations fall, primarily because of the decrease in serum albumin to which the mineral is
Trace Elements Homeostasis in Preeclampsia….Faisal Gh. Al-Rubaye
Iraqi Journal of Medical Sciences 117
predominantly bound in the circulation and it seems likely that there is a relatively little change in unbound ionized calcium. However, there is a substantial fetal need for calcium P
(5)P. It is
now clear that the dynamics of calcium homoeostasis are in fact substantially altered in pregnancyP
(5)P. Pregnancy-
induced hypomagnesemia has been reported previouslyP
(6)P. However; the
status of ionized magnesium during pregnancy and its relation to other important cations such as ionized calcium have not been described adequately P
(6)P. It is the “free” or ionized
magnesium that exerts biological activityP
(6)P.
It was suggested that a deficiency in magnesium contributed to the development of vasoconstriction in preeclampsiaP
(7)P. Also, deficiencies in
calcium intake have been linked to preeclampsia/eclampsia, and hypocalciuria and deviations in both 1,25-(OH)R2RDR3R and PTH have been shown in women with preeclampsiaP
(8)P.
In addition, endothelium-derived relaxing factor (EDRF) is rapidly inactivated by free radicals. Therefore the hypothetical decrease in EDRF release in preeclampsia might be caused by the increase in oxygen free radical. Because of their biological role as catalyst for endogenous antioxidant enzymes, trace elements have been assessed in many researches to find whether they contribute to the etiology of preeclampsia or not.P
(9)P.
USubjects & Methods A-Subjects
The study was a cross-sectional, case-control study conducted on sixty patients with preeclampsia (PE) attending the Obstetric Consultant-Clinic, Antenatal Clinic, and Labor
Ward at Al-Kadhimiya Teaching Hospital, for re-evaluation of newly diagnosed PE, or for delivery.
The diagnosis of PE was based on clinical criteria that were hypertension (absolute BP of 140/90 mmHg twice over 4 hrs without prior comparison)P
(1,2)P
and proteinuria (21.5 mg of urinary protein per mmol creatinine)P
(8) P.
The exclusion criteria, which were used for cases and controls, were gestational or chronic hypertension, diabetes mellitus, renal disease, multifetal gestation, intrauterine fetal death, and pregnancy less than 20 weeks of gestation.
Depending on the gestational age, the patients were divided into two groups: 1.Preeclamptics in the second trimester (G1):
Included thirty Preeclamptics in their second trimester of pregnancy. Age range was from 18 to 37 years. The gestational age range was from 20 to 28 weeks. 2.Preeclamptics in the third trimester (G2):
Included thirty preeclamptics in their third trimester of pregnancy. Age range was from 18 to 40 year. Gestational age range was from 29 to 40 weeks. UControls:
Sixty apparently healthy pregnants attending the Antenatal clinic, and Labor Ward at Al-Kadhimiya Teaching Hospital, for re-evaluation of their pregnancy, or for delivery. The control groups were comparable preeclamptic groups regarding the age, gestational age, Depending on the gestational age, the apparently healthy pregnants were divided into two groups: 3. Control pregnants in the second trimester (G3):
Trace Elements Homeostasis in Preeclampsia….Faisal Gh. Al-Rubaye
Iraqi Journal of Medical Sciences 118
They were thirty apparently healthy pregnants in the second trimester of pregnancy. Age range was from 15 to 38 years. Gestational age range was from 20 to 28 weeks. 4. Control pregnants during the third trimester (G4):
They were thirty pregnants in the third trimester of pregnancy. Age range was from 18 to 35 year. Gestational age range was from 29 to 40 weeks. B. Blood & urine samples:
Ten milliliters of random venous blood were withdrawn from each patient and control, in supine position, without application of tourniquet. Samples then were transferred into clean new plane tube, left at room temperature for 15 minutes for clotting, centrifuged, and the separated serum was transferred into Eppendrof tube, which was used for measuring minerals and trace elements (Ca, Mg, Cu, and Zn). The tubes were stored at –20 P
oP C until analysis, which
was done within one month after collectionP
(10,11)P.
Random urine specimens were obtained from each subject in the study to quantify urinary calcium, magnesium, zinc, copper that were expressed as a ratio to urinary P
Pcreatinine. As a
preservative, 1-2 mls of 6M HCl was added to each random urine specimen; the samples were stored in appropriate containers at -20ºC until analysis P
(10,11)P.
C-Methods
The assay for calcium and magnesium estimation was carried out using atomic absorption spectrophotometer (Buck Scientific 210 JVP)P
(10, 11)P.
Corrected serum calcium was calculated according to the formulaP
Pused
by Gowenlock-AHP
(12)P:
Instead of obtaining a crude correction for measured calcium, the same data was used to calculate the ionized calcium( Cai) according to the formula used by Gowenlock-AH P
(12)P:
The concentration of magnesium ion in serum was calculated from measurement of concentrations of total serum protein and total serum magnesium according to the equation used by Willis-MJ and Sunderman-FW P
(13)P.
UResults
It was found that the serum corrected and ionized calcium concentrations were low in the preeclamptic women in third trimester G2 group as compared to healthy controls in the third trimester G4 [P< 0.001 for both parameters] and even when compared to the preeclamptics in the second trimester G1 [P< 0.001 for both parameters] as it can be seen in Table 1. The same significant reduction in corrected but not ionized calcium was noticed in the second trimester group G1 when compared to the healthy pregnants in the second trimester group G3 [P< 0.001 for corrected calcium but greater than 0.05 for ionized calcium] as it can be seen in Table 1. There was no significant difference in corrected and ionized serum calcium values between healthy pregnants in each group [P > 0.05 for both parameters].
Although the urinary excretion of calcium (expressed as urinary calcium per creatinine) was significantly reduced in preeclamptics in both groups G1 [P< 0.01] and G2 [P< 0.05] in comparison with pregnant controls of the same gestational period G3 and G4, the level of urinary calcium excretion was not significantly different from that of preeclamptics in the second and third
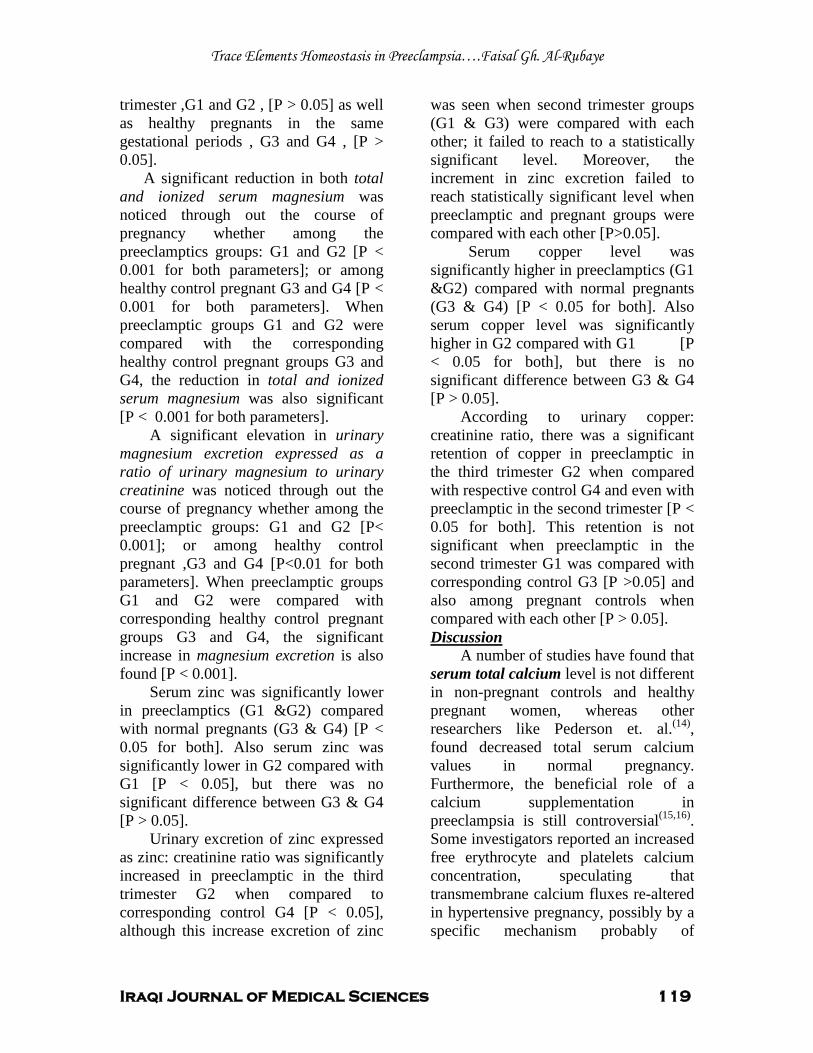
Trace Elements Homeostasis in Preeclampsia….Faisal Gh. Al-Rubaye
Iraqi Journal of Medical Sciences 119
trimester ,G1 and G2 , [P > 0.05] as well as healthy pregnants in the same gestational periods , G3 and G4 , [P > 0.05].
A significant reduction in both total and ionized serum magnesium was noticed through out the course of pregnancy whether among the preeclamptics groups: G1 and G2 [P < 0.001 for both parameters]; or among healthy control pregnant G3 and G4 [P < 0.001 for both parameters]. When preeclamptic groups G1 and G2 were compared with the corresponding healthy control pregnant groups G3 and G4, the reduction in total and ionized serum magnesium was also significant [P < 0.001 for both parameters].
A significant elevation in urinary magnesium excretion expressed as a ratio of urinary magnesium to urinary creatinine was noticed through out the course of pregnancy whether among the preeclamptic groups: G1 and G2 [P< 0.001]; or among healthy control pregnant ,G3 and G4 [P<0.01 for both parameters]. When preeclamptic groups G1 and G2 were compared with corresponding healthy control pregnant groups G3 and G4, the significant increase in magnesium excretion is also found [P < 0.001].
Serum zinc was significantly lower in preeclamptics (G1 &G2) compared with normal pregnants (G3 & G4) [P < 0.05 for both]. Also serum zinc was significantly lower in G2 compared with G1 [P < 0.05], but there was no significant difference between G3 & G4 [P > 0.05].
Urinary excretion of zinc expressed as zinc: creatinine ratio was significantly increased in preeclamptic in the third trimester G2 when compared to corresponding control G4 [P < 0.05], although this increase excretion of zinc
was seen when second trimester groups (G1 & G3) were compared with each other; it failed to reach to a statistically significant level. Moreover, the increment in zinc excretion failed to reach statistically significant level when preeclamptic and pregnant groups were compared with each other [P>0.05].
Serum copper level was significantly higher in preeclamptics (G1 &G2) compared with normal pregnants (G3 & G4) [P < 0.05 for both]. Also serum copper level was significantly higher in G2 compared with G1 [P < 0.05 for both], but there is no significant difference between G3 & G4 [P > 0.05].
According to urinary copper: creatinine ratio, there was a significant retention of copper in preeclamptic in the third trimester G2 when compared with respective control G4 and even with preeclamptic in the second trimester [P < 0.05 for both]. This retention is not significant when preeclamptic in the second trimester G1 was compared with corresponding control G3 [P >0.05] and also among pregnant controls when compared with each other [P > 0.05]. UDiscussion
A number of studies have found that serum total calcium level is not different in non-pregnant controls and healthy pregnant women, whereas other researchers like Pederson et. al. P
(14)P,
found decreased total serum calcium values in normal pregnancy. Furthermore, the beneficial role of a calcium supplementation in preeclampsia is still controversial P
(15,16)P.
Some investigators reported an increased free erythrocyte and platelets calcium concentration, speculating that transmembrane calcium fluxes re-altered in hypertensive pregnancy, possibly by a specific mechanism probably of
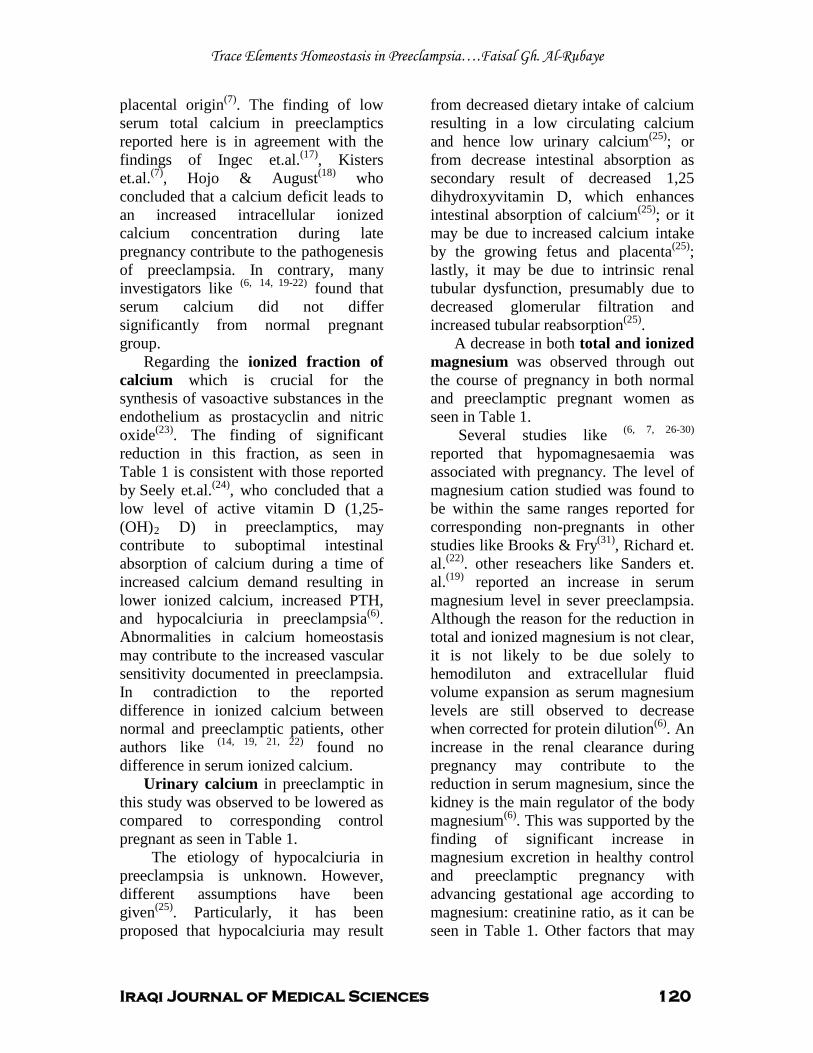
Trace Elements Homeostasis in Preeclampsia….Faisal Gh. Al-Rubaye
Iraqi Journal of Medical Sciences 120
placental originP
(7)P. The finding of low
serum total calcium in preeclamptics reported here is in agreement with the findings of Ingec et.al.P
(17)P, Kisters
et.al. P
(7)P, Hojo & August P
(18)P who
concluded that a calcium deficit leads to an increased intracellular ionized calcium concentration during late pregnancy contribute to the pathogenesis of preeclampsia. In contrary, many investigators like P
(6,P P
14, 19-22)P found that
serum calcium did not differ significantly from normal pregnant group.
Regarding the ionized fraction of calcium which is crucial for the synthesis of vasoactive substances in the endothelium as prostacyclin and nitric oxideP
(23)P. The finding of significant
reduction in this fraction, as seen in Table 1 is consistent with those reported byP
PSeely et.al.P
(24)P, who concluded that a
low level of active vitamin D (1,25-(OH)R2R D) in preeclamptics, may contribute to suboptimal intestinal absorption of calcium during a time of increased calcium demand resulting in lower ionized calcium, increased PTH, and hypocalciuria in preeclampsiaP
(6)P.
Abnormalities in calcium homeostasis may contribute to the increased vascular sensitivity documented in preeclampsia. In contradiction to the reported difference in ionized calcium between normal and preeclamptic patients, other authors like P
(14, 19, 21, 22)P found no
difference in serum ionized calcium. Urinary calcium in preeclamptic in
this study was observed to be lowered as compared to corresponding control pregnant as seen in Table 1.
The etiology of hypocalciuria in preeclampsia is unknown. However, different assumptions have been given P
(25)P. Particularly, it has been
proposed that hypocalciuria may result
from decreased dietary intake of calcium resulting in a low circulating calcium and hence low urinary calcium P
(25)P; or
from decrease intestinal absorption as secondary result of decreased 1,25 dihydroxyvitamin D, which enhances intestinal absorption of calcium P
(25)P; or it
may be due toP
Pincreased calcium intake
by the growing fetus and placentaP
(25)P;
lastly, it may be due to intrinsic renal tubular dysfunction, presumably due to decreased glomerular filtration and increased tubular reabsorption P
(25)P.
A decrease in both total and ionized magnesium was observed through out the course of pregnancy in both normal and preeclamptic pregnant women as seen in Table 1.
Several studies like P
(6, 7, 26-30)P
reported that hypomagnesaemia was associated with pregnancy. The level of magnesium cation studied was found to be within the same ranges reported for corresponding non-pregnants in other studies like Brooks & FryP
(31)P, Richard et.
al. P
(22)P. other reseachers like Sanders et.
al.P
(19)P reported an increase in serum
magnesium level in sever preeclampsia. Although the reason for the reduction in total and ionized magnesium is not clear, it is not likely to be due solely to hemodiluton and extracellular fluid volume expansion as serum magnesium levels are still observed to decrease when corrected for protein dilution P
(6)P. An
increase in the renal clearance during pregnancy may contribute to the reduction in serum magnesium, since the kidney is the main regulator of the body magnesium P
(6)P. This was supported by the
finding of significant increase in magnesium excretion in healthy control and preeclamptic pregnancy with advancing gestational age according to magnesium: creatinine ratio, as it can be seen in Table 1. Other factors that may
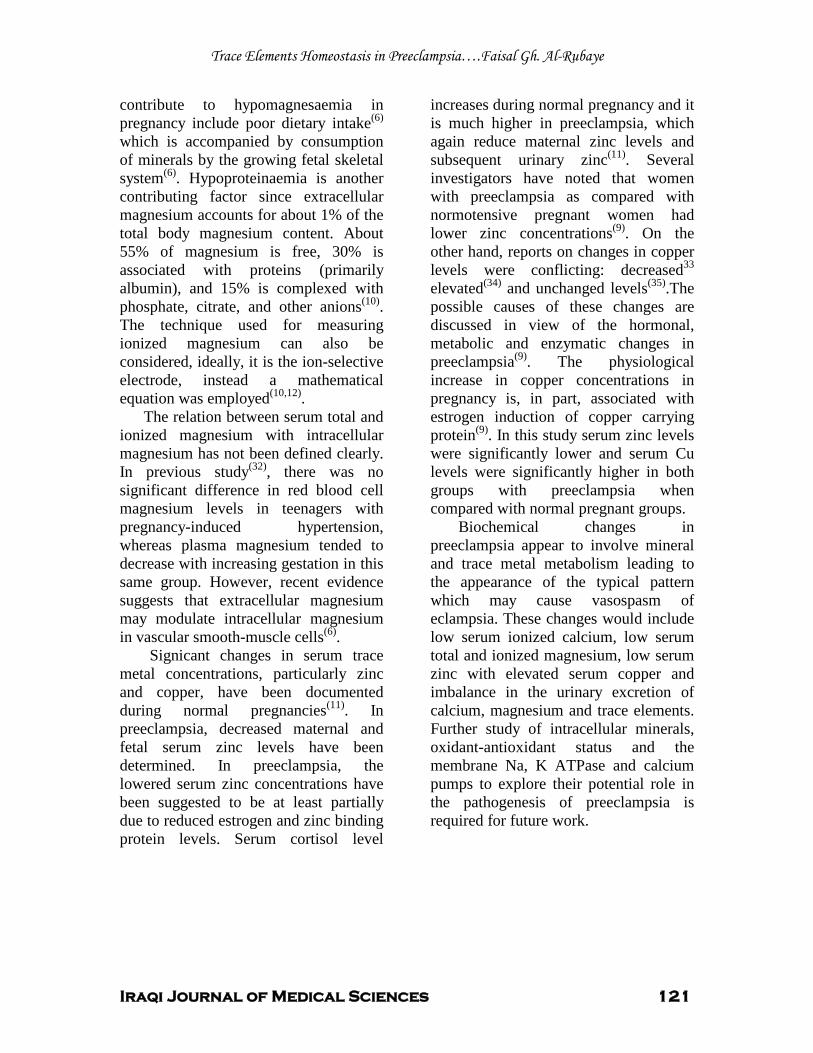
Trace Elements Homeostasis in Preeclampsia….Faisal Gh. Al-Rubaye
Iraqi Journal of Medical Sciences 121
contribute to hypomagnesaemia in pregnancy include poor dietary intakeP
(6)P
which is accompanied by consumption of minerals by the growing fetal skeletal system P
(6)P. Hypoproteinaemia is another
contributing factor since extracellular magnesium accounts for about 1% of the total body magnesium content. About 55% of magnesium is free, 30% is associated with proteins (primarily albumin), and 15% is complexed with phosphate, citrate, and other anions P
(10)P.
The technique used for measuring ionized magnesium can also be considered, ideally, it is the ion-selective electrode, instead a mathematical equation was employed P
(10,12)P.
The relation between serum total and ionized magnesium with intracellular magnesium has not been defined clearly. In previous studyP
(32)P, there was no
significant difference in red blood cell magnesium levels in teenagers with pregnancy-induced hypertension, whereas plasma magnesium tended to decrease with increasing gestation in this same group. However, recent evidence suggests that extracellular magnesium may modulate intracellular magnesium in vascular smooth-muscle cells P
(6)P.
Signicant changes in serum trace metal concentrations, particularly zinc and copper, have been documented during normal pregnancies P
(11)P. In
preeclampsia, decreased maternal and fetal serum zinc levels have been determined. In preeclampsia, the lowered serum zinc concentrations have been suggested to be at least partially due to reduced estrogen and zinc binding protein levels. Serum cortisol level
increases during normal pregnancy and it is much higher in preeclampsia, which again reduce maternal zinc levels and subsequent urinary zincP
(11)P. Several
investigators have noted that women with preeclampsia as compared with normotensive pregnant women had lower zinc concentrations P
(9)P. On the
other hand, reports on changes in copper levels were conflicting: decreased P
33P
elevated P
(34)P and unchanged levels P
(35)P.The
possible causes of these changes are discussed in view of the hormonal, metabolic and enzymatic changes in preeclampsiaP
(9)P. The physiological
increase in copper concentrations in pregnancy is, in part, associated with estrogen induction of copper carrying protein P
(9)P. In this study serum zinc levels
were significantly lower and serum Cu levels were significantly higher in both groups with preeclampsia when compared with normal pregnant groups.
Biochemical changes in preeclampsia appear to involve mineral and trace metal metabolism leading to the appearance of the typical pattern which may cause vasospasm of eclampsia. These changes would include low serum ionized calcium, low serum total and ionized magnesium, low serum zinc with elevated serum copper and imbalance in the urinary excretion of calcium, magnesium and trace elements. Further study of intracellular minerals, oxidant-antioxidant status and the membrane Na, K ATPase and calcium pumps to explore their potential role in the pathogenesis of preeclampsia is required for future work.
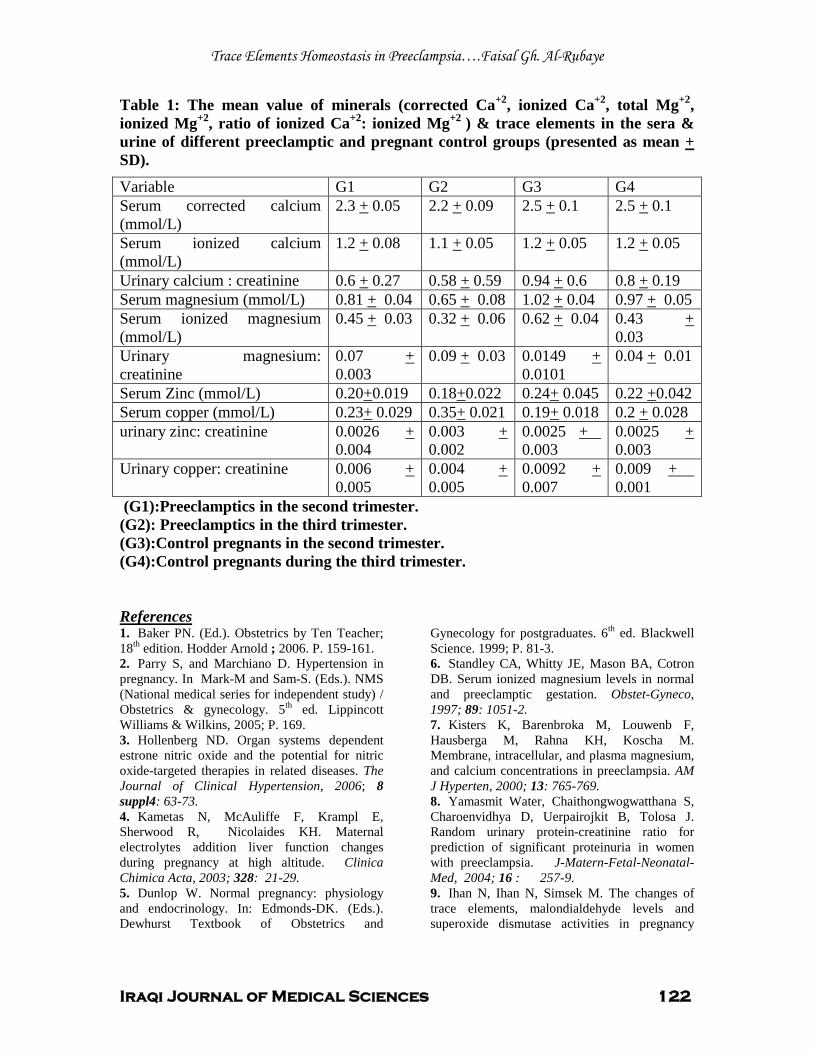
Trace Elements Homeostasis in Preeclampsia….Faisal Gh. Al-Rubaye
Iraqi Journal of Medical Sciences 122
Table 1: The mean value of minerals (corrected Ca P
+2P, ionized CaP
+2P, total MgP
+2P,
ionized Mg P
+2P, ratio of ionized CaP
+2P: ionized Mg P
+2 P) & trace elements in the sera &
urine of different preeclamptic and pregnant control groups (presented as mean + SD).
Variable G1 G2 G3 G4 Serum corrected calcium (mmol/L)
2.3 + 0.05 2.2 + 0.09 2.5 + 0.1 2.5 + 0.1
Serum ionized calcium (mmol/L)
1.2 + 0.08 1.1 + 0.05 1.2 + 0.05 1.2 + 0.05
Urinary calcium : creatinine 0.6 + 0.27 0.58 + 0.59 0.94 + 0.6 0.8 + 0.19 Serum magnesium (mmol/L) 0.81 + 0.04 0.65 + 0.08 1.02 + 0.04 0.97 + 0.05 Serum ionized magnesium (mmol/L)
0.45 + 0.03 0.32 + 0.06 0.62 + 0.04 0.43 U+ U0.03
Urinary magnesium: creatinine
0.07 + 0.003
0.09 + 0.03 0.0149 U+ U0.0101
0.04 + 0.01
Serum Zinc (mmol/L) 0.20+0.019 0.18+0.022 0.24+ 0.045 0.22 +0.042 Serum copper (mmol/L) 0.23+ 0.029 0.35+ 0.021 0.19+ 0.018 0.2 + 0.028 urinary zinc: creatinine 0.0026 U+
U0.004 0.003 + 0.002
0.0025 U+ U 0.003
0.0025 + 0.003
Urinary copper: creatinine 0.006 + 0.005
0.004 U+ U0.005
0.0092 + 0.007
0.009 U+ U 0.001
(G1):Preeclamptics in the second trimester. (G2): Preeclamptics in the third trimester. (G3):Control pregnants in the second trimester. (G4):Control pregnants during the third trimester.
UReferences 1. Baker PN. (Ed.). Obstetrics by Ten Teacher; 18 P
thP edition. Hodder Arnold ; 2006. P. 159-161.
2. Parry S, and Marchiano D. Hypertension in pregnancy. In Mark-M and Sam-S. (Eds.). NMS (National medical series for independent study) / Obstetrics & gynecology. 5 P
thP ed. Lippincott
Williams & Wilkins, 2005; P. 169. 3. Hollenberg ND. Organ systems dependent estrone nitric oxide and the potential for nitric oxide-targeted therapies in related diseases. The Journal of Clinical Hypertension, 2006; 8 suppl4: 63-73. 4. Kametas N, McAuliffe F, Krampl E, Sherwood R, Nicolaides KH. Maternal electrolytes addition liver function changes during pregnancy at high altitude. Clinica Chimica Acta, 2003; 328: 21-29. 5. Dunlop W. Normal pregnancy: physiology and endocrinology. In: Edmonds-DK. (Eds.). Dewhurst Textbook of Obstetrics and
Gynecology for postgraduates. 6 P
thP ed. Blackwell
Science. 1999; P. 81-3. 6. Standley CA, Whitty JE, Mason BA, Cotron DB. Serum ionized magnesium levels in normal and preeclamptic gestation. Obstet-Gyneco, 1997; 89: 1051-2. 7. Kisters K, Barenbroka M, Louwenb F, Hausberga M, Rahna KH, Koscha M. Membrane, intracellular, and plasma magnesium, and calcium concentrations in preeclampsia. AM J Hyperten, 2000; 13: 765-769. 8. Yamasmit Water, Chaithongwogwatthana S, Charoenvidhya D, Uerpairojkit B, Tolosa J. Random urinary protein-creatinine ratio for prediction of significant proteinuria in women with preeclampsia. J-Matern-Fetal-Neonatal-Med, 2004; 16 : 257-9. 9. Ihan N, Ihan N, Simsek M. The changes of trace elements, malondialdehyde levels and superoxide dismutase activities in pregnancy
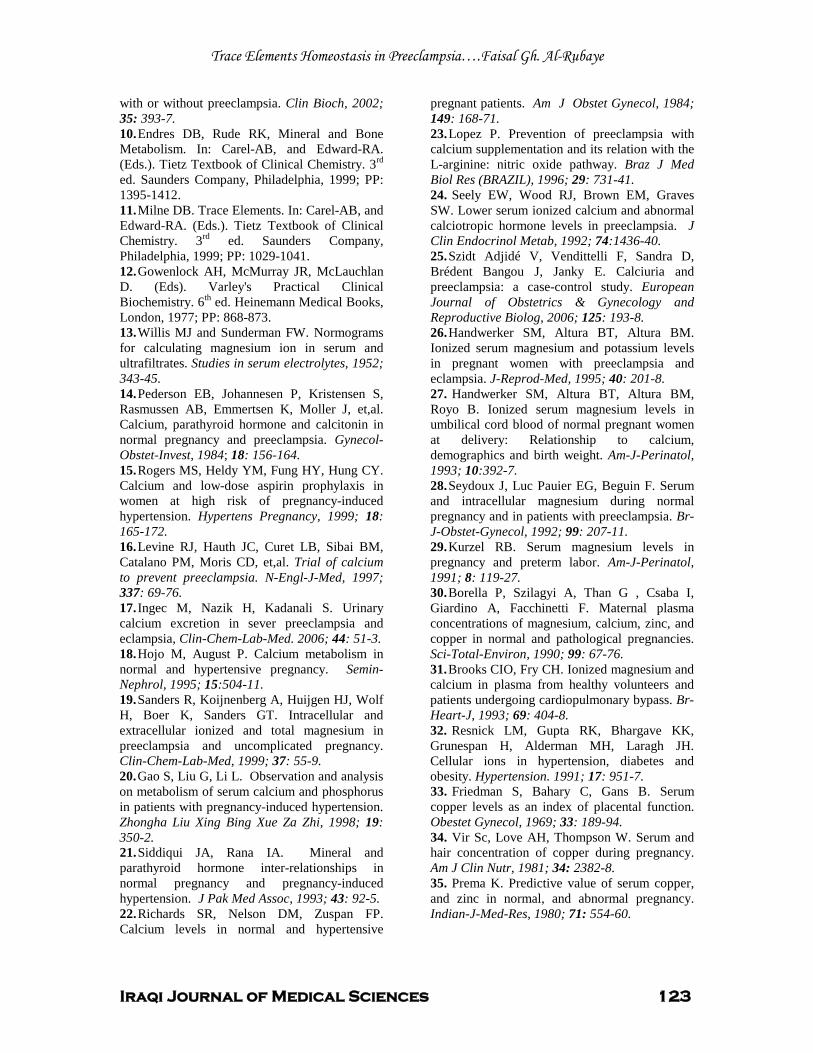
Trace Elements Homeostasis in Preeclampsia….Faisal Gh. Al-Rubaye
Iraqi Journal of Medical Sciences 123
with or without preeclampsia. Clin Bioch, 2002; 35: 393-7. 10. Endres DB, Rude RK, Mineral and Bone Metabolism. In: Carel-AB, and Edward-RA. (Eds.). Tietz Textbook of Clinical Chemistry. 3 P
rdP
ed. Saunders Company, Philadelphia, 1999; PP: 1395-1412. 11. Milne DB. Trace Elements. In: Carel-AB, and Edward-RA. (Eds.). Tietz Textbook of Clinical Chemistry. 3 P
rdP ed. Saunders Company,
Philadelphia, 1999; PP: 1029-1041. 12. Gowenlock AH, McMurray JR, McLauchlan D. (Eds). Varley's Practical Clinical Biochemistry. 6 P
thP ed. Heinemann Medical Books,
London, 1977; PP: 868-873. 13. Willis MJ and Sunderman FW. Normograms for calculating magnesium ion in serum and ultrafiltrates. Studies in serum electrolytes, 1952; 343-45. 14. Pederson EB, Johannesen P, Kristensen S, Rasmussen AB, Emmertsen K, Moller J, et,al. Calcium, parathyroid hormone and calcitonin in normal pregnancy and preeclampsia. Gynecol-Obstet-Invest, 1984; 18: 156-164. 15. Rogers MS, Heldy YM, Fung HY, Hung CY. Calcium and low-dose aspirin prophylaxis in women at high risk of pregnancy-induced hypertension. Hypertens Pregnancy, 1999; 18: 165-172. 16. Levine RJ, Hauth JC, Curet LB, Sibai BM, Catalano PM, Moris CD, et,al. Trial of calcium to prevent preeclampsia. N-Engl-J-Med, 1997; 337: 69-76. 17. Ingec M, Nazik H, Kadanali S. Urinary calcium excretion in sever preeclampsia and eclampsia, Clin-Chem-Lab-Med. 2006; 44: 51-3. 18. Hojo M, August P. Calcium metabolism in normal and hypertensive pregnancy. Semin-Nephrol, 1995; 15:504-11. 19. Sanders R, Koijnenberg A, Huijgen HJ, Wolf H, Boer K, Sanders GT. Intracellular and extracellular ionized and total magnesium in preeclampsia and uncomplicated pregnancy. Clin-Chem-Lab-Med, 1999; 37: 55-9. 20. Gao S, Liu G, Li L. Observation and analysis on metabolism of serum calcium and phosphorus in patients with pregnancy-induced hypertension. Zhongha Liu Xing Bing Xue Za Zhi, 1998; 19: 350-2. 21. Siddiqui JA, Rana IA. Mineral and parathyroid hormone inter-relationships in normal pregnancy and pregnancy-induced hypertension. J Pak Med Assoc, 1993; 43: 92-5. 22. Richards SR, Nelson DM, Zuspan FP. Calcium levels in normal and hypertensive
pregnant patients. Am J Obstet Gynecol, 1984; 149: 168-71. 23. Lopez P. Prevention of preeclampsia with calcium supplementation and its relation with the L-arginine: nitric oxide pathway. Braz J Med Biol Res (BRAZIL), 1996; 29: 731-41. 24. Seely EW, Wood RJ, Brown EM, Graves SW. Lower serum ionized calcium and abnormal calciotropic hormone levels in preeclampsia. J Clin Endocrinol Metab, 1992; 74:1436-40. 25. Szidt Adjidé V, Vendittelli F, Sandra D, Brédent Bangou J, Janky E. Calciuria and preeclampsia: a case-control study. European Journal of Obstetrics & Gynecology and Reproductive Biolog, 2006; 125: 193-8. 26. Handwerker SM, Altura BT, Altura BM. Ionized serum magnesium and potassium levels in pregnant women with preeclampsia and eclampsia. J-Reprod-Med, 1995; 40: 201-8. 27. Handwerker SM, Altura BT, Altura BM, Royo B. Ionized serum magnesium levels in umbilical cord blood of normal pregnant women at delivery: Relationship to calcium, demographics and birth weight. Am-J-Perinatol, 1993; 10:392-7. 28. Seydoux J, Luc Pauier EG, Beguin F. Serum and intracellular magnesium during normal pregnancy and in patients with preeclampsia. Br-J-Obstet-Gynecol, 1992; 99: 207-11. 29. Kurzel RB. Serum magnesium levels in pregnancy and preterm labor. Am-J-Perinatol, 1991; 8: 119-27. 30. Borella P, Szilagyi A, Than G , Csaba I, Giardino A, Facchinetti F. Maternal plasma concentrations of magnesium, calcium, zinc, and copper in normal and pathological pregnancies. Sci-Total-Environ, 1990; 99: 67-76. 31. Brooks CIO, Fry CH. Ionized magnesium and calcium in plasma from healthy volunteers and patients undergoing cardiopulmonary bypass. Br-Heart-J, 1993; 69: 404-8. 32. Resnick LM, Gupta RK, Bhargave KK, Grunespan H, Alderman MH, Laragh JH. Cellular ions in hypertension, diabetes and obesity. Hypertension. 1991; 17: 951-7. 33. Friedman S, Bahary C, Gans B. Serum copper levels as an index of placental function. Obestet Gynecol, 1969; 33: 189-94. 34. Vir Sc, Love AH, Thompson W. Serum and hair concentration of copper during pregnancy. Am J Clin Nutr, 1981; 34: 2382-8. 35. Prema K. Predictive value of serum copper, and zinc in normal, and abnormal pregnancy. Indian-J-Med-Res, 1980; 71: 554-60.
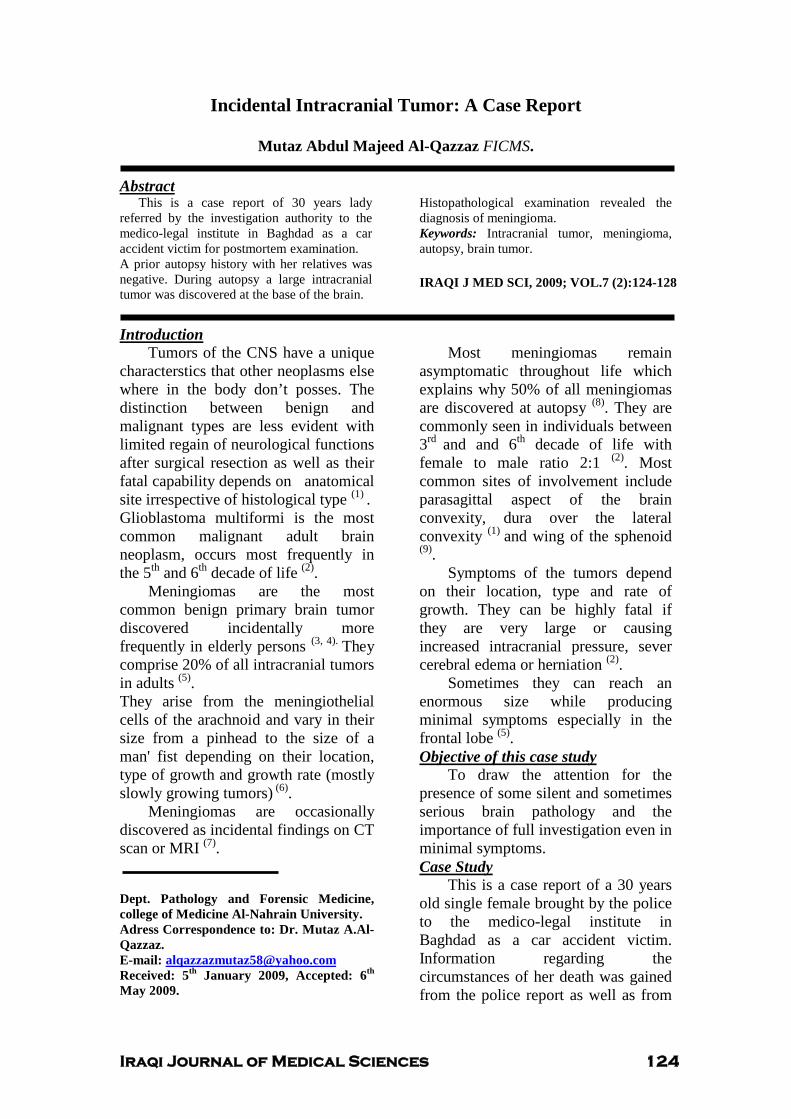
Iraqi Journal of Medical Sciences 124
Incidental Intracranial Tumor: A Case Report
Mutaz Abdul Majeed Al-Qazzaz FICMS. UAbstract
This is a case report of 30 years lady referred by the investigation authority to the medico-legal institute in Baghdad as a car accident victim for postmortem examination. A prior autopsy history with her relatives was negative. During autopsy a large intracranial tumor was discovered at the base of the brain.
Histopathological examination revealed the diagnosis of meningioma. Keywords: Intracranial tumor, meningioma, autopsy, brain tumor. IRAQI J MED SCI, 2009; VOL.7 (2):124-128
UIntroduction Tumors of the CNS have a unique
characterstics that other neoplasms else where in the body don’t posses. The distinction between benign and malignant types are less evident with limited regain of neurological functions after surgical resection as well as their fatal capability depends on anatomical site irrespective of histological type P
(1) P.
Glioblastoma multiformi is the most common malignant adult brain neoplasm, occurs most frequently in the 5 P
thP and 6P
thP decade of life P
(2)P.
Meningiomas are the most common benign primary brain tumor discovered incidentally more frequently in elderly persons P
(3, 4). PThey
comprise 20% of all intracranial tumors in adults P
(5)P.
They arise from the meningiothelial cells of the arachnoid and vary in their size from a pinhead to the size of a man' fist depending on their location, type of growth and growth rate (mostly slowly growing tumors)P
(6)P.
Meningiomas are occasionally discovered as incidental findings on CT scan or MRI P
(7)P.
Dept. Pathology and Forensic Medicine, college of Medicine Al-Nahrain University. Adress Correspondence to: Dr. Mutaz A.Al-Qazzaz. E-mail: [email protected] Received: 5 P
thP January 2009, Accepted: 6 P
thP
May 2009.
Most meningiomas remain asymptomatic throughout life which explains why 50% of all meningiomas are discovered at autopsy P
(8)P. They are
commonly seen in individuals between 3P
rd Pand and 6P
thP decade of life with
female to male ratio 2:1 P
(2)P. Most
common sites of involvement include parasagittal aspect of the brain convexity, dura over the lateral convexity P
(1) Pand wing of the sphenoid
P
(9)P.
Symptoms of the tumors depend on their location, type and rate of growth. They can be highly fatal if they are very large or causing increased intracranial pressure, sever cerebral edema or herniation P
(2)P.
Sometimes they can reach an enormous size while producing minimal symptoms especially in the frontal lobe P
(5)P.
UObjective of this case study To draw the attention for the
presence of some silent and sometimes serious brain pathology and the importance of full investigation even in minimal symptoms. UCase Study
This is a case report of a 30 years old single female brought by the police to the medico-legal institute in Baghdad as a car accident victim. Information regarding the circumstances of her death was gained from the police report as well as from
Intracranial Tumor, Case report…. Mutaz A. Al-Qazzaz
Iraqi Journal of Medical Sciences 125
an interview with her brother who denied any previous medical or surgical history of the deceased.
External examination of the body revealed multiple brush abrasions 1-7 cm in diameter on the anterior right side of the chest and on the external aspects of her upper limbs. A bruise was seen on her upper abdomen of about 10 cm in length.
Dissection of the scalp reveals no abnormal findings. After removing of the calvarium the brain was seen slightly edematous with congestion. On trying to remove the brain a big mass was noticed at the base of the brain on the left side of the anterior cranial fossa. After removing the brain from the skull the mass was excised. A compression effect by the mass was seen on the basal aspect of the left frontal lobe and to lower extent the temporal lobe.
The Base of the skull was normal. Evisceration of chest organs was
done. Examination of the chest cage showed fractures of the 4P
thP, 5P
thP, 6P
thP, 7 P
thP
ribs of the right side along the lateral axillary line with bruises at the
fractures sites. Right lung showed multiple bruises 5-7 cm on the 3 lobes. A huge abdominal collection of blood intraperitonialy was collected and measured to be almost 3 liters. Multiple tears were seen in the liver which explains the source of blood. Other abdominal and pelvic organs were normal. Gross examination of the brain mass showed a solid vascular growth weighting 60 gram measuring 5x3x2 cm, hemispherical in shape.
Fixation of the mass was done using 10 % formalin over night. Histopathological examination using H & E stain revealed transitional type of meningioma. Interrogation with the deceased brother after completion of autopsy examination and facing him with the brain pathology seen during autopsy, he admitted that she was complaining form some symptoms like headache, blurring of vision, mental loss and occasional seizure attack for which she was on antiepileptic medications.
Intracranial Tumor, Case report…. Mutaz A. Al-Qazzaz
Iraqi Journal of Medical Sciences 126
Figure 1: Brain, basal view showing large meningioma at the base of the brain.
Figure 2: Brain, basal view, showing compression of the underlying structures by
the tumor.
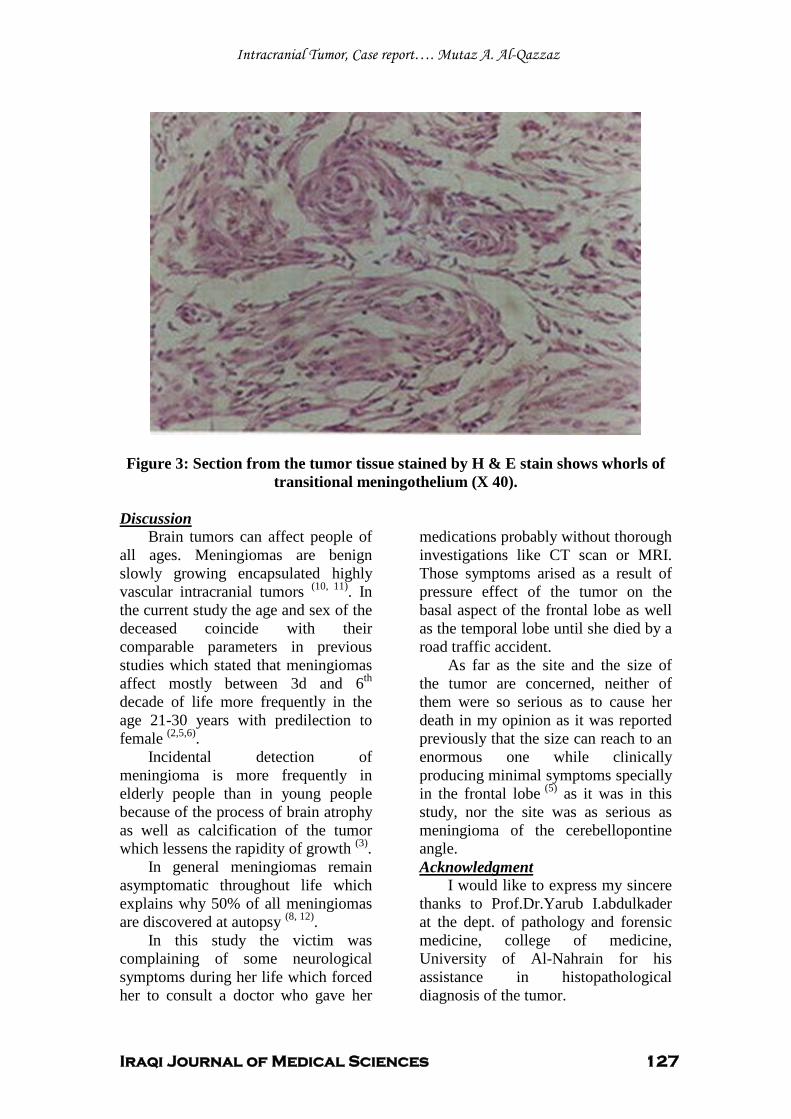
Intracranial Tumor, Case report…. Mutaz A. Al-Qazzaz
Iraqi Journal of Medical Sciences 127
Figure 3: Section from the tumor tissue stained by H & E stain shows whorls of
transitional meningothelium (X 40).
UDiscussion Brain tumors can affect people of
all ages. Meningiomas are benign slowly growing encapsulated highly vascular intracranial tumors P
(10, 11)P. In
the current study the age and sex of the deceased coincide with their comparable parameters in previous studies which stated that meningiomas affect mostly between 3d and 6 P
thP
decade of life more frequently in the age 21-30 years with predilection to female P
(2,5,6)P.
Incidental detection of meningioma is more frequently in elderly people than in young people because of the process of brain atrophy as well as calcification of the tumor which lessens the rapidity of growth P
(3)P.
In general meningiomas remain asymptomatic throughout life which explains why 50% of all meningiomas are discovered at autopsy P
(8, 12)P.
In this study the victim was complaining of some neurological symptoms during her life which forced her to consult a doctor who gave her
medications probably without thorough investigations like CT scan or MRI. Those symptoms arised as a result of pressure effect of the tumor on the basal aspect of the frontal lobe as well as the temporal lobe until she died by a road traffic accident.
As far as the site and the size of the tumor are concerned, neither of them were so serious as to cause her death in my opinion as it was reported previously that the size can reach to an enormous one while clinically producing minimal symptoms specially in the frontal lobeP
(5)P as it was in this
study, nor the site was as serious as meningioma of the cerebellopontine angle. UAcknowledgment
I would like to express my sincere thanks to Prof.Dr.Yarub I.abdulkader at the dept. of pathology and forensic medicine, college of medicine, University of Al-Nahrain for his assistance in histopathological diagnosis of the tumor.
Intracranial Tumor, Case report…. Mutaz A. Al-Qazzaz
Iraqi Journal of Medical Sciences 128
UReferences 1. Ramzi S Cortan, Vinay K and Tucker C. Pathologic Basis of Diseases, 6 P
thP edition, 1999;
chapter 30, pp 1343. 2. Christina I, Cynthia S, Judie L and Lisa M. Brain tumors, Physical Therapy, 2002; vol. 82, No.5, pp 496-502. 3. Masaki N , Kazutakay Y , Katsum N , Yoshihiro K and Junichi K , Natural History of Elderly Patients with Asymptomatic Meningiomas , Journal of Neural. Neurosurg Psychiatry, 2000; vol.68, pp 25-28. 4. Satoshi N, Asao H, Toshiro S and Josefina L. Incidental Meningiomas in Autopsy Study, Surgical Neurology, 1987; vol.27, 1ssue 4 pp 319-322. 5. Laws Er and Thapark K, Brain Tumors, Cancer journal of Clinician, 1993; vol.43, pp 263-271. 6. Klaus J Zulch. Brain Tumors, 2d edition, chapter 17, Tumors of Meningial and Related Tissues, 1986; pp 357-393. 7. As B, Natural History of Asymptomatic Meningiomes, Journal Watch General Medicine, 1999; January 8. 8. Meike W, Ikram M A, Herve L , Arnaud J P E et al , Incidental Findings on Brain MRI in the General Population , The New England journal of Medicine , 2007 ; vol.357 , No.18 , pp 1821- 1828. 9. Florian R, Makoto N , Cornellus J , Peter V et al , Spheniodal Wing Meningiomas with Osseous Involvement , Surgical Neurology , 2005; vol.64 , issue 1 , pp 37-43. 10. Gilory J and Holliday PL, Basic Neurology, New York, Macmillan Publishing Co., 1982; pp 200-213. 11. Chang CY, Cheung SW and Jaker R K, Meningioma Presenting in the Temporal Lobe , The Pathology of spread from an Intracranial site of origin , Otolarygol Head Neck Surg , 1998; vol.119 , pp 658-664. 12. Nakasu S , Hirano A , Shimura J and Liena JF , Incidental Meningioma in Autopsy Study , Surg Neurol , 1987; vol.27, ,pp 319-322.

1 ص 2 ، العدد 7م، المجلد 2009المجلة العراقية للعلوم الطبية
المجلة العراقية للعلوم الطبية ق ائمة المحتويات
مق الات ال
قبل الشنج()توازن المعادن لدى الحوامل المصابات بارتف اع ضغط الدم
1 ...................................................................يـا انثاتــ,طارق حفظ انخاط ,فـصـم غـاس انزتعــ
ص وتنقية بروتينات الغشاء الخارجي من عزله محليه لبكتريا الاستخلا Klebsiella pneumoniae
3..................................................................عايز ا راسق , عصاو فاضم أنجه , ضال عثذ ان
باستخدام أشعة رسب كريات الدم الحمراءتقييم دور تغير شكل كريات الدم الحمراء في معدل تجمع وت الليزر 4...............................................................................................................عثذ الأيزانخشرج رذ
السستينيوريا لدى مجموعة من الأطف ال في العراق 5..........................................................................................................................شذ حس عه
التعبير عن المعلم CD30 فى مصول وعلى الخلايا التائيه فى نسيج المشيمه الماخوذ من مريضات الاجهاض التلق ائى المتكرر 6........................................................................................................ايال حس ,ضال عثذ ان
في العراق اعند المرضى المعالجين سابق لعصيات التدرن طبيعة الممانعة الدوائية 7.............................................................................اشى يذ اشى انكاظ , يصطف ع عثذ عه
دراسة التنميط المناعي للخلايا اللمف اوية في الدم المحيطي للأشخاص المتعرضين للمجال الكهرومغناطيسي 8...........................................................................................................................رافذ عثذ اناحذ
دراسة كيمانسجية لخلايا بين العصبونات في الحبل الشوكي في اللبائن 10.................................................................................................................عه عثذ انستار انطائ
و الربو القصبى اتلايا الحمضخالمستخلص من دراسة العلاقه بين الذيف ان العصبى 11.............................................................................شاب أحذ لاف ,ضال عثذ ان ,عايز انجار
طبيعية : بياناتالأصحاءالتوصيل العصبي للعراقيين دراسة 12..........................................................................................................................فزقذ تذر حذا

2ص 2 ، العدد 7م، المجلد 2009المجلة العراقية للعلوم الطبية
جراحة الجيوب الناظورية بالمق ارنة مع الطرق التق ليدية في علاج الزوائد اللحمية للأنف والجيوب الغربالية مع الأختلالات الأنفية المصاحبة
13.................................................................................................................ا أسعذ عثذ انكزى
فرط ضغط الدم الرئوي عند المصابين بالعجز الكلوي المزمن 14.......................................................................................................................جاد كاظى يات
في العضلات الق اطنةفي الخلايا الفضةعلم الشكل)مورفومتريه( للتغيرات في صبغه نترات دراسة مع التقدم بالعمر الهيكلية
15.......................................................................................كزى ذ رشذ, ي فاضم ياجذ انحثة
قبل الشنج( وامل المصابات بارتف اع ضغط الدم توازن العناصر الضئيلة لدى الح(
16.............................................................................................................فـصـم غـاس انزتعــ
:ةتقرير حال
ورم الجوف القحفي التصادفي 18..............................ش عثذ انجذ عثذ انعشش انقشاس....................................................................يعت

م2009هـ، 1430، الثاني، العدد بعساالمجلد ال
المجلة العراقية للعلوم الطبية
رئيس هيئة التحرير
ة فائزة عفتان زغيرالدكتور ةالأستاذ
التنفيذية تحريرالهيئة
عبد المهيمن نضال. أ يمرالكـ دإيناس طالب عبم .أـم أحمد م حسام عبـد الكري.أ دانيــيز الحمزـن عم حس.أ د جاســـمومـــحـم رسميم .أ ارفع سامح هالةم .أ
ـر نائبةرئيــــس التحريــ ررةـــــــــــــــــــــــــمح
ـــــررـــــــــمحـــــــــــــ ـــــــررـــــــمحـــــــــــــ
ــــــررــــــمحـــــــــــــــ ررةـــــــــــــــــــــــــمح
مجلة سكرتارية ال
سامي ناجي إسراء
المحرر الفني
علياء نوري حاتم
). 964-1-5224368(تلفون و فاكس . بغداد، العراق 14222عنون المراسلات إلى المجلة العراقية للعلوم الطبية، صندوق بريد ت
2000لسنة 709رقم الإيداع في دار الكتب و الوثائق ببغداد

الهيئة الأستشارية
) جامعة النهرين( ديــد كاظم الزبيـديب احمأ .د.م.أ
) جامعة النهرين(أسامة سليمان الناصري .د.أ
)مارات العربية المتحدةالأ( اسامة نهاد رفعت.د.أ
)الهيئة العراقية للأختصاصات الطبية( امجد داود نيازي.د.أ
) جامعة النهرينمعهد أبحاث الأجنة و العقم-(أنعم رشيد الصالحي .د.أ
) جامعة البصرة(ر أحمد حمدان ثام.د.أ
) جامعة الكوفة(نة جاسم محمد عطية المح.د.أ
) جامعة الأنبار (جليل إبراهيم صالح .د.م.أ
) جامعة النهرين(حســـام حســون علـــي .د.أ
) جامعة النهرين( د حسن باقيـــحسن احم .د.م.أ
) جامعة النهرين(حكمت عبد الرسول حاتم . د.أ
) جامعة النهرين(حيــدر جـــــــــــواد كاظم .د.م.أ
) الامارات العربية المتحدة( رافع الراوي.د.أ
) جامعة القادسية ( الياسريراهي كلف .د.م.أ
) جامعة كربلاء(زهير عمران عيسى .د.م.أ
) جامعة النهرين(سامي إسطيفان مطلوب . د.أ
)جامعة بغداد( سرمد خوندة.د.أ
) امعة النهرينج(سوسن ساطع عباس . د.أ
) جامعة النهرين( د الحسين مهدي الهاديـعب .د.أ
) جامعة النهرين(عبد الرزاق حردان أحمــد .د.م.أ
) جامعة واسط (عطا كطي علاوي .د.م.أ
) جامعة النهرين( ــــــــــينــي حسـعلاء غن .د.م.أ
) جامعة بابل (علي خير االله .د.م.أ
) ة النهرينجامع(غسان عبد الامير الشماع .د.أ
) طب الكندي (فارس عبد الكريم .د.م.أ
) جامعة كركوك ( نجم ناصرفخر الدين . د.م.أ
) جامعة النهرين(فرقـــد بــــدر حمـــــــدان .د.م.أ
) جامعة دهوك( فرهاد سوليفان .د.م.أ
) جامعة النهرين( د الكريم السعديـــلمياء عب .د.م.أ
) جامعة ذي قار (مؤيد ناجي مجيد .د.أ

) الجامعة المستنصرية(محمد حسن العلوان.د.أ
)جامعة مؤته( محمود حياوي حماش.د.أ
)جامعة الموصل(مزاحم قاسم الخياط .د.م.أ
) جامعة النهرين( م البياتيــــا محمد جاســـمه .د.أ
) الهيئة العراقية للأختصاصات الطبية( نزار الحسني.د.أ
) ة النهرينجامع( يـــدي الكاظمــــم مهـــهاش .د.أ
)جامعة النهرين(يعرب إدريس عبد القادر . د.أ
الملخصات العربية
1 المجلة العراقية للعلوم الطبية
قبل الشنج()حوامل المصابات بارتف اع ضغط الدمتوازن المعادن لدى ال
3طارق حفظي الخياط ,2مه ا البيات ي , 1ف يص ل غ ازي الربيع ي
الخلاصة:و قل غغشى ( للغغك دم غغ ذ غغي غغي غغ خلفي ة الدرا: ة: ضغغ ا دمغغلع دم غغىما مغغلل دمضيدغغك مبسيا ا
غ دمهاغىافىا دم غى ل دمهة رغل دمغة غلل شغىا (رتفغى ضغ ا دمغلع ر أغس (ح غىم دمضهغك غي
(تغاد غى دمغلع صغي اىضل اىمشتش ؛ ع ذمك سلب غاد دررتفغى رشس مغيعل دمه تشغىا
خىصلدمه ى دمهيرلل (ح ىم دمضهغك ت تلغس ت ىلاغل؛ (ضغى ل مغامك غة صىمغل اري غىا دم ىم غشيع
ى ضغغغغ ا دمغغغغلع دمهمغغغغىصب ممضهغغغغك دمه ش غغغغشيع دمضغغغغسح خغغغغق دمضهغغغغك اغغغغىافىت م(رتفغغغغ
و قل شى ( للك دم ذ مم تيصف ب ك ىكل بسيا ا
اه دملردسل ي ملشى ها دمه ى مدم ىم شيع دمه ش شيع غا صىمغل دمألف الدرا:ة: هدف
و قل شى ( للك دم ذ اقلت ع دمضهك دمتلش ال درتفى ض ا دملع دمهمىصب ممضهك مبسيا ا
ت غغغهك لشغغغىا دمه غغغى مدم ىم غغغشيع شغغغل غغغاه دملردسغغغل غغغا ردسغغغل متوط رق البح : رض لما
صىق مغىبل بىرتفغى ضغ ا دمغلع دمهمغىصب ممضهغك مزهياغل د ختلغىر 06دمه ش شيع ملل
تم تم شفأم دمة زهياتش ص ب اهس دمضهك:
دمفمغك دمخغى ا صيدك مىبىا بىرتفى ض ا دملع دمهمغىصب ممضهغك مللغك دم غ ذ خغق
سرال ل 06 دمضهك مدم ل
صيدك مىبىا بىرتفى ض ا دملع دمهمىصب ممضهغك مللغك دم غ ذ خغق دمفمغك دمخىمغج
سرال ل 06 دمضهك مدم ل
سغغمشهل ه هى سرى مزهياغغل دم غغشتسح ت تغغم تم غغشم ل صىمغغ 06دم تغغى ذ غغع تغغى ذ لتغغم مىر غغ
دمة زهياتش : زهيال دم شتسح داتهى د امة اهس دمضهك
سرال ل 06صيدك دصضىم هى سرى خق دمفمك دمخى ا دمضهك مدم ل
سرال ل 06صيدك دصضىم هى سرى خق دمفمك دمخىمج دمضهك مدم ل
(هأغغسا دم تغغى ذ دمت ششغغس غغا مغغيدر دمهمغغك مغغلل دمضيدغغك ذ دا ضغغ ا دمغغلع دم غغىما ج: النتائ
ض غيي مه غتيل دمه ش غشيع دم ىم غشيع دمهمغضش ى غهك د ففغدمهمىصب ممضهك مللك دم ذ ر
ملأمليش ا مك دمضيدك دمهسضة ملل مىر تأم بهزىشع دم شتسح دمه ىهسحت ع د ففىض ا
تس شغغا دم ىم غغشيع دمضغغس دمه ش غغشيع دمضغغست غغع درتفغغى غغيي غغا غغلل دم ىم غغشيع دمضسدمغغة
دمه ش شيع دمضسل
ره غغ د سغغت تىد ( دمضيدغغك ذ دا دماغغ ا دم غغىما دمهمغغىصب ممضهغغك مللغغك هغغى تمغغلع الأ: تنتا :
دم ذ ر ى ي دختق صىمل تيدز ى دملع ا ل مىر تأم ع دمضيدك د صغضىم دمه غىهسر
ممهسضة ا دم هس اهس دمضهكل
للك دم ذت دم ىم شيعت دمه ش شيعل مفتاح الكلمات:

الملخصات العربية
2 المجلة العراقية للعلوم الطبية
[جامعة النهرين _ كلية الطب] يمياء الحياتيةفرع الكيمياء و الك 1 [جامعة النهرين _ كلية الطب] رع الامراض النسائية والتوليدف2 [, بابلجامعة _ كلية الطب]فرع الكيمياء الحياتية, 3
11-4ص 2العدد 7م المجلد 2009المجلة العراقية للعلوم الطبية Klebsiella الغشاء الخارجي من عزله محليه لبكتريا ال ا:تخلاص وتنقية بروتينات
pneumoniae
الملخصات العربية
3 المجلة العراقية للعلوم الطبية
1نضال عبد المهيمن, 2عصام ف اضل ألجميلي , 1عامر هاني رازق
الخلاصة:
: تيرل بس تش ىا دم ىم دمفسرا م دمليرر ىا ب هشىا لشسه ا دم ىم دمفغىررا خلفيه الدرا: ة
ل غيدا همغيمح بىمهغىم ت غهش بت ى غا دمزارلغىا دمهضلغ صشغج ت غيممل تسرى دم غىمل ممغل ل دم غسدع
ممهىم خغق دم غىم دمفغىررا ممفقرغى دمل تشسرغ ل تم غم دمليرر غىا بمغيره اىغ دمغة بيرر غىا ر
Da 600 دمتغا ت غهش بت ى غا دمزارلغىا دممتلشغ دممغ شسه مOmpC OmpF ياشغ مخغك
يد دسىسش م هك در ارهىالت ى ا دمتا ت أكLamB بيرر ىا ياش مخك
ت مشغغل تيصغغشف بس تش غغىا دم غغىم دمفغغىررا مدمليرر غغىا غغ اامغغ ضمشغغ غغ ه دف الدرا: ه:
ل Klebsiella pneumoniaeب تسرى د
دمهضمش هملر Klebsiella pneumoniaeدست همت دصلل اارا ب تسرى د طريقة العمل:
ال تم ت مشل تيصشف بس تش ىا دم ىم دمفىررا تم غامك م ا ت مشل بس تش ىا دم ىم دمفىرر
دمتضسي ا ري ت ل دم سرل دم ضها ا دمه تضاس دم أغى ا بىسغتفلدع يسرمغل دم غف اغ
صىض دمخىريبىربزيرركل
ل دهأغسا تغى ذ اهمشغل mg/ml 3.2دم أى ا امة بيرر غىا ب غلل دصتيل دمه تضاس ج: النتائ
kDa 36 35أير دمليرر ىا ب ك صاتش ذ دتا ز ش رارلشش هى دمتسصشك دم أسبى ا ه
امة دمتيدمال
دملردسغ بيرر غىا لشغل Klebsiella pneumoniaeمل تسرى د ت تذ دم ام دمهضمش : تنتاجات:الا
بى زد رارلش ىبأ مهى ت تز دمل تسرى درخسل دم ىمل ممل ل دم سدع ت تذ فس دم ام ياش
دمليرر ىا تضت دماس ف دمهفتلسر دممشىسش ل
.دمليرر ىا صىض دمخىريبىربزيررك س يتي سد شى دمأقع شتي رى ت شت الكلمات:مفتاح
[جامعة النهرين _كلية طب النهرين ]فرع الأحياء المجهرية 1 جامعة بغداد_ د الهند:ه الوراثيه والتقنيه الاحيائيه معه 2
17-12ص 2العدد 7م المجلد 2009العراقية للعلوم الطبية المجلة تقييم دور تغير شكل كريات الدم الحمراء في معدل تجمع وتر:ب كريات الدم الحمراء
با:تخدام أشعة الليزر
الملخصات العربية
4 المجلة العراقية للعلوم الطبية
رويدة عبد الأميرالخزرجي
:الخلاصة غغاه دمليرغغل شيميرشل أهغغل غغا دمغغل رح تزهغغع سرغغىا دمغغلع دمضهغغسدم هغغى سح غغ خلفي ة الدرا: ة:
دم ى سح تهخك دمفمى ص درسىسشل مملع دمتلش ا دمتا تم ب ر أم ا دمزأىز دمياى ا دممملا
خىصل ا در اشل دمليرل دم سرل ل
متمشغغشم ر لىبمشغغل ت شغغس مغغ ك سرغغىا دمغغلع دمضهغغسدم امغغة تزهغغع تسسغغب غغاه ه دف الدرا: ة:
دم سرىال
مغغفص سغغمشمل يسرمغغل دمغغ ل دممشغغار دم ى غغاح 03امغغة م (رسرغغت دملردسغغل دمضىمشغغل طريق ة العم ل:
دستفلت مأاه دملردسلل رتم ص ىب ملح (م ل دممشار دم ى اح ب غ ك غتهس خغق اهمشغل دمتزهغع
دمتسسغغبل تغغم ص غغىب لغغشم فتمفغغل ممىبمشغغل ت شغغس مغغ ك دم سرغغىا دمضهغغسدم تمشغغشم تةحشس غغى امغغة غغك
دمتزهع بهتز د حقث تزأىال سصمل سدصك دمتزهع ت ي دممفل ت ي
دم غىما ب ىغك دممغقبل اىغك دممغقبل تم دمت لشس ا لشم دمت شس ب ك دم سرىا دمضهسدم ج: النتائ
م سرىا دملع دمضهسدم رممك ل دمتزهع ل دمتزهغع بغخقث تزأغىا ب غ ك مضغيه د خغس غ
اىك دممقبل دمهتيسا ل
فغغل ممىبمشغغل ت شغغس مغغ ك سرغغىا دمغغلع دمضهغغسدم غغ دمممشمغغل دمغغة دمهتيسغغتل غغ لغغشم فتم :تنتا الا:
دمهتيستل دمة دم ىمشل بش ت تةحشسدا فتمفل امة سدصك دمتزهع دمتسسب مأاه دم سرىال
تزهع سرىا دملع دمضهسدمت ل دمتسسب لىبمشل دمت شس بىم كت (م ل دممشار مفتاح الكلمات:
[ جامعة النهرين _ كلية الطب ] الفسلجة فرع
25-18ص 2العدد 7م المجلد 2009المجلة العراقية للعلوم الطبية السستينيوريا لدى مجموعة من الاطف ال في العراق
شذى حسين علي
الملخصات العربية
5 المجلة العراقية للعلوم الطبية
:الخلاصةدم تش شيررى سض ردحا بمفل ت ضشل ىتذ ا خمك ا دتمىص درصهىض : خلفية الدرا:ة
شل دمخ ى شلل زرى ح د سدز دم تش ا در ردرر درلك ذ بى ى رة ي دمة ت ير دمضمةل درش
ملع تزسبت ى ا ىمزل دم تش شيررى ملل زهيال دريفى ا دم سدقل هدف الدرا:ة:
تغغغم تمشغغغشم ىمزغغغل تىب غغغل غغغك دريفغغغى دمهمغغغىبش 3660م ىرغغغل 9111غغغ طريق ة العم ل:
يررى ا ت فة دم ىههشل دمت مشهال بىم تش ش
مغأير 96د ىث ل تسد س ل دم هس 7ذ س 90م 30 ى ال دمهسضة دمه ىمزش ج: النتائ
س ل ل 91دمة
% (ز رغغى د غغسدز 90% (ز رغغى ( غغسدز دم ىم غغشيع غغا 3ل06هأسدز رغغى ( غغسدز دمشغغيردا غغا
% دمهسضةل 0ل3در ىرا ا
مأسل 11 – 9 ا مهتىب ل دمهسضة دمهلل دما
93ت غغ ل سضغغة ايمزغغيد بارغغى ح دم غغيد ك دممميرغغىا مغغا ل تغغم دسغغت هى امغغىر دمل غغقش غغا
% ل (اتغغغا امغغغىر 3ل33سضغغغة م 3غغغسرضل دراغغغسدض دمزى لشغغغل ممل غغغقش هأغغغسا مغغغلل
رت مأغم سراى (رس 91سضة 1دم ىبتيبسرك ررب ل سضة ل تم دست هى تفتشت دمضمة ا
دم همشىا دمزسدصشل ل
% غع 6% ع دمل قش 0ل31% ع دم يد ك دممميرىا 0ل33 ل دمفمي دمضمة ى
% ع دمتفتشت ل36دم ىبتيبسرك
% ل76% دمهسضة ل ى ل رري دمضمة 33 رلا دمضىرل مم قد در تق ا ا
ا صىمل دست هىمأى ا دمضىرا دمل شتلل دم يد ك دممميرىا د خس زىصى :الا:تنت ا
تى ذ دم قد دم ىرش ى ت ت ى رل صش دست هى دمل قش دمتفتشت ل
دم تش شيررى دريفى دمضمة صمة دمهزىري دمليمشل :مفتاح الكلمات
[جامعة النهرين _كلية طب ]فرع طب الاطف ال
34-26ص 2العدد 7م المجلد 2009المجلة العراقية للعلوم الطبية ف مصول وعل الخلايا التائيه ف نسيج المشيمه الماخوذ من CD30 التعبير عن المعلم
مريضات الاجهاض التلق ائ المتكرر 2امال حسين ,1نضال عبد المهيمن
الخلاصة:
الملخصات العربية
6 المجلة العراقية للعلوم الطبية
ه دم غي دمهه تضششل درستزىب دمه ىاش خق تسح دمضهك دمىتفىاقا تتا خلفية الدرا:ه:
دمخى ة دمفقرى دمتى ش دمه ىاله خىصل ة دمهيلع درة دمز ش ة دملش ةل لل اسف بغى دمه مغم
ر لس ا للك اد دم ي دمفقرىل CD30دمفميل
غغة مغغي دمفقرغغى CD30تأغغلف دملردسغغ دمغغة دمتضغغسل اغغ غغتيل دمه مغغم ه دف الدرا: ه:
مه اىممز ش لدمتى ش دمهيري ه ة دم شذ د
وس(حت تسد صت تيسا داهىر دصلل ستي تاه ت دملردس دمضىمش المواد و طرائق العم ل:
ر 3ل31− 1ل30بغغش م ت تغغم تم غغشهأ دمغغة حقحغغل زغغىشع: زهياغغلم ( ورأغغىض تممغغى ا ت غغس
- )ب ( ل زهياغغغل01ل6± 3ل31وغغغس(ح تيسغغغا داهغغغىر بغغغش م 03 اغغغل RSAم
ر مورأىض تم ± 3ل30وس(ح تيسا داهىر بش م 90 ال non-RSAمى ا رشس ت س
1ل30 ( تيسا داهىر بش ىم 96سشتسح مصهك ىرش : ال - ) ل زهيالمد13ل6
دمه غغتيل غغ غغك دمهسضغغة غغامك زهياغغ دم غغشتسهل را ع لل تغغم رهغغع هغغىذد 11ل±6
هغىذد دم غشذا دمه غاي ممز غش تره غ درمشغاد هغىدع تم شغل بىسغتفلCD30دمغاد ب دمهممة ممه مغم
بىسغتفلدع دمتضمشغك ملردسغل دمه مغم مدمتس يبقست غك دمهسضغة غامك زهياغ دم غشتسه
لIHCدمه ىاا دم شزا دم شهشى ا م
غغا sCD30 غغا دم غغشذ ص غغىب تس شغغا CD30دهأغغسا تغغى ذ ص غغىب غغتيرىا ج: النتائ
ا غل مىر غل CD30 بىم غلل مهتيسغا دم غلل دمهةرغل p<0.01زرى ه ير م دمهمك ري
ك دمهزهيال م( دمهزهيال مب ع دمهزهيال مد بىست هى يسرمتا دمفضص ل
بامك ر أس ره ا دمضهك دمتلش ا دم ىرش Th2رستلا بفقرى CD30ر تمل بة الا:تنتاجات:
ست د تس شاه ا دمهمكل سيدم ا شذ دمتس يبق
درمشاد دمتضمشك دمه ىاا دم شزا دم شهشى اتم شل ر ورأىض تممى ا ت س مفتاح الكلمات:
[جامعة النهرين _ كلية طب ]فرع الأحياء المجهرية 1 [المستنصريهجامعة ال _ كلية طب ]فرع الأحياء المجهرية 2
40-35ص 2العدد 7م المجلد 2009المجلة العراقية للعلوم الطبية في العراق اعند المرض المعالجين :ابق لعصيات التدرن طبيعة الممانعة الدوائية
هاشم مهدي هاشم الكاظمي , مصطف نعمه عبد علي
الخلاصة:
الملخصات العربية
7 المجلة العراقية للعلوم الطبية
ت ل دمههى ل دمل د شل م مشىا دمتلر غ دم غيد س دمتغا ت ى متأغى دملضغيث دمتلشغل خلفية الدرا: ة:
ب شل ا الىرح ا تفىلم دم ى سح دمتلش شل مههى ل دم مشىا بف ك در ى ل لل سزمت ز
خه غش مشغي د غى مغىب بأغاه دم مغشىا دمههى غلل 9113 هل دممغضل دم ىمهشغل غا سغ ل
تم م دمههى ل دمل د شل بىم لل مهغسض دمتغلر دمغة حقحغل دل غىع: دمههى غل ا غل دمضغىرا دمهسضغشل
لح دمههى ل ا ل دمهسضة دمغار ت غى ميد دم غقد مهغلح مغأس م غا دي تغسح سغىبمل دمههى غل دمزلر
دمه تس لل لل حلت خغق دملردسغىا د دمتفغسدا دميردحشغل دمضىصغمل مم مغشىا غة مل اغ
اه دمههى ل د ت ى دمل دم دمهاى ممتلر بميرح رشس هل دمهةمسدا دمهأهل مضل حأى
ل
-3 س غغل مغغلدر درصغغىبل بىمههى غغل دمل د شغغل م مغغشىا دمتغغلر غغا دم غغسدق -9 الدرا: ة: فه د
مىر ل يلش ل دمههى ل دمل د شل ا دم سدق ع دخسلل
سراغى مغىبش بىمتغلر غا غاه دملردسغل غى يد لغل ردر غيد أغل 399تم مهي طريقة العمل:
ىبمى مهغلح مغأس ضغل د غةل لغل تهغت دملردسغل غا دمتلر غا ب غلد ب غسي د ر ي غيد غىمزش سغ
تغغم درسغغى اش غغىا دمم غغع دمغغة دمهفتلغغس 3660دمغغة مغغأس دب 3663دمفتغغسح غغ مغغأس مغغلىي
ررسدم دمار دمزسحيا دمفىص بىمتغلر ب غل د رخلغت رغي دم مغشىا رغتم ضغص دمض ىسغشل
دمل د شل حم ت زك دم تى ذل
9:0سغ ل غلل دمغا ير دمغة در غىث 03بهتيسغا اهغس 966 غىث در 099ال دمغا ير ج: النتائ
دم تسبتيىسغغش تدمسرفىل ش ت% غغ دمار اغغىا تض غغل مغغن: دررا شىزدرل3ل31م911 ى غغتت
% هى غغل ميدصغغل غغ در رغغل دررب غغل امغغة درلغغكل لغغل مغغ مت 1 39م 390 دررخغغىلشيتي
ة بغىلا د غيد دمههى غل دمه فغس حل دمههى غل % ت ملغل امغ3 33دمههى ل ضغل امغىر دمسرفىل غش
دى دمههى ل دمه تس ل ممسرفىل ش غع دم تسبتيىر غش ت% 3 33صىمل م 33دمهت ل ح رلا ا ل
رأل دخسل دررا شىزدرل ع دم تسبتيىسش مل رل د أى د خس د يد دمههى ل دمه تس ل مغل
ى ل دمل د شل ضل دمسرفىل ش بىي م ك غ دمغ ى دى دمهه % امة دمتيدمال7 3% 3 1م مت
% ل3ل01صىمل م 930دمههى ل مل ت ملت امة ك در يد درخس ممههى ل مل رلا ا ل
د دمههى ل دمل د شل م مشىا دمتلر ا دم سدق يري ح ب لل لشسح ت ملل امة دم لرل الا:تنتا :
د شل ضل دمسرفىل ش مدم مغىر ذ دمف ىمشغل دم ىمشغل رغلد ضغل د دمههى ل دملت دململد دمهزى رح
دمتلر لل ىلت بمشل د يد دمههى ل ضل در رل دمهاى ح ممتلر ا صىرا دمهسضغة دمه غىمزش
لمىل
دمهى ل دمل د شل دمهت ل حلتدمههى ل دمل د شل مهاى دا دمتلر تدمتلر مفتاح الكلمات:
طب_جامعة النهرين/ مستشف الكاظمية التعليمي[فرع الباطنية ] كلية ال 49-41ص 2العدد 7م المجلد 2009المجلة العراقية للعلوم الطبية
درا:ة التنميط المناعي للخلايا اللمف اوية في الدم المحيطي للأشخاص المتعرضين للمجال الكهرومغناطيسي
رافد عبد الواحد
الخلاصة:
الملخصات العربية
8 المجلة العراقية للعلوم الطبية
دملردسغغغىا دملضغغغيث دمهشلد شغغغل درحغغغىر دم غغغملشل ممهزغغغىرا دحلتغغغت دم خشغغغس غغغ خلفي ة الدرا: ة:
دم أس ىيش شل دمهتيملح دبسدد دما ا دم غىما مفتغيي مغك دمتىلغل دم أسبى شل خميصغى
دمتىحشس امة دمزأىز دمه ىاا مق ى صشغج د دمهزغى دم أس ىيش غا رغة ي دمغة صغل ث خمغق
متغغغغىحشس غغغغا اهمشغغغغىا دمت غغغغىحس دمتهىراممفقرغغغغى دضغغغغضى ا ي غغغغىا دمزأغغغغىز دمه غغغغىاا أغغغغى د
دمه ىاشلدضى ل دمة دمتلدخك ع درتمىرا درمىردا دمفميرل ممفقرى دمه ىاشغلهى رغةحس سغملى غا
هشفل تمك دمفقرى دمه ىاشلل
دمتضسي ا تةحشس دمهزىرا دم أس ىيش شل دمهتيملح دبسدد دما ا دم ىما هدف الدرا:ة:
متىلل دم أسبى شل امة دمفقرى دممهفى رغل ممغلع دمهضشتغا مقمغفىص دمهت سضغش متمغك مفتيي مك د
دمهزىرا ل
ع تم دختشىر م ب غ ك ا غيد ا اش ل60 (رسرت اه دملردسل دمه ىاشل امة المواد وطرق العمل:
مفمى أم ت سضش ممهزى دم أس ىيش ا دم غىتذ غ دبغسدد دماغ ا دم غىما مفتغيي 33
دمتىلل دم أسبى شل ا غىيك سغ ى م صشغج تغم دختشغىر دم هغىذد غ حقحغل غىيك فتمفغل غ مك
مفمغغى رشغغس ت سضغغش 93ب غغلد تاغغه ت دملمغغلرىا صغغا دم غغل دمغغل رح غغامك تغغم دختشغغىر
هزهيال سشتسح ل
ر تاغغه ت دملردسغغل تضلرغغل دمه مهغغىا دمه ىاشغغل مفقرغغى دمغغلع دممهفى رغغل دمهضشتشغغل بىسغغت هى دختلغغى
دميشض دمه ىاا دمهلىمس
( imunofluorescence ) ممفقرغغى صشغغج تغغم غغا غغاه دملردسغغل دسغغتفلدع د ر غغىع دمهاغغى ح
غغامك تغغم CD3,CD4,CD8,CD21,CD56دمهفى رغغل دمتى شغغل دمتغغا تضهغغك دمه مغغم دمه غغىاا
ل CD4/CD8 ندم ف ا دم لل دمهليرل م
دضغغش غغا دمفقرغغى دمتغغا تضهغغك دمه مغغم دمه غغىاا دهأغغسا دم تغغى ذ رغغي د ففغغىض غغيي النت ائج:
(CD3, CD4, CD21 ,CD 56) ا ل دمهمىر ل غع دم غلل دمهليرغل متمغك دمفقرغى مغلل زهياغل
دختق غى (CD8)دمفقرغى دمتغا تضهغك دمه مغم دمه غىاا مغم ت أغس بش هىدم شس ت سضش م دم شتسح
دم شغغس دمفقرغغى مغغلل زهياغغل زهياغغل يرغغىه دضغغضىه ا غغل دمهمىر غغل غغع دم غغلل دمهليرغغل متمغغك
ىا ل دمهمىر غل بغش اغ دضغض ى ير ىد ففىض ت سضش م دم شتسح هى دضأسا دم تى ذ ري
مهزىشع دمهت سضغش ا غل دمهمىر غل غع تمغك دم غلل مغلل زهياغل CD4/CD8 ندم لل دمهليرل م
درصضىم
تخلغشا دمزأغىز دمه غىاا تغةتشسد دضغضى غا أس ىيش غا دمىرا دم تى ذ د ممهزى دم الا: تنتا :
امغة اهمشغىا دمت غىحس دمتهغىرا ممفقرغى دمه ىاشغ دمهفتمفغل هغى د ممهزغى مك خغق تغةحشسه ذ
دم أس ىيش ا تىحشسد دضضى امة دمهضس ىا دمفميرل بش دمفقرى دمه ىاشل صشج ر هغك دمهزغى
دمأس ىيش ا امة ت ششس درمىردا بش دمهضس ىا دمفميرل تضيرس ى هى رخس سملى امغة اهغك
دم ىع دمه ىاال
أس ىيش ا تدمفقرى دممهفى رل ت دمت هشا دمه أسيدمهزى دم:تاح الكلماتمف
[جامعة بغداد]كلية هند:ة الخوارزمي _ هند:ة الكيمياء الاحيائية فرع

الملخصات العربية
9 المجلة العراقية للعلوم الطبية
58-50ص 2العدد 7م المجلد 2009المجلة العراقية للعلوم الطبية يا بين العصبونات في الحبل الشوكي في اللبائندرا:ة كيمانسجية لخلا
علي عبد الستار الطائي
الخلاصة:
الملخصات العربية
10 المجلة العراقية للعلوم الطبية
ر ك دمتيزرع در شها مم ملي ىا ر غ (سىسغا ملردسغل دم مغيع دم مغلشل ل لغل خلفية الدرا: ة:
تهت ا اه دملردسل وهأغىر ىمشغل شغلر رزدا دم ىربي غشك بمسغت هى درلتغسد د غا بغى ز
يدستل بشيتسدا دم ى خي ا خقرى بش دم ملي ىا ممضلك دم ي ا ملأر بل ذمك ب
تهتمك خقرى ىبش دم مغلي ىا دمتغا ت غهة خقرغى رر غي ىمشغل دمتخلغشا دمغادتا الدرا: ة: هدف
مفقرى (مفى دمهضس ل ا دمضلك دم ي ا بىرضى ل دمة ذمك م اه دمفقرغى ت غتمم ور غىزدا امغلشل
مشى ممزأىز دم ملا دمتا تغةحس امغة در غى در ىسغشل مفقرغى (مفغى دمهضس غل (غى دمهسد ا دم
لبىمت ىر ( دمتخلشا و اد دمف ك لل رةحس امة ( دم اه دمفقرى مهى تميع ب هشفل صس شل
(خغا ا اش غىا غ دمهغى ح دم غ زىبشل ممضلغك دم غي ا غ ا غسح (رد غب غ دمه تمغل طريقة العم ل:
دم زارغغل لغغلايىا غغاه دم ش غغىا بيدسغغتل بشغغيتسدا دم غغى خي للغغك دمه ىمغغل درصغغيمشل -أسرغغلدم
بيدستل دمهزأس درمش تس ا دم ى ال م سض دمفضص
(هأغغسا دم تغغى ذ ىمشغغل دهضغغل تلىر غغل غغا تغغسق دمفمشغغل دمهمتلردا دم غغل ل دمأميرغغل ج: النتائ
بش دم ملي ىا دمتا تم ضمأى بيدسغتل دمهزأغس ىدمف ل امك ا دمأميي دمهضشا بى يدح ممفقر
درمش تس ال
متمش دمفقرى دمهيملح ذدا دمتسدز ا در ل درخشسح (مغىرا دمغة خقرغى و وست هى الأ: تنتا :
(سىسا غا دم غشتسح ىبش دم ملي ىا ا دمهى ح دم زىبشل مم فى دم ي ا ل د مأاه دمفقرى ر
م ى غت درد رغغل ( د ىسغشل غ خغغق دمتغىحشس امغة خقرغغى (مفغى بشتغغى امغة صس غل دم اغغقا سغيد
دمهضس ل ( سشتسدا دمهسد ا دم مشى ا دملىغل (هأسا دم تى ذ تلىر دهش مف ىمشغل شغلر رزدا
ص غب 3 9دم ىربي شك بىسغت هى بشغيتسدا دم غى خي غا غاه دمفقرغى بىر غى تمغ شفأى دمغة
ر رارئ رش ا ا ت ي دم يلك دم ملشللدمف ىمشل ىمأى
دمضلغك بشغيتسدا دم غى خي رى ىبش دم ملي ىا هغىا در هغىي دمهس ارغل خق مفتاح الكلمات:
.دم ي ا
]لنهرينا جامعة-كلية الطب[ تشريحفرع ال
66-59ص 2العدد 7م المجلد 2009المجلة العراقية للعلوم الطبية و الربو القصب اتلايا الحمضخالمستخلص من الذيف ان العصب درا:ة العلاقه بين
3,عامر النجار 2,نضال عبد المهيمن 1شهاب أحمد لافي
الخلاصة:دمارفى دم ملة دمه تفمص خقرى دمضهاىا ر تهل ة ردسغل غىي ىمشغل خلفية الدرا:ه:
ضة دمسبي دممملةل اه دمفقرى امك ة تىب ل دمف ىمش درمتأىبش ة س
الملخصات العربية
11 المجلة العراقية للعلوم الطبية
ىاغغغ خقرغغغى دمضهاغغغدمغغغارفى دم مغغغلة دمه غغغتفمص ردسغغغل دم قلغغغ بغغغش ه دف الدرا: ه:
دمسبيددممملال
هسضغغة م خقرغغى دمضهاغغىا غغ EDNمدمغغارفى دم مغغلة دسغغتفمص لم واد و طرائ ق العم ل:ا
لدرسرغغغت ردسغغغل دمف ىمشغغغ (eosinophilic leukemiaبىبشاغغغىض دمغغغلع دمضهاغغغة مغغىبش
هى درسل دختلىر درمشاد دمهلىمس ممتى ل غ رغي در غىع تفمص امة دررد بل شير مأاد دمهدمض
ىمسبي دممملةلب مىبش اى ه م ة د ردر سضة
هأير داسدض ى ر هة ب ى سح غير امغة دصغل در لغة دمتزسبغ خغق بش ت دم تى ذ :ج النتائ
رل ملد مشاد ىر ليسدف ب أىرل دمشيع دمفىسلدى دختدمشيع دمخى ة ممضم د تأت بىم مك دم مة مق
د تس شغغا دمغغارفى دامغغة غغة د ردر دمهمغغىبش هغغى غغي غغة زهياغغل دم غغشتسه ى غغت دمفس لغغىا
ردر سضغة دمسبغي دمهمغضيب بفهغذ ب تغسي بش تس شغاه غة د مم رقصظ سق يي ير ل
رشس دمهمضيب بفهذ ل ه شس
دراتهى امة ردسل ري دمغارفى غة در ردر غة دمتضغسل تىب غل سضغة ره الا:تنتاجات:
دمارفى دم مغلىمفقرى دمضهاغىادمسبي دممملة مفتاح الكلمات:دمسبي دممملةل
لد مشادىر لدخت
الأنبار [جامعة _ ] كلية طب فرع الأحياء المجهرية 1 [جامعة النهرين _ كلية طب ] فرع الأحياء المجهرية 2 [المستنصريهجامعة ال _ ] كلية طب فرع الأحياء المجهرية 3
74-67ص 2العدد 7م المجلد 2009المجلة العراقية للعلوم الطبية طبيعية : بياناتالأصحاءالتوصيل العصبي للعراقيين درا:ة
فرقد بدر حمدان
:خلاصةال زام ضيص دمف مزل دم ملشل دمتس شلت ا دتلد دم ملا دمتيصشك ردسل خلفية الدرا:ة:
ممتةررخ دمفضص دم سرسيل ا فشغلح رغلد غا غك غ تضلرغل غى د صغىبل تضمشغك دمضىمغل
دمهسضشلل
الملخصات العربية
12 المجلة العراقية للعلوم الطبية
دممضفغا دم غىبع دامغىب د يغسدف م مغبم مزشل يلش شغلبشى ىا أس و ىم :الدرا: ة هدف
غع دملشى غىا دمه غيرح غا تأغىمىر شش اغسدلمغلل (صغضىم غىختلىرتا ر شع ددم فمة دم دم مشى
لد بشىا
مفمغى 99307 غا دم غفمة دم مشغى د امغىب ملأيغسدف تيصغشك ل(رسرت ردسغ :ة العم لقيطر
س لل 89 مأسر دمار تتسد س (اهىر م بش سيرى
سغ يدات 96دمفلل دم هسرغل (لغك غ دمفلىا دم هسرلل ا تضمشك بشى ىا فممل مهفتمفتم ج: النتائ
دمضس شغل تغلررزشى غع دمتمغلع غا دم غ ل غا دمض غشل ملأامغىب زرغى ح سغساىا دمتيصغشكميصظ
دمتمغلع غا دم غ ت سسال تيصشك رهشع د امىب ع ت ا سصمل دملميغت د ففا لت رصكت
(خسل دم سدلشش تى ذ دمهمىر ل بش تهت ل دم فمشش م ميرش دمتس ش د اد دضش ا ك
لرهشع ( ضىم دم ىمم
م مشى دد امىب دمتس شل دم مب دممضفا دم ىبع تيصشكيلش ا م تم و ىم شىر الا:تنتاجات:
لدمض غغشد امغىب دختلغغىر امغغة دم هغيع ( غا دم غسدقل فتلغغس تفتغشا د امغغىب غا دم غفمة
دم ىمهشلل دمهيري ح ز ى مم ىرل مىر ل ع دملشى ىال ى دمضس ش
لدم سدلشش ت امىبت سسال دمتيصشكددم فمةت دم مشى يسدفد :الكلماتمفتاح
الفسلجة ] كلية الطب _ جامعة النهرين [ فرع
92-75ص 2العدد 7م المجلد 2009المجلة العراقية للعلوم الطبية يدية في علا الزوائد اللحمية للأنف جراحة الجيوب الناظورية بالمق ارنة مع الطرق التق ل
والجيوب الغربالية مع الأختلالات الأنفية المصاحبة
هيوا أ:عد عبد الكريم :خلاصةال
ت غغفة - غا ل غم د غف د ذ دمض زغسح (رسرغتمىر غل سغسرسر ردسغل غاه خلفي ة الدرا: ة:
ل 3667دمخى ا م ىرل د ت سر 3660دم مشهى شل دمت مشها د اب
الملخصات العربية
13 المجلة العراقية للعلوم الطبية
اه دملردسل مهمىر ل تةحشس تى ذ رسدصل دمزشيب دم ىهيررل بىمهمىر ل ع (رسرت هدف الدرا:ة:
دمتسق دم ممشلرل ا اقد دمهسضة دمهمغىبش بىما د غل دممضهشغل دمتغا ت تلغس غ د خغس د تفىخغىا
د فشل مشياىل
سغغ ل 73دمغغة 93اهغغىر م بغغش مغغهمت اش غغل دملردسغغل خه غغي سراغغى تتغغسد س د طريق ة العم ل:
مىبي بىما د ل دممضهشل د فشل حقحي أم ايمزيد بىمتسق دمزسدصشل دمتممشلرل ا س غ أم
ايمزيد بزسدصل دمزشيب دم ىهيررللتم تىب ل دمهسضة ب غل درغسدم دم همشغىا دمزسدصشغل بىسغتفلدع
6 ىرشس د اسدض دمهسضشل دمفضيصىا دم ىهيررل
رسدصغغل دمزشغغيب دم ىهيررغغل د ا دمغغة تض غغ د اغغك غغا د اغغسدض و دم تغغى ذ (هأغغسا ج: النتائ
اغغغقد د خغغغتقرا د فشغغغل دمهمغغغىصلل غغغع د ففغغغىض غغغلل دمه ىافغغغىا غغغلل ت غغغسدر دمضىمغغغل
دمهسضشلل
رأل دخسل تتتمب رسدصل دمزشغيب دم ىهيررغل خلغسح اىمشغل لغت د خغس رسد أغى غ
دمتسق دمتممشلرلل
دست تز ى دملردسل د رسدصل دمزشيب دم ىهيررل د اك دمتسق دمزسدصشل دمتممشلرل :الا:تنتا
ا اقد دما د ل دممضهشل د فشل أى ت تا زى رؤرى دلسب ع دضىمح د اك ع دميصي دمة
يضغغع دمفمغغك ب غغ ك د غغك د د خغغتقرا دم شغغس هغغى سح ه غغ دميصغغي دمشأغغى اقرأغغى د
ت سدر صل ث دمضىمل دمهسضشل لتأى دلكلدمهاىافىا
رسدصغغغل دمزشغغغيب دمتممشلي دستلمغغغى دما د غغغل دممضهشغغغل د فشلدما د غغغل دممضهشغغغل :الكلم اتمفت اح
لدم ىهيررل
مستشف السليمانية التعليمي-الأنف والأذن والحنجرةفرع
103-93ص 2العدد 7م المجلد 2009المجلة العراقية للعلوم الطبية فرط ضغط الدم الرئوي عند المصابين بالعجز الكلوي المزمن
جواد كاظم مناتي
:خلاصةال
سي ض ا دملع دمس يي ريرل ا ل دمهمىبش بىر لد دمس غيي دمهغا (غسدض خلفية الدرا:ة:
دمتمشف دمس يي امك (سدض رلدر دممفص دمملريل تلش ( دمهمىبش بىم زا دم ميي ر ى ي
ض ا دملع دمس يي دماي رة ي ومة ازا دمممب مامك ت أس (اسدض ضشك دمت فسل سي
الملخصات العربية
14 المجلة العراقية للعلوم الطبية
تألف اه ملردسل متمششم لرا د ت ىر سي ض ا دمغلع دمس غيي ا غل دمهمغىبش هدف الدرا: ة:
بىم زا دم ميي للك دمللم بىملرى دمليي (ح ىم دملرى دمغليي غع بضغج اغ دم يدغك دمتغا تغة ي
دملع دمس يي ل ومة زرى ح سي
تاغغه ت دملردسغغل ى غغل غغسرض مغغىبش بغغىم زا دم مغغييل خه غغي تضغغت دم غغقد طريق ة العم ل:
لتم تمششم 3661دمة 3661دمتضف ا بل ر ك ميي خه ي ر ىمزي بىملرى دمليي اىع
لرا د ت ىر سي ض ا دملع دمس يي ب ك دسغتلىلا غتفلش تمغيرس دمممغب بغى يدد غيق
ميتشل دمل بمس ورسدم ضيصىا دملع خق لل دمأشهي ميبش دملس تش دمشيررى ىم شيع دم 03تم ت فشص درتفى ض ا دملع دمس يي ا ل دمهمىبش ب زا دم مغة دمها م(امغة غ ج: النتائ
سراى ر غىمزي 93سرض ر ىمزي بىملرى دمليي 39% سراى ل00م 00مم/ز لما ا ل
د دمتضف ام بل رماح بىم ق
ت شس اه دملردسل ررتفى لرا د ت ىر سي دما ا دمس يي ا ل سضة دم زغا الا: تنتاجات:
دم ميي دمها دماس ري دم ف دمهل س مأاه دمهاغىافىا بأغلف تفغى ي دم يدلغب دمهتستلغل
امة ذمكل
رى ت بمسدمل للك سي ض ا دمم دمس ييت دملرى دمليي ت :الكلماتمفتاح
فرع الباطنية_شعبة الديلزة] كلية الطب_جامعة النهرين/ مستشف الكاظمية التعليمي[
108-104ص 2العدد 7م المجلد 2009المجلة العراقية للعلوم الطبية في الق اطنةفي الخلايا الفضةعلم الشكل)مورفومتريه( للتغيرات في صبغه نترات درا:ة
مع التقدم بالعمر ةالهيكليالعضلات
كريم هدى رشيد, ي ف اضل ماجد الحبيبم
:خلاصةال
تملع دم هغس تةحشسدا و بتملع دم هسل تتةحس د ز دمز م دمتا دمأش مشلدم اقا خلفية الدرا: ة:
مم تتم ردستأى بىمسبا ع صل ل تسدا دمفالل دمأش مشل ا دم اقا
الملخصات العربية
15 المجلة العراقية للعلوم الطبية
غا صغل دمأش مشغلتمغلع اهغس دم اغقا تغةحشسداشش تألف متيضغ دملردسل اه :الدرا:ةهدف
بىستفلدع امم دم ك يسرمل دم لل دمفال تسدا
رسذ دما ير رب ش دمتيرمل ملأصىبع دملىستل دم امل هىذد ردسلتهت طريقه العمل:
مغةومأسدل صاسا ليدمغب مغه ش غ دم هغىذد لت غت 91 ومةريى 37تتسد س بش بةاهىر
ل تغم تضمشغك دم تغى ذ دمفاغل ىر س ل دستفلت غاه دم غسد ش ممغل تغسدا 0-3ب هك م مسد ش
بىسغتفلدع بس غىذ دمفاغلا يسرك دصت غىب اغل دم يرغىا ممفمشغل دمهمغتل ل بمغل تغسدا
دم غغىك دمخغغى ا دمغغاي شغغ رغغتم ربغغا دمهزأغغس بزأغغىز يلشغغيتس تغغم تضمشغغك (مهفتلغغسيمدمتمغغيرس
س رتأىل دم يدح ضشا دم يدحتا تسل خق دمهزأس دصت ىب تم دممير دم
اغل (امغة دممغل لاىمش دتزىه (مف در ير (هأسا دمير حمضلرخا دم هسرل دمهزهيال ج: النتائ
دمفالتسدا دم يرىا مهمل
مغغىي صغغ شسهل تم هأغغسا در يرغغ دممغغل للمغغت درمفغغ دتزغغىه دملىم غغل دم هسرغغل دمهزهياغغل
تهششا ل اىمش در ير ا دمهمتع دميدصلل
امغة صغل دم غيدح تضتغيي مضيهغلبميره دممل ل خى للمت دم لشسح دم هسرل دمهزهيال
س ر ل امل فس ح دمفال تسدا
دمأش مشل ا دم اقا دممىي لممفقرى دمفال ا صل تسدا أهل ىمك دختق ىا الا:تنتاجات:
غغع تمغغلع دم هغغس ت أغغس غغ خغغق رغغي غغىيىا د م غغىش دمتىب غغل دمفقرغغى دم اغغمشلم در يرغغ
ضشتأى س رتأى ل دم يدحدمهت شسدام تم ىمشل
لدمفال صل تسدا دمأش مشلدم اقا مفتاح الكلمات:
]رينلنها جامعة_كلية الطب[شعبة الأنسجة والأجنة _ تشريحفرع ال
115-109ص 2العدد 7م المجلد 2009المجلة العراقية للعلوم الطبية توازن العناصر الضئيلة لدى الحوامل المصابات بارتف اع ضغط الدم
)قبل الشنج(
ف يص ل غ ازي الربيع ي
:خلاصةال
ا دملع ر أس ض درتفى ض ا دملع دم ىما ملل دمضيدك مللك دم ذ ي ي خلفية الدرا:ة:
لل شىا اىضل اىمشتش ؛ غع ذمغك ومة(ح ىم دمضهك ي دمهاىافىا دم ى ل دمهة رل
ل دمه تشغىا صغي (تغاد غى دمغلع دم ىصغس دماغلشمل خىصغل عرشغس مغيسلب اد دررتفغى
الملخصات العربية
16 المجلة العراقية للعلوم الطبية
شيع دم ىم غغغ (ري غغغىامغغغامك غغغة صىمغغغل وضغغغى لدرري غغغىا دمهيرلغغغل (ح غغغىم دمضهغغغك ت تلغغغس ت ىلاغغغل؛
ض ا دملع دمهمىصب ممضهك للغك دم غ ذ درتفى دمه ش شيع دمضسح خق دمضهك اىافىت م
مم تيصف ب ك ىكل
بشى ها دمه غى مدم ىم غشيع دمه ش غشيع دم ىصغس دماغلشمل مدمفىرصغش :الدرا: ةهدف
ع دمضهك دمتلش ال دم ضىا ا صىمل درتفى ض ا دملع دمهمىصب ممضهك مللك دم ذ اقلت
اه دملردسل ا ردسل مت شل ت هك لشىا دمه غى مدم ىم غشيع دمه ش غشيع مغلل طريقة العم ل:
ومغة تغم تمغ شفأم درختلغىرصىق مىبل بىرتفى ض ا دملع دمهمىصب ممضهغك مزهياغل 06
زهياتش ص ب اهس دمضهك:
مللك دم ذ خق دمفمك دمخى ا دمضهك صيدك مىبىا بىرتفى ض ا دملع دمهمىصب ممضهك
سرال ل 06مدم ل
صيدغغك مغغىبىا بىرتفغغى ضغغ ا دمغغلع دمهمغغىصب ممضهغغك مللغغك دم غغ ذ خغغق دمفمغغك دمخىمغغج غغ
سرال ل 06دمضهك مدم ل
صىمغغل سغغمشهل ه هى سرى مزهياغغل دم غغشتسح ت تغغم تم غغشم 06تهغغت مىر غغل دم تغغى ذ غغع تغغى ذ
زهياتش : ومةهى د امة اهس دمضهك زهيال دم شتسح دات
سرال ل 06صيدك صضشضىا هى سرى خق دمفمك دمخى ا دمضهك مدم ل
سرال ل 06صيدك صضشضىا هى سرى خق دمفمك دمخىمج دمضهك مدم ل
(هأسا ت شسد ا ميدر دمهمك دم ىصغس دماغلشمل مغلل دمضيدغك ذ دا ضغ ا دمغلع ج: النتائ
ىما دمهمغغىصب ممضهغغك مللغغك دم غغ ذ ر غغهك د ففىضغغى يرغغى مه غغتيل دمه ش غغشيع دم ىم غغشيع دم غغ
دمهمضش ملأمليش ا دملع ت د ففىضى ا دمفىرصش دمهستلا بىرتفى يي مه تيل دم ضغىا
ا مك دمضيدك دمهسراىا ملل مىر تأ بهزىشع دم شتسح دمه ىهسحل
ا دم ىما دمهمىصب ممضهك مللك دم ذ ر ى ش دختق صىمل دمضيدك ذ دا دماو الأ:تنتا :
تغغيدز غغى دمغغلع دم ىصغغغس دماغغلشمل ا غغل مغغىر تأ غغغع دمضيدغغك دممغغضشضىا دمه غغغىهسدا
ممهسراىا ا دم هس لح دمضهكل
رهشغغع دمضيدغغك دمهمغغىبىا بىرتفغغى ضغغ ا دمغغلع دمهمغغىصب ممضهغغك مللغغك دم غغ ذ ى غغت مغغلرأم
هى رغل تة لرىه ورأى دتا تخلا تيسع در اشل دمليرل تارل د ملىضأى تضلث ب ض دم يدك دم
امة اد ري د ففىض يي ا تيل دمه ش شيع دمضسمدماي ر تلس ضس ررى ممضفغىه امغة
د ل ىي دمياىم دمليي دم ىم شيع دمضسمدماي ر تلس ضغس ررى مت غير د غشل دم تسرغك دمه غتك
شل دمليرل (رتفى دم ضىا مدماي ريمل د يداغى غ در غزل دم غلرلح دمتفىاغك بتى ل در ا
ع د ففىض دمفىرصش مدماي ر تلس ضس ررى هى ح مى ل ممتى ل ل
للك دم ذت دم ىم شيعت دمه ش شيعت دم ضىات دمفىرصش ل مفتاح الكلمات:
[معة النهرينجا _ كلية الطب] فرع الكيمياء و الكيمياء الحياتية
الملخصات العربية
17 المجلة العراقية للعلوم الطبية
123-116ص 2العدد 7م المجلد 2009المجلة العراقية للعلوم الطبية " حالة تقرير" ورم الجوف القحفي التصادفي
ز عبد المجيد عبد العزيز القزاز معت
خلاصةال
تهغت دصمتأغى غ للغك خه غش اىغى بم غت غ دم هغس حدغس( (رسرت ردسل اه دمضىمل امة رخغل
غى أل دمتب دم لما بل لد ضىمغل غىح بضغى ث يسرغك م غسض ت غسرضأى ومة دمضمشمشلدمزأىا
غ تأى دممضشل للك دمي ىح سىملى داتهى د امغة ميغىا تغم دمضمغي امشأغى مدمتىررخ دمهسضا مضى

الملخصات العربية
18 المجلة العراقية للعلوم الطبية
ا ا غل لىاغلح (هأغس دمت غسرش دمتلغا دم غلما درصغيما رغي رع غا دخغك دمزغيف دممضفغذ رأى
دم شزا مميرع تلش د رع سضى ال (مهزأسيدمفضص ورسدمدملىغ ب ل
رع دمزيف دممضفا رع سضى ا ت سرش دمزخل رع دملىغل مفتاح الكلمات:
[جامعة النهرين _ كلية الطب] الطب العدليفرع
128-124ص 2العدد 7لد م المج 2009المجلة العراقية للعلوم الطبية