IR presentation Q1/2014 - BAUER€¦ · 2013 2014 2015 3m 2015 3m 2016 409 300 383 318 1,504 1,402...
50
BAUER AG Group Presentation First Quarter 2016
Transcript of IR presentation Q1/2014 - BAUER€¦ · 2013 2014 2015 3m 2015 3m 2016 409 300 383 318 1,504 1,402...

© BAUER AG, D-86529 Schrobenhausen 16-05-13 IR-Presentation_Q1_2016
BAUER AG
Group Presentation
First Quarter 2016

© BAUER AG, D-86529 Schrobenhausen 16-05-13 IR-Presentation_Q1_2016 2
Key Figures Q1 2016
Q1 2015
in EUR million
Q1 2016
in EUR million
∆ Q1
in %
Total Group revenues, of which
- Germany
- International
- Construction
- Equipment
- Resources
- Other/Consolidation
409.1
124.1
285.0
193.5
173.8
54.3
-12.5
383.2
137.2
246.0
159.9
165.0
71.5
-13.2
-6.3 %
+10.6 %
-13.7 %
-17.4 %
-5.1 %
+31.9 %
n/a
Sales revenues 299.6 317.6 +6.0 %
Order intake 494.6 388.6 -21.4 %
Order backlog 848.2 1,001.0 +18.0 %
EBITDA 24.2 27.4 +13.0 %
EBIT 1.2 4.8 n/a
EBIT margin in % (of sales revenues) 0.4 1.5 n/a
Earnings after tax -8.6 -9.6 n/a
Earnings per share in EUR -0.52 -0.59 n/a
Equity ratio in % 24.0 24.7 n/a
Number of employees (average over the year) 10,593 10,634 +0.4 %

© BAUER AG, D-86529 Schrobenhausen 16-05-13 IR-Presentation_Q1_2016 3
Total Group revenues decreased by 6.3 % from EUR 409.1 million to EUR 383.2 million. This drop is the result of a
decrease in the changes in inventories and other income. Sales revenues, on the other hand, increased by 6.0 % to EUR
317.6 million. EBIT increased from EUR 1.2 million to EUR 4.8 million. Earnings after tax amounted to EUR -9.6 million
(previous year: EUR -8.6 million) and was primarily impacted by increased tax effects.
Total Group revenues for the Construction segment were 17.4 % lower at EUR 159.9 million. The start-up phases of
some major projects were delayed and the previous year's figures have not been reached as a result. EBIT therefore
decreased from EUR 4.9 million to EUR 1.0 million. We expect to catch up during the course of the year due to progress
made on the projects and the size of the projects to be processed.
Sales revenues of the Equipment segment grew by 7.3 %, from EUR 100.5 million to EUR 107.8 million. EBIT increased
from EUR -0.9 million to EUR 5.9 million year-on-year. Some large and special machines were delivered at the beginning
of the year resulting in these increased earnings.
Total Group Revenues of the Resources segment amounted to EUR 71.5 million, 31.9 % up year-on-year (EUR 54.3
million). EBIT came to EUR -1.6 million (previous year: EUR -2.9 million). The segment's performance at the beginning of
the year was considerably better than last year, mainly due to major projects in the environmental business. The
situation remains difficult on account of the poor exploration and water drilling business.
Order backlog of the Group increased by 18.0 % year-on-year from EUR 848.2 million to EUR 1,001.0 million. This growth
is mainly due to the Construction and Resources segments.
Forecast for 2016 unchanged: total Group revenues of around EUR 1.65 billion, EBIT of around EUR 75 million and
earnings after tax of around EUR 20 to 25 million.
Main topics
Key Figures Q1 2016
© BAUER AG, D-86529 Schrobenhausen 16-05-13 IR-Presentation_Q1_2016 4
Table of Content
BAUER Group – Strategy, Chances & Markets
Appendix
Financials Q1 2016 & Guidance

© BAUER AG, D-86529 Schrobenhausen 16-05-13 IR-Presentation_Q1_2016 5
The BAUER Group is a leading provider of services, equipment &
products dealing with ground and groundwater.
Mission
Strategy
The world is our market.
Global network organization with flexible, decentralized management.
Three forward-looking segments providing high level of synergies:
Construction, Equipment, Resources
World market leadership for foundation technology.
Powerful development of drilling applications and services
for related markets.
Highly innovative products and services related to water, environment
and natural resources.
Bagatelle Dam project – Mauritius
BAUER Group Mission & Strategy
EUR 1.66 billion total Group revenues
EUR 90.7 million EBIT
6.6 % EBIT margin
27.2 % equity ratio
10,738
employees FY 2015
Key targets
Revenue growth: 3 - 8 % per year
EBIT margin: 7 - 9 %
Equity ratio: > 30 %

© BAUER AG, D-86529 Schrobenhausen 16-05-13 IR-Presentation_Q1_2016 6
BAUER Group The three segments
Construction Equipment Resources
Market leader in specialist
foundation equipment
New products for mining, deep
drilling and offshore drilling
80 % of sales abroad
Full year 2015:
43 % of total Group revenues *
EBIT margin: 18.1 % *
Key targets:
~ 40 % of total Group revenues
EBIT margin: 10 - 12 %
Global provider for specialist
foundation engineering services
Focus on complex, international
projects
~ 50/50 infrastructure / industrial
Full year 2015:
44 % of total Group revenues *
EBIT margin: 2.1 % *
Key targets:
~ 40 % of total Group revenues
EBIT margin: 4 - 6 %
Products & services related to
water, environment and natural
resources.
Service provider for the oil, gas
and mining industry
Full year 2015:
13 % of total Group revenues *
EBIT margin: n/a *
Key targets:
~ 20 % of total Group revenues
EBIT margin: 6 - 8 %
* Figures include positive and negative exceptional earnings in all segments

© BAUER AG, D-86529 Schrobenhausen 16-05-13 IR-Presentation_Q1_2016 7
Note: from 2003 based on IFRS figures
Total Group Revenues Longstanding healthy business development
in EUR million (segment after deducting Other/Consolidation)
Equipment
705
Construction
Overseas
551
Total 1,656
Construction
Domestic
182
Resources
218 1,600
1,000
1,400
800
600
200
0
1980 1983 1985 1987 1997 1999 2001 2003 2005 2007 1991 1989 1993 1995 2009 2011 2013 2015
1,200
400
1,800

© BAUER AG, D-86529 Schrobenhausen 16-05-13 IR-Presentation_Q1_2016 8
Permanent Offices:
Construction
Equipment sales
Resources
Equipment production
Schrobenhausen 2.027
Kuala Lumpur 129 Conroe 156 Tianjin 215
Worldwide network More than 110 subsidiaries in about 70 countries

© BAUER AG, D-86529 Schrobenhausen 16-05-13 IR-Presentation_Q1_2016 9
BAUER Group Challenges of the world provide chances for the company
Urbanization Infrastructure Water
Environment Energy / Oil & Gas Values
The megatrend urbanization leads to
more complex inner-city solutions
High demand for new infrastructure and
for restoration of existing structures
Changing social values influence the
working and corporate environment
The pollution and contamination of soil
require innovative purification solutions
Energy and resource scarcity provide
chances for underwater and deep drilling
The shortage of clean drinking water
is one of the worlds biggest problems
© BAUER AG, D-86529 Schrobenhausen 16-05-13 IR-Presentation_Q1_2016 10
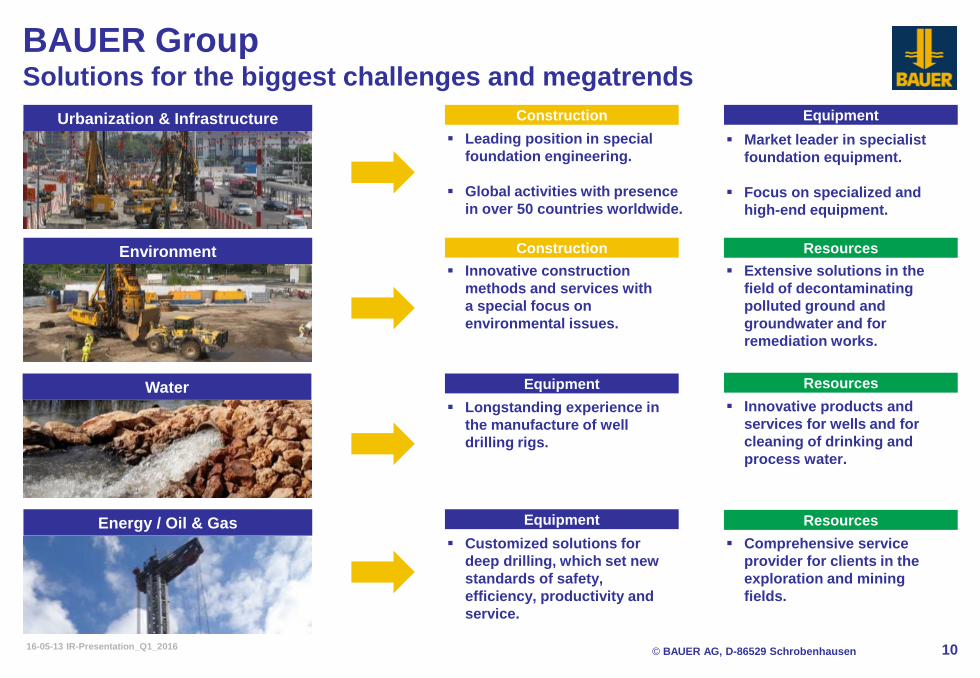
BAUER Group Solutions for the biggest challenges and megatrends
Urbanization & Infrastructure
Water
Environment
Energy / Oil & Gas
Leading position in special
foundation engineering.
Global activities with presence
in over 50 countries worldwide.
Construction Equipment
Resources
Market leader in specialist
foundation equipment.
Focus on specialized and
high-end equipment.
Construction
Innovative construction
methods and services with
a special focus on
environmental issues.
Extensive solutions in the
field of decontaminating
polluted ground and
groundwater and for
remediation works.
Equipment Resources
Longstanding experience in
the manufacture of well
drilling rigs.
Innovative products and
services for wells and for
cleaning of drinking and
process water.
Equipment Resources
Customized solutions for
deep drilling, which set new
standards of safety,
efficiency, productivity and
service.
Comprehensive service
provider for clients in the
exploration and mining
fields.

© BAUER AG, D-86529 Schrobenhausen 16-05-13 IR-Presentation_Q1_2016 11
BAUER Group Chances
Construction Equipment Resources
Growth potential in new markets
and with specialized machines.
Manufacture of customized deep
drilling solutions, which set new
standards of safety, efficiency,
productivity and service.
Powerful duty-cycle crane series,
which entered new markets.
Innovative offshore equipment for
the foundation of wind farms and
tidal turbines.
Growing construction markets
worldwide.
Huge pent-up demand in
developed countries and in
emerging markets.
Specialist foundation grows
somewhat stronger than
construction markets.
Construction segment with
considerable number of major
projects currently under
construction and tendered for
worldwide.
Full-service provider for products
and solutions related to water.
Ground-breaking projects in the
field of cleaning drinking and
process water, e.g. a biological
water treatment plant in Oman.
Promising opportunities due to
its focus on growth markets
water, environment and natural
resources.
High expertise in exploration and
mining services for the resources
water, oil, gas and geothermal
energy.
© BAUER AG, D-86529 Schrobenhausen 16-05-13 IR-Presentation_Q1_2016 12
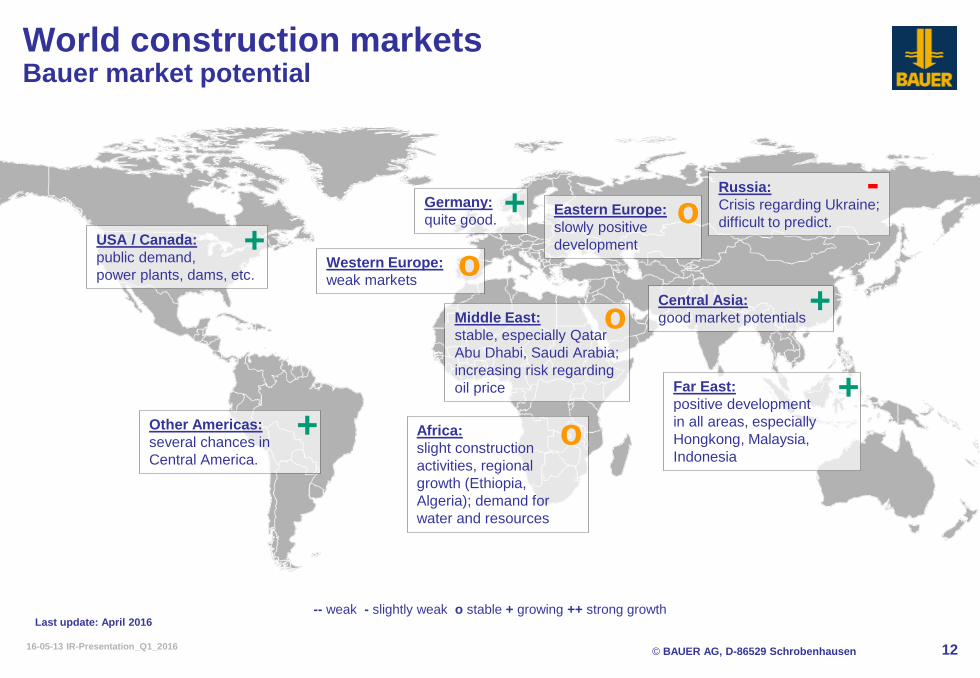
World construction markets Bauer market potential
USA / Canada:
public demand,
power plants, dams, etc.
+
Other Americas:
several chances in
Central America.
Africa:
slight construction
activities, regional
growth (Ethiopia,
Algeria); demand for
water and resources
+ o
Far East:
positive development
in all areas, especially
Hongkong, Malaysia,
Indonesia
+
Western Europe:
weak markets o
Germany:
quite good. + Eastern Europe:
slowly positive
development
Russia:
Crisis regarding Ukraine;
difficult to predict.
Middle East:
stable, especially Qatar
Abu Dhabi, Saudi Arabia;
increasing risk regarding
oil price
Central Asia:
good market potentials +
-- weak - slightly weak o stable + growing ++ strong growth
o -
o
Last update: April 2016

© BAUER AG, D-86529 Schrobenhausen 16-05-13 IR-Presentation_Q1_2016
China
Source: International Monetary Fund, World Economic Outlook Database, April 2016 * CIS = Commonwealth of Independent States (incl. Georgia; excl. Russia)
United States
European Union
Brazil
CIS*
Germany
Middle East &
North Africa
Sub-Saharan Africa
World Advanced
Economies
Emerging Markets &
Develop. Economies
Russia
Australia
2016 2017
2016 2017
2016 2017
2016 2017 2016 2017 2016 2017
2016 2017
2016 2017
2016 2017
2016 2017
2016 2017
2016 2017
1.9 2.0 3.2 3.5
2016 2017 4.1 4.6
2.4 2.5
-0.5 1.5
-3.8 -0.1
1.8 1.9
3.0 4.0
2016 2017
3.1 3.5
-1.1 1.3 2016 2017
6.4 6.3
6.5 6.2
2.5 3.0
Developing Asia
Latin America
1.5 1.6 -1.8 0.8
Global economic situation IMF projection of the real annual GDP growth in %
13

© BAUER AG, D-86529 Schrobenhausen 16-05-13 IR-Presentation_Q1_2016 14
Table of Content
BAUER Group – Strategy, Chances & Markets
Appendix
Financials Q1 2016 & Guidance

© BAUER AG, D-86529 Schrobenhausen 16-05-13 IR-Presentation_Q1_2016 15
1,800
1,350
900
450
0
2015 2016 2014 2013
Q1
Q2
Q3
Q4
349
456
351
329
1,485
Financials Revenues, earnings & orders – Group
Revenues
Earnings
Order backlog
Order intake
in EUR million
in EUR million in EUR million
in EUR million Total Group revenues Sales revenues
EBIT Earnings after tax
334
424
421
342
1,521 +2.5 % 100
75
50
25
0
-25
1,000
750
500
250
0
494
+19.1 %
405
550
1,811
362
2015 3M 2015 2014 2013 3M 2016
409 300
383 318
1,504 1,402
1,560
1,376
1,656
1,379
2015 3M 2015 2014 2013 3M 2016
765.2
995.6
848.2 762.7
1,001.0
389
-21.4 %
30.1
76.4
-19.4
15.7
1.2 -8.6
2015 3M 2015 2014 2013 3M 2016
90.7
29.0
4.8 -9.6

© BAUER AG, D-86529 Schrobenhausen 16-05-13 IR-Presentation_Q1_2016 16
Revenues
Earnings
Financials Revenues, earnings & orders – Segments
Order intake
Order backlog
in EUR million
in EUR million in EUR million
in EUR million Construction Resources Equipment Construction Resources Equipment
FY 2015 FY 2014
682 878 +28.7 %
-4.1 %
677
649
219
345 +57.3 % 1,521
1,811
Construction Resources Equipment
Q1 2016 Q1 2015
513 585
+13.9 %
-20.0 % 162
129
173 287
+65.7 % 848
1,001
Construction Resources Equipment
Order book (in months)
Group
Construction
Equipment
Resources
7.6
9.4
2.3
15.5
The totals include Other/Consolidation
Q1 2015 Q1 2016
495
389
153
256
166
177 82
-40.0 %
-6.0 %
+10.4 % 74
726 743 +2.4 %
+17.8 %
639 753
253 222
-12.3 % 1,560 1,656
FY 2015* FY 2014* Q1 2015 Q1 2016
193 160
174 165
54 72
-17.4 %
-5.1 %
+31.9 %
409 383
EBIT 4.9 1.0 26.0 13.9
EBIT margin (in %) 3.1 0.7 4.0 2.1
EBIT -0.9 5.9 36.0 99.4
EBIT margin (in %) n/a 5.5 6.7 18,1
EBIT -2.9 -1.6 15.9 -19.8
EBIT margin (in %) n/a n/a 8.1 n/a
FY 2014* Q1 2016 Q1 2015 FY 2015*
* Figures include positive and negative exceptional earnings in all segments

© BAUER AG, D-86529 Schrobenhausen 16-05-13 IR-Presentation_Q1_2016 17
Financials Regional breakdown – Total Group revenues FY 2015
in EUR million
Total 1,656
in EUR million
Africa 62 (4 %)
Americas 172 (11 %)
Asia-Pacific,
Far East & Australia
377 (24 %)
Middle East
& Central Asia 232 (15 %)
Germany 440 (28 %)
EU excl. Germany
152 (10 %)
Europe (other)
125 (8 %)
Total 1,560
Full year 2014
Africa 77 (4 %)
Americas 297 (18 %)
Asia-Pacific,
Far East & Australia
348 (21 %)
Middle East
& Central Asia 227 (14 %)
Germany 474 (29 %)
EU excl. Germany 162 (10 %)
Europe (other)
71 (4 %)

© BAUER AG, D-86529 Schrobenhausen 16-05-13 IR-Presentation_Q1_2016 18
Figures after deducting Other/Consolidation
Financials Regional breakdown – Segments FY 2015
in EUR million
Total 733 Total 705 Total 218
Construction segment Equipment segment Resources segment
Africa 47 (6 %)
Americas 113 (16 %)
Asia-Pacific,
Far East & Australia
191 (26 %)
Middle East
& Central Asia 127 (17 %)
Germany 182 (25 %)
EU excl.
Germany
43 (6 %)
Europe (other)
30 (4 %)
Africa 20 (3 %)
Americas 172 (24 %)
Asia-Pacific,
Far East & Australia
154 (22 %)
Middle East
& Central Asia 60 (8 %)
Germany 164 (23 %)
EU excl.
Germany
96 (14 %)
Europe (other)
39 (6 %)
Africa 11 (5 %)
Americas 12 (5 %)
Asia-Pacific,
Far East & Australia 2 (1 %)
Middle East
& Central Asia
40 (18 %)
Germany 128 (59 %)
EU excl.
Germany
23 (11 %)
Europe (other)
2 (1 %)

© BAUER AG, D-86529 Schrobenhausen 16-05-13 IR-Presentation_Q1_2016 19
Financials Working capital needs & net debt
Net financial debt & pensions
Net
fin
an
cia
l
de
bt
Pe
ns
ion
s
Net working capital
800
600
400
200
0
in EUR million
in EUR million
Bauer’s business model with its three segments
requires considerably more working capital than
other companies in construction markets.
Changes during the year:
- Levels of working capital in the balance sheet during
the year are typically higher than year-end positions.
Construction segment:
- Construction contracts with short duration need
approx. 2 - 3 months pre-financing
(no advance payments, no front-loading of prices
possible, comparably long time needed for final
account settlement).
- On some jobs collection of money takes long time
due to disputes with the customer. Bad payment is
frequently used by customers to achieve reductions
in final payments. This can cause law cases.
Comparison with main contractor: they can finance
their company by a positive cash flow from jobs.
2013 2014 2015 3M 2015 3M 2016
605 604 629 726 672
2013 2014 2015 3M 2015
84
672 646 665
119
779 743
133
3M 2016
115
130

© BAUER AG, D-86529 Schrobenhausen 16-05-13 IR-Presentation_Q1_2016 20
Building construction
positive cash contribution
Specialist foundation engineering
pre-financing need
Financials Working capital needs & cash flow
EUR
12 24 months
Positive cash
contribution
Negative cash
contribution
Co
ntr
ac
t va
lue
EUR
Negative cash
contribution
12 24 months
Co
ntr
ac
t va
lue
Equipment segment:
- Due to very special parts being installed, parts need
to be pre-ordered well in advance
approx. 3 months pre-financing of equipment
during production.
- Spare parts store is needed for large customer base.
- A relatively large rental fleet is needed for different
contract types (e.g. rental purchase).
- Deep drilling rigs add large numbers in value.
Resources segment:
- A mixture of the Construction and Equipment
segments.

© BAUER AG, D-86529 Schrobenhausen 16-05-13 IR-Presentation_Q1_2016 21
Financials Income statement 3M 2016
in EUR '000 3M 2015 3M 2016 ∆ in %
Sales revenues (P&L) 299.560 317.641 6,0%
Consolidated revenues (P&L) 391.455 365.514 -6,6%
Cost of materials -195.086 -172.074 -11,8%
Personel expenses -91.326 -90.644 -0,7%
Other operation expenses -80.841 -75.444 -6,7%
EBITDA 24.202 27.352 13,0%
Depreciation of fixed assets -20.466 -18.493 -9,6%
Write-downs of inventories due to use -2.503 -4.013 60,3%
EBIT 1.233 4.846 n/a
Financial income 1.819 667 -63,3%
Financial expenses -10.266 -11.101 8,1%
Share of profit/loss of associated companies (equity method) 308 -201 n/a
Earnings before tax (EBT) -6.906 -5.789 n/a
Income tax expense -1.707 -3.837 n/a
Earnings after tax -8.613 -9.626 n/a
of which attributable to shareholders of BAUER AG -8.836 -10.040 n/a
of which attributable to non-controlling interests 223 414 85,7%

© BAUER AG, D-86529 Schrobenhausen 16-05-13 IR-Presentation_Q1_2016 22
Financials Balance sheet March 31, 2016
in EUR '000 March 31, 2015 March 31, 2016 ∆ in %
Assets 1.738.031 1.700.719 -2,1%
A. Non-current assets 624.351 628.536 0,7%
I. Intangible assets 33.986 26.479 -22,1%
II. Property, plant and equipment and investment property 466.282 411.320 -11,8%
III. Investments accounted for using the equity method 42.736 130.658 n/a
IV. Participations 3.613 3.460 -4,2%
V. Other non-current assets & deferred tax assets 77.734 56.619 -27,2%
B. Current assets 1.113.680 1.072.183 -3,7%
I. Inventories 486.820 472.390 -3,0%
II. Receivables and other assets 582.154 532.794 -8,5%
III. Effective income tax refund claims 3.569 2.837 -20,5%
IV. Cash and cash equivalents 41.137 64.162 56,0%
Equity and liabilities 1.738.031 1.700.719 -2,1%
A. Equity 417.535 420.387 0,7%
B. Non-current debt 549.121 546.101 -0,5%
I. Provisions for pensions 131.106 127.742 -2,6%
II. Non-current liabilities & deferred tax liabilities 418.015 418.359 0,1%
C. Current debt 771.375 734.231 -4,8%
I. Financial liabilities 427.276 418.674 -2,0%
II. Other current liabilities 314.143 281.680 -10,3%
III. Effective income tax obligations 10.213 15.722 53,9%
IV. Provisions 19.743 18.155 -8,0%

© BAUER AG, D-86529 Schrobenhausen 16-05-13 IR-Presentation_Q1_2016 23
Financials Cash flow statement 3M 2016
in EUR '000 3M 2015 3M 2016 ∆ in %
Cash flow from operational activity -79.396 -41.703 -47,5%
Cash flow from investment activity -10.245 -26.176 n/a
Cash flow from financing activity 86.169 87.583 1,6%
Free Cash Flow -89.641 -67.879 -24,3%
Changes in liquid funds affecting payments -3.472 19.704 n/a
Influence of exchange rate movements on cash 2.774 -2.948 n/a
Total change in liquid funds -698 16.756 n/a
Cash and cash equivalents at beginning of reporting period 41.835 47.406 13,3%
Cash and cash equivalents at end of reporting period 41.137 64.162 56,0%

© BAUER AG, D-86529 Schrobenhausen 16-05-13 IR-Presentation_Q1_2016 24
Guidance 2016 Business year without exceptional earnings expected
2015e 2015 final 2016e
Total Group Revenues ~ 1,600 EUR million 1,656 EUR million ~ 1,650 EUR million
EBIT ~ 75 EUR million 90.7 EUR million ~ 75 EUR million
Earnings after tax ~ 18 – 23 EUR million 29.0 EUR million ~ 20 – 25 EUR million
Bagatelle dam – Mauritius Water treatment plant – Leuna, Germany In-house exhibition 2015 – Schrobenhausen
BAUER Group
© BAUER AG, D-86529 Schrobenhausen 16-05-13 IR-Presentation_Q1_2016 25
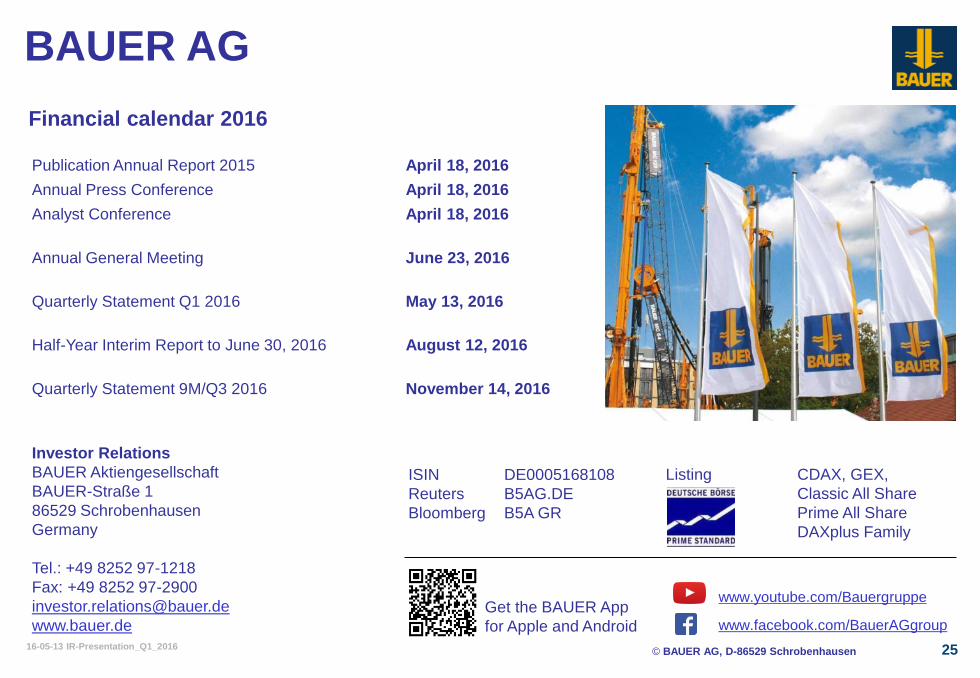
Investor Relations
BAUER Aktiengesellschaft
BAUER-Straße 1
86529 Schrobenhausen
Germany
Tel.: +49 8252 97-1218
Fax: +49 8252 97-2900
www.bauer.de
BAUER AG
Financial calendar 2016
Publication Annual Report 2015 April 18, 2016
Annual Press Conference April 18, 2016
Analyst Conference April 18, 2016
Annual General Meeting June 23, 2016
Quarterly Statement Q1 2016 May 13, 2016
Half-Year Interim Report to June 30, 2016 August 12, 2016
Quarterly Statement 9M/Q3 2016 November 14, 2016
Listing CDAX, GEX,
Classic All Share
Prime All Share
DAXplus Family
Get the BAUER App
for Apple and Android
ISIN DE0005168108
Reuters B5AG.DE
Bloomberg B5A GR
www.youtube.com/Bauergruppe
www.facebook.com/BauerAGgroup

© BAUER AG, D-86529 Schrobenhausen 16-05-13 IR-Presentation_Q1_2016 26
Table of Content
BAUER Group – Strategy, Chances & Markets
Appendix
Financials Q1 2016 & Guidance

© BAUER AG, D-86529 Schrobenhausen 16-05-13 IR-Presentation_Q1_2016 27
1790 · 1900 · 1902 · 1928 · 1948 · 1956 · 1958 · 1967 · 1969 · 1972 · 1975 · 1976 · 1984 · 1990 · 1992 · 1994 · 1998 · 2001 · 2015
BAUER Group The history – Two centuries of experience
End of 1970’s:
Start of
internationalisation
Early 1990’s:
Build up of
specialist construction/
environmental business
FY 2015:
Total Group
revenues
EUR 1.656
billion,
10,738
employees
4. Jul 2006:
IPO
Early 1970’s:
Start of equipment
manufacturing
Company founded as
copper forge
After WW II (1950's):
Start of construction
business
Early 1980’s:
Selling of equipment to
third parties
1790 1900-1970 1980-1990 2000-2015

© BAUER AG, D-86529 Schrobenhausen 16-05-13 IR-Presentation_Q1_2016 28
BAUER Group The three segments
28 © BAUER AG, D-86529 Schrobenhausen
Target: ~ 40 % of
total Group revenues
Market leader in
specialist foundation
equipment
New products for
mining, deep drilling
and offshore drilling
80 % of revenues
from sales abroad
Multi-branding
strategy
Target: ~ 40 % of total Group revenues
Global provider for specialist foundation engineering services
Specialist construction services
Focus on complex, international projects
Target: ~ 20 % of
total Group revenues
Activities in
environmental
technology, mining,
deep drilling, well
construction,
materials

© BAUER AG, D-86529 Schrobenhausen 16-05-13 IR-Presentation_Q1_2016 29
BAUER Group Headquarters and plant Schrobenhausen, Germany

© BAUER AG, D-86529 Schrobenhausen 16-05-13 IR-Presentation_Q1_2016 30
What is specialist foundation? Building an excavation pit
Ground Water
Injection Anchor
Sealing Slab
Supporting Wall
Underpinning
Injection
Pile Foundation

© BAUER AG, D-86529 Schrobenhausen 16-05-13 IR-Presentation_Q1_2016 31
What is specialist foundation used for? Applications for projects
Foundations Cut-off walls Excavation pits
Buildings Infrastructure Water – Energy Industry
Ground improvement

© BAUER AG, D-86529 Schrobenhausen 16-05-13 IR-Presentation_Q1_2016 32
Construction Dubai, VAE – Vibro-compaction work for “Palm Jumeirah”
© BAUER AG, D-86529 Schrobenhausen 16-05-13 IR-Presentation_Q1_2016 33
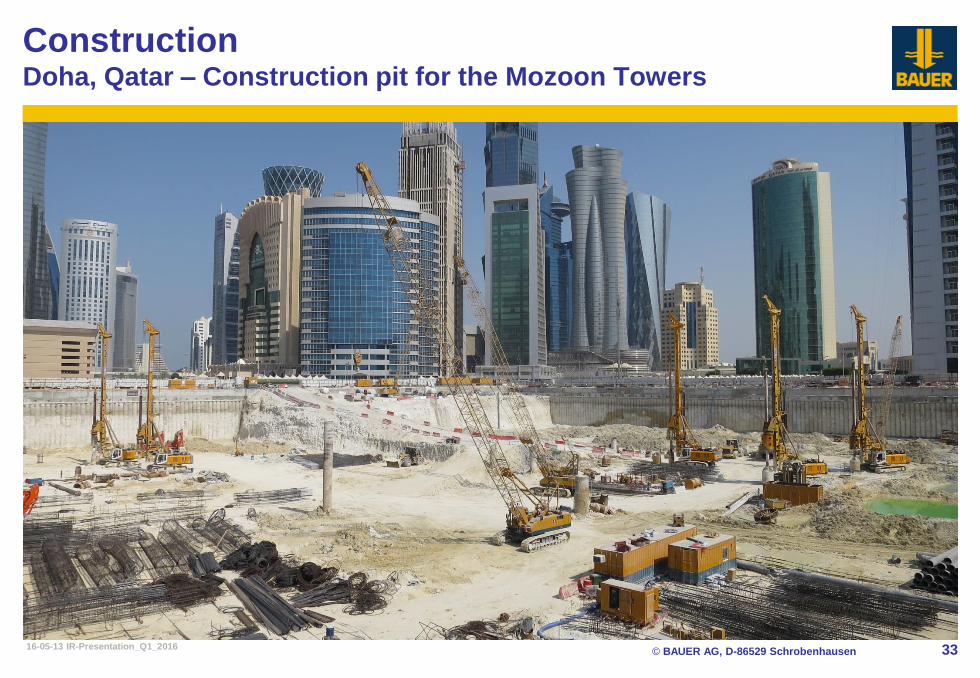
Construction Doha, Qatar – Construction pit for the Mozoon Towers

© BAUER AG, D-86529 Schrobenhausen 16-05-13 IR-Presentation_Q1_2016 34
Construction Munich, Germany – Construction pit for wastewater treatment plant

© BAUER AG, D-86529 Schrobenhausen 16-05-13 IR-Presentation_Q1_2016 35
Construction Zwenkau, Germany – Construction works for Harth canal
© euroluftbild.de

© BAUER AG, D-86529 Schrobenhausen 16-05-13 IR-Presentation_Q1_2016 36
Equipment Product range: Drilling rigs (BG series) – ValueLine
ValueLine The BG ValueLine is a fully dedicated Kelly drilling rig.
BG 30 BG 38 BG 20

© BAUER AG, D-86529 Schrobenhausen 16-05-13 IR-Presentation_Q1_2016 37
Equipment Product range: Drilling rigs (BG series) – PremiumLine
BG 42 BG 50 BG 20
PremiumLine Multi-purpose drilling rigs for various applications of foundation works.

© BAUER AG, D-86529 Schrobenhausen 16-05-13 IR-Presentation_Q1_2016 38
Equipment Product range: Duty-cycle cranes (MC series)
MC 128 MC 96 MC 64

© BAUER AG, D-86529 Schrobenhausen 16-05-13 IR-Presentation_Q1_2016 39
Equipment Product range: Deep Drilling (PR series)
PR 200 PR 440 M2 In order to meet the upcoming
market challenges, out-of-the-box
thinking is necessary and therefore
customized rig solutions are of
growing importance.
Based on more than 40 years of
experience in engineering and
manufacturing of drilling rigs, Bauer
develops and manufactures
customized drilling solutions which
set new standards of safety,
efficiency, productivity and ease
of service in the deep drilling
business.
© BAUER AG, D-86529 Schrobenhausen 16-05-13 IR-Presentation_Q1_2016 40
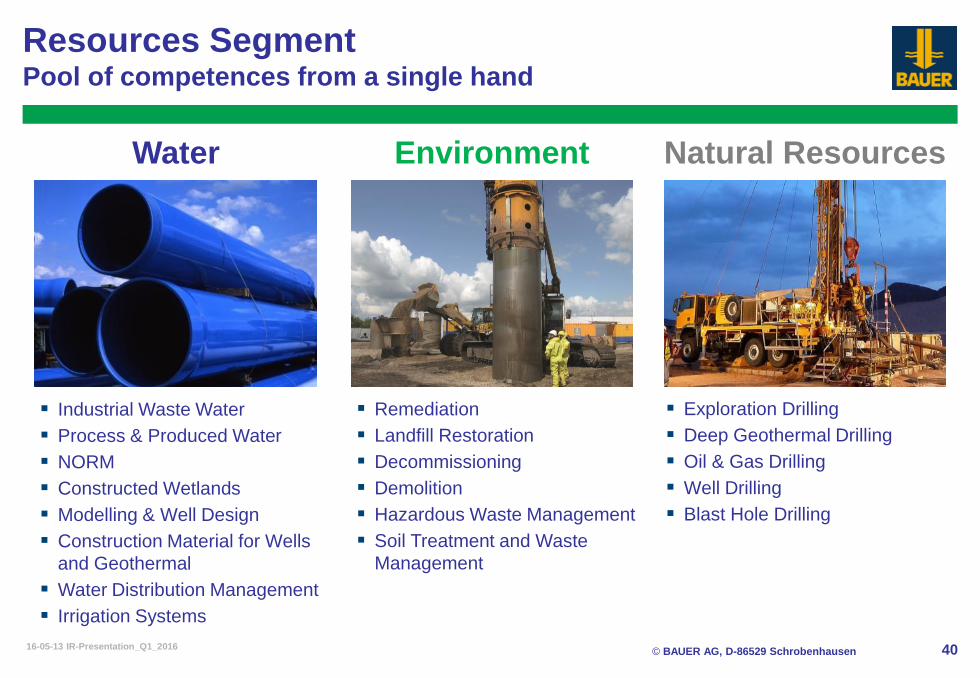
Resources Segment Pool of competences from a single hand
Industrial Waste Water
Process & Produced Water
NORM
Constructed Wetlands
Modelling & Well Design
Construction Material for Wells
and Geothermal
Water Distribution Management
Irrigation Systems
Remediation
Landfill Restoration
Decommissioning
Demolition
Hazardous Waste Management
Soil Treatment and Waste
Management
Exploration Drilling
Deep Geothermal Drilling
Oil & Gas Drilling
Well Drilling
Blast Hole Drilling
Environment Water Natural Resources
© BAUER AG, D-86529 Schrobenhausen 16-05-13 IR-Presentation_Q1_2016 41
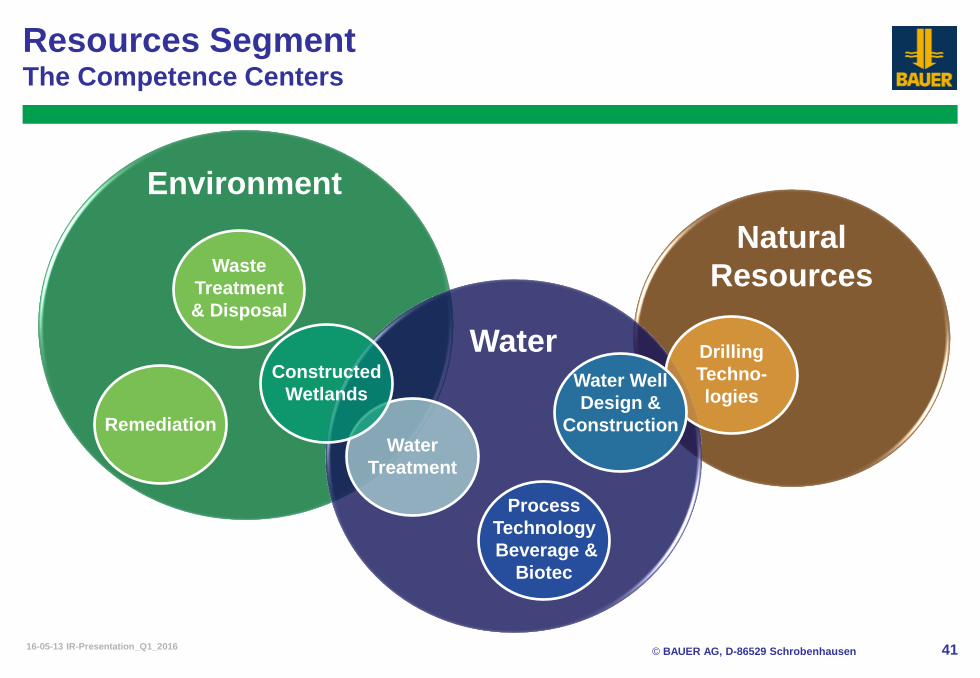
Resources Segment The Competence Centers
Environment
Water
Natural
Resources Waste
Treatment
& Disposal
Remediation
Constructed
Wetlands
Water
Treatment
Process
Technology
Beverage &
Biotec
Water Well
Design &
Construction
Drilling
Techno-
logies

© BAUER AG, D-86529 Schrobenhausen 16-05-13 IR-Presentation_Q1_2016 42
Resources Water – Process Water & Water Distribution Management
© BAUER AG, D-86529 Schrobenhausen 16-05-13 IR-Presentation_Q1_2016 43
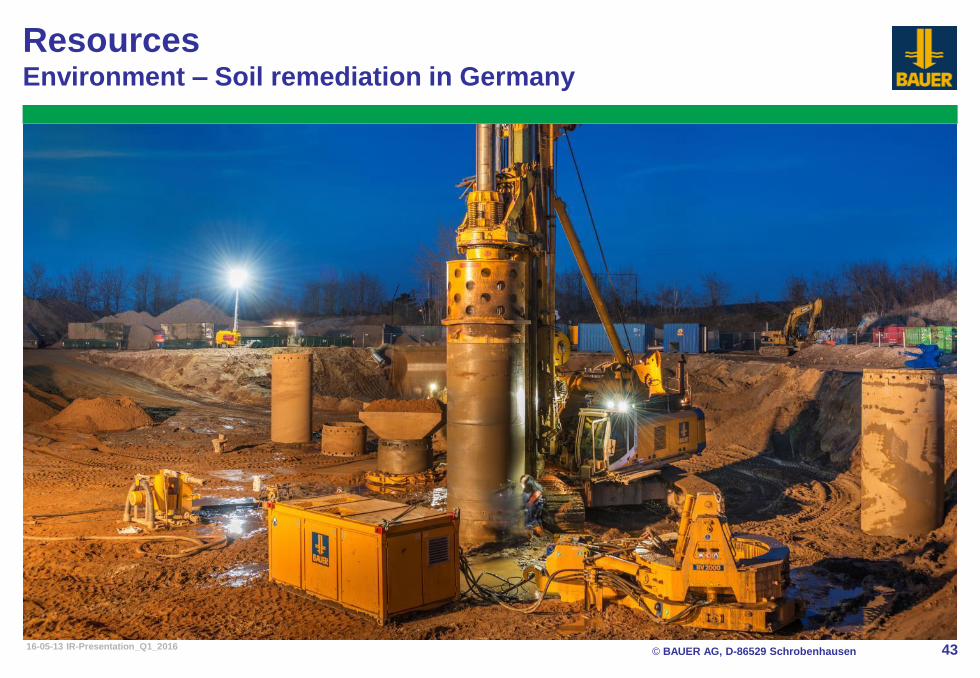
Resources Environment – Soil remediation in Germany

© BAUER AG, D-86529 Schrobenhausen 16-05-13 IR-Presentation_Q1_2016 44
Resources Environment – Reed Bed Water Treatment Plant in Oman

© BAUER AG, D-86529 Schrobenhausen 16-05-13 IR-Presentation_Q1_2016 45
Resources Natural Resources – Oil and Exploration Drilling in Jordan

© BAUER AG, D-86529 Schrobenhausen 16-05-13 IR-Presentation_Q1_2016 46
Employees in 1000 763,4
Revenues in EUR billion 101,0
Building construction 65,0
Foundation engineering 36,0
Orders received *
in EUR billion
Housebuilding 13,1
Industrial building 24,6
Public sector
of which
public buildings 4,0
road building 10,1
underground structures 7,5
*) only companies > 20 employees
2,9
7,0
-2,2
-5,2
0,8
1,6
1,4
1,9
-13,6
-17,6
-5,1
-35,8
14,4
-33,1
4,3
-0,2
-3,5
-36,2
-23,0
-17,7
December 20152014/ 2015/
1995 2013
2015/
1,1
2014
0,1
4,1
4,5
Germany
21,5
59,1
-45,9
9,3
-24,7 -0,5 5,2
-3,5
3,5
13,3
5,4
Market environment – Germany German construction market
Source: Federal Statistical Office, Statistical Office Bavaria

© BAUER AG, D-86529 Schrobenhausen 16-05-13 IR-Presentation_Q1_2016 47
BAUER share Facts & Figures
Bauer family
Free float
51.81 %
Listed on Frankfurt stock exchange,
Prime Standard, since July 4, 2006
Share capital EUR 73,001,420.45
Shares issued 17,131,000
Issue price EUR 16.75
Shareholder structure
Share performance (01/2015 – 05/2016)
in EUR 2012 2013 2014 2015 2016
Earnings per share 1.44 -0.99 0.85 1.73 ---
Share price year end 19.32 18.81 13.35 17.40 ---
Share price highest 26.50 23.05 20.04 19.20 17.16
Share price lowest 16.13 17.33 11.75 13.85 13.13
Market Cap (in EUR million)
331.0 322.2 228.7 298.1 ~250
48.19 %

© BAUER AG, D-86529 Schrobenhausen 16-05-13 IR-Presentation_Q1_2016 48
BAUER share Dividend policy
2009
Dividend payment
2010 2008 2007 2006
0.30
0.00
0.60
0.90
1.20
0.50
1.00 1.00
0.60 0.60
Dividend policy founded on a reasonable
balance between shareholders and
company
fair participation of shareholders
continuity over the years
safeguarding of the equity base
All shareholders shall participate in the
success of the business.
In turbulent times such as the financial crisis
our goal of strategic and safe growth of the
company led to higher profit retention for the
last years.
To secure an adequate equity ratio is an
important aim of the company’s management.
With this we intend to safeguard the long-term
success of the Group.
2011
0.50
2012
0.30
2013
0.00
0.15
2014
in EUR per share
2015*
0.15
* Proposed; subject to the consent of the Annual General Meeting to be held on June 23, 2016

© BAUER AG, D-86529 Schrobenhausen 16-05-13 IR-Presentation_Q1_2016 49
Key Figures Time Line FY 2008 – Q1 2016
In all three segments, total Group revenue and EBIT figures of Q4 2015 and FY 2015 were influenced by exceptional earnings
Total Group Revenues
(in EUR million)
BAUER Group 1.527,2 1.275,8 1.304,0 1.371,8 1.435,8 330,7 390,7 382,6 400,2 1.504,2 378,1 371,1 413,9 397,1 1.560,2 409,1 371,3 414,5 461,5 1.656,4 383,2
Construction 700,9 570,0 615,4 606,6 655,2 153,5 192,7 183,0 212,5 741,7 178,5 173,0 181,8 192,3 725,6 193,5 176,4 194,5 178,5 742,9 159,9
Equipment 780,1 608,5 581,7 636,5 589,1 152,4 157,3 163,9 155,0 628,6 163,8 157,6 186,1 131,7 639,2 173,8 159,6 163,2 256,5 753,1 165,0
Resources 135,1 174,3 177,7 211,5 262,8 39,1 54,7 53,2 41,9 188,9 48,4 52,5 59,6 92,3 252,8 54,3 47,8 75,1 44,4 221,6 71,5
Sales Revenues
(in EUR million)
BAUER Group 1.290,8 1.096,5 1.131,7 1.219,6 1.344,4 262,6 344,7 361,2 433,7 1.402,2 313,4 332,2 368,1 362,0 1.375,7 299,6 342,4 376,8 360,2 1.379,0 317,6
Construction 584,3 487,9 505,8 506,2 579,1 124,4 167,8 182,4 182,9 657,5 167,8 160,8 163,5 154,5 646,6 156,0 163,9 179,4 151,5 650,8 143,6
Equipment 601,2 456,5 469,3 511,4 520,6 104,1 125,5 127,5 204,5 561,6 102,9 120,6 147,4 161,8 532,7 100,5 137,4 129,3 180,8 548,0 107,8
Resources 105,1 152,0 156,4 201,5 244,3 34,0 51,4 51,4 45,8 182,6 42,5 50,7 57,2 45,5 195,9 42,9 40,9 67,9 27,6 179,3 65,9
EBIT
(in EUR million)
BAUER Group 167,5 84,4 88,4 82,3 72,0 2,3 5,1 5,3 17,4 30,1 4,9 8,7 24,7 38,1 76,4 1,2 14,8 20,4 54,3 90,7 4,8
Construction 46,3 25,7 28,8 17,9 22,0 0,3 2,6 15,5 2,8 21,2 1,5 6,0 12,9 5,6 26,0 4,9 5,5 2,0 1,5 13,9 1,0
Equipment 118,3 51,3 48,3 53,0 34,0 3,8 2,0 7,5 18,9 32,2 5,6 7,7 12,7 10,0 36,0 -0,9 9,3 16,2 74,8 99,4 5,9
Resources 4,0 6,0 8,1 10,9 15,2 -2,4 -0,1 -17,6 -3,9 -24,0 -2,1 -1,2 -2,4 21,6 15,9 -2,9 -0,3 2,0 -18,6 -19,8 -1,6
EBIT margin
(in %)
BAUER Group 13,0% 7,7% 7,8% 6,7% 5,4% 0,9% 1,5% 1,5% 4,0% 2,1% 1,6% 2,6% 6,7% 10,5% 5,6% 0,4% 4,3% 5,4% 15,1% 6,6% 1,5%
Construction 7,9% 5,3% 5,7% 3,5% 3,8% 0,2% 1,5% 8,5% 1,5% 3,2% 0,9% 3,7% 7,9% 3,6% 4,0% 3,1% 3,4% 1,1% 1,0% 2,1% 0,7%
Equipment 19,7% 11,2% 10,3% 10,4% 6,5% 3,7% 1,6% 5,9% 9,2% 5,7% 5,4% 6,4% 8,6% 6,2% 6,8% -0,9% 6,8% 12,5% 41,4% 18,1% 5,5%
Resources 3,8% 3,9% 5,2% 5,4% 6,2% -7,1% -0,2% -34,2% -8,5% -13,1% -4,9% -2,4% -4,2% 47,5% 8,1% -6,8% -0,7% 2,9% -67,4% -11,0% -2,4%
Q1 16
Q1 16
Q1 16
Q1 16
Q3 15
Q3 15
2012
2012 Q1 14
Q1 13
Q1 13
Q1 13
Q1 13 Q3 13
Q3 14Q2 14
Q4 13 2013
2013
2012
20122010
2011
2010
2011
2011
2010
2009
2008 2009
2008
2008
2008 2009
2009
2011
2010
Q2 13
Q2 13
Q2 13
Q2 13 Q2 14
Q3 13 Q4 13 2013 Q4 14
Q3 14Q4 13 Q4 14
Q3 13 Q3 14
Q3 14Q1 14 Q2 14
Q4 14
Q3 13 Q4 13 2013 Q4 14
Q1 14
Q1 14
Q2 14 2014
2014
2014
2014
Q1 15
Q1 15
Q1 15
Q1 15
Q2 15
Q2 15
Q2 15
Q2 15
Q3 15
Q3 15
Q4 15
Q4 15
Q4 15
Q4 15
2015
2015
2015
2015

© BAUER AG, D-86529 Schrobenhausen 16-05-13 IR-Presentation_Q1_2016 50
Disclaimer
This presentation contains forward-looking statements. Forward-looking statements
are statements that are not historical facts, including statements about our beliefs,
intentions, expectations, predictions and the assumptions underlying them.
These statements are based on factors as they are currently available to the
management of BAUER AG and therefore speak only as of the date they are made.
We assume no liability to update publicly or conform any of them to future events or
future developments.
Forward-looking information is subject to various known and unknown risks and un-
certainties, which could lead to material differences between the actual future results,
financial situation, development or performance of the BAUER Group and those
factors contained in any forward-looking statement. In view of these uncertainties, no
assurance can be given that these forward-looking statements will prove accurate
and correct, or that anticipated and projected future results will be achieved and we
caution you not to place undue reliance on these forward-looking statements.