IR presentation Q1-Q3 2016 - Outotec · • General Manager, Atlas Copco CMT Sweden AB 2008-2011...
61
Sustainable use of Earth’s natural resources IR presentation Q1-Q3 2016
Transcript of IR presentation Q1-Q3 2016 - Outotec · • General Manager, Atlas Copco CMT Sweden AB 2008-2011...

Sustainable use ofEarth’s natural resources
IR presentationQ1-Q3 2016

© Outotec – All rights reserved
Safety performance in Q1-Q3/2016
OUTOTEC IR presentation2 Q1-Q3 2016
0
1.4(2015: 2.8)
1,232
Fatal accidents
Lost-Time Injury Rateper million hoursincl. employees andsubcontractors
13 Lost time injuries reported Reported near misses

© Outotec – All rights reserved
Markku Teräsvasara, Outotec’s CEO since October 1, 2016
Q1-Q3 2016 OUTOTEC IR presentation3
Work experience• President, Atlas Copco Mining and Rock Excavation
Service Division, Sweden 2014-9/2016• President, Atlas Copco Surface Drilling Equipment
Division, China 8/2011-2013• General Manager, Atlas Copco CMT Sweden AB 2008-2011• Vice President, Marketing Atlas Copco, Surface
Drilling Equipment (SDE) division 2004-2008• Product Manager, Atlas Copco Rock Drilling
Equipment division, Underground Equipment 2001-2004• Product Manager, Atlas Copco CMT Finland
(Customer Center) 1997-2001• Project Manager and Senior designer, Insinööritoimisto
Pitkälä Oy & Pitla Oy 1994-1997(Partner & Member of the Board 1994 - 2001)
• Designer, Insinööritoimisto Lauri Pitkälä Oy, Finland 1990-1993• Designer, Nord-engineering Oy, Turku, Finland 1988-1990
Born 1965B.Sc. Civil engineeringFinnish citizen
© Outotec – All rights reserved
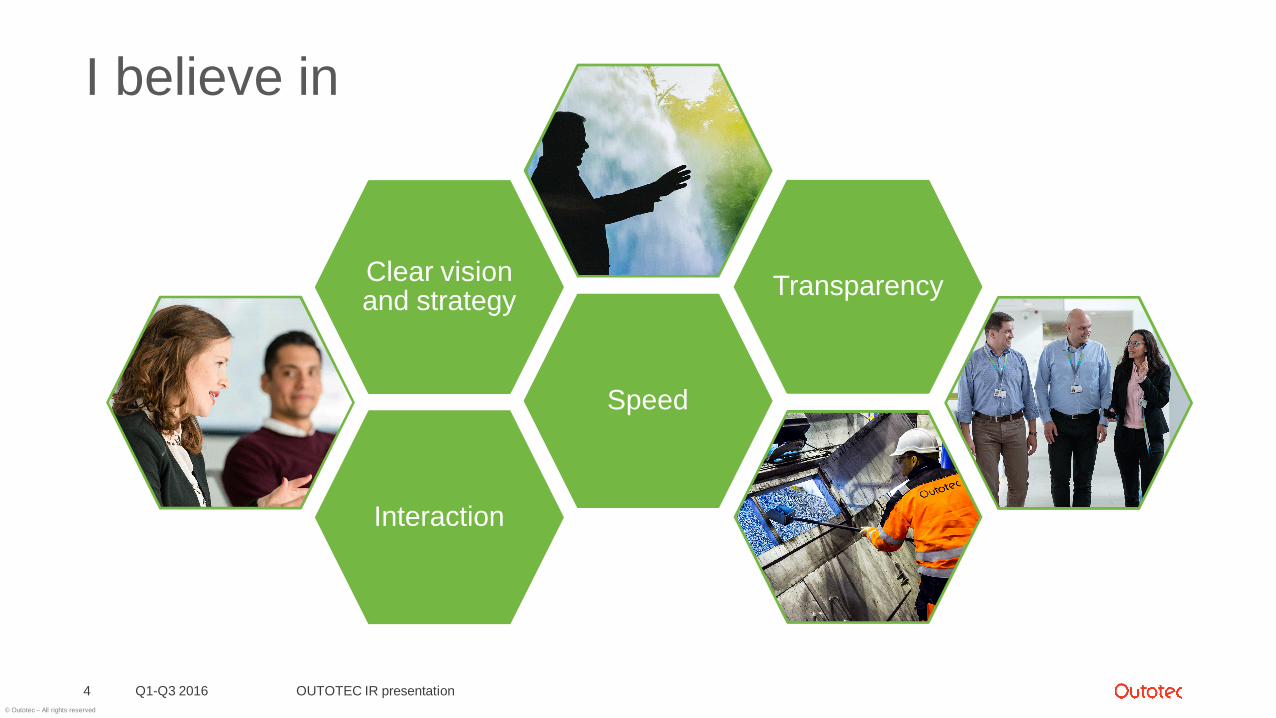
Interaction
Speed
Clear visionand strategy Transparency
I believe in
Q1-Q3 2016 OUTOTEC IR presentation4

© Outotec – All rights reserved
First impressions on Outotec
Q1-Q3 2016 OUTOTEC IR presentation5
Clear vision andstrategy
Good technologicalexpertise
70 M€ savings planprogressing as planned,
work with internalefficiency will continue
Large installed baseto build service
business on

© Outotec – All rights reserved
Based on my first impressions, these are our opportunities
Q1-Q3 2016 OUTOTEC IR presentation6
We can take Outotec back to profitable growth!Stability
Profitability
Growth
• Achieve profitable service growth throughimproved service offering
• Increase profitability by modularization andsourcing
• Establish mid-and high-tier product andservice portfolio
• Engaged, clear and sustainable organization• Customer driven sales and delivery
capabilities

© Outotec – All rights reserved
Outotec at a glance
Q1-Q3 2016 OUTOTEC IR presentation7
Key figures
Financial performance
Geographic coverage
Business overview
740
1,0001,218
878 970
1,386
2,0871,912
1,4031,201
0
2
4
6
8
10
12
0
400
800
1200
1600
2000
2400
2006 *) 2007 2008 2009 2010 2011 2012 2013 2014 2015
Sales Operating profit margin
*) Combined basis 2010 onwards adj. EBIT, excl. restructuring and acquisition-related costs as well as purchase price allocation amortizations.
EUR million %
FY 2015 FY 2014
Net Sales, EUR million 1,201 1,403
Share of services in sales, % 43 37
Gross Margin, % 28 23Adjusted EBIT, % (excl. one-time items) 4.7 4.0Gearing, % 9.9 -1.3
Equity ratio, % 31.1 36.1Balance sheet total, EUR million 1,531 1,442
• Outotec is a global leader in minerals and metals processingtechnology, deliveries to more than 80 countries
• Outotec designs and delivers tailored solutions for minerals andmetals processing, water treatment, and producing energy frombiomass and wastes
• Company develops technologies which utilize natural resources,raw materials, energy and water efficiently, and minimize the plant’slifetime costs
• HQ in Finland, some 4,200 employees (Q3/2016) in 34 countries
Outotec R&D, sales and service centersOutotec manufacturing/assembly

© Outotec – All rights reserved
A century of accumulated expertise 1/2
October 28, 2016 OUTOTEC IR presentation8

© Outotec – All rights reserved
A century of accumulated expertise 2/2
October 28, 2016 OUTOTEC IR presentation9

© Outotec – All rights reserved
10
Minerals Processing segment’s offering
A complete portfolio of leading process solutions and services with full plant delivery capability
WaterTechnology
FLSmidth, CITIC,Metso,ThyssenKrupp
FLSmidth, Metso,BGRIMM, Tenova,Woodgrove
FLSmidth, Tenova-Delcor, WesTech
Aqseptence-Diemme, Metso,Andritz, FLSmidth
Thermo Fisher,BGRIMM, Blue Cube
APC: Metso,Woodgrove, SGSMinerals
DCS: Major DCSsuppliers
FLSmidth, Golder,GR Engineering,AMC
Customers ownmaintenance,Major tech.suppliers, Localcompanies
Thickening AnalyzersGrinding Flotation AutomationFiltering ServicesTailings management
1,100 grindingmills delivered,strong in S/Msize mills andprocesstechnology
10,000 flotationunits deliveredsince 1960s,bigcell technologyreferences,automation
1,800 thickenersdelivered, globalprojectexecutioncapability,feedwell design
Full analyserportfolio, lowestmin detectionlimits, only Xrayused
Uniquecombination ofautomation &analysers,important for riskmanagement
Full processand equipmentportfolio,effluenttreatment andbackfill plants
Prop equipmentand totalprocessknowhow,global servicenetwork
3,500 filtersdelivered, mostefficientconcentratefiltering, provenperformance
Competition fragmented, a number of players competing in part of the portfolio
Q1-Q3 2016 OUTOTEC IR presentation

© Outotec – All rights reserved
Q1-Q3 2016 OUTOTEC IR presentation11
Industry-leading technologies, process solutions and services
Metals, Energy & Water segment’s offering
Ferrous metals Sulfuric acid/Off-gas/Roasting
Fives, FLSmidth,Metso,Aqseptence-Diemme
Kobelco, Metso,Primetals, Jemeco
SMS Siemag,Tenova, Jemeco
GEA Bischoff,MECS
Alumina,Aluminum Base metals (Cu, Ni,
Zn, Au, Ag, PGM)Ferroalloys
GlencoreTechnology, Tenova
Leader in CFBAluminiumCalcination andHOT TubeDigestion
Over 60% of theworld’s pelletsmade withtravelling gratetechnology
650 acid plantsand 270 non-ferrous roastingplants
Leader in Cusmelting, anodecasting, SX and Znleaching, strong inNi smelting andEW
Energy Water
Alumina calciner,Green anode plants,
Rod Hop
Sintering, Pelletizing,Direct Smelting
Sulfuric acid plant,Roasting
Smelting, Converting,Leaching, SX/EW,
electrorefining
Smelting,Preheating, Steel
Belt Sintering
Waste-to-energy,Sludge incineration,Oil shale processing
Industrial watertreatment, municipal
water systems
Competition fragmented, a number of players competing in part of the portfolio
Services
Advisory, maintenance,operations & remoteservices, upgrades
Valmet, Andritz,Babcock&Wilcox
Veolia, GE Water,Suez
FLSmidth, Metso,major tech suppliers,locals and customers
Leader in FerroChrome, 20pelletizing andsinter plants and9 smelters forferroalloys
Versatile waste-to-energysolution, over250 materialsused
Effluenttreatment plants,backfill plants,water recycling
Shutdownservices, bestsuited to provideservices for owntechnologies

© Outotec – All rights reserved
Long-term customer relationships with the industry’s topcompanies
Q1-Q3 2016 OUTOTEC IR presentation12
In history, top ten customers have accounted for some 35% of sales.
Major global mining companies Local mining and metallurgicalcompanies in emerging regionsIntermediate sized companies
Selected reference customers of Outotec

© Outotec – All rights reserved
Offering industry’s most sustainable processing technologies
Q1-Q3 2016 OUTOTEC IR presentation13
343545
2015
6,600
2014
5,900
2013
5,400
Our handprint is bigger than our footprintThousands of tons of CO2-equivalent
Footprint: Outotec’s greenhouse gas emissions
Handprint: Greenhouse gas emissions avoidedthrough use of Outotec’s technologies
The 3rdmost
sustainablecompany in the
world (2016)
EnvironmentalGoods and
Services equals
to 90% oforders (2014-15)

© Outotec – All rights reserved
Metals demand is forecasted to grow 2-4%
Q1-Q3 2016 OUTOTEC IR presentation14
SUPPLY DEMAND2016F
Production, Mt2016F
Consumption, MtCAGR%
2015-25EIncrease,
Kt/aAluminium 57,8 57,6 2,7 % 1692
Copper 22,5 22,3 1,8 % 419Zinc 14,0 14,5 2,4 % 367
Nickel 2,0 1,9 1,4 % 29
Source: Wood Mackenzie, Morgan Stanley, Outotec analysis
Share of Outotec sales byend product
* Incl. water, sulfuric acid and off-gas
6%4%4%
8%
8%
4%7%
11%
17%
32%
Others
Copper
Precious Metals
Zinc
Aluminium
Ferroalloys
Iron
Nickel
Other Metals
2015
Energy and environmentalsolutions*

© Outotec – All rights reserved
Deep downcycle expected to turn into a decent growth
Q1-Q3 2016 OUTOTEC IR presentation15
0
10 000
20 000
30 000
40 000
50 000
60 000
70 000
80 000
90 000
100 000
110 000
120 000
130 000
140 000
150 000
2019 2020201820172016201520142013201220112010
30 000
+8%
-51%
Sustaining capex
Including greenfieldand brownfield expansion
Total Capex per type, MUSD
Project visibility gap
Source: Woodmac, June 2016

© Outotec – All rights reserved
Maintenance Capex to remain flat, expansion Capexexpected to grow esp. in copper, gold, zinc and nickel
Q1-Q3 2016 OUTOTEC IR presentation16
0
5 000
10 000
15 000
20 000
25 000
30 000
35 000
40 000
0%-25%
Copper
Gold
Iron Ore
NickelZincAluminiumAluminaLead
202020192018201720162015201420132012201120100
5 000
10 00015 00020 000
25 00030 000
35 00040 00045 000
50 00055 00060 000
65 00070 00075 000
80 00085 000
90 00095 000
100 000
105 000110 000
20152014201320122011 201820172010 2016
+14%
-63%
Copper
GoldIron OreAluminiumNickelZincAluminaLead
20202019
Sustaining capexper metal
Expansion capexper metal
Project visibility gap
Source: Woodmac, June 2016

© Outotec – All rights reserved
Mining and metals production country ranking – Cu, Zn, Ni
Q1-Q3 2016 OUTOTEC IR presentation17

© Outotec – All rights reserved
Mining and metals production country ranking – Al, Au, Fe
Q1-Q3 2016 OUTOTEC IR presentation18

© Outotec – All rights reserved
Long-term financial targets - Road map to 2020
Q1-Q3 2016 OUTOTEC IR presentation19
10%2020
2-3%2016
aEBIT* aEBIT*
ServicesR&D,Design-to-cost
Bestcostcountrysourcing
Efficiency
Annual averageservice sales growth5-15% (incl. M&A)
Gearing at max 50%
* Excluding restructuring and acquisition-related costs as well as purchase price allocation amortizations.

© Outotec – All rights reserved
Service sales target
Q1-Q3 2016 OUTOTEC IR presentation20
Grow performance services
Grow spare & wear parts business
Strengthen service capabilities and intensity
Customers need services that improve productivity and reduce opex
Average growth 5-15%(June 7, 2016)
31% 40%+O
VE
RTH
EC
YCLE
Services % of sales
currenttarget
Spare parts
Technical services
Modernizations
Shutdown services
O&M (incl. spare parts)
Split in services, 2015

© Outotec – All rights reserved
Q1-Q3 2016 financial information
Q1-Q3 2016 OUTOTEC IR presentation21

© Outotec – All rights reserved
Signs of recovery in minerals processing market,environment challenging for metals refining market
Q1-Q3 2016 OUTOTEC IR presentation22
MinMetcompaniescontinued toinvest intheir existingplants withfast returns.
Smallerequipmentorderspicked up
Interest intechnologiesthat minimizeenvironmentalimpacts
Customersfocus onefficientinventory andcash flowmanagement.
Gold,copper,nickel andzinc projectswere mostactive.

© Outotec – All rights reserved
Q3 in a nutshell
Q1-Q3 2016 OUTOTEC IR presentation23
• Customers’ large investmentsare still developing slowly.
• Weak performance in certainprojects in the Metals, Energy &Water impacted profitability andcash flow.
• Savings program proceeds asplanned, fixed costs reduced by26%.
• Order intake increased in theMinerals Processing segment.
+
_

© Outotec – All rights reserved
Order intake in the Minerals Processing picked up
Q1-Q3 2016 OUTOTEC IR presentation24
EMEA
51%APAC
20%
535389
387
336
0
100
200
300
400
500
600
700
800
900
Q1-Q3/2015 Q1-Q3/2016
Serviceorders
Capexorders
AMERICAS
29%
Process equipment forGoldcorp,MexicoApprox. 23 M€
2 mine backfill plants,Philippines andAustraliaApprox. 20 M€
Process equipment forgreenfield gold project,SenegalApprox. 10 M€
Flotation anddewatering technology,RussiaApprox. 30 M€
Modular flotation cPlantfor Ma’aden Gold,Saudi Arabia< 10 M€
2 modular solventextraction plants,Macedonia and Egypt25 M€

© Outotec – All rights reserved
Stable order backlog
Q1-Q3 2016 OUTOTEC IR presentation25
€ million
Iranian projectsnot included in
Q3 end backlog:EUR 200 (230)
million
240
371
235168
493418
384299
475
260
120139 106202
111
419 350269
357 344
532
803
327425
736
452 471 491366
230
426
210
380266 322
260
395
268 267
170
281 274
0
200
400
600
800
1 000
1 200
1 400
1 600
1 800
2 000
2 200
2 400
Q2/
2006
Q3/
2006
Q4/
2006
Q1/
2007
Q2/
2007
Q3/
2007
Q4/
2007
Q1/
2008
Q2/
2008
Q3/
2008
Q4/
2008
Q1/
2009
Q2/
2009
Q3/
2009
Q4/
2009
Q1/
2010
Q2/
2010
Q3/
2010
Q4/
2010
Q1/
2011
Q2/
2011
Q3/
2011
Q4/
2011
Q1/
2012
Q2/
2012
Q3/
2012
Q4/
2012
Q1/
2013
Q2/
2013
Q3/
2013
Q4/
2013
Q1/
2014
Q2/
2014
Q3/
2014
Q4/
2014
Q1/
2015
Q2/
2015
Q3/
2015
Q4/
2015
Q1/
2016
Q2/
2016
Q3/
2016
Order backlog at the end of the period Share of unannounced orders Order intake by quarter
RoughlyEUR 300
million of theQ3 end backlogto be delivered
in 2016
EUR 1,030
million, -8%

© Outotec – All rights reserved
Weak performance in certain projects impacted profitability
Q1-Q3 2016 OUTOTEC IR presentation26
EUR million Q32016
Q32015
Q1-Q32016
Q1-Q32015
Change,%
Incomparablecurrencies
Sales 245 307 753 895 -16% -12%Service sales 105 129 320 373 -14% -8%Share of services in sales, % 43 42 42 42Gross Margin, % 24 28 25 28Adjusted EBIT* 2 15 2 38Adjusted EBIT*, % 1 5 0 4- Restructuring and acquistion-related costs -1 -6 -10 -13- PPA amortization -2 -2 -6 -7EBIT -1 7 -14 18EBIT, % -0 2 -2 2Profit for the period -3 2 -17 6* Excl. restructuring and acquisition-related costs and PPA amortizations.

© Outotec – All rights reserved
Profitability impacted by additional project provisionsbooked in Q3
Q1-Q3 2016 OUTOTEC IR presentation27
Adjusted EBITQ1-Q3 2016
2 M€
OtherFixed costdecrease*
Provision impact2015 & 2016
Sales decreaseAdjusted EBITQ1-Q3 2015
38 M€
*Decline yoy 21% (in comparable currencies 20%)

© Outotec – All rights reserved
Minerals Processing
Q1-Q3 2016 OUTOTEC IR presentation28
0%2%4%6%8%10%12%14%16%18%20%
050
100150200250
300350
Q1/
2012
Q2/
2012
Q3/
2012
Q4/
2012
Q1/
2013
Q2/
2013
Q3/
2013
Q4/
2013
Q1/
2014
Q2/
2014
Q3/
2014
Q4/
2014
Q1/
2015
Q2/
2015
Q3/
2015
Q4/
2015
Q1/
2016
Q2/
2016
Q3/
2016
Sales EBIT*, %
Sales and adjusted EBIT development
• Order intake grew 18%• Sales decreased 10% mainly due to decline in
spare part orders and low order intake in thelatter part of 2015 and H1/2016
• Achieved fixed cost savings balanced out thelower sales
Minerals ProcessingEUR million
Q1-Q32016
Q1-Q32015
Change,%
Change incomp
currency, %Order intake 462 393 18 26Sales 361 402 -10 -5Service sales 197 229 -14 -7Adjusted EBIT*) 22 19Adjusted EBIT*), % 6 5Unrealized and realized lossesrelated to valuation of FXforward agreements
-1 -3
* Excl. restructuring and acquisition-related costs and PPA amortizations

© Outotec – All rights reserved
-10%
-5%
0%
5%
10%
15%
050
100150200250300350400
Q1/
2012
Q2/
2012
Q3/
2012
Q4/
2012
Q1/
2013
Q2/
2013
Q3/
2013
Q4/
2013
Q1/
2014
Q2/
2014
Q3/
2014
Q4/
2014
Q1/
2015
Q2/
2015
Q3/
2015
Q4/
2015
Q1/
2016
Q2/
2016
Q3/
2016
Sales EBIT*, %
Metals, Energy & Water
• Customers’ large investments develop slowly• Decline in plant orders and low service volumes• Lower sales and weak performance in certain
projects weakened the segment’s profitability• More saving actions ongoing
Q1-Q3 2016 OUTOTEC IR presentation29
Metals, Energy & WaterEUR million
Q1-Q32016
Q1-Q32015
Change,%
Change incomp
currency, %Order intake 263 530 -50 -49Sales 392 494 -21 -18Service sales 122 145 -15 -10Adjusted EBIT*) -17 24Adjusted EBIT*), % -4 5Unrealized and realized lossesrelated to valuation of FXforward agreements
-3 -1
* Excl. restructuring and acquisition-related costs and PPA amortizations
Sales and adjusted EBIT development
© Outotec – All rights reserved
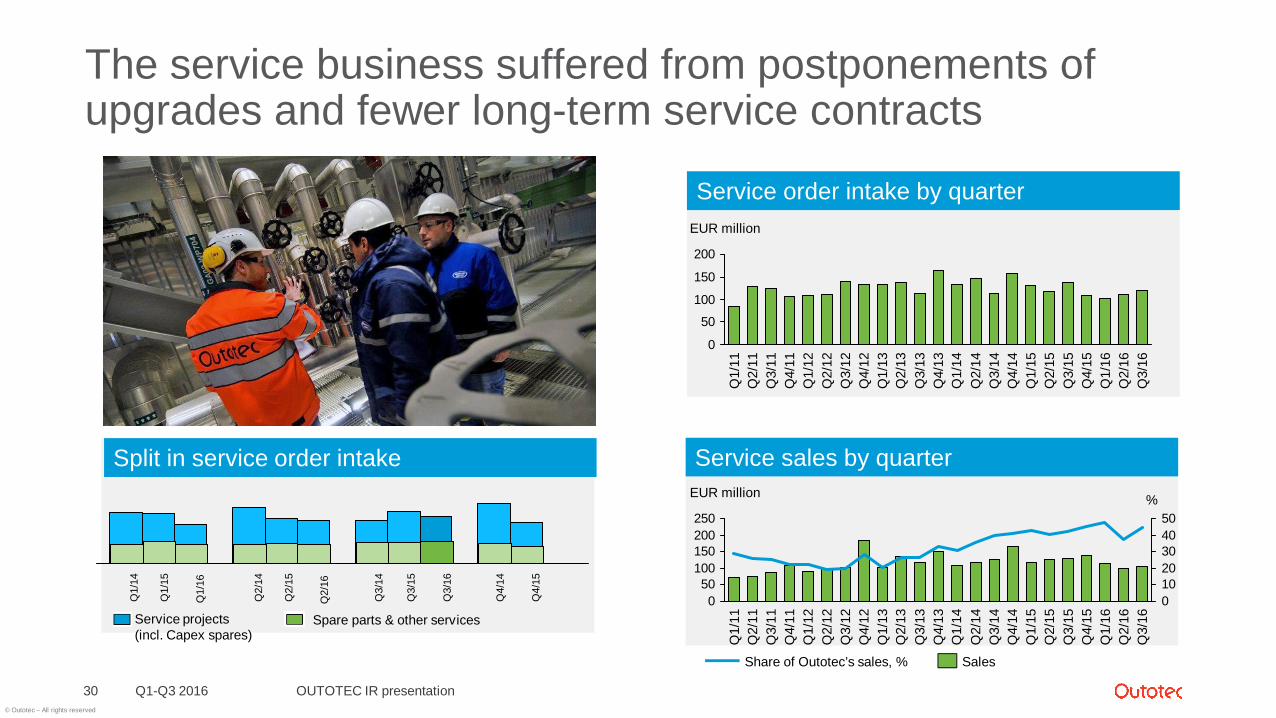
Service order intake by quarter
0
50
100
150
200
Q4/
13Q
3/13
Q2/
13Q
1/13
Q4/
12Q
3/12
Q2/
12Q
1/12
Q4/
11Q
3/11
Q2/
11Q
1/11
Q3/
16Q
2/16
Q1/
16Q
4/15
Q3/
15Q
2/15
Q1/
15Q
4/14
Q3/
14Q
2/14
Q1/
14
EUR million
The service business suffered from postponements ofupgrades and fewer long-term service contracts
Q1-Q3 2016 OUTOTEC IR presentation30
Service sales by quarterSplit in service order intake
050
100150200250
01020304050
EUR million %
Q3/
16Q
2/16
Q1/
16Q
4/15
Q3/
15Q
2/15
Q1/
15Q
4/14
Q3/
14Q
2/14
Q1/
14Q
4/13
Q3/
13Q
2/13
Q1/
13Q
4/12
Q3/
12Q
2/12
Q1/
12Q
4/11
Q3/
11Q
2/11
Q1/
11
SalesShare of Outotec’s sales, %
Spare parts & other servicesService projects(incl. Capex spares)
Q1/
14
Q1/
15
Q2/
14
Q2/
15
Q3/
14
Q3/
15
Q4/
14
Q4/
15
Q1/
16
Q2/
16
Q3/
16

© Outotec – All rights reserved
Change in cash flow due to projects under execution tying up morecapital, lack of large advance payments, restructuring-related costs
Q1-Q3 2016 OUTOTEC IR presentation31
EUR million Q1-Q32016
Q1-Q32015
Cash from operations 31 43Change in working capital -94 -10Interest -5 -3Taxes -4 -8
NET CASH FROM OPERATING ACTIVITIES -73 22
Capital expenditure -16 -43Acquisitions -3 -28Other investing activities 2 0
CASH FLOW AFTER INVESTING ACTIVITIES -90 -49
Cash and cash equivalents 265 267

© Outotec – All rights reserved
Liquidity and equity remained solid
Q1-Q3 2016 OUTOTEC IR presentation32
Q32016
Q32015
Q42015
Net interest-bearing debt, EUR million -21* 74 40
Gearing, % -4* 17 10
Equity-to-assets ratio, % 42* 32 31
Return on investment, %, LTM -6 4 -1
Return on equity, %, LTM -8 1 -4
Working capital at the end of the period, EUR million -10 -12 -89
Advances received 207 205 232
Equity, EUR million 534 426 405
Balance sheet total, EUR million 1,482 1,527 1,531* If the hybrid bond (EUR 150 million) were treated as a liability equity-to-assets ratio would be 30%, gearing34%, and net interest-bearing debt EUR 129 million.

© Outotec – All rights reserved
Fixed cost savings achieved as planned
33 Q1-Q3 2016 OUTOTEC IR presentation
• Target is EUR 70million annual fixedcost reductioncompared to Q1-Q3/2015 run rate.
• Of this, EUR 56million was reachedin Q1-Q3/2016.
Fixed cost Fixed cost2015 2016
278
348
84
95
82
Q2
Q1
Q3
Total Q1-Q3Annualized
Target fixed cost level
62
69
74
Cumulativesavings
8
34
56
We are actively working on improving our performance, especially inthe Metals, Energy & Water segment.

© Outotec – All rights reserved
Key events after September 30, 2016
Q1-Q3 2016 OUTOTEC IR presentation34
October 4Outotec announced representatives forOutotec's Nomination Board fromSolidium, Varma and Ilmarinen, and theChairman of the Board.
October 1New CEO Markku Teräsvasarastarted to work at Outotec.
October 24
Kalle Härkki, D.Sc. (Tech.), wasappointed President of Metals,Energy & Water business unit.
October 10
Outotec celebrated its 10th
anniversary and launched historybook "150 years' evolution toward agreener future - the Outotec story“.

© Outotec – All rights reserved
We expect increased activity in minerals processing tocontinue, metals refining markets to remain weak
Q1-Q3 2016 OUTOTEC IR presentation35
Increased interest in technologies thatminimize environmental impacts.
Customers’ need for productivityimprovement creates opportunities forOutotec’s performance solutions.
Markets in the Middle East, Southand Central America, and Russiaare expected to continue active.
The scarcity andcost of water aswell as need toimproveemission controldrive processmodernizations.
Development of gold, copper, nickel,and zinc projects are expected tocontinue more active than aluminumand iron.
Waste-to-energy solutionsmarket is volatile, asdecisions depend onsubsidies andenvironmental regulations.

© Outotec – All rights reserved
Sales guidance is narrowed and due to the continued challenges in the Metals, Energy &Water segment adjusted EBIT is expected to be at the lower end of the guidance range:
Financial guidance for 2016 narrowed
Q1-Q3 2016 OUTOTEC IR presentation36
Expected salesfrom Q3
order backlog(incl. services)
~EUR 300 million
Salesfrom new
order intake(incl. services)
+=Sales will be
approx.EUR 1.0 - 1.1 bn
(previously 1.0-1.2)
Adjusted EBIT*
will be approximately 2 – 3% (previously 2 – 4%)
* Excluding restructuring and acquisition-related costs as well as purchase price allocation amortizations.
+Sales from Q1-Q3EUR 753 million

© Outotec – All rights reserved
Profitability roadmap from 2015 to 2016
Q1-Q3 2016 OUTOTEC IR presentation37
DepreciationProvisionimpact
Savings* Sales reduction,market risk
aEBIT 2015 aEBIT 2016e
*Incl. cost structure program and other actions
Guidance upperboundary 3%
Guidance lowerboundary 2%

© Outotec – All rights reserved
Interest bearing loans and hybrid bond, repayment profile
Q1-Q3 2016 OUTOTEC IR presentation38

© Outotec – All rights reserved
More mature backlog ties more capital
Q1-Q3 2016 OUTOTEC IR presentation39
• Working capital is driven by OrderIntake due to advance payments
• Capex is expected to decreasefrom past years
• Cash flow typically stronger in H2than in H1
0,00
0,20
0,40
0,60
0,80
1,00
1,20
1,40
1,60
-300
-200
-100
0
100
200
300
Dec2009
Dec2010
Dec2011
Dec2012
Dec2013
Dec2014
Dec2015
Sep2016
Working Capital CAPEX Free cash flow Book-to-bill

© Outotec – All rights reserved
POC and cashflow profile example
Q1-Q3 2016 OUTOTEC IR presentation40
0
20
40
60
80
100
120
1 2 3 4 5 6 7 8 9 10 11 12 13 14 15 16 17 18 19 20 21 22 23 24 25 26 27POC Cumulative cashflow
MEUR
Month
Total order backlogstructure in 2012
Total order backlogstructure in 2015
0% 100%
Percentage of Completion, %
Timing of large projectcompletions, andpossible release ofprovisions, affectsquarterly earnings.
Advancepayment~10-30%
NOTE: The figures are illustrative and vary project by project
Timing of large project completions affects quarterly earnings

© Outotec – All rights reserved
Equity to assets ratio, gearing and liquidity at healthylevels
Q1-Q3 2016 OUTOTEC IR presentation41
171 291 318 258 280 403 359 324 282 301Cash at hand
Equity toassets
Gearing
265
-160
-140
-120
-100
-80
-60
-40
-20
0
20
0
5
10
15
20
25
30
35
40
45
50
Dec2006
Dec2007
Dec2008
Dec2009
Dec2010
Dec2011
Dec2012
Dec2013
Dec2014
Dec2015
Sep2016

© Outotec – All rights reserved
Customer solutions
Q1-Q3 2016 OUTOTEC IR presentation42

© Outotec – All rights reserved
Laiva Gold mine in FinlandCustomer case, ore sorting
Q1-Q3 2016 OUTOTEC IR presentation43
Outotec solution• Outotec sensor-based ore
sorting solution removingwaste rock and improving thehead grade.
• When waste rock is removedthere is less ore feed to thecrushing and grinding circuit,reducing energy and waterconsumption
Customer challenge• Mine is closed because of low head
grade ore• Study completed around Outotec ore
sorting solution considering reopeningthe mine
Study indicates that the Outotec ore sorting solutionenables reopening the mine:
“The economic assessment for the Laiva Gold Mineindicated the potential for restarting the site, whichcan be operated on a long-term basis at a broadrange of commodity prices. Base-case net presentvalue of €77 million, producing 529,000 troy ouncesof gold over a seven-year mine life.”

© Outotec – All rights reserved
Reducing mill downtime at a gold mineCustomer case, comminution
Q1-Q3 2016 OUTOTEC IR presentation44
Customer challenge• Excessive grinding mill downtime during the year
leading to decreased yearly production• Unplanned mill downtime due to liner failure• Inadequate tooling• Limited reline shutdown planning• Coordination between different maintenance
vendors• In total of over 340 hours downtime
due to mill maintenance
Outotec solution• Pre shutdown planning• Liner redesign – to reduce the number of pieces• Tooling improvements – liner handler, skid steers & hand tooling• Changes to liner fixtures & fittings• Continuous Improvement Program• Optimizing liner life time through Outotec patented MillMapper™ software
Customer benefits• 50% less downtime due to mill
maintenance• In total a reduction of 170 hours
of reline incurred downtime• Safer, less labor intensive relines• Circa 12-14 million USD in
additional production revenue

© Outotec – All rights reserved
HIGmillTM fine grinding for FQM KevitsaCustomer case, comminution
Customer challenges• Fine valuable minerals
and difficult to recover• 12% copper not
recovered in coppercircuit due to poorliberation
• If liberation poor,copper-nickelseparation insufficient
• Existing plant in arcticcircle with limitedfootprints
Q1-Q3 2016 OUTOTEC IR presentation45
Outotec solution• Mineral analysis showed very fine grind < 20 micron required for
copper & nickel liberation• Outotec conducted laboratory HIGmill fine grinding and mineral
recovery (flotation) tests• HIGmill chosen as most energy efficient and smallest footprint
technology on market today which would improve mineral recoveryand grade
• Installation & commissioning only 2 weeks in Feb 2015• Outotec provided ramp-up and operation support
Customer benefits• HIGmill improved overall plant performance• Copper loss to nickel circuit improved from 12% to 8%• Overall copper recovery increased by up to 1.5%
• 1.5% increase represents around $1million increase in finalcopper value, after smelting and refining to produce LME gradecopper
• Improved concentrate grades• Less nickel in final copper concentrate• Less copper in final nickel concentrate
• Installed & commissioned without effecting production• HIGmill allowed coarser primary grind and hence higher plant
throughput• More metal out of same ton of ore < 2 year payback

© Outotec – All rights reserved
Turn-key flotation retrofit with fast turnaroundCustomer case, flotationCustomer challenge• Poor flotation performance in terms of copper and gold recovery• Flotation circuit had poor availability• Substantial maintenance requirements• Limited time available for shutdown
Q1-Q3 2016 OUTOTEC IR presentation46
Customer benefits• Greater stability and control of flotation cells• Significantly decreased energy consumption
with Outotec cells (40%)• Minimized production losses during
installation and commissioning• Increased flotation circuit availability, leading
to increased production• Improved recovery of coarse particles
Outotec solution• In-depth metallurgical assessment identified large improvement potential in the
flotation plant• Retrofit of 10 x 160 m3 flotation cells• A full turn-key delivery• Advanced operator training with Outotec´s Virtual Experience training

© Outotec – All rights reserved
Digitalization creating new growth and opportunities -managing water balance and quality at mine sites
Q1-Q3 2016 OUTOTEC IR presentation47
Solution: Intelligent digital solution for monitoring and managing dataon the mine site’s water balance and quality.
Value: Sustainable balance of water supply and consumption,while stabilizing production and reducing business risks.
Onlinemonitoring
Digitalplatform
Modeling &simulation
Predictability& reliability
Accessto water
Alternativewater
sources
Stableprocess
Mitigationof risks
Licenseto
operate

© Outotec – All rights reserved
Holistic process water management reducesoperational risks, OPEX and effluents
Q1-Q3 201648
With higher closure rate• Reducing raw water need• Reducing process variations to improve yield• Process water doesn’t need to be potable water grade• At full closure basically no effluents• Less socio-political risk related to fresh water
OUTOTEC IR presentation
* Example of 20 Mt/a Cu concentrator water balancein Chilean climate using paste tailings, price of rawwater 4 USD / m3.

© Outotec – All rights reserved
Holistic tailings management can bring significant costsavings and reduces safety risks
• Holistic tailings management covers bothsurface and underground operations.
• Paste and dry stacking technologiescombined with closed water loops arethe best available technologies forconserving water within the concentratorenvironment.
• The short and long term risks can besignificantly reduced by reducing theamount of water in the surface tailingsstorage facility.
Q1-Q3 2016 OUTOTEC IR presentation49
PASTEBACKFILL
DRYSTACKING
Footprint= 12%OPEX= 37%
PASTE
Footprint= 53%OPEX= 58%
THICKENEDTAILINGS
Footprint= 72%OPEX= 75%
WETTAILINGS
Footprint= 100%OPEX
= 100%

© Outotec – All rights reserved
Codelco Ministro Hales 1/2Customer case, full solution
Q1-Q3 201650
Customer challenges• Ore with very high content of impurities, primarily
arsenic causing challenge in processing
• Commercial terms for the concentrate notfavourable for selling
OUTOTEC IR presentation
Outotec solution• Several studies and test campaigns over the years to identify
best metallurgical solution
• Complete, integrated process which is based on patentedOutotec solutions and technologies and proven Outotecproprietary equipment
• Arsenic levels of the concentrate lowered without loosing sulphur
• Sustainable water and effluent treatment in challengingenvironment
1991
•Codelco and Outotecstart working togetheron solving thechallenges
2010
•Investment decisionmade
2014
•Commissioningcompleted
2016•Official inauguration

© Outotec – All rights reserved
Codelco Ministro Hales 2/2Customer case, full solution
Q1-Q3 2016 OUTOTEC IR presentation51
Partial roasting• Patented Outotec solution which
removes over 90% of the arsenic inthe ore concentrate
• Exceeding 605,000 tpa concentrate(110%)
Gas Cleaning• Outotec’s proprietary gas cleaning
and sulfuric acid productiontechnology eliminates over 99.9% ofthe gaseous emission of the facility.
Effluent Treatment• Outotec’s proprietary effluent treatment technology cleans the process
effluents and recirculates clean water back to the process.
Outotec delivers a complete, integrated solution from a broad portfolio of patented andproprietary solutions, and a long history of process technology

© Outotec – All rights reserved
Norilsk Nickel, Nadezhda Flash Smelting Furnace No.1modernizationCustomer case, modernization
Q1-Q3 201652 OUTOTEC IR presentation
Customer challenge• Changing raw material base requires dealing with low-heat value
and more complex concentrates• Very tight implementation schedule• Supplier responsible for providing Russian Safety Approvals
which is normally out of scope
Outotec solution• Higher capacity feeder and concentrate burner and new furnace
cooling elements and cooling monitoring system based on Outotecproprietary technologies
• Pre-planning and experienced personnel• Extensive performance guarantees combined with a long-term service
contract• Using internal and external resources to obtain Russian Safety
Approvals• Short implementation and down time and fast ramp up after start up

© Outotec – All rights reserved
Pelletizing Segregation SolutionCustomer case, profitability improvement
OUTOTEC IR presentationQ1-Q3 201653
Customer challengeCustomer had a profitability challenge in an iron-orepelletizing plant in Brazil
FuelConsumption
FuelConsumption
ProductivityProductivityProductQualityProductQuality
Outotec solution• Assess to identify improvement potential
• Plant Performance Assessment• CFD Study• Pot Grate Tests
• Design a tailored solution• 3D area scanning• Double Deck Roller Screen basic design• Shutdown planning
• Deliver a holistic, safe & efficient implementation• Detail design for modernization• Retrofit new Outotec Double Deck Roller Screen• Shutdown execution
• Verify & support performance results• Segregation verification test• Energy efficiency test
Delivered Value*
10.5% fuel savingsImproved productivity2,8 M€ annual OPEX savings*6 month payback*
*Value Assumptions: Natural Gas: € 0.37/Nm3, Antracite: € 0.12/kgOnly estimates based on pot grate tests.

© Outotec – All rights reserved
ERZ Zürich, sludge incineration plantCustomer case, waste to energy
Q1-Q3 201654
Customer challenge• Sustainable solution required to treat sewage sludge from the entire canton of Zürich,
Switzerland covering over 70 waste water treatment plants!• March 2013 – public must approve such an investment in a referendum. 96% vote in favor,
project goes ahead• Summer 2015 – commissioning complete and plant goes into operation. October 2015 –
official inauguration.• Limitations for sewage sludge disposal in landfill and as fertilizer• High transport and logistics costs for sludge containing > 70% water• Strict emissions limits with plant location in the heart of Zürich
OUTOTEC IR presentation
Outotec solution• Self-sustaining thermal treatment of sewage sludge without additional fuel.
• Thermal incineration of sewage sludge using Outotec fluidized bed technology• Thermal dryer using heat from the process.
• State-of-the-art flue gas cleaning system• Phosphorus recovery possible from ash

© Outotec – All rights reserved
UK moving to a new renewable energy subsidy scheme
Q1-Q3 2016 OUTOTEC IR presentation55
Ending of the previous subsidyscheme resulted in record highorder intake for Outotec Wasteto Energy solutions for Advancedstaged gasification usingrenewable fuels
6 plants &4 O&M (12-years)
New subsidy scheme continued tobe good for Outotec Waste toEnergy technologies
1 plant,next CFD auction
expected late2016

© Outotec – All rights reserved
Levenseat Renewable ltdCustomer case, waste to energy
Q1-Q3 201656
Customer challenge• UK is exporting high amounts of RDF
to be incinerated in Europe• High landfill cost in the UK
OUTOTEC IR presentation
Outotec solution• Waste to Energy plant in UK• Gasification of waste is an environmentally friendly way of
efficiently converting waste to energy• Reliable and tested solution based on the Outotec Fluidized
bed technology with over 100 references• 2015 Contract signing, 2017 expected start up

© Outotec – All rights reserved
Service offeringbuilding blocks
Performance services
Q1-Q3 2016 OUTOTEC IR presentation57
OperationsServices
AdvisoryServices
MaintenanceServices
RemoteServices
TrainingServices
Spare andWear Parts Upgrades
Decreasedoperating cost
Improved health andsafety
Improvedenvironmental
efficiency
Improved capitalefficiency
Improved equipmentand process
efficiency
Our solutionstarget toaddresscustomer
challengesand improve
theirperformanceand efficiency
© Outotec – All rights reserved
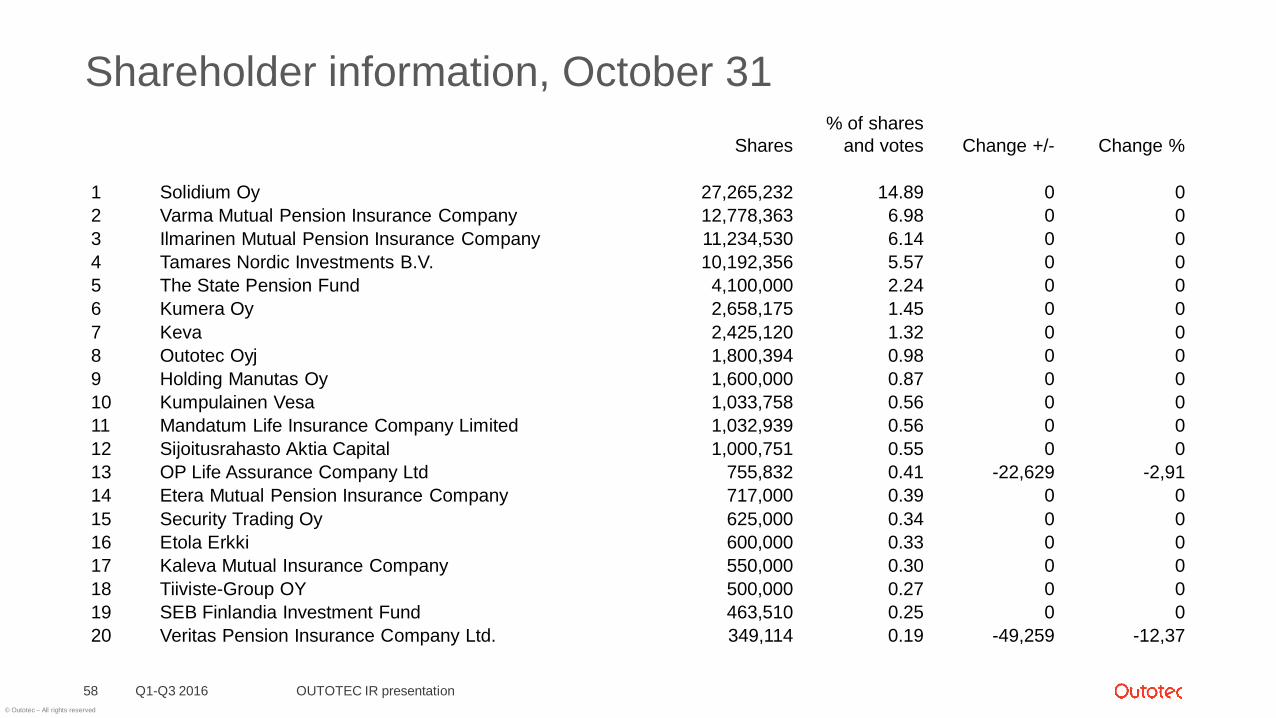
Shareholder information, October 31
Q1-Q3 2016 OUTOTEC IR presentation58
Shares% of shares
and votes Change +/- Change %
1 Solidium Oy 27,265,232 14.89 0 02 Varma Mutual Pension Insurance Company 12,778,363 6.98 0 03 Ilmarinen Mutual Pension Insurance Company 11,234,530 6.14 0 04 Tamares Nordic Investments B.V. 10,192,356 5.57 0 05 The State Pension Fund 4,100,000 2.24 0 06 Kumera Oy 2,658,175 1.45 0 07 Keva 2,425,120 1.32 0 08 Outotec Oyj 1,800,394 0.98 0 09 Holding Manutas Oy 1,600,000 0.87 0 010 Kumpulainen Vesa 1,033,758 0.56 0 011 Mandatum Life Insurance Company Limited 1,032,939 0.56 0 012 Sijoitusrahasto Aktia Capital 1,000,751 0.55 0 013 OP Life Assurance Company Ltd 755,832 0.41 -22,629 -2,9114 Etera Mutual Pension Insurance Company 717,000 0.39 0 015 Security Trading Oy 625,000 0.34 0 016 Etola Erkki 600,000 0.33 0 017 Kaleva Mutual Insurance Company 550,000 0.30 0 018 Tiiviste-Group OY 500,000 0.27 0 019 SEB Finlandia Investment Fund 463,510 0.25 0 020 Veritas Pension Insurance Company Ltd. 349,114 0.19 -49,259 -12,37

© Outotec – All rights reserved
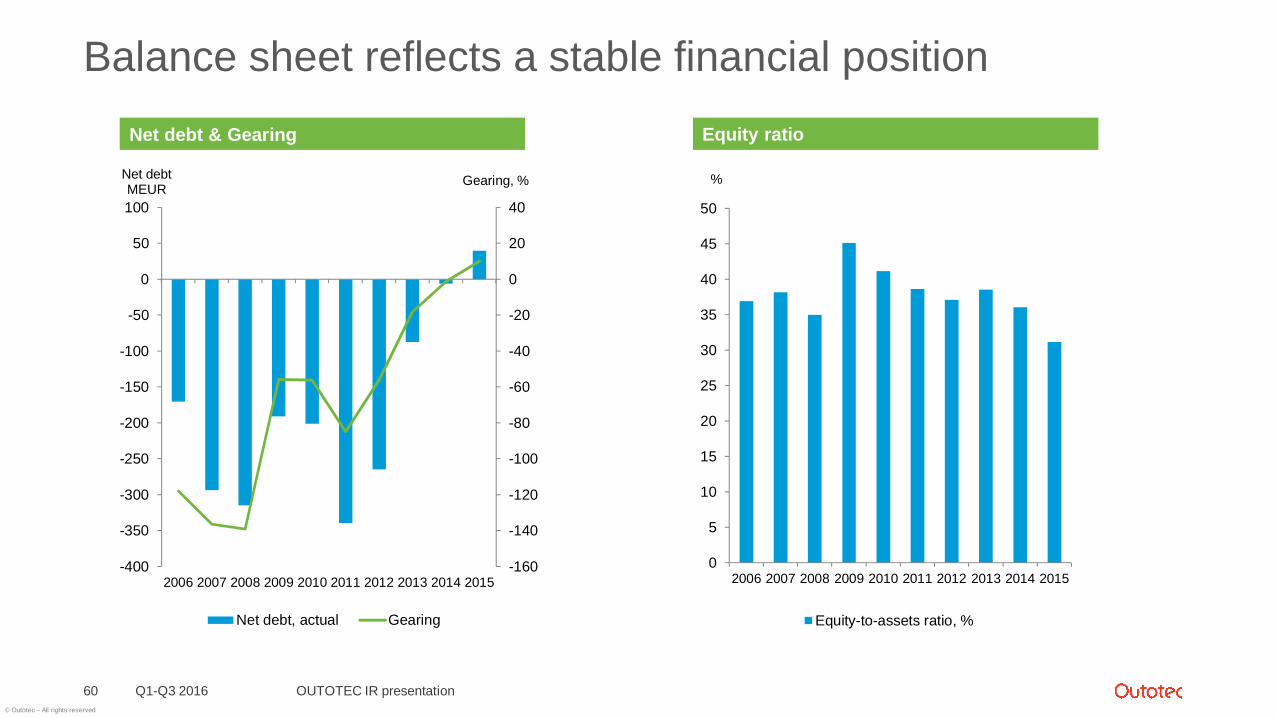
Balance sheet reflects a stable financial position
Q1-Q3 2016 OUTOTEC IR presentation60
-160
-140
-120
-100
-80
-60
-40
-20
0
20
40
-400
-350
-300
-250
-200
-150
-100
-50
0
50
100
2006 2007 2008 2009 2010 2011 2012 2013 2014 2015
Gearing, %Net debtMEUR
Net debt, actual Gearing
0
5
10
15
20
25
30
35
40
45
50
2006 2007 2008 2009 2010 2011 2012 2013 2014 2015
%
Equity-to-assets ratio, %
Net debt & Gearing Equity ratio

© Outotec – All rights reserved
Q1-Q3 2016 OUTOTEC IR presentation61