IPTE IPO - Home : Connect Group Investor Relations
32
Serge Pattyn (++32-2-417.53.78) [email protected] Broker Note: Belgian Stocks 2-May-00 IPTE IPO Reuters n.a. Bloomberg n.a. Datastream n.a. NTS Derivatives NONE PRICE* EUR 22.00 18/04/00 BEL20 2,934.80 Year's H/L n.a. n.a Market Cap. EUR m 128.5 # shares outstanding 5,476 # shares fully diluted p.m. Free Float p.m. Sales EBITDA Publ. EPS P/E P/E CFPS Price Gross Gross EV Earnings before after growth rel. vs. CFPS div. yield EBITDA (EUR m) (EUR m) (EUR m) BEL20 (EUR) (EUR) 1997A 8,790 n.a. 410 0.10 0.10 n.a. 226.0 9.33 0.09 236.64 n.a. n.a. 1.9 1998A 21,312 n.a. 422 0.15 0.15 52.4% 148.3 7.06 0.08 284.75 n.a. n.a. 5.9 1999A 46,975 4,914 1,107 0.48 0.38 221.7% 46.1 2.63 0.49 44.73 n.a. n.a. 5.8 2000E 97,174 10,378 3,642 1.12 0.95 135.3% 23.1 1.52 1.30 16.94 n.a. n.a. 11.4 2001E 123,947 13,140 5,457 1.33 1.18 18.2% 18.7 1.40 1.46 16.94 n.a. n.a. 9.1 goodwill (EUR) EPS * Assumption KBC Securities “… your partner for integrated test and production solutions …” • Integrated Production and Test Engineering (IPTE) is active in the fast growing and rapidly evolving electronics industry. IPTE develops and manufactures test and production equipment which it integrates into completely automated production and assembly lines for the electronics industry. “Connect Systems”, taken over in 1999, is a contract manufacturer for the same electronics industry which produces high-grade Printed Circuit Board’s (PCBs) and assembles complex cables and cable systems. • IPTE was founded in 1992 and has known a rapid growth, since the start doubling its turnover every year. In 1999, sales again grew 120% to reach EUR 47m. The management aims to continue that way and turns to the capital market to raise EUR 26.3m in new share capital. The money will in the first place be used to restore the weakened balance sheet structure but will simultaneously create the space for IPTE to finance future internal and external growth. Acquisitions are one of the company’s main strategic objectives. • Growth drivers. The electronics industry is a fast growing market under the command of the telecom business (GSM, wireless communication,…). Other rapidly evolving sectors are the automotive industry (GPS, airbags, cruise control,…), the consumer electronics business (video, hi-fi, CD-Rom,…) and the computer industry. This fast growth leads to mass production which, to optimise the production flow and to cut the production costs, calls for a far-reaching automation. The shortening time-to-market ratio also requires flexibility in the production process. It is this trend on which IPTE is capitalising. IPTE at the same time benefits from the growing trend whereby the OEMs outsource the production and logistics of their electronic devices to the so called Electronics Manufacturing Service companies. • Our DCF valuation yields a EUR 132.1m value for the IPTE group or EUR 24.9/share. This value is confirmed by a pro forma DDM model and compares favourably to the multiples of other technology and comparable stocks which are, from a purely objective point of view, aggressively priced in the market. • Risk elements. IPTE’s business is technology driven and depending on key personnel. There is the need to stay on top to remain successful. IPTE’s business is project driven which could lead to certain volatility in the revenue stream. Missing out on a couple of projects can make a lot of difference. There is the requirement to be a global player. Competition comes from bigger and established players in the business. We believe however that the track record, the high entry barriers and the management strengths outweigh these risk elements.
Transcript of IPTE IPO - Home : Connect Group Investor Relations

Serge Pattyn (++32-2-417.53.78) [email protected]
Broker Note: Belgian Stocks 2-May-00
IPTE IPO
Reuters n.a.Bloomberg n.a.Datastream n.a.NTSDerivatives NONE
PRICE* EUR 22.0018/04/00 BEL20 2,934.80
Year's H/L n.a. n.aMarket Cap. EUR m 128.5# shares outstanding 5,476# shares fully diluted p.m.Free Float p.m.
Sales EBITDA Publ. EPS P/E P/E CFPS Price Gross Gross EVEarnings before after growth rel. vs. CFPS div. yield EBITDA
(EUR m) (EUR m) (EUR m) BEL20 (EUR) (EUR)
1997A 8,790 n.a. 410 0.10 0.10 n.a. 226.0 9.33 0.09 236.64 n.a. n.a. 1.91998A 21,312 n.a. 422 0.15 0.15 52.4% 148.3 7.06 0.08 284.75 n.a. n.a. 5.91999A 46,975 4,914 1,107 0.48 0.38 221.7% 46.1 2.63 0.49 44.73 n.a. n.a. 5.82000E 97,174 10,378 3,642 1.12 0.95 135.3% 23.1 1.52 1.30 16.94 n.a. n.a. 11.42001E 123,947 13,140 5,457 1.33 1.18 18.2% 18.7 1.40 1.46 16.94 n.a. n.a. 9.1
goodwill (EUR)
EPS
* Assumption KBC Securities
“… your partner for integrated test and production solutions …”• Integrated Production and Test Engineering (IPTE) is active in the fast growing and rapidly evolving electronics
industry. IPTE develops and manufactures test and production equipment which it integrates into completelyautomated production and assembly lines for the electronics industry. “Connect Systems”, taken over in 1999, is acontract manufacturer for the same electronics industry which produces high-grade Printed Circuit Board’s (PCBs)and assembles complex cables and cable systems.
• IPTE was founded in 1992 and has known a rapid growth, since the start doubling its turnover every year. In 1999,sales again grew 120% to reach EUR 47m. The management aims to continue that way and turns to the capital marketto raise EUR 26.3m in new share capital. The money will in the first place be used to restore the weakened balancesheet structure but will simultaneously create the space for IPTE to finance future internal and external growth.Acquisitions are one of the company’s main strategic objectives.
• Growth drivers. The electronics industry is a fast growing market under the command of the telecom business (GSM,wireless communication,…). Other rapidly evolving sectors are the automotive industry (GPS, airbags,cruise control,…), the consumer electronics business (video, hi-fi, CD-Rom,…) and the computer industry. This fastgrowth leads to mass production which, to optimise the production flow and to cut the production costs, calls for afar-reaching automation. The shortening time-to-market ratio also requires flexibility in the production process. It isthis trend on which IPTE is capitalising. IPTE at the same time benefits from the growing trend whereby the OEMsoutsource the production and logistics of their electronic devices to the so called Electronics Manufacturing Servicecompanies.
• Our DCF valuation yields a EUR 132.1m value for the IPTE group or EUR 24.9/share. This value is confirmed by apro forma DDM model and compares favourably to the multiples of other technology and comparable stocks whichare, from a purely objective point of view, aggressively priced in the market.
• Risk elements. IPTE’s business is technology driven and depending on key personnel. There is the need to stay on topto remain successful. IPTE’s business is project driven which could lead to certain volatility in the revenue stream.Missing out on a couple of projects can make a lot of difference. There is the requirement to be a global player.Competition comes from bigger and established players in the business. We believe however that the track record, thehigh entry barriers and the management strengths outweigh these risk elements.

IPTE
2
IPTE : “a rapid start in 1992”Company history
Founded in 1992 … IPTE was founded in 1992 (at the time as ITE NV) by 5 former Philips employees :Huub Baren, Wolodimir Dobosch, Gaston Moonen, Gilbert Nulens and Luc Switten.All had a very broad experience in the electronics business and were convinced thatthe evolution in the industry was such that it offered opportunities for a partner whichcould offer solutions to automate the production chain of electronic devices. Theywere convinced that electronic devices (gadgets at first but now part of everyone’s dayto day life) were to become commodities so that mass production would become anecessity. To be able to produce the high volumes efficiently and productively, theystrove for a high degree of automation.
… and up to a veryquick start
The group has experienced a rapid growth since the start and, despite the start upsituation in the early 1990ies, booked a bottom line loss only once (in the start-upyear) Turnover rose from EUR 0.8m (in 1993) to EUR 47m in 1999. This represents acompound annual growth rate (CAGR) of 97%. For 2000, IPTE aims at a turnoverfigure of EUR 97m (up again 107%). In 1999, 75% of the turnover was exported forwhich in January 2000, IPTE received the Royal Export Award. IPTE is present in 20countries, in Europe, America and Asia. The group chose to be a “global playeroffering a global reach” at a very early stage. The strategic reason for that was that themain clients, big electronic conglomerates, were also global players with a presenceworld-wide.
… partly on the back ofacquisitions
At the start, the group focussed on internal growth. 1998 was however a milestone inthe company’s history. In addition to the continued opening of new locations inEurope, Asia en the US, IPTE took over both the Automation of Test division fromPhilips, Hasselt as well as the former Gründig Factory Automation division (thisbecame IPE GmbH). It was the sign for further expansion as both acquisitionsexpanded IPTE’s market and enabled the group to provide additional product andservice solutions. IPE enabled ITE to extend the product range from test automationfurther into the production area. The take-overs made the group a business ofengineering and turn-key solutions for test and production lines relying on theknowledge gained from years of implementing Gründig and Philips productiontechnologies. By pooling the know how from different sources, IPTE could nowdeliver robotic systems adapted to the client’s unique specification.
In 1998, the internal growth continued also as IPTE started of in Singapore(IPTE Asia Pacific) and in Scandinavia (IPTE Nordic). The importance of having aninternational sales network can not be overestimated as witnessed by some of IPTE’sdirect competitors nowadays which have focussed on their domestic market in the firstplace sometimes dominated by one major player in one specific sector.
1999 : acquisition of theConnect Systems group
Growth continued in 1999 when IPTE (Kampenhout, Fürth/Germany and Luton/UK)took over the Connect Systems group (Houthalen, Ieper and Reijen in TheNetherlands). Connect Systems is a contract manufacturer for the (same) electronicsbusiness which produces high-grade PCBs (quick turn prototypes and small to mediumruns) and complex cables and cable assemblies. Connect Systems also offers relatedservices, e.g. assemblies of semi-finished and end products.

IPTE
3
IPTE’s “management for growth”:
1992 1993 1994 1995 1996 1997 1998 1999 2000 2001 …
Acquisition of PTS
Acquisition of Philips AoT
Acquisition of Connect Systems
Start of IPTE UK
IPTE USA, Germany and
France
IPTE America
IPTE Asia Pacific and
Nordic
IPTE's growth story
Major synergy between ITE/IPE and the Connect Systems group stems from the factthat both serve the same client base of major electronics companies. The integration ofConnect Systems and ITE/IPE allows the group to offer a one stop shopping conceptto the complete electronics industry.
Integration of test andproduction automationinto turn-key productionsolutions
IPTE integrates test, production and handling equipment into a turn-key, automatedmanufacturing line for the electronics industry, mainly for the production ofPrinted Circuit Boards (PCBs). There is a trend however to also integrate the finalassembly of the end product (e.g. a mobile phone) and the final test of that end product(does that mobile phone work as it should do ?) within the manufacturing line. IPTE’sservice also includes start-up support, training and repair and maintenance.

IPTE
4
Automation to thebenefit of the OEM’s
The benefits for the Original Equipment Manufacturers (OEMs) of this far-reachingautomation are : faster manufacturing throughput, elimination of operator error,optimisation of cost of ownership, reduced maintenance, increase of quality with adrive towards “zero defects”, higher productivity,… finally resulting in a higher returnon invested capital.
World top playersamongst the clients
IPTE’s main market is the fast growing electronics business. Key target segments arethe telecommunication business, the computer industry, the automotive sector and theconsumer electronics industry. IPTE ranks the top names in each of these segmentsamongst its clients: Alcatel, Blaupunkt, Bosch, Ericsson, Flextronics, Ford, Hughes,LG Electronics, Lucent, Motorola, Nokia, Nortel, Panasonic, Philips, Thomson, SCISystems, Siemens, Solectron and many others.
Connect Systems also ranks amongst its clients top names as Agfa, Barco, Flextronics,Honeywell, ICOS Vision Systems, New Holland, Philips, Xeikon and many others.
IPTE employed 617people at the end of1999
The IPTE group employed 617 people at the end of 1999 (277 with ITE/IPE and 340with Connect Systems). 64% was employed in Belgium. 20% of the people areapplication engineers or are active in R&D.
Business description
The IPTE group stands for 2 business units:
=
+ITE/IPE
test and production automation
Connect Groupcontract manufacturer
IPTE Group
ITE/IPE : test andproduction automation
ITE/IPE develops and manufactures high technology test equipment and test systemsfor the electronics business. Test equipment, which are the building blocks of which acomplete production line is made of, automates the testing phase of the material flowas it connects the Printed Circuit Board with the electronic testing equipment. The testsystem also removes defective products from the process and reports test results andprocess information to the production control centre. The tests are analysedautomatically and the test results are displayed on screen. The repair stationsmonitored by computers allow for paperless repairs. The real time test data allow torespond rapidly to product defects. The advantages of automatic in-line test equipment,without having to remove the PCB from the production line for manual testing, is i.a.throughput, efficiency and “zero defects”.
IPTE
5
IPTE originally started of in test equipment which in a first phase tested PCBs whichwere “under construction”. The latest trend however is that the automated productionline not only produces the PCB but also assembles the end product (e.g. a mobilephone). The automated production line then has to be completed with final testequipment that makes sure that the device is working the way it should be.
Schematic overview of the production flow:
Production phase
Production equipment(odd component placers, in line depanelling units,
assembly cells, pick & place robotics,…)
Handling and transport equipment(lift & turn units, transporters, insertion & alignment
tools, belt driven modules,…)Measuring equipment
Test equipment Final assembly and final test equipment
PCB or finally
assembled
device
Bare-board
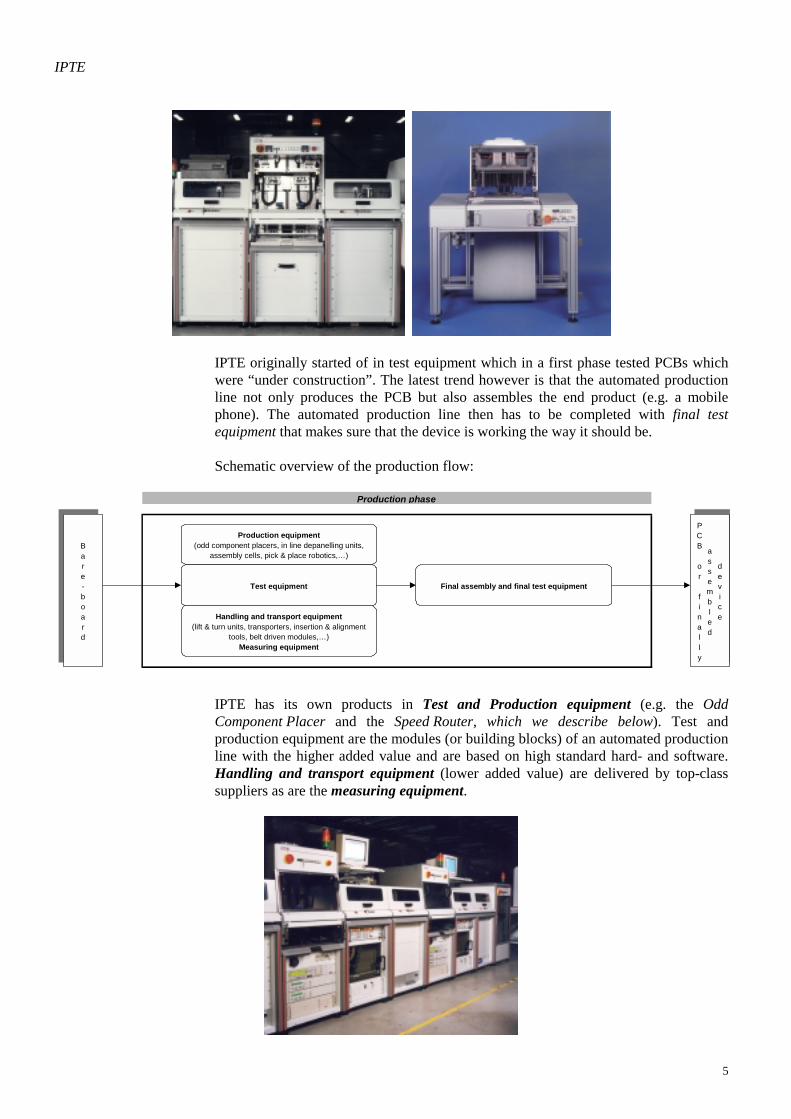
IPTE has its own products in Test and Production equipment (e.g. the OddComponent Placer and the Speed Router, which we describe below). Test andproduction equipment are the modules (or building blocks) of an automated productionline with the higher added value and are based on high standard hard- and software.Handling and transport equipment (lower added value) are delivered by top-classsuppliers as are the measuring equipment.

IPTE
6
Pooling know how toassemble entireproduction lines
Having built up a thorough understanding of the test and production automation phase,IPTE now concentrates on the design and integration of complete production linesbundling its own expertise (in test and production automation in particular) with theexpertise of others in the other domains. IPTE’s added value stems from the fact thatthe group integrates all the modules into one turn-key solution for the customer. IPTEco-operates on a non exclusive basis with knowledgeable partners such as DigitalTest,GenRad, HP, IFR, Innovate, ITA, National Instruments, Rohde & Schwarz, Spea,Tektronix, Teradyne and Wayne & Kerr. The know how built up over the years as wellas the relationships established with the major clients make it difficult for competitorsto easily enter this market. On the other hand, a technology driven company as IPTEbased on this kind of know-how and expertise becomes dependent obviously on keypersonnel.
… and not far offassembling the endproducts too
The business continues to expand and the industry now calls for further automation ofthe final assembly and final test of the end product too. Final testing however requiresadaptation to the physical dimensions of the unit to be tested (e.g. a mobile phone) andspecific probing techniques to verify or actuate the different functions of the productssuch as displays, buttons, antennae inserts and power connections. This trend howeveroffers new possibilities for further expansion for IPTE. Only recently , the group wasable to win its biggest contract ever worth EUR 8.7m (Bef 350m) for the assembly andfinal testing of GSM’s for a major European client whose name was not yet disclosed.
To give an idea of what IPTE’s products do and how they are set up, we highlight justtwo of IPTE’s recent realisations:
The IPTESPEED ROUTERTM
Because of the miniaturisation in the PCB business, several separate (little) PCBs areoften produced on one single bare-board which has to be cut in individual unitsafterwards. High-technology PCBs however require a precise, stress-free separationprocess to prevent damages. To find an answer to the problems this generates, IPEdeveloped its own de-panellising unit : the IPTE SPEED ROUTERTM.
A gripper holds the panellised boards during the cutting process and precisely locatesthe separated PCBs for output to carriers, handling modules or pallets. A cameraverifies the accuracy between the cutting point and PCB print. The presence of agood/bad board mark can also be verified, defining the action to be taken (not-cuttingthe panel or separate rejected PCBs at the output station).

IPTE
7
The IPTE SPEED ROUTERTM is controlled via a PC operating under Windows NT.Programming is easily accomplished simply by loading a file into the system andsetting cutting speeds and depths. The system can also be used for programming orviewing the actual cutting process. The statistics provide information about the cuttingprocess. The manual loading and unloading of an off-line de-panelliser is often themost economical approach for the production of small batch sizes or a high number ofPCB diversity. The optional manual loading/unloading system permits the exchange ofPCBs while one PCB is being de-panellised offering a cycle time reduction even inoff-line mode.
The IPTESPEED MOUNTERTM
The automation of odd component placement is economically justified when a varietyof components need to be placed at high production rates. Odd component placementdelivers improved quality due to the elimination of human error. The flexibility of theequipment provides the automation capability of odd form components even forvariable batch sizes and a number of different component shapes to be placed.
The IPE SPEED MOUNTERTM meets the required flexibility and high production ratesof today's modern production lines. Intelligent feeder magazines, for both fixed andflexible component handling, are mounted on an accurate positioning feeder trolleyend allow the exchange of a single feeder during the actual placement operation,providing increased production time. Tolerances in component feeders areautomatically adjusted each time a new order has been entered or a feeder has beenexchanged.
Optical marks are used to verify the position of the PCB. TheIPTE SPEED MOUNTERTM automatically corrects the placement with reference to themarks on the PCB. This permits exact placement of components without extremetolerance requirements for the component leads and/or PCB holes.
Connect Systems : high-grade PCBs …
Connect Systems manufactures high-grade PCBs in small to medium size runs. PCBsare i.a. used in the computer, automotive, telecommunication, instrumentation andmedical industry. Printed Circuits are electrically conductive wiring elements whichare outlined on rigid boards or a flexible material on to which various electroniccomponents are bonded to make up and complete an electronic assembly. PCBs, thephysical structures on which electronics components are mounted, therefore have avital importance in virtually every item of equipment where electronic control systemsare used. Manufacturing is divided in 5 steps : board preparation, application ofconductive coatings, soldering, fabrication and assembly. Connect Systems also helpsthe clients in optimising the PCB design and the PCB development beforemanufacturing starts.

IPTE
8
… and cable assemblies Besides the PCBs, Connect Systems also offers contract manufacturing services forcable assemblies and (complex) harness assemblies. A cable is an assembly ofelectrical conductors insulated from each other and twisted around a central core andjacketed. Connect Systems produces different custom manufactured cable and harnessassemblies for molded an mechanical applications. These assemblies include multi-conductor ribbon co axial cable assemblies and discrete wire harness assemblies.
Connect Systems also assembles semi finished and finished products, i.a. for Agfa,Xeikon and BankSys.
Shareholders structure
Original founders stillthe majorityshareholders
The original founders are still the majority shareholders of the company holding 80%of the shares. A few other private partners have in the mean time joined the company.They hold 20% of the company. Because the fast growth had generated extra financingneeds, Parnib and Artesia granted IPTE a EUR 4.96m (Bef 200m) subordinated loan in1999. This loan is to be converted into share capital at the occasion of the IPO. Parniband Artesia will benefit from a 20% discount with regard to the IPO price and areassumed to hold about 4% of the company after the operation. The original foundersare to be diluted but are to remain the majority shareholders.
80% 20%
(°) Baren, Dobosch, Moonen, Nulens and Switten
Founders (°) Others
IPTE group
Management structure
The group is led by a 9 men strong management committee headed by the mainshareholder Huub Baren. The management structure is as follows:
Other managers
Original founders
Huub BarenCEO
Vladimir DoboschProduct Manager
Gaston MoonenProduct Developm.
& Engineering
Gilbert NulensSales Manager
ITE/IPE
Luc SwittenSales Manager
Connect Systems
Hugo CirouxCFO
Emmerich HöltlOperations IPE
Flor PeersmanOperations Connect
Frank VerjansOperations ITE

IPTE
9
Marketing
International presenceguarantees world widecoverage …
As already explained, IPTE aimed right from the start at developing an internationalpresence because the clients were mainly international groups with the same world-wide coverage.
This explains why IPTE is present in Europe, the US and Asia from where a total salesteam of about 30 people actively follows up on the clients. IPTE has sales offices andis directly present in 7 countries : Belgium, France, Germany, Singapore, UK, US andSweden. Other countries are followed up via agents or from the own regional salesoffice. In that way, IPTE also covers countries like Hungry, Poland, Italy, Turkey,…Singapore is the stepping stone for the complete South East Asian region (Malaysia,China, Indonesia,…)
The local sales offices are supported by the head office as far as product developmentand price settings are concerned. IPTE aims to become a preferred supplier with themajor electronic firms as this gives access to a more far-reaching collaboration on theclients automation requirements.
The local sales offices are also responsible for the very important after sales service(i.a. maintenance and repair, training, service and support, spare parts,…).
R&D
Guarantee for the future…
For IPTE it remains a prerequisite to stay on top in terms of technological innovations.To be successful in the future, IPTE will constantly have to be alert for newdevelopments. With competition mounting, the company would very quickly bepunished by the high demanding clients if they would not be able to offer high-gradesolutions to their clients.
The success recorded over a very short period of time - since the start in 1992 – hasproven that IPTE has in house the technological capabilities to keep responding to theever demanding electronics industry. IPTE combines the unique knowledge of both theautomation process and the production process. This makes it also difficult for othercompetitors to enter the industry as it requires not only a great deal of technical know-how, but also a good contact and understanding with the clients.
High-schooledemployees …
Out of the 617 people employed, IPTE has engaged 50 application engineers whileabout 71 are active in project oriented R&D. ITE/IPE aims to invest about 4-5% of itsturnover in R&D.

IPTE
10
Strategy
Know-how built up stepby step
Since the start, IPTE has constantly been expanding its know how and technicalcapabilities evolving from test automation over production automation towards thedesigning of completely automated production lines. The latest step is the integrationof the final assembly and final test into the production line. The clients as well asproduct bases are further broadened all the time. The scheme below, summarises theway IPTE has developed:
T es t a u tom a tion
C om p le te des ign ing o f p rodu ction line … .
in c lud in g assem b ly and fina l tes ting
P roduc tion au to m a tion
Strategic evolution
C o n n ect S ys te m s
S am e c lien t b as e
20 00
1998
1992
1999
199 9
Connect Systems : againvery muchcomplementary
Connect Systems joining the group in 1999 is the latest trump card allowing IPTEagain to expand the products and services it offers to the (same) electronics industry.Connect Systems strengthens the commercial power of the group as it gives IPTE thepossibility to set up a one stop shopping concept to address the major clients. Theacquisition of Connect Systems is partly also a question of vertical integration asITE/IPE will be able to use the Connect Systems products in its own test andautomation equipment while Connect Systems will be able to use the test andproduction systems of ITE/IPE in assembling its own high-grade PCBs.
Good spreading oversectors and clients
The aim is to further develop this successful strategic approach not neglecting the riskaspects however. IPTE deliberately keeps guard over a good spreading of its sales overa considerable number of clients. Philips is the most important client representing 20%of the sales figure but that is to be put into perspective. Philips’ 20% share isrepresented by separate Philips’ business units in different sub-sectors headed bydifferent decision takers. In this sense, Philips is not to be regarded as a dominantclient.
Unlike some of its competitors, IPTE has this advantage that it is not focussed on oneparticular sector. The evolution in the telecom business is such that as of today, thereis great focus on the (mobile) telecom business but nevertheless, there remains a goodspreading and the management is well aware of the fact that it should keep it that way.

IPTE
11
3 4 .0 %
2 6 .0 %
1 3 . 0 %
1 2 .0 %
1 0 . 0 %5 .0 %
E M S m a r k e tC o n s u m e r e le c t r o n ic sT e le c o mP CA u to m o t iv eO t h e r s
This situation at the end of 1999 is very much to be seen as a picture on a givenmoment. As already said, telecom is very much on the rise for the moment, but itcould well be that the situation reverses again one day.
Further expansionenvisaged
IPTE’s management is also clear in its ambition to keep expanding its operations. Thedecisive considerations in assessing a possible take-over being :1. Capability (know how) and capacity (personnel) ;2. Complementary of products and systems ;3. Client relations ;4. Geographical presence.
… also internationally IPTE wants to strengthen its presence further - in the US and Asia in the first place.From 1992 on, the company has tried to build up a global reach with a world widecoverage. We feel this was (and is) the right strategy as confirmed also recently byFrost & Sullivan1 “sales, service and support strategies on a global scale are ….becoming increasingly necessary to maintain competitiveness”.
Standardisation of theproducts to optimisemass production
Already a few years ago, IPTE was convinced that efforts had to be made tostandardise as much as possible the modules which the group developed and whichwere to become part of a integrated and automated production chain. It now means thatIPTE is better placed than its competitors to develop new production lines efficiently.The management expects that only 20% of the current projects is tailor-made work.The balance is built up from the knowledge gained over the past few years. It alsomeans that IPTE is best placed to offer technically advanced but price competitivesolutions to its clients.
1 Frost & Sullivan, European Automatic Test Equipment Markets, 2000

IPTE
12
Sector analysisThe electronics industry
The electronics business: a fast grower andevolving rapidly
The electronics market, which emerged as a significant sector as a result tobreakthroughs achieved in the computer industry in the 1980s and intelecommunications in the 1990s, is evolving rapidly. Certain electronic appliances,which were regarded gadgets even not so long ago, are now part of everyone’s day today live. No need to refer to the mobile phone in that respect and the speed with whichit realised its breakthrough in our society.
The [r]evolution is characterised by two axes of development:
New products areintroduced …
� new applications and new productsMobile phones, airbags, higher-grade household devices, GPS, “on board” computersfor cars,... are just some of the products which have been introduced over the past fewyears (or should we say months) to some extent driven by the revolution in the telecombusiness. New products are developed faster than ever before with life cyclesshortening all the time. It is remarkable to see the speed with which new products aresuccessfully introduced on the market.
While existing productschange ever so rapidly
� rapidly changing existing productsNot only are new products developed very rapidly, the technological renewals alsohave an impact on the existing products (hi-fi, household appliances, video, remotecontrol,…). Hence, also the existing products have to be adopted rapidly to respond tothe changing consumer demand and the new market trends in general. No need to pointat the marketing strength of the bigger players in the electronics industry in thatrespect, which actively stimulate the replacement market.
High volumes, priceerosion, a highdemanding consumer,…all call for automation
These trends put pressure on the producers of the electronic apparatus:• major challenge being the need to produce high volumes : video, mobile
phone,… are just two devices used by a growing number of people. As will beoutlined below, most of the automotive “gadgets” (cruise control, GPS,…) arenow becoming standard devices. High volumes however lead to the need toautomate to assure productivity.
• competition is hard and leads to price erosion (cf. the evolution in the PC marketwhere the unit price is to come down from >USD 2,000 to an expected USD 1,250in 2003, source : SG Owen) . Against this background, manufacturers of electronicdevices constantly look for productivity gains and more efficiency (hence againthe need to automate). Just in time production is just one aspect of this problem.

IPTE
13
• marketing wise, the wishes from the consumers are changing ever so rapidly also.The colour, weight, shape,… must be adapted rapidly if the consumer wishes so.Not only do the producers of electronic devices have to raise their productioncapacity faster and faster, the newly installed capacity also has to be flexibleenough to adjust the products rapidly whenever needed.
• ever more demanding consumers : electronic devices become more complex onthe one hand (smaller, lighter,… with more features) and need to be producedfaster and more accurate and on the other hand. Consumers do not accept defaultsso manufacturers now work under a “zero defaults” tolerance (guaranteed byIPTE’s products).
… as does massproduction
These trends form the basis of the success of IPTE : the IPTE products allow for massproduction, put great emphasis on productivity and efficiency, respect the “zerodefault” tolerance and are flexible in this way that a slight adjustment of the set up ofthe production line can change the end product.
Against this background, IPTE’s focus is for the time being on four key electronicssub-industries : telecommunication (obviously…), automotive , consumer electronicsand personal computers (incl. peripherals). These four sub-industries are all fastgrowers and are rapidly changing also (need for mass production, new products withshorter time-to-market cycles, new features being introduced at a very high speed, …).
Telecommunication
Mobiletelecommunication : thedriving force for thetime being
Telecommunication is, under the command of the world-wide deregulation and thebreakthrough of mobile communication, for the time being the fastest growing marketsegment. The growth in telecom is assumed to be a global one and not at all cyclical.The mobile phones and the other mobile devices continue their upward trend partly onthe back of the introduction of new applications (internet, wireless communication,data communication, WAP,…). GSM penetration in particular, which grewexponentially over the past few years. is still on the rise. The market penetration inmost of the European countries, on average about 40.5%, still leaves room for furtherexpansion. Salomon Smith Barney, sets the maximum penetration rate in any givencountry at 85% and expects the global world GSM market to be saturated only in 15years time.
A lot of people thus still have to buy their first mobile phone. But with the newapplications introduced and not to loose market share, producers need to develop newproducts fast. This in its turn stimulates the replacement market as a lot of existingmobiles phones are already regarded outdated. Not only is a growing number of peoplestill to buy their first mobile, the existing users start to change on to their second oreven third mobile phone already.
Some figures … In 1999, some 283 million GSMs were sold world wide (source : Dataquest). The GSAAssociation expects this amount to more than double to reach 614 million units in2002. Nokia expects that by 2004, 1 billion GSMs will be in use. The Yankee Groupexpects this figure to be reached already by 2003 (with about 60% capable of receivingwireless Internet). Mobile e-commerce is forecast to total 14 billion transactions in2005 for a total market of USD 200 billion according to Strategy Analytics. TheBoston Consulting Group expects that the on-line purchases in 2000 will rise with85%. Under these circumstances of accelerated growth, the automation trend in theproduction of telecom apparatus is only to accelerate.

IPTE
14
Automotive
Gadgets to becomecommon standard
Perhaps less conspicuous, the use of electronics in the automotive industry continuesto grow also. GPS, airbags, airco, cruise control, on board computers, car radio, motorand dashboard control systems and many other devices have been introduced into thevehicle. The car industry may evolve at mature growing rates, the car electronicsmarket grows much faster as the car manufacturers are continuously looking for newapplications. According to Freedonia, demand for chips in the automotive industry isto double by the year 2007 (USD 16bn in stead of USD 8bn in 1997). The attention isin particular drawn to environmental friendliness, performance and security.
What is even more important is that most of the new items which were regarded assupplementary gadgets in the past are now becoming common standard in most of thenewly produced cars. This again calls for mass production and automation on whichIPTE will capitalise in the future.
Some examples … Just to give a few examples of the desire for innovation as far as car electronics isconcerned:� Ericsson, Volvo and Telia (of Sweden start of a joint venture (WirelessCar Corp.,
the name speaks for itself) to offer services to enable car manufacturers and fleetoperators to send and receive information from vehicles. The joint venture willoffer car-management information to fleet operators and carmakers.
� Trafficmaster, Motorola and Blaupunkt announced that they will offer real-timetraffic information for vehicle navigation systems.
� Scania recently presented its “car PC”, an on board computer monitored by voiceable to navigate, to call a telephone number and to send out electronic mail.
� An alliance between Delphi Automotive Systems and Palm is announced tointegrate the use of the Palm Top computer in vehicles.
� Peugeot and Vivendi are to set up a joint-venture to give European car driversaccess to the Internet.
� Ford and Daimler plan to offer Web access in their cars as an option from 2001on. By the end of 2002, Peugeot expects that 80% of the cars will be equippedwith Internet access. This also calls for mass production again as, if all newEuropean cars were to be equipped with Web access, the market would be 15mmillion units a year.
� Driver assist features that could stop a car before its gets an accident or wouldallow the driver to take a nap while the board computer keeps the car on the roadwould require 10 times the number of chips in the car than is today the case.
� Gentex’ automatic dimming mirrors to the automotive industry use a combinationof sophisticated sensors and electronic circuitry to detect glare from trailingvehicles and automatically darken to eliminate the glare and make night-timedriving safer.
The vehicle navigation and “telematics” market, the sending of visual, text and spokeninformation to and from vehicles, is likely to be worth more than USD 24 billion in theUS and Europe by 2004 according to Price Waterhouse Coopers.
Computers and peripherals
Penetration of PC’s stillon the rise
No need to explain that the use of personal computers is still on the rise. With theinternet revolution, more and more households are tempted to buy their own personalcomputer. Not only the market of the new PC’s is expanding. As technologicalinnovations upgrade the performances of the PC’s, there is also an active replacementmarket breaking through.

IPTE
15
The sale of PC’s rose 22% in 1999 (to 113.5m pieces). SG Owen expects that in 2003,more than 180m PC’s are to be sold world-wide (up 60%). The latest figures fromDataquest learned that the sales over 1Q2000 were up 15% (to almost 30m pieces).What is also worth mentioning is that the current strong demand for PC’s andperipherals was supported by demand again from Asia while also in Latin-Americademand was on the way up. No need to point out that the market potential stillavailable in the developing countries is huge.
Consumer electronics
… stimulated by thereplacement market
The market for consumer electronics is to a large extent driven by the fact that oldapparatus are replaced by new ones especially in the US and in Europe. In Asia andLatin America, the industry is still in a build-up phase of selling products which arealready regarded common standard or outdated in the developed markets.
However, new technologies are introduced too to address the developed economies.Think of DVDs and the HDTV, the possibilities explored with speech technology inhousehold applications… This trend has not yet stopped. Television, video recording,audio tuners, compact disc, remote control,… are just a few of the products which areupgraded continuously.
The consumer market (TV, video, hi-fi, kitchen appliances,…) is expected to rise 7%p.a. until the year 2005. Taking into account the continuous price erosions, it is fair tosay that the market will grow much faster in terms of volumes.
Other markets, the medical market for instance, are expected to grow also although itis not obvious to evolve towards mass production there. We are convinced howeverthat IPTE, keeping in touch i.a. with the EMS market (see below) will keep a closewatch on the sector evolutions and will be able to respond to changes when need be.
The Automatic Test Equipment Market2
Demand for testequipment is up …
IPTE’s success is indirectly a result of increased demand for electronics in our everyday live. The question is also to what extent this increase in demand for electronicsrelates to demand for automated test equipment and what the challenges are for thosecompanies active in automated test equipment. The market of automated testequipment has been evolving rapidly too over the years to meet the requirements of thecustomers which have become increasingly demanding. As a consequence of that, testequipment has improved considerably while the range of applications has increasedaccordingly.
… as is demand of end-users in terms of costand technology
In general, demand for test equipment in Europe, IPTE’s operating base, has beenpicking up over the past 3 years on the back of high growth rates in the telecom andautomotive industries. The sector trends, which naturally relate to the “keys forsuccess” are the following:• Technology is continuously becoming more complex because the electronics
industry claims more complicated but smaller components with more featureswhich are to produced faster (reducing throughput time). The production lineshould on top of that be easily to adjust and guarantee flexibility (to formulate ananswer to the shortening of the product life cycles and the cyclical behaviour ofthe consumers).
2 Frost & Sullivan, European Automatic Test Equipment Markets, 2000

IPTE
16
• Higher demands from end-users in terms of cost price - despite the growingcomplexity of the products and systems.
• Growing emphasis on software (in stead of hardware). This offers more flexibilityand is relatively easy to update. The trend towards soft-ware based solutions is setto continue in the future.
• Growing market penetration of subcontractors. OEMs increasingly prefer not toget involved anymore in the production and/or test phase of their products.
• Increased demand for complete and integrated solutions. Again, OEMs outsourceas much as possible those tasks which someone else can do better.
• Higher competition which over time may lead to take-overs and consolidation.
Keys for success … The keys for success are the following:• To deliver the best technical solution at a minimum cost.• To pay great attention to related services and support activities.• To stay on top in terms of technological developments and to work out the right
solutions at the right time for the clients.• To strive for a world wide coverage.• To be able to respond to the clients needs fast.• To develop integrated, flexible and complete solutions for the end-users, if
necessary by forming alliances with partners which can add value to the solutionwhich you want to propose.
• To target the most lucrative segments of the electronics market.
IPTE is respondingsharply to theelectronics industry’sneeds
IPTE is in our opinion responding accurately to the latest sector developments and iswell placed to be successful in the future. The company is active world-wide and isaware that it should look for further expansion in particular in the US and in Asia.IPTE is constantly looking at developing new products and technologies - at presentfocussing for instance on the integration of final assembly and final testing. Byintegrating its own and third party modules in tailor-made solutions, it responds to theneeds of i.a. the OEMs which increasingly outsource the production and test phase oftheir products. Its software based applications make it possible to make the productionline as flexible as possible. In terms of cost price, IPTE will in the future benefit fromthe standardisation of its products. IPTE, better streamlined in that respect, is able toreact more rapidly to its clients’ wishes.
The EMS sector
Capitalising on theoutsourcing trend in theelectronics industry
More and more, the production of electronic devices is outsourced to the so calledEMS or Electronic Manufacturing Services companies. It is a trend which started offin the early 1980s to meet the demands of the emerging PC business. Originally, theEMS companies provided limited manufacturing services and were a simple extensionof their customers’ factories. Today however, having specialised in the high volumeproduction of electronic devices, they are full service contract manufacturers whichoffer their customers a wide range of manufacturing and management services on aturnkey or consignment basis. EMS companies may take care of design prototyping,material procurement and control, concurrent engineering services, manufacturing andtest engineering support, statistical quality assurance and complete resourcemanagement.
Continuing rush tooutsource
The EMS companies allow the Original Equipment Manufacturers (or OEMs) to focuson their core competence in R&D, product design, product technologies and marketing

IPTE
17
and sales and at the same time reduce the “time-to-market” for their products andlower their capital investments. They guarantee the most efficient production and offergreater flexibility in responding to the new market demands. EMS companies oftentake care of the (“just-in-time”) logistics delivering the products no matter where onthe globe. Many OEMs consider the EMS service companies as an extension of theirown production facilities. On top of that, the EMS companies are also ideally placed tofollow up on technological developments. New technologies are rapidly introduced ….again to the advantage of the return on capital of the OEMs.
Growth of >20% p.a.expected
Market watchers believe that this industry will keep growing. According toIEC Electronic Services, the EMS market is worth USD 60bn and is growing with20% each year. The market according to IEC Electronic Services is to more thandouble between 1997 (USD 73bn) and 2001 (USD 178bn). IEC Electronic Servicesexpects that by 2001, 52% of the PCB assemblies are to be outsourced.Technology Forecasters also expects the EMS market to grow by 20% p.a.
This trend has been appreciated by the stock market also as major EMS companies,mainly Americans, are listed companies and are very well valued :
Benchmark Electronics Celestica DII Group Flextronics
A M J J A S O N D J F M A M J J A S O N D J F M A
10
15
20
25
30
35
40
45
A M J J A S O N D J F M A M J J A S O N D J F M A
0
10
20
30
40
50
60
70
A M J J A S O N D J F M A M J J A S O N D J F M A
0
20
40
60
80
100
120
140
A M J J A S O N D J F M A M J J A S O N D J F M A
0
10
20
30
40
50
60
70
80
P/E 00: 36.3 P/E 00: 53.6 P/E 00: n.r. P/E 00: 41.7
Jabil Circuit Sanmina SCI Systems Solectron
A M J J A S O N D J F M A M J J A S O N D J F M A
5
10
15
20
25
30
35
40
45
50
A M J J A S O N D J F M A M J J A S O N D J F M A
10
20
30
40
50
60
70
A M J J A S O N D J F M A M J J A S O N D J F M A
10
15
20
25
30
35
40
45
50
55
60
A M J J A S O N D J F M A M J J A S O N D J F M A
5
10
15
20
25
30
35
40
45
50
P/E 00: 49.4 P/E 00: 43.4 P/E 00: 37.5 P/E 00: 54.4
Striving to become a“preferred supplier” ofthe EMS companies
IPTE is well placed to benefit from the trend in the EMS market. The group holdsgood relationships with the major EMS companies. Flextronics e.g. stands for 16% ofIPTE’s turnover. Via the EMS companies, IPTE can also hold a close watch on thesector trends as the EMS companies normally do not focus on one particular sector.Furthermore, collaboration with the EMS companies is of use for IPTE’s engineeringpeople keeping contact with the latest technological developments.
Perhaps not entirely to the advantage of IPTE, is the fact that the EMS companiesregularly buy automated test and production lines from electronics manufacturers. Theproduction lines, which are not necessarily using IPTE material, are integrated withinthe EMS organisation. In a number of case, it may lead to the IPTE equipment loosingmarket share.

IPTE
18
The success of the EMS companies is not to be halted yet. The share of the EMScompanies in the total production cost amounts nowadays 17% but is to rise to 75% in2020 according to Donaldson, Lufkin & Jenrette. The major EMS companies keepexpanding. Flextronics recently took over DII Group (creating the n° 4 in the EMSbusiness in terms of global revenues of USD 3.8 billion) and the Swedish contractmanufacturer Qcom AB (February 2000) and is investing in Eastern Europe. It is in afirst phase to build a 15,000m² production facility near Gdansk, Poland. The facilityshould be ready by November this year. Flextronics, which is already present inHungary too, also looks to further expand in the Czech Republic. The aim is to reducethe production and transportation costs in the region.Solectron is the n°1 in the EMS business (sales of USD 14 billion) which recentlyacquired assets from i.a. Trimble and Ericsson. Solectron recently also acquiredNULOGIX and SMART Modular Technologies.Sanmina took over assets from Alcatel and Harris Corp.
The Connect Systems group
The Connect Systems market is a more mature market with slower growth rates. Theleverage is however partly to come from the integration of Connect Systems into theIPTE organisation which will partly be a vertical integration. Connect Systems will usIPTE material to produce PCBs and IPTE will use Connect Systems cables and cableassemblies to manufacture test and production equipment.
Connect Systems seeks to pro-actively participate in the customers’ product design anddevelopment stage to provide value-added inputs on design for manufacturability andtestability, relating mainly to PCB layout and the choice of components.
Competitors
2 main Nordiccompetitors
IPTE has two major both listed competitors in the Nordic : JOT Automation Oyj andPMJ automec Oyj. Both have made their success on the back of the boom intelecommunication business. JOT is e.g. very much depending upon Nokia Oyj as thelatter stood for about 2/3ths of sales in 1998. JOT’s share price evolution is thereforevery much linked to Nokia’s share price evolution.
Only recently, JOT tried to take over PMJ but the proposal was rejected by PMJ’sboard. The offer when it was announced valued PMJ at EUR 388m. On the basis of thecurrent estimates (source : I/B/E/S), this means that JOT was willing to pay 87x theprofit estimate for 2000 (46x times the profit expected for 2001) and 55x the expectedcash flow for 2000 (35x the expected cash flow for 2001).
S O N D J F M A M J J A S O N D J F M A
0
2
4
6
8
10
12
14
JOT
Source: DATASTREAM
M J J A S O N D J F M A M J J A S O N D J F M A
0
2
4
6
8
10
12
14
16
PMJ
Source: DATASTREAM

IPTE
19
Both JOT and PMJ have been valued aggressively until recently when technologydriven stocks suffered from an important price correction. JOT’s offer valued PMJthen at 46x earnings estimate 2000 (24 times 2001) and 29 times cash flow estimate2000 (19 times 2001).
JOT had also to send out a profit warning recently. The EBIT margin would be 11%over 2000 in stead of 15% projected earlier. We believe that this may have to do withthe fact that JOT has been focussing heavily on the telecom business and on expansionin the Nordic countries in particular. The build up of an international sales networkwill negatively influence profitability. Remember that IPTE has already the salesnetwork in place and is not depending upon one major sub-sector or client.
Still both shares are very much appreciated by the stock market. P/E of 53x for JOTover 2000 (32x over 2001) and a P/E of 50x for PMJ over 2000 (26x over 2001).

IPTE
20
Historic financial figuresProfit and loss statement
Spectacular salesgrowth throughout theyears
As already pointed out, IPTE was up to a very quick start right from the beginning andsince 1992 has almost doubled its turnover every year (CAGR of 97%). In 1999,turnover was again up 120% reaching EUR 47.0m. Without the acquisition of ConnectSystems in August 1999, Sales would still have been up a remarkable 45%.
This strong organic growth is mainly the result of the efforts made over the recentyears to gradually expand internationally. Not to neglect also are the R&D effortswhich step by step have extended the product portfolio and which are now bearingtheir fruits. The gradual standardisation of the product portfolio is also contributingfavourably.
Financial reportsaccording to IAS rules
The financial figures are drawn up under the International Accounting Standards andrefer to 1997, 1998 and 1999 although only 1998 and 1999 have been reviewed by the(new) auditor in charge (Arthur Andersen). Arthur Andersen did not review the entiregroup and for certain subsidiaries (accounting for about 35% of sales and assets),based its opinion upon the audit reports from its foreign colleagues. Arthur Andersen,appointed only in 1998, also formulates a reservation as to the 1998 Profit & Lossstatement as they were not able to verify the stocks per 31 December 1997.
26.3%
30.4%
27.7%
6.8%
5.9%
7.3%
0.0
5,000.0
10,000.0
15,000.0
20,000.0
25,000.0
30,000.0
35,000.0
40,000.0
45,000.0
50,000.0
1997 1998 19990.0%
5.0%
10.0%
15.0%
20.0%
25.0%
30.0%
35.0%
Turnover
Gross margin
Operating profit
Gross margin
Operating profit
In 1999, Connect Systems accounted for 34.2% or EUR 16.1m of the consolidatedturnover. ITE/IPE stood for EUR 30.9m. In 2000, we expect both ITE/IPE andConnect Systems to contribute 50% each to the consolidated figures but as will bedescribed below, it is assumed that the share of ITE/IPE in the group’s turnover willgradually rise.
IPTE has a very good spread:• As to sectors: the most important sectors are the telecom business (32%) and the
computer industry (38%) ; automotive, consumer electronics and others accountfor 21%. No sector is therefore dominant. These percentage have to be put evenmore into perspective taking into account that IPTE has also a good spreadgeographically (with 75% of the ITE/IPE sales made abroad).
• As to clients: the most important ITE/IPE clients are Philips (20%) and the EMScompany Flextronics (16%). However, the ITE/IPE products are sold to differentbusiness units acting independently. Loosing out on one particular Philips clientwould not mean that ITE/IPE is to loose 20% of its sales figure. Connect Systemshas no dominant clients at all.

IPTE
21
Volatile operatingmargins
Sales grew year after year but seemingly, gross margin and operating margin are/weresubject to volatile up and down fluctuations. This requires a word of explanation:
� The 1999 gross margin and operating margin are not to be compared with theprevious years. The cost structure of Connect Systems, consolidated from1 July 1999 on, is totally different. Connect Systems has traditionally a lowergross margin but a higher EBIT margin because the Sales costs and General &Administrative costs are lower resulting in a better operating margin.Connect Systems does not charge any R&D costs against its P&L neither:
ITE/IPE
Cost of goods sold73%
R&D7%
General and admin7%
Sales13%
Connect Systems
Cost of goods sold89%
General and admin5%
Sales6%
The overall influence on the margins is considerable:
1998 1999In EUR millions ITE/IPE IPE/ITE Connect Systems (°) Consolidation Goodwill Consolidated
Turnover 21.3 30.9 16.1 47.0% of total n.a. 65.8% 34.2% 100.0%
Gross margin 12.4 9.6 2.8 12.4Gross margin % 30.4% 31.0% 17.4% 26.3%
Operating profit 1.3 2.1 1.5 -0.4 3.2Operating profit % 5.9% 6.9% 9.1% 6.8%
(°) consolidated from 1 July 1999 on
Comparing ITE/IPE to its main competitors, taking the Finnish groups JOT and PMJas a reference, one will witness that ITE/IPE has some way to go in terms of operatingprofitability:
ITE/IPE JOT (°) PMJ (°)Sales 100% 100% 100%EBIT % 6.9% 15.9% 9.1%
Source : Bloomberg, (°) 1998 figures
A few remarks however:
� IPTE has in the recent past been working on its expansion both in terms of sectorcoverage and on its international expansion. This had a negative influence on thegroup’s short term profitability.
� Without the Connect Systems group, the gross margin would have been slightly up(31% in stead of 30.4% at the end of 1998!). The operating margin would havebeen up from 5.9% to 6.9%! The R&D efforts made in the past to standardise theproduct portfolio are bearing their fruits. If mass production is to become the key

IPTE
22
element in the electronics business, it will be necessary in order to guaranteeprofitability, to base the integrated solutions offered to the clients as much aspossible on standardised modules. IPTE schedules that at this moment 80% of acompletely integrated line are adjusted but existing elements, while only 20% istailor-made work.
� JOT, with its main client Nokia, recently launched a profit warning stating that theEBIT margin this year would probably come down to 11% (in stead of 15%expected). The “11%” is above the margin which came out of our business modelwhich we describe see below.
(82.38)
(1,019.89)
(310.41)
(1,500)
(1,000)
(500)
-
500
1,000
1,500
2,000
2,500
3,000
3,500
1997 1998 1999
EBITFinancial resultNet profit (for the period)Current cash flow
Bottom line result “part of the group” is up (EUR 1.1m in stead of EUR 0.4m) asConnect Systems already added to the operating profit (EUR 736,244). The financialresult deteriorated however because of the debt financing of the Connect Systemsacquisition. The scheduled capital increase is to restore the situation.
In terms of profitability, no need to explain that Return on Equity (295%) was extremebut neglects the financial risks currently associated with the highly leveraged balancesheet structure (although debt coverage has never been a problem).
Balance sheet
Weak balance sheetstructure
The fast growth has taken its toll on the level of the balance sheet. Solvency has comedown remarkably by the end of 1999 (5.3%) because the expansion was systematicallyfinanced with debt (cf. the subordinated credit facility granted in 1999 by Parnib andArtesia).
The cash flow from financing activities was positive (“source of funds”) for EUR 15m(EUR 5.9m in 1998) while the cash flow from operating activities (inclusive workingcapital changes) absorbed EUR 0.5m. In these circumstances, the net debt positionunfortunately had to deteriorate (EUR 28.4m in stead of EUR 7.4m). The balancesheet structure is therefore weak:

IPTE
23
830.4
16,035.6
4,770.7
15,220.5
29,703.4
2,347.00
5,000
10,000
15,000
20,000
25,000
30,000
35,000
40,000
45,000
50,000
1997 1998 1999
Fixed Current
10,683.7
4,370.2
14,945.7
32,626.6
1,085.9658.9 2,428.71,535.9572.0
0
5,000
10,000
15,000
20,000
25,000
30,000
35,000
40,000
45,000
50,000
1997 1998 1999
ST debt
LT debt
Shareholders equity
Working capital needsto be managed moreefficiently …
What is remarkable (and in our view also weighing on IPTE’s profitability) is theamount of funds immobilised in working capital. The current assets (less cash & cashequivalents) made up 62.4% of the balance sheet total at the end of 1999. This ismainly financed with short term financial debt (EUR +10.2m). The operating workingcapital makes up 35% of the balance sheet total which is high in our view. All this isobviously related to the project driven character of IPTE’s business. Before a projectleads to an inflow of funds, IPTE has to make the costs necessary to get it started.Seemingly this is only partly offset by prepayments from the clients. We feel howeverthat a better project management and stricter follow up of the project costs shouldallow IPTE to do better here. The arrival of the new CFO in November 1999 and thestreamlining of the financial reporting should generate benefits in that respect.
Consolidation goodwill The consolidation goodwill, associated with the take-over of Connect Systemsamounts to EUR 7.9m and will be depreciated over a 10 years period which seemsreasonable.

IPTE
24
The business planProfit and loss projections
ITE/IPE to grow fasterthan Connect Systems …
The market for automated test equipment develops globally in line with the use ofintegrated circuits and printed circuit boards. As strong growth rates are projected forthe electronics industry, we have assumed solid rises in turnover for the years to comefor ITE/IPE (+/- +30.0% p.a. until 2003 gradually declining afterwards, CAGR of24.5% over the forecast period 2000-2008). The Connect business is a more maturebusiness with slower growth rates albeit that the integration within the IPTEorganisation could accelerate growth: For Connect Systems too, we have assumed thatthe growth rate steadily declines towards the end of the forecast period (+7.5% in 2008and CAGR of +13% over the forecast period). The following graphs sum up ourassumptions and do not take into account any future external growth:
405,932.3
366,264.5
321,397.2
275,324.5
231,805.2
191,869.6
156,172.9123,946.8
97,174.3
46,974.8
0
50,000
100,000
150,000
200,000
250,000
300,000
350,000
400,000
450,000
1999 2000 2001 2002 2003 2004 2005 2006 2007 2008
in E
ur m
illio
n
CAGR 2000-2008 : 19.6%
Turnover
Turnover ITE/IPE
Turnover Connect
-
50,000
100,000
150,000
200,000
250,000
300,000
2000 2001 2002 2003 2004 2005 2006 2007 20080.0%
10.0%
20.0%
30.0%
40.0%
50.0%
60.0%
70.0%
80.0%
ITE/IPE
Connect Systems
% share ITE/IPE
% share Connect Systems
ITE/IPE is expected to make up approximately 2/3ths of IPTE’s business by end of theforecast period (2000-2008). The CAGR for the sales figures over the forecast periodamounts to only 19.6%. We regard this reasonable for a growth oriented group whichsince 1992 has doubled its sales figures every year. The projections do not take intoaccount any external growth.
Operating margins toameliorate
The preceding years, IPTE has been investing in its international expansion and inR&D to develop new products and to standardise existing products. This has causedthe operating margins to be lower than what could be expected looking e.g. atcomparable companies. We have assumed that IPTE will in the future be able tosteadily improve its operating margins. This trend was already witnessed over 1999(see above). The improvement slows down further down the forecast period. Becauseprudence is in order, the ultimate margins which we project still compare favourablywith the margins e.g. of some of the competitors.
10.2%10.5%
10.7%10.8%10.8%10.7%10.8%10.6%10.7%10.5%
9.4%9.6%9.7%9.7%9.5%
9.1%
8.7%
8.0%
7.2%
6.8%
4.0%
5.0%
6.0%
7.0%
8.0%
9.0%
10.0%
11.0%
12.0%
1999 2000 2001 2002 2003 2004 2005 2006 2007 2008
EBITDA/Turnover
EBIT/Turnover
0.0
2,000.0
4,000.0
6,000.0
8,000.0
10,000.0
12,000.0
2000 2001 2002 2003 2004 2005 2006 2007 20080.0%
1.0%
2.0%
3.0%
4.0%
5.0%
6.0%
7.0%
8.0%
Capex
R&D
As % of Turnover

IPTE
25
Our calculations foresee a gradual improvement of the EBITDA margin up to 10.8% in2005. The EBIT margin however improves more rapidly and amounts to 9.7% in 2005.This needs some explanations because the non cash items seem to decline over time.Reason for that is that :• As a technology driven company IPTE foresees to invest little in “material fixed
assets” (EUR 2m per annum + adjustment for inflation). This is logic because thisyear, the group will move into its new building (EUR 2.5m investment) whichshould enable it to continue its expansion without any new major projects.
• Research and Development. Under IAS however the R&D costs are most oftencharged against P&L unless the nature of the costs (project related) make itpossible to activate them under IAS 38. We have assumed however that IPTE willcharge the costs against P&L over the entire forecast period. The level of R&Dcosts is set at 4% of the ITE/IPE turnover (comparable with what we found withthe competitors). As a consequence of that, the margin between EBITDA andEBIT narrows. It is not to be excluded however that in the future, insofar the R&Dare clearly project driven, IPTE activates R&D costs and depreciates them over anumber of years. This would influence the ratio EBITDA/EBIT albeit that theCapex should accordingly include the activated R&D costs.
Discounted cash flow valuation
Our DCF approach leads to the following free cash flow scheme:
-15,000
-10,000
-5,000
0
5,000
10,000
15,000
20,000
25,000
30,000
2000 2001 2002 2003 2004 2005 2006 2007 2008
After tax operational cash flow
Capital expenditures
Working capital
Free cash flow
The free cash flow is to stay negative for another year and is to break-even next yearmainly because of further investments in fixed assets (i.a. the new building ofEUR 2.5m this year) and extra working capital requirements. The calculations do nottake into account any capital gain on the building in Houthalen from where ITE/IPE isnow active which is to be sold as soon as the group has moved into the new building(June 2000) and did not take into account any deferred tax assets on the losses made inthe US and Germany.
On the other hand the assumptions may seem aggressive on the level of the workingcapital requirements.

IPTE
26
Operating working capital as % of balance sheet total
10.0%
15.0%
20.0%
25.0%
30.0%
35.0%
40.0%
1997 1998 1999 2000 2001 2002 2003 2004 2005 2006 2007 2008
We believe however that IPTE should be able to reduce the funds invested in workingcapital. Under the command of the new CFO, measures have already been taken tobetter follow up on projects, project costs and management of the working capital.
We have discounted the free cash flows using the following parameters:• Cost of equity : 10.8% - based on a risk free rate of 5.6%, a beta of 1.3 and a risk
premium of 4%;• Cost of debt : pre tax of 7.5%• Equity/Debt : 80%:20%• WACC of 9.6%• Perpetual growth : 2%
This generates a post money DCF value of EUR 132.1m taking into account a capitalincrease of Bef 1.06bn (EUR 26.3m). This yields a value per share of EUR 24.9(based on 5.3 mio shares taking into account that Parnib/Artesia will convert theirEUR 5.0m (Bef 200m) subordinated loan with a 20% discount).
Sensitivities
We have checked upon the sensitivity of this value for adjustments in the parameters :
Risk free rate The calculations show the following sensitivity to the risk free rate:
5.0% 5.2% 5.4% 5.6% 5.8% 6.0% 6.2%Value per share 27.9 26.8 25.8 24.9 24.0 23.1 22.3Upside/downside potential +12.0% +7.6% +3.6% +0% -3.6% -7.3% -10.4%
WACC The WACC has to following impact:
8.4% 8.8% 9.2% 9.6% 10.0% 10.4% 10.8%Value per share 32.9 29.9 27.1 24.9 22.6 20.6 18.8Upside potential +32.1% +20.1% +8.8% +0% -9.2% -17.3% -24.5%
Perpetual growth We have assumed a 2% perpetual growth which is quite low given the opportunities inthe business and given IPTE’s track record over the recent past.

IPTE
27
0.5% 1.0% 1.5% 2.0% 2.5% 3.0% 3.5%Value per share 20.5 21.8 23.3 24.9 26.8 28.9 31.5Upside potential -34.1% -30.0% -25% 0% -+7.6% +16.1% 26.5
Although it is difficult to comment on the particular parameters used, we feel that wehave been particularly prudent as far as perpetual growth is concerned (only 2%). Thisleaves us to believe that if IPTE can continue its growth story, or even accelerate it asexternal growth has not been taken up in the plan, an important upside in the value isvery much possible.
Dividend discount valuation
Although the company suggests that no dividends will be declared against thebackground of continued growth, we have assumed pro forma that the company was topay out a dividend taking into account a 25% pay out ratio. We used these assumptionto verify the DCF Model by an adjusted and pro forma DDM model.
We have assumed that an investor will be able to sell his shares at 15 times (low !) theprojected net earnings for 2008 (= at the end of the forecast period).
The DDM value generates a value of EUR 156.3m (or EUR 30.9 per share takinginto account 5.0m shares after the IPO).
Multiples valuation
We have selected three types of peer groups to compare their market values with theDCF valuation based and the business plan:• Technology firms listed on BXS and on Easdaq : Agfa, Artwork Systems, Barco,
EVS, Global Graphics, IBA, Icos, Iris, Punch, Systemat, Telinfo, Xeikon• Comparable companies
∗ ITE/IPE group : Asyst Technologies, ATS Automation Tooling Systems,Brooks Automation, Credence Systems, Cybernetix, Dialog Semiconductor,DT Industries, Gerber Scientific, Genrad, JOT, LKT Industrial Berhad,Orbotech, PMJ, PRI Automation, Tektronics, Teradyne
∗ Connect Systems group : Aspocomp, Cable Design Technologies,Critchley Group Esterline Technologies, Leoni, Maxim Integrated Circuits,Neways, Volex
• EMS companies : Benchmark, Flextronics, Jabil, Sanmina, SCI Systems,Solectron
The P/E and the P/CF multiples for the forthcoming years are the following:
P/E00 P/E01 P/E02 P/CF00 P/CF01 P/CF02Technology driven companies 26.5 20.3 14.8 15.7 13.2 12.0
Easdaq 27.5 19.7 11.1 15.9 11.7 11.0BXS 26.0 20.5 16.1 15.6 13.6 12.2
Comparables 33.7 20.8 20.7 22.0 15.9 14.0ITE/IPE 39.9 22.2 24.2 31.7 21.1 17.6
Connect 22.3 18.3 13.6 9.1 9.0 10.5EMS companies 42.8 31.7 35.2 n.a. n.a. n.a.
Applying these multiples to our business plan, we get to the following valuationrange : EUR 131.4-158.3m or EUR 24.7-31.5 per share.
Beware that in applying the cash flow multiples, we have assumed that IPTE wouldeach year activate and depreciate 50% of the R&D costs (4% of the ITE/IPE turnover).

IPTE
28
As already explained, this is a reasonable assumption as under the IAS accountancyrules, activation is possible insofar the costs are very much project related. Althoughthis does not change anything to the free cash flow (and the DCF value), the bottomline cash flow was negatively influenced by not activating the R&D costs (and lead toa unreasonable low value).
Summary
Value range ofEUR 24.9-30.9
Taking into account the different approaches, we come up with the following valueranges :• DCF : EUR 24.9• DDM (pro forma) : EUR 30.9• Peers (pro forma) : EUR 24.7-31.5 per share (EUR 28.1 on average)
Schematically:
20 22 24 26 28 30 32 34 36 38 …
DCF VALUE EUR 24.9
DDM VALUE EUR 30.9
Peer group EUR 28.1
A EUR 22 per share IPO price leads to the following multiples:
2000 2001 2002P/EP/CFEBITDA/EV
23.517.911.7
19.316.19.3
14.012.47.1
It is worth pointing at the PEG ratio to which our DCF valuation leads :
In the assumption of a EUR 24.9 IPO price, the PEG turns “1”only in 2005! If the IPOprice was only EUR 20, the PEG would hardly turn “1” over the forecast period.

IPTE
29
Opportunities and threats
Strengths and opportunities have in detail been discussed above. We would like topoint out at some of the risk elements related to investing in IPTE:� Technological leadership is a necessity : the market of test equipment is evolving
rapidly, trying to meet the requirements of the demanding end-users. Remainingup-to-date on the market’s intense competitive environment and gaining insightinto its market and technological trends are of utmost importance if IPTE wants tosucceed in the future. A company that cannot match or surpass its competitors interms of price, quality, value for money, performance and service is likely toloose considerable market share.
� Project driven business which can lead to a more volatile revenue stream� Depending on key personnel while the current job market currently witnesses a
shortage in technology oriented highly-skilled people;� EMS producers buy assets on the back of the outsourcing trend … these assets do
not necessarily make use of IPTE’s products. This continuing trend may causeIPTE to loose market share indirectly.
� The electronics industry is a very competitive one and the electronicsmanufacturers feel the constant urge to reduce their costs. This leads to acontinues reduction in unit prices (cf. PC and peripherals, GSM’s,…). This mayover time have an impact on IPTE’s profit margins insofar end-users get thefeeling that the cost of e.g. test and production equipment should come down too.
Opportunities
- to capitalise on the fast growth of theelectronics business
- possibility to expand further internationally- profit and cash flow potential
Threats
- less integrated than some of the competitors- competitive industry- fierce competition may lead to price reductions- technology and project driven business- need to deliver high quality
Strengths
- synergies between the 2 business units- not dependent on any major sector or client- world wide presence- not cyclical- high entry barriers
Weaknesses
- current profitability- dependence on key personnel- strong growth is to be kept manageable

IPTE
30
Financial projections
Income StatementEUR million 1997 1998 1999 2000 2001 2002 2003
Turnover 8,790.4 21,312.1 46,974.8 97,174.3 123,946.8 156,172.9 191,869.6% growth 142.4% 120.4% 106.9% 27.6% 26.0% 22.9%
EBITDA n.a. n.a. 4,914.3 10,377.7 13,140.1 16,797.2 20,559.3% of sales 10.5% 10.7% 10.6% 10.8% 10.7%
Depreciation -1,715.3 -3,396.3 -3,286.3 -3,221.9 -3,004.7% of sales -3.7% -3.5% -2.7% -2.1% -1.6%
EBIT 638.3 1,257.7 3,199.0 6,981.5 9,853.8 13,575.3 17,554.6% of sales 7.3% 5.9% 6.8% 7.2% 8.0% 8.7% 9.1%
Financial result -82.4 -310.4 -1,019.9 -621.9 -565.8 -531.8 -499.9% of sales -0.9% -1.5% -2.2% -0.6% -0.5% -0.3% -0.3%
Exceptional result 20.4 -179.1 -10.6 0.0 0.0 0.0 0.0Taxes -166.5 -345.8 -1,061.4 -2,717.9 -3,830.7 -5257.8 -6782.0Net profit (for the period) 409.8 422.5 1,107.2 3,641.7 5,457.3 7,785.7 10,272.7
% of sales 4.7% 2.0% 2.4% 3.7% 4.4% 5.0% 5.4%
Dividend 0.0 0.0 0.0 910.4 1,364.3 1,946.4 2,568.2% of net profits
Retained earnings 409.8 422.5 1,107.2 2,731.3 4,093.0 5839.3 7704.5% of sales 4.7% 2.0% 2.4% 2.8% 3.3% 3.7% 4.0%
Current net income before GW 389.4 593.6 1,513.4 4,433.7 6,249.3 8,577.7 11,064.7% of sales 4.4% 2.8% 3.2% 4.6% 5.0% 5.5% 5.8%
Current net income after GW 389.4 593.6 1,909.7 5,226.4 7,042.1 9,370.4 11,857.4% of sales 4.4% 2.8% 4.1% 5.4% 5.7% 6.0% 6.2%
Current net cash flow 371.9 309.0 1,967.2 6,041.1 7,755.0 10,023.5 12,483.9% of sales 4.2% 1.5% 4.2% 6.2% 6.3% 6.4% 6.5%
Average number of shares (‘000) 4,000.0 4,000.0 4,000.0 4,652.1 5,304.2 5,304.2 5,304.2EPS 0.10 0.15 0.38 0.95 1.18 1.62 2.09CFPS 0.09 0.08 0.49 1.30 1.46 1.89 2.35Dividend per share (gross) 0.00 0.00 0.00 0.20 0.26 0.37 0.48Dividend per share (net) 0.00 0.00 0.00 0.15 0.19 0.28 0.36
Balance sheetEUR million 1997 1998 1999 2000 2001 2002 2003
Fixed assets 830.4 2,347.0 16,035.6 17,405.7 16,160.7 15,101.8 14,191.1Current assets 4,770.7 15,220.5 29,703.4 58,813.8 75,404.0 94,787.3 117,483.4 of which cash & cash equivalents 1,048.5 863.9 1,152.7 3,223.5 1,498.1 4,924.5 6,260.2
Balance sheet total 5,601.0 17,567.5 45,739.0 76,219.6 91,564.7 109,889.1 131,674.5
Shareholders equity 658.9 1,066.8 2,246.4 34,724.9 38,817.9 44,657.2 52,361.7Minorities 0.0 19.1 182.3 183.1 183.8 184.6 185.3Provisions 12.4 682.0 1,352.3 1,352.3 1,352.3 1,352.3 1,352.3Long term debt 559.6 854.0 9,331.3 3,804.0 3,374.5 3,011.5 2,705.1Short term debt 4,370.2 14,945.7 32,626.6 36,155.2 47,836.2 60,683.5 75,070.0 Current portion of LT debt 110.9 215.6 1,146.8 569.4 429.6 362.9 306.5 Other financial debt 1,467.3 7,130.7 19,110.3 0.0 0.0 0.0 0.0 Other current liabilities 2,791.9 7,599.4 12,369.4 35,585.8 47,406.6 60,320.5 74,763.5

IPTE
31

Table of Contents
“… your partner for integrated test and production solutions …”........................... 1
IPTE : “a rapid start in 1992” ................................................................................... 2Company history................................................................................................... 2Business description ............................................................................................. 4Shareholders structure .......................................................................................... 8Management structure .......................................................................................... 8Marketing.............................................................................................................. 9R&D...................................................................................................................... 9Strategy............................................................................................................... 10
Sector analysis ........................................................................................................ 12The electronics industry ..................................................................................... 12The EMS sector .................................................................................................. 16The Connect Systems group ............................................................................... 18Competitors ........................................................................................................ 18
Historic financial figures ........................................................................................ 20Profit and loss statement..................................................................................... 20Balance sheet ...................................................................................................... 22
The business plan ................................................................................................... 24Profit and loss projections .................................................................................. 24Discounted cash flow valuation.......................................................................... 25Sensitivities......................................................................................................... 26Dividend discount valuation............................................................................... 27Multiples valuation............................................................................................. 27Summary............................................................................................................. 28
Opportunities and threats........................................................................................ 29
Financial projections .............................................................................................. 30