Ipsen 2015 Full Year Financial Results - Homepage - … pour nom de la société - 07/04/2011 / page...
34
Full Year Results Roadshow - London, March 9, 2016 Ipsen 2015 Full Year Financial Results
Transcript of Ipsen 2015 Full Year Financial Results - Homepage - … pour nom de la société - 07/04/2011 / page...
IPSEN pour nom de la société - 07/04/2011 / page 1
Full Year Results Roadshow - London, March 9, 2016
Ipsen 2015 Full Year Financial Results

2 Goldman Sachs 35th Annual Global Healthcare Conference – June 2014 Full Year Results Roadshow - London, March 9, 2016 2 2
Disclaimer This presentation includes only summary information and does not purport to be comprehensive. Forward-looking statements, targets and estimates contained herein are for illustrative purposes only and are based on management’s current views and assumptions. Such statements involve known and unknown risks and uncertainties that may cause actual results, performance or events to differ materially from those anticipated in the summary information. Actual results may depart significantly from these targets given the occurrence of certain risks and uncertainties, notably given that a new product can appear to be promising at a preparatory stage of development or after clinical trials but never be launched on the market or be launched on the market but fail to sell notably for regulatory or competitive reasons. The Group must deal with or may have to deal with competition from generic that may result in market share losses, which could affect its current level of growth in sales or profitability. The Company expressly disclaims any obligation or undertaking to update or revise any forward-looking statements, targets or estimates contained in this presentation to reflect any change in events, conditions, assumptions or circumstances on which any such statements are based unless so required by applicable law. All product names listed in this document are either licensed to the Ipsen Group or are registered trademarks of the Ipsen Group or its partners. The implementation of the strategy has to be submitted to the relevant staff representation authorities in each country concerned, in compliance with the specific procedures, terms and conditions set forth by each national legislation.
Safe Harbor The Group operates in certain geographical regions whose governmental finances, local currencies or inflation rates could be affected by the current crisis, which could in turn erode the local competitiveness of the Group’s products relative to competitors operating in local currency, and/or could be detrimental to the Group’s margins in those regions where the Group’s drugs are billed in local currencies. In a number of countries, the Group markets its drugs via distributors or agents: some of these partners’ financial strength could be impacted by the crisis, potentially subjecting the Group to difficulties in recovering its receivables. Furthermore, in certain countries whose financial equilibrium is threatened by the crisis and where the Group sells its drugs directly to hospitals, the Group could be forced to lengthen its payment terms or could experience difficulties in recovering its receivables in full. Finally, in those countries in which public or private health cover is provided, the impact of the financial crisis could cause medical insurance agencies to place added pressure on drug prices, increase financial contributions by patients or adopt a more selective approach to reimbursement criteria. All of the above risks could affect the Group’s future ability to achieve its financial targets, which were set assuming reasonable macroeconomic conditions based on the information available today.
3 Goldman Sachs 35th Annual Global Healthcare Conference – June 2014 Full Year Results Roadshow - London, March 9, 2016 3 3
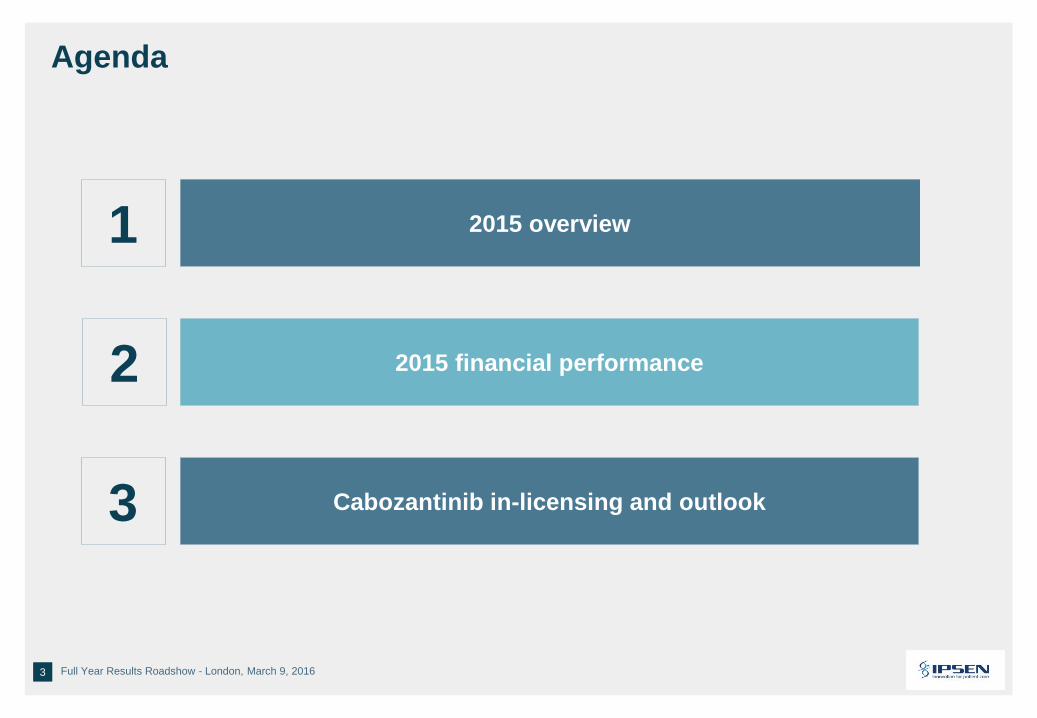
Agenda
1 2015 overview
3 Cabozantinib in-licensing and outlook
2 2015 financial performance

2015 overview

5 Goldman Sachs 35th Annual Global Healthcare Conference – June 2014 Full Year Results Roadshow - London, March 9, 2016 5 5
Ipsen, an international specialty pharma company
~77%
~23%
FY 2015 sales by segment
Primary care
FY 2015 sales by geography
38% 37%
11% 14%
Europe G5
Developed RoW
Emerging markets
US
Specialty care
Building a credible and profitable footprint in the US
1 France
2 China
4 Germany
3 US
5 Italy
Top 5 affiliates
Note: ROW: Rest of World
One of the largest emerging market presence in the industry

6 Goldman Sachs 35th Annual Global Healthcare Conference – June 2014 Full Year Results Roadshow - London, March 9, 2016 6 6
Implementation of a refocused strategy in specialty and primary care
Strong operational performance driven by US turnaround
Key execution milestones
1
2
New corporate governance model with search for new Chief Executive Officer 3

7 Goldman Sachs 35th Annual Global Healthcare Conference – June 2014 Full Year Results Roadshow - London, March 9, 2016 7 7
A refocused strategy to sustain high sales and profit growth
Note: GI:Gastrointestinal; OTx:Dual channel approach (Rx/OTC); NET: Neuroendocrine tumors
Lead
Reinforce
Explore
Specialty care
NET Spasticity Dysport®
aesthetics
Urology-oncology
Adult endocrinology
GI/orphan cancers
Niche strategy
Optimize
Diversify
Expand
Primary care
Smecta® Forlax® Tanakan®
Adjacent GI Probiotics
Geographies
Move to OTx commercial model

8 Goldman Sachs 35th Annual Global Healthcare Conference – June 2014 Full Year Results Roadshow - London, March 9, 2016 8 8
Specialty Care - Drug sales(2)
Core Operating margin ≥ 22.0%
Primary Care - Drug sales(2)
≥ 14.0%
[-3.0% ; 0.0%]
22.3%
+14.4%
-1.1%
2015 guidance(1)
2015 actuals
2015 sales and Core Operating Income strong performance in line with market guidance
(1) Revised on 31 July 2015 – (2) Year-on-year sales growth at constant currency

9 Goldman Sachs 35th Annual Global Healthcare Conference – June 2014 Full Year Results Roadshow - London, March 9, 2016 9 9
Turnaround of the US platform, with high potential for growth
(1) Restated for Increlex® supply interruption Note: All growth rates at constant currency; AUL: Adult Upper Limbs; NET: Neuroendocrine tumors;
US affiliate sales growth(1) Somatuline® US sales growth
2013 2014 2015
11.5%
31.2%
64.9%
2013 2014 2015
18.6% 28.6%
111.9%
Business update
Renewed management and Salesforce (NET & spasticity)
Successful Somatuline® NET launch and preparation of Dysport® AUL spasticity launch
Strong Dysport® aesthetics performance from Galderma
US operations profitable in 2015, ahead of plan

2015 financial performance

11 Goldman Sachs 35th Annual Global Healthcare Conference – June 2014 Full Year Results Roadshow - London, March 9, 2016 11 11
40
52
115
17
20
60
280
334
402
Forlax
Tanakan
Smecta
Hexvix
Increlex
Nutropin
Dysport
Decapeptyl
Somatuline®
®
®
®
®
®
®
+1.4%
(10.2%)
+34.2%
+9.7%
(11.2%)
®
+42.2%
+6.6%
Excellent 2015 sales growth with strong Q4
Drug sales – FY 2015 in million euros – % excluding foreign exchange impact
French Primary care: (7.7%)
International Primary care: +1.2% 1.4%
Group sales €1,443.9m
+10.4%
Primary care €329.7m(1)
(1.1%)
(1) Includes €24.3m of Drug-related sales
Spec
ialty
car
e Pr
imar
y ca
re
® Specialty care €1,114.2m
+14.4%
+1.3%
Positive Primary care international growth despite headwinds in China/Russia
Somatuline® NET and Dysport ® aesthetics driving specialty care growth

12 Goldman Sachs 35th Annual Global Healthcare Conference – June 2014 Full Year Results Roadshow - London, March 9, 2016 12 12
FY sales in million euros
1,275
1,444
102
25 4 9 (7) 3 33
FX
Primary care
FY 2015 FY 2014
Decapeptyl®
Other Primary
care
Group sales growth: +10.4% (€136m) at constant currency
French PC
Specialty care
93% of FY15 sales growth(1) stemming from Somatuline® and Dysport®
Dysport®
Somatuline®
Other Specialty
care
€33m positive FX impact on 2015 sales
(1) Excluding FX

13 Goldman Sachs 35th Annual Global Healthcare Conference – June 2014 Full Year Results Roadshow - London, March 9, 2016 13 13
Strong Somatuline® 2015 performance, driven by successful NET launch
247 288
402
2013 2014 2015
+16.8%
Business update
3-year growth 2015 performance
Geographic distribution (2015)
Overall acceleration of growth due to NET global launch
Strong growth in North America, up 112% with positive price impact
Double digit growth in Europe, notably in Germany, the UK, Poland and France
42% 28% 18% 12%
G5(1)
Emerging markets(2) United States
Developed RoW
(1) France, Germany, UK, Italy, Spain – (2) Notably includes China, Russia and Brazil Note: all variations at constant exchange rate; NET: Neuroendocrine tumors;
+34.2%
US: Ipsen present in >1 000 accounts, including all 25 major reference centers
Europe: GEP NET approval granted by all European countries
Increased penetration across geographies

14 Goldman Sachs 35th Annual Global Healthcare Conference – June 2014 Full Year Results Roadshow - London, March 9, 2016 14 14
Somatuline® accelerated NET penetration in the US and Europe
Source: IMS MIDAS + Symphony Healthcare. (1) G5: France, Germany, UK, Spain, Italy; (2) Market share in volume Note: Market definition = long-acting SSAs; NET: Neuroendocrine tumors;
Somatuline® US quarterly data, all indications
0
2
4
6
8
10
12
14
0
10
20
30
40
Q4 2013 Q2 2014 Q4 2014 Q2 2015 Q4 2015
Somatuline® Europe G5(1) quarterly data, all indications
20
25
30
35
40
45
0
10
20
30
40
Q4 2013 Q2 2014 Q4 2014 Q2 2015 Q4 2015
Ipsen reported sales ($m) Market share(2) (%) Ipsen reported sales (€m) Market share(2) (%)
Somatuline® capturing majority of new patients in US and Europe
Increased number of switched patients
12.8% 44.2%

15 Goldman Sachs 35th Annual Global Healthcare Conference – June 2014 Full Year Results Roadshow - London, March 9, 2016 15 15
Dysport® 2015 performance driven by aesthetics
242 255
280
2013 2014 2015
+8.6%
Business update
3-year growth 2015 performance
Geographic distribution (2015)
Strong Galderma performance in aesthetics in a solid underlying market growth
Solid performance in emerging markets, notably in Russia, Brazil and Australia
Strong US Q4 driven by aesthetics & spasticity launch
G5(2)
Developed RoW United States
Emerging markets(3)
18% 12% 25% 45%
+9.7%
(1) China, India, South Korea (and Indonesia under certain conditions) – (2) France, Germany, UK, Italy, Spain – (3) Notably includes China, Russia and Brazil
Note : all variations at constant exchange rate; AUL: Adult Upper Limbs
Q3 US launch of Dysport® in AUL spasticity and sales force build-up
Setup of European business unit for therapeutics
Galderma partnership expanded to key Asia Pacific territories(1)

16 Goldman Sachs 35th Annual Global Healthcare Conference – June 2014 Full Year Results Roadshow - London, March 9, 2016 16 16
Dysport® US market share in aesthetics increasing since Galderma takeover
Botox® market
share (%)
Source: GuidePoint - Filler & Toxin Panel
Dysport® US market share in excess of 20% thanks to Galderma’s commercial push
30%
40%
50%
60%
70%
80%
90%
0%
5%
10%
15%
20%
25%
30%
35%
Feb 10 Jun 10 Oct 10 Feb 11 Jun 11 Oct 11 Feb 12 Jun 12 Oct 12 Feb 13 Jun 13 Oct 13 Feb 14 Jun 14 Oct 14 Feb-15 Jun-15 Oct-15
~73%
~22%
~5%
Botox®
Dysport ®
Xeomin®
Dysport® / Xeomin® market share (%)
17 Goldman Sachs 35th Annual Global Healthcare Conference – June 2014 Full Year Results Roadshow - London, March 9, 2016 17 17
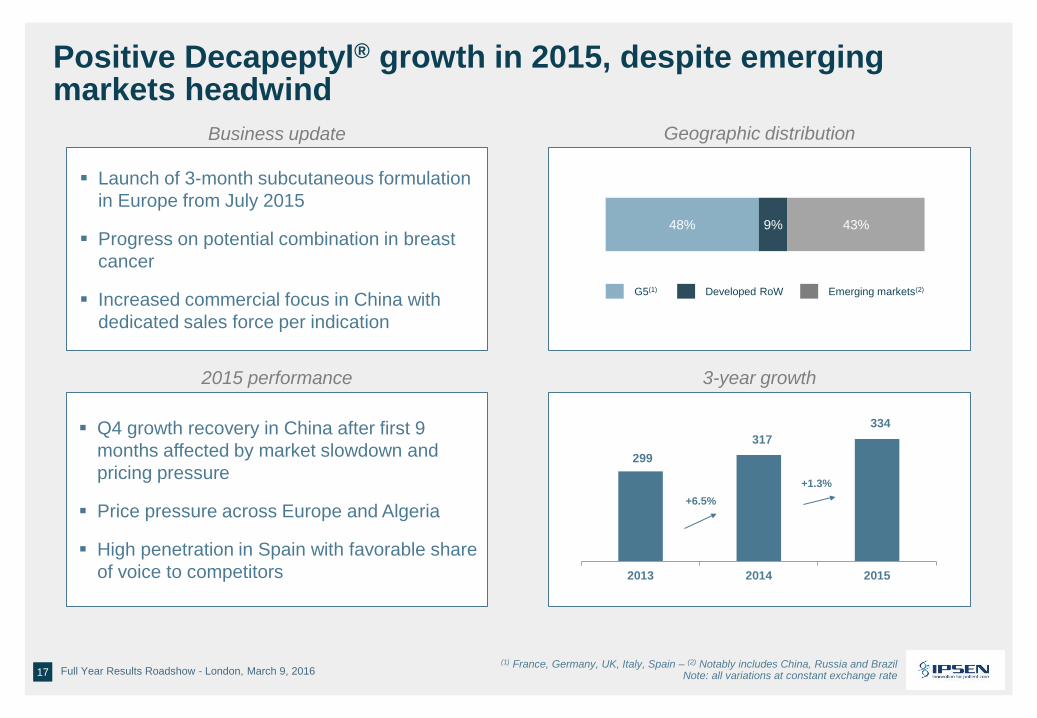
Positive Decapeptyl® growth in 2015, despite emerging markets headwind
299 317
334
2013 2014 2015
+6.5%
3-year growth
Business update
2015 performance
Geographic distribution
Q4 growth recovery in China after first 9 months affected by market slowdown and pricing pressure
Price pressure across Europe and Algeria
High penetration in Spain with favorable share of voice to competitors
G5(1) Developed RoW Emerging markets(2)
48% 9% 43%
+1.3%
(1) France, Germany, UK, Italy, Spain – (2) Notably includes China, Russia and Brazil Note: all variations at constant exchange rate
Launch of 3-month subcutaneous formulation in Europe from July 2015
Progress on potential combination in breast cancer
Increased commercial focus in China with dedicated sales force per indication

18 Goldman Sachs 35th Annual Global Healthcare Conference – June 2014 Full Year Results Roadshow - London, March 9, 2016 18 18
Primary care resilient thanks to international market growth
354 328 330
2013 2014 2015
(4,8)%
Business update
3-year growth 2015 performance
Geographic distribution
Smecta® sales impacted by new manufacturing setup in Algeria and destocking in distribution and price pressure in China
Tanakan® facing out of pocket market slowdown and tough competition in Russia and France
Solid performance of Etiasa® in China and Fortrans® notably in Russia
30% 5% 65%
(1) France, Germany, UK, Italy, Spain – (2) Notably includes China, Russia and Brazi Note: all variations at constant exchange rate; OTx:Dual channel approach (Rx/OTC)
G5(1) Developed RoW Emerging markets(2)
(1.1)%
Start of Tanakan® local production in Russia
Launch of Smecta® ready-to-use (liquid) and Strawberry taste in Q4 2015 in France
Accelerated switch of China primary care model to OTx with recruitment of 100 additional reps in 2016

19 Goldman Sachs 35th Annual Global Healthcare Conference – June 2014 Full Year Results Roadshow - London, March 9, 2016 19 19
in m€ FY 2015 FY 2014 Change % Change
Change at constant FX
Net sales 1,443.9 1,274.8 +169.1 +13.3% +10.4%
Other revenues 76.3 57.6 +18.7 +32.5%
Revenue 1,520.2 1,332.4 +187.8 +14.1%
Cost of goods sold (336.8) (310.0) -26.8 +8.7%
R&D expenses (192.6) (186.9) -5.7 +3.0%
Selling expenses (541.4) (464.1) -77.3 +16.7%
G&A expenses (122.9) (111.2) -11.7 +10.4%
Other core (4.1) 0.3 -4.4 NA
Core Operating income 322.5 260.6 +61.9 +23.8%
Core Operating margin 22.3% 20.4% +1.9 pt
P&L - From sales to Core Operating Income
Operating leverage driving margin expansion

20 Goldman Sachs 35th Annual Global Healthcare Conference – June 2014 Full Year Results Roadshow - London, March 9, 2016 20 20
50%
17%
10%
5%
18%
Ipsen exposure to foreign currencies
EUR
USD
GBP
CNY
Other(1)
(1) Includes RUB, BRL, AUD, PLN and other currencies
Evolution of major currencies vs. EUR 2015 sales exposure by currency
2015 sales growth benefited from strong USD, CNY and GBP appreciation versus euro
2016 sales to be impacted by depreciation of emerging countries currencies (BRL, CNY, RUB)
€1,443.9 million
…
Foreign Currency policy
Average rates change (2015vs. 2014)
19.9% 17.6% 11.1%
-25.3%
-15.4%
USD CNY GBP RUB BRL
Global FX exposure mitigated by cost base in local currency and hedging of key currencies

21 Goldman Sachs 35th Annual Global Healthcare Conference – June 2014 Full Year Results Roadshow - London, March 9, 2016 21 21
FY 2014 FY 2015
COGS (€m)
24.4% 23.6%
R&D (€m)
Selling expenses (€m)
FY 2014 FY 2015
+16.7%
G&A (€m)
+8.7%
541.4
464.1
336.8
+3.0%
192.6 186.9
+10.4%
8.7% 8.5%
122.9
111.2
Drivers for operating cost evolution
Note: All ratios in percentage of sales; NET: Neuroendocrine tumors
36.4% 37.5%
Positive mix effect, manufacturing efficiencies Impact of TasQ studies discontinuation
Support functions, variable compensation Impact of US investment (NET, spasticity)
FY 2014 FY 2015
24.3% 23.3%
310.0
FY 2014 FY 2015
14.7% 13.3%

22 Goldman Sachs 35th Annual Global Healthcare Conference – June 2014 Full Year Results Roadshow - London, March 9, 2016 22 22
in m€ FY 2015 FY 2014 Change % Change
Net sales 1,443.9 1,274.8 +169.1 +13.3%
Core Operating income 322.5 260.6 +61.9 +23.8%
Core Operating income margin 22.3% 20.4% +1.9 pt
Other non core (7.2) (9.2) +2.0
Restructuring costs (6.7) (21.9) +15.2
Impairment gain / (losses) (64.6) (8.0) -56.6
Operating income 244.0 221.4 +22.6 +10.2%
Financial result (6.4) (15.1) +8.7
Income taxes (49.8) (53.8) +4.0
Share of profit from JV 2.5 1.9 +0.6
Discontinued operations 0.5 (0.5) +1.0
Consolidated net profit 190.7 154.0 +36.7 +23.8% Consolidated profit margin 13.2% 12.1% +1.1 pt
EPS – fully diluted (€) 2.30 1.87 +0.43 +23.0%
Core EPS – fully diluted (€) 2.78 2.22 +0.56 25.2%
P&L - From Core Operating Income to EPS
Consolidated net profit up 24% after TASQ impairment charge and exceptionally low tax rate

23 Goldman Sachs 35th Annual Global Healthcare Conference – June 2014 Full Year Results Roadshow - London, March 9, 2016 23 23
180 214
+290
-61
-58
-15 -70
-29 -39
+16
In million euros
Operating cash
flow(1)
31 Dec 2015 31 Dec 2014
Change in working capital(1)
Solid cash generation to finance capex, BD and return to shareholders through dividend & share buy-back
Dividends
BD & milestones Closing
cash
Capex
Opening cash
Other
Closing cash up €34m vs 2014
Strong cash generation to self-finance acquisitions
Free cash flow: €156m
(1) Excluding milestone amortization
Restructuring
Share Buyback

24 Goldman Sachs 35th Annual Global Healthcare Conference – June 2014 Full Year Results Roadshow - London, March 9, 2016 24 24
Proposal to maintain a dividend of €0.85 per share to support BD investment
Group sales up 10.4% at constant currency
Strong Core Operating Income margin of 22.3%(1)
Consolidated net profit of €190.7m, up 23.8% year-on-year
Fully diluted core EPS of €2.78, up 25.2% year-on-year
Closing cash balance of €214m, up 19%
Key financial takeaways
(1) In percentage of sales

Cabozantinib in-licensing and outlook

26 Goldman Sachs 35th Annual Global Healthcare Conference – June 2014 Full Year Results Roadshow - London, March 9, 2016 26 26
Exclusive license agreement with Exelixis for Cabozantinib, with key indication in Renal Cell Carcinoma (RCC)
Potential development in further indications
Medullary Thyroid
Cancer
Exclusive global licensing and commercialization rights (ex North America & Japan)
Renal Cell Carcinoma
Filed in 2nd line
Hepatocellular Carcinoma
Ph3 in 2nd line
Key indications
Marketed
110 000 patients 60 000 patients 1500 patients European incidence

27 Goldman Sachs 35th Annual Global Healthcare Conference – June 2014 Full Year Results Roadshow - London, March 9, 2016 27 27
Cabozantinib, a best in class showing positive PFS and OS data
Standard of care: TKI(1)s
RCC
2nd line treatments
(1)Tyrosine Kinase Inhibitors OS: Overall survival, PFS: Progression Free Survival, ORR: Objective Response Rate
Approved therapies
1st line treatments
TKI(1)s and mTOR inhibitors
Potential entrants
Cabozantinib Immunomodulators
RCC 2nd line treatment paradigm shift from PFS to OS
PFS OS ORR PFS OS ORR
PFS OS ORR

28 Goldman Sachs 35th Annual Global Healthcare Conference – June 2014 Full Year Results Roadshow - London, March 9, 2016 28 28
Accelerate specialty care growth in the next 5 years with a 4th pillar added to Ipsen Specialty portfolio
Acquire a potential best in class derisked asset in attractive niche RCC with solid scientific data triggering treatment paradigm shift
RCC: Renal Cell Carcinoma
Completion of a global oncology therapeutic footprint (US and Europe)
Reinforce Ipsen portfolio in niche oncology with potential for further development in other indications
Strong rationale for Cabozantinib in-licensing

29 Goldman Sachs 35th Annual Global Healthcare Conference – June 2014 Full Year Results Roadshow - London, March 9, 2016 29 29 MTC: Medullary Thyroid Cancer, RCC: Renal Cell Carcinoma
Cabozantinib, deal terms and impact on Ipsen operations
Operations
Upfront: $200m
Regulatory: up to $110m ($60m for RCC and $50m for HCC indications)
Commercial: up to $545m
Milestones
Royalties Tiered up to 26% on net sales
Transfer of MTC Market Authorization in H2 2016 and RCC launch starting
in 2017
Significant commercial investment
Cost containment and project prioritization initiatives to minimize impact of
2016 - 2018 investment period

30 Goldman Sachs 35th Annual Global Healthcare Conference – June 2014 Full Year Results Roadshow - London, March 9, 2016 30 30
Specialty care sales
Core Operating margin Around 21% of sales
Growth > 10.0%, year-on-year
Primary care sales Slight growth, year-on-year
2016 financial objectives
Including a negative impact of: • ~150 basis points resulting from the investment required to
prepare the commercial launch of Cabozantinib for the treatment of Renal Cell Carcinoma in Europe
• ~100 basis points from foreign exchange rates
At constant currency
At constant currency

31 Goldman Sachs 35th Annual Global Healthcare Conference – June 2014 Full Year Results Roadshow - London, March 9, 2016 31 31
Update of 2020 financial outlook
2015 2020E
Group sales Core Operating margin
> 7%
22.3%
> 26%
2015 2020E
>+370bps
€1.4bn
> €2.0bn
Specialty care
Specialty care
Primary care
>8%
[2% to 4%]
CAGR
Primary care
2020 Sales target increased to reflect Cabozantinib sales contribution
2020 Profitability target confirmed

32 Goldman Sachs 35th Annual Global Healthcare Conference – June 2014 Full Year Results Roadshow - London, March 9, 2016 32 32
2016 roadmap
Note: OTx:Dual channel approach (Rx/OTC); NET: Neuroendocrine tumors
Position Somatuline® as a leader in NET and secure Dysport® spasticity launch
Prepare the commercial launch of Cabozantinib for the treatment of Renal Cell Carcinoma in Europe
Implement new Primary Care OTx model, notably in China
Ipsen to deliver top tier growth and superior value creation to shareholders
Continue Business development to replenish pipeline and complement marketed product portfolio

Appendix

34 Goldman Sachs 35th Annual Global Healthcare Conference – June 2014 Full Year Results Roadshow - London, March 9, 2016 34 34
R&D
Regulatory/ Commercial
H1 2016 H2 2016 2017
Major R&D and regulatory milestones to come
Note: ALL: Adult Lower Limb; GEP NETs: Gastroenteropancreatic neuroendocrine tumors; PLL: Pediatric Lower Limb; PUL: Pediatric Upper Limb, RCC : Renal Cell Carcinoma), HCC : Hepatocellular carcinoma
Syntaxin compound PhI initiation
OPS201 – Lu Satoreotide PhI initiation
Dysport® PLL US launch
Telotristat etiprate
EU filing
Dysport® PUL PhIII results
Dysport® ALL US filing
OPS202 – Ga Satoreotide PhIII initiation
Dysport® Solution PhIII results in Glabellar lines
Dysport® PLL US filing
Cabozantinib RCC EU approval
Cabozantinib HCC phIII results
Telotristat etiprate
EU launch
Cabozantinib RCC launch