IPO Review Q1 2017 - PwC · Source: S&P Capital IQ with analysis by PwC Figure 6: Regional analysis...
50
Global Technology IPO Review Q1 201 7
Transcript of IPO Review Q1 2017 - PwC · Source: S&P Capital IQ with analysis by PwC Figure 6: Regional analysis...

Global Technology IPO Review Q1 2017

Global Technology IPO Review Q1 2017 1
Led by two Unicorns, global tech IPO market starts on an optimistic note in Q1 2017
Raman Chitkara Partner and Global Technology Industry Leader PricewaterhouseCoopers LLP [email protected]
After a challenging 2016 for technology initial public offerings (IPOs), 2017 is off to a good start in the first quarter and that bodes well for the rest of the year. Welcome to the Q1 2017 issue of PwC’s Global Technology IPO Review. With 18 technology companies listing in the first quarter of 2017, total proceeds reached US$5.8 billion, the highest in the last five consecutive quarters. The environment for technology IPOs was positive with two Unicorns—Snap Inc and MuleSoft Inc—listing in Q1 and many more tech Unicorns on the sidelines waiting to enter the market during the year. Snap, with US$3.9 billion proceeds, was the biggest IPO since the US$21.8 billion listing of Alibaba in Q3 2014.
Geographically, China showed resurgence, following a slow last quarter of 2016, with 12 tech IPOs raising US$1.2 billion in Q1 2017. A stronger political and economic environment led China’s stock market regulators to facilitate more homegrown tech companies listing on the Chinese exchanges. Apart from China, the technology IPO activity was limited to four IPOs from the US and two IPOs from Japan. The UK and Europe shied away from the technology IPO market due to uncertainty over Brexit and ongoing elections in Germany, France, the Netherlands and Norway. However, Europe is building up a healthy pipeline of technology IPOs and is expected to emerge stronger following the elections.
The Internet Software & Services subsector led the technology IPO market in Q1. Semiconductors and Communications Equipment also witnessed strong growth owing to significant participation from Chinese companies.
Overall, the outlook for the world economy is improving in 2017 after several years of lukewarm performance. There are signs of strong activity in some pockets of both mature and emerging markets. The technology IPO market will likely cash in on this positive sentiment through the remainder of 2017. However, plausible headwinds like political uncertainty in election-bound Europe, perceived protectionism from the US and the rise of US Federal Reserve interest rates may slow the first quarter’s positive pace.
Sincerely,
*Issue size greater than US$40 million (includes overallotment) and based on trade date; See Methodology

Table of contents
1. Q1 2017 global tech IPO summary 3 A resurgence of tech IPOs after a soft 2016 ................................................................................................................................... 3 Q1 average proceeds for tech IPOs were higher than in 2014 and 2015 ..................................................................................... 4 Snap among the top five tech IPOs in the last seven years .......................................................................................................... 5 Tech IPOs in Q1 2017 were restricted to the US and APAC ......................................................................................................... 6 Macro-economic and geo-political concerns weigh heavily on Europe and the UK ...................................................................7 Absence of cross-border IPOs reflected favorable market in China ............................................................................................ 8 Global tech IPOs rode high on Internet Software & Services subsector ..................................................................................... 9
China ....................................................................................................................................................................................... 10 United States ........................................................................................................................................................................... 11 All other geographies ............................................................................................................................................................... 12 Europe ...................................................................................................................................................................................... 13
2. Stock exchange distribution 14 Tech IPOs were concentrated in five stock exchanges ................................................................................................................. 14
3. Subsector distribution – Q1 2017 15 4. Distribution of VC and non-VC backed IPOs 16
Q1 2017 tech IPOs – Offering details ............................................................................................................................................ 17 5. Key financials – Q1 2017 19 6. Q1 2017 Technology IPO listings – Valuation metrics 24 7. Top three subsectors in Q1 2017 26
Internet Software & Services ...................................................................................................................................................... 26 Communications Equipment ................................................................................................................................................. 33 Semiconductors ...................................................................................................................................................................... 40
8. Methodology 47 9. For more information 48

Global Technology IPO Review Q1 2017 3
Q1 2017 global tech IPO summary A resurgence of tech IPOs after a soft 2016 Following a disappointing 2016, Q1 2017 saw a flurry of activity in technology IPOs. Both deal volume and deal value increased significantly during the first three months of 2017 as 18 technology IPOs raised a total of US$5.8 billion. This was a phenomenal 234% sequential growth and 655% year-on-year growth in total proceeds, along with an 80% increase in the number of listings, sequentially and year on year.
In the US, growing investor confidence after the elections and the lack of late-stage private funding helped the IPO market bounce back. It registered a total of US$4.5 billion proceeds aided greatly by two Unicorn IPOs, Snap and MuleSoft.
Chinese technology companies performed well as China registered 12 technology IPOs with total proceeds of US$1.2 billion.
Figure 1: Global tech IPOs Q1 2016- Q1 2017
Source: S&P Capital IQ with analysis by PwC
$769$1,480
$5,382
$1,742
$5,813
10
14
20
10
18
-
5
10
15
20
25
Q1 2016 Q2 2016 Q3 2016 Q4 2016 Q1 2017 $-
$1,000
$2,000
$3,000
$4,000
$5,000
$6,000
$7,000
No.
of I
POs
US$
mill
ions
Total proceeds (US$mn) Total number of IPOs
"Overall, the outlook for the world economy is improving in 2017 … the technology IPO market will likely cash in on this positive sentiment through the remainder of 2017.” Raman Chitkara Global Technology Industry Leader
Global Technology IPO Review Q1 2017 4
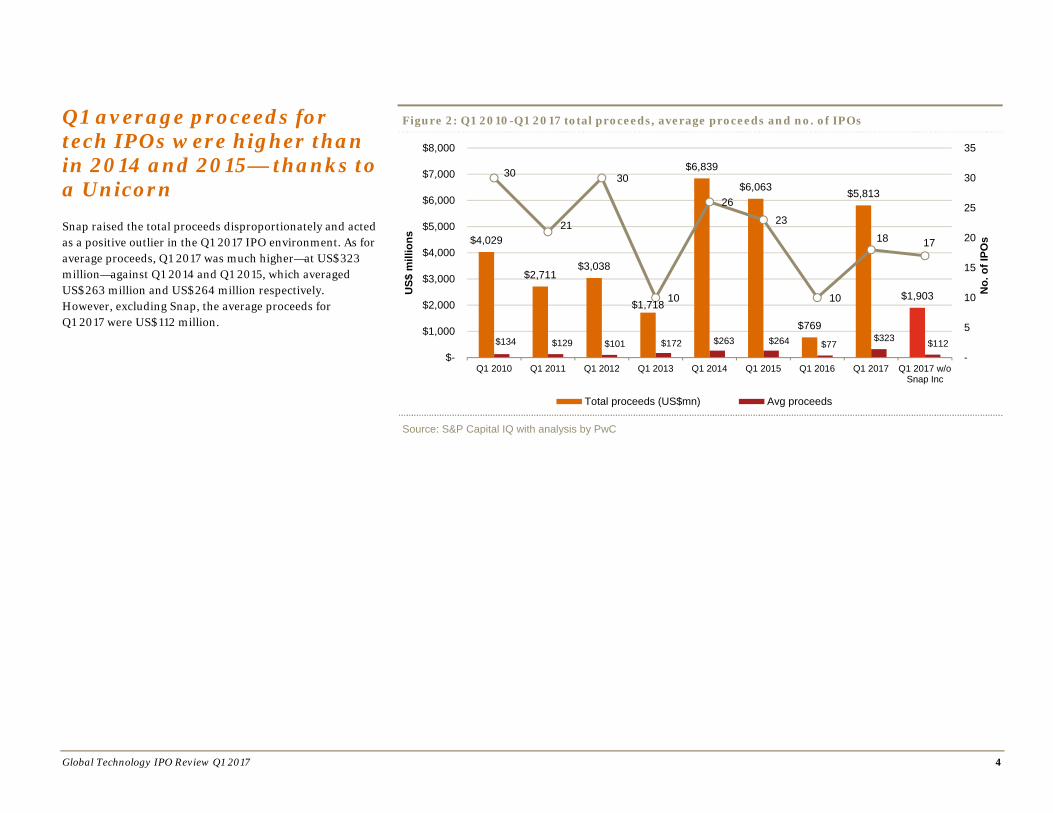
Q1 average proceeds for tech IPOs were higher than in 2014 and 2015— thanks to a Unicorn Snap raised the total proceeds disproportionately and acted as a positive outlier in the Q1 2017 IPO environment. As for average proceeds, Q1 2017 was much higher—at US$323 million—against Q1 2014 and Q1 2015, which averaged US$263 million and US$264 million respectively. However, excluding Snap, the average proceeds for Q1 2017 were US$112 million.
Figure 2: Q1 2010-Q1 2017 total proceeds, average proceeds and no. of IPOs
Source: S&P Capital IQ with analysis by PwC
$4,029
$2,711$3,038
$1,718
$6,839
$6,063
$769
$5,813
$1,903
$134 $129 $101 $172 $263 $264 $77$323 $112
30
21
30
10
26
23
10
18 17
-
5
10
15
20
25
30
35
Q1 2010 Q1 2011 Q1 2012 Q1 2013 Q1 2014 Q1 2015 Q1 2016 Q1 2017 Q1 2017 w/oSnap Inc
$-
$1,000
$2,000
$3,000
$4,000
$5,000
$6,000
$7,000
$8,000
Total proceeds (US$mn) Avg proceedsU
S$m
illio
ns
No.
of I
POs

Global Technology IPO Review Q1 2017 5
Snap among the top five tech IPOs in the last seven years Snap was the third-largest IPO in the last seven years (2010 through Q1 2017). Four of the top five IPOs were from the Internet Software & Services subsector. Snap is the largest listing since Alibaba in Q3 2014 and also the largest technology IPO in the five consecutive Q1 periods, 2013-2017. Internet Software & Services takes the lion’s share as most billion-dollar IPOs come from this subsector. Speed of reach and easier expansion support the lofty valuations that these companies command.
Figure 3: Top 5 IPOs by proceeds – 2010-2017
Source: S&P Capital IQ with analysis by PwC
$21,767
$16,007
$3,910 $3,842 $3,084
Internet Software &Services
Internet Software &Services
Internet Software &Services
Internet Software &Services
Computer Storage &Periperals
Alibaba GroupHolding Ltd
Facebook, Inc Snap Inc Worldpay Group plc Japan Display, Inc
18/09/2014 17/05/2012 01/03/2017 15/10/2015 19/03/2014
0
5,000
10,000
15,000
20,000
25,000
US$
mill
ions
Global Technology IPO Review Q1 2017 6
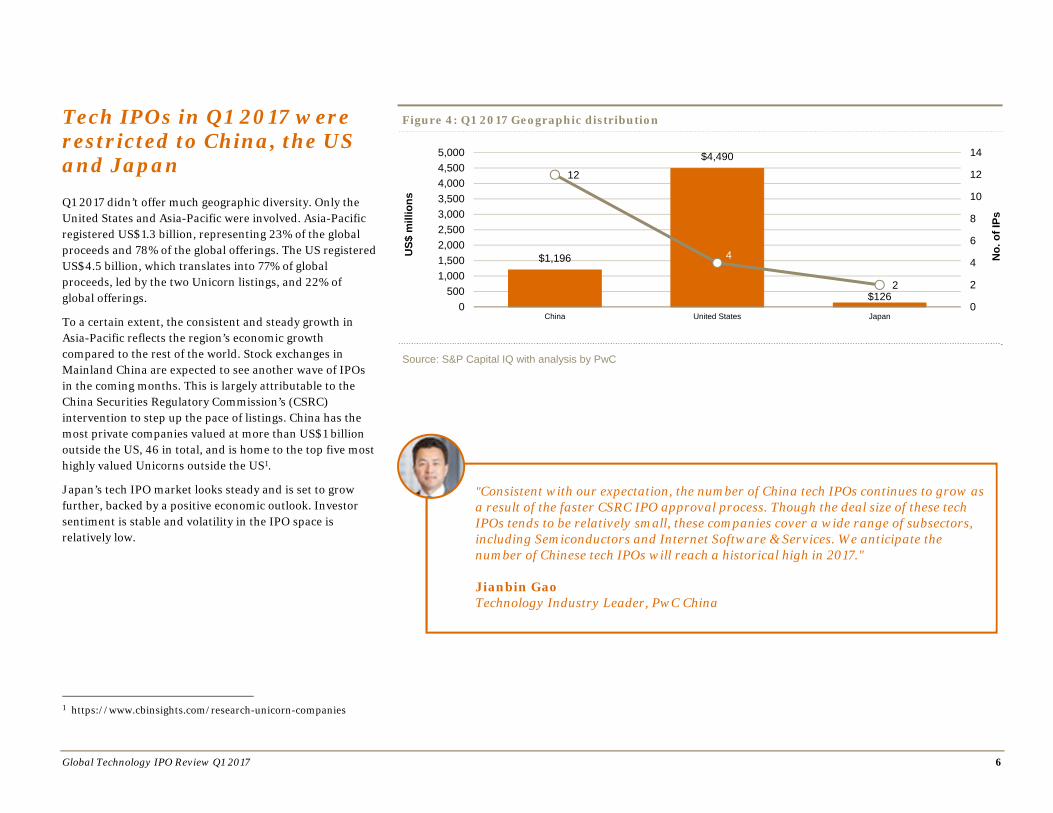
Tech IPOs in Q1 2017 were restricted to China, the US and Japan Q1 2017 didn’t offer much geographic diversity. Only the United States and Asia-Pacific were involved. Asia-Pacific registered US$1.3 billion, representing 23% of the global proceeds and 78% of the global offerings. The US registered US$4.5 billion, which translates into 77% of global proceeds, led by the two Unicorn listings, and 22% of global offerings.
To a certain extent, the consistent and steady growth in Asia-Pacific reflects the region’s economic growth compared to the rest of the world. Stock exchanges in Mainland China are expected to see another wave of IPOs in the coming months. This is largely attributable to the China Securities Regulatory Commission’s (CSRC) intervention to step up the pace of listings. China has the most private companies valued at more than US$1 billion outside the US, 46 in total, and is home to the top five most highly valued Unicorns outside the US1.
Japan’s tech IPO market looks steady and is set to grow further, backed by a positive economic outlook. Investor sentiment is stable and volatility in the IPO space is relatively low.
1 https://www.cbinsights.com/research-unicorn-companies
Figure 4: Q1 2017 Geographic distribution
Source: S&P Capital IQ with analysis by PwC
$1,196
$4,490
$126
12
4
2
0
2
4
6
8
10
12
14
China United States Japan0
5001,0001,5002,0002,5003,0003,5004,0004,5005,000
US$
mill
ions
No.
of I
Ps
"Consistent with our expectation, the number of China tech IPOs continues to grow as a result of the faster CSRC IPO approval process. Though the deal size of these tech IPOs tends to be relatively small, these companies cover a wide range of subsectors, including Semiconductors and Internet Software & Services. We anticipate the number of Chinese tech IPOs will reach a historical high in 2017." Jianbin Gao Technology Industry Leader, PwC China

Global Technology IPO Review Q1 2017 7
Macro-economic and geo-political concerns weigh heavily on Europe and the UK Europe is still grappling with the aftermath of Brexit and the impending general elections in Germany, the Netherlands, Norway and France. These took the focus off technology IPOs in Europe in Q1.
With increasing numbers of private placements in Europe and uncertainty and volatility around listing, some companies are keeping their options open with a dual strategy.
Following Snap’s successful IPO in Q1 2017, several US companies have been keen on going public. From past experience, we know that an upswing on the American market normally extends to the European market with about a six-month delay.
Figure 5: Regional analysis of IPO proceeds
Source: S&P Capital IQ with analysis by PwC
Figure 6: Regional analysis of number of IPOs
Source: S&P Capital IQ with analysis by PwC
$0$258
$511
$0
$694 $250 $536 $627
$2,835
$1,921
$479 $331
$932
$4,490
0
$1,322
$- $500
$1,000 $1,500 $2,000 $2,500 $3,000 $3,500 $4,000 $4,500 $5,000
North America Europe Asia RoW
Q1 2016 Q2 2016 Q3 2016 Q4 2016 Q1 2017
US$
mill
ions
0
3
7
0
5
2
7 6
3
11
5
2 3
4
14
0
2
4
6
8
10
12
14
16
North America Europe Asia RoW
Q1 2016 Q2 2016 Q3 2016 Q4 2016 Q1 2017
No.
of I
POs

Global Technology IPO Review Q1 2017 8
Absence of cross-border IPOs reflected favorable market in China Q1 2017 saw no cross-border IPOs. Chinese tech companies are usually the drivers of cross-border listings, but in this quarter all 12 Chinese IPOs were launched on their domestic exchanges owing to favorable valuations on the Chinese exchanges and a focus by these particular companies to avoid additional costs incurred with US listing.
Three of the seven cross-border IPOs in the last five quarters were from China. Q2 2016 saw China Online Education Group listed on the NYSE, followed by Gridsum Holding Inc on NASDAQ in Q3. In Q4 2016, GDS Holdings Ltd was also listed on NASDAQ.
Figure 7: Cross-border IPOs
Source: S&P Capital IQ with analysis by PwC
2 12 2
8 13
18
8
18
Q1 2016 Q2 2016 Q3 2016 Q4 2016 Q1 20170
5
10
15
20
25
Cross-border deals Domestic dealsN
o. o
f IPO
s

Global Technology IPO Review Q1 2017 9
Global tech IPOs rode high on Internet Software & Services subsector The Internet Software & Services subsector led technology IPOs by a significant margin in Q1 2017, and drove exponential growth in the overall IPO market compared to the previous quarter. The subsector registered proceeds of US$4.4 billion in the first three months of the year, up 380% sequentially and a phenomenal 1,470% increase year on year. The sharp rise was due to the Snap IPO. The subsector also registered 150% growth sequentially and 67% year-on-year growth in the number of IPOs. Excluding Snap, proceeds from Internet Software & Services grew 73% year on year, but declined 47% sequentially.
The strong growth in the Internet Software & Services subsector is attributable to the IPOs of two Unicorns, Snap which raised almost US$3.9 billion and MuleSoft which grossed US$221 million.
Semiconductors came in at a distant second with US$345 million in proceeds, and all three listings from China. The subsector registered 271% growth sequentially and 176% growth year on year in proceeds and 50% growth sequentially and year on year in number of IPOs.
Figure 8: Subsector distribution showing total proceeds
Source: S&P Capital IQ with analysis by PwC
Figure 9: Subsector distribution showing Number of IPOs
Source: S&P Capital IQ with analysis by PwC
$280 $103 $125 $64 $0 $132 $66
$916 $433
$93 $0 $0 $107 $193
$4,395
$126 $345 $169 $59 $426 $293
$0
$1,000
$2,000
$3,000
$4,000
$5,000
Internet Software& Services
Software Semiconductors Electronics Computers &Peripherals
CommunicationsEquipment
IT Consulting &Services
U.S
$ in
milli
ons
Q1 2016 Q4 2016 Q1 2017
3
2 2
1
0
1 1
2
4
2
0 0
1 1
5
1
3
2
1
4
2
0
1
2
3
4
5
6
Internet Software& Services
Software Semiconductors Electronics Computers &Peripherals
CommunicationsEquipment
IT Consulting &Services
No.
of I
PO
S
Q1 2016 Q4 2016 Q1 2017
Global Technology IPO Review Q1 2017 10
China
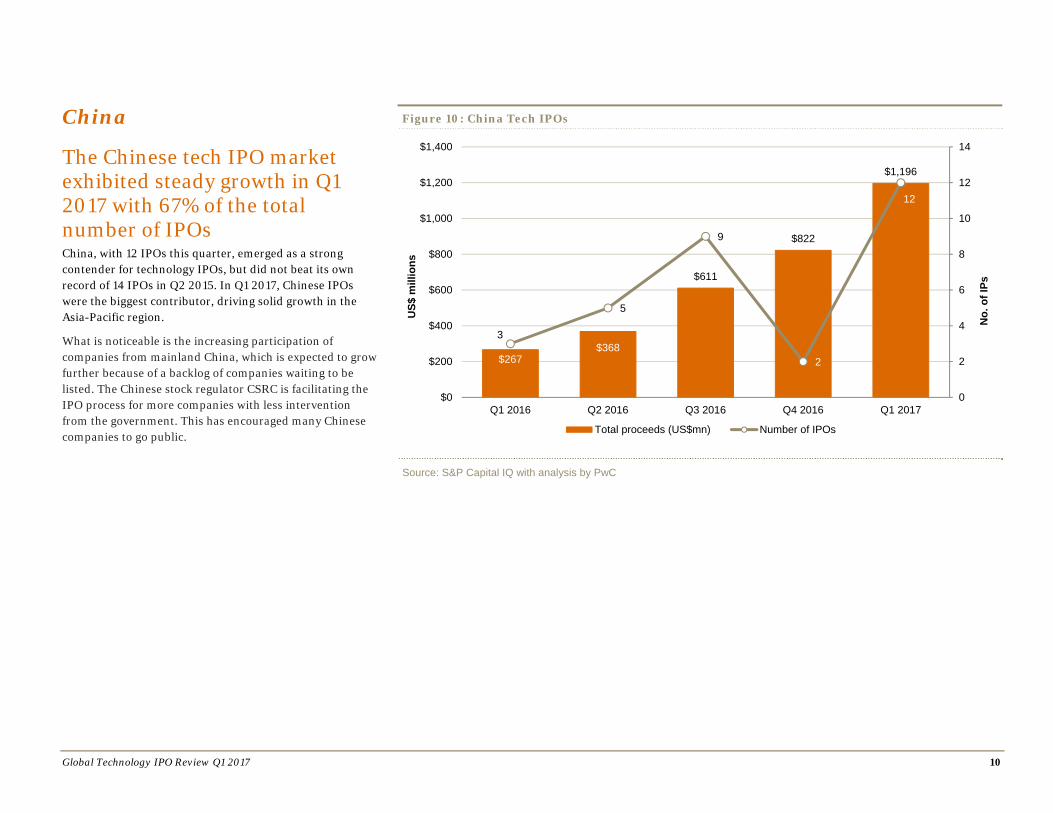
The Chinese tech IPO market exhibited steady growth in Q1 2017 with 67% of the total number of IPOs China, with 12 IPOs this quarter, emerged as a strong contender for technology IPOs, but did not beat its own record of 14 IPOs in Q2 2015. In Q1 2017, Chinese IPOs were the biggest contributor, driving solid growth in the Asia-Pacific region.
What is noticeable is the increasing participation of companies from mainland China, which is expected to grow further because of a backlog of companies waiting to be listed. The Chinese stock regulator CSRC is facilitating the IPO process for more companies with less intervention from the government. This has encouraged many Chinese companies to go public.
Figure 10: China Tech IPOs
Source: S&P Capital IQ with analysis by PwC
$267$368
$611
$822
$1,196
3
5
9
2
12
0
2
4
6
8
10
12
14
Q1 2016 Q2 2016 Q3 2016 Q4 2016 Q1 2017$0
$200
$400
$600
$800
$1,000
$1,200
$1,400
Total proceeds (US$mn) Number of IPOs
US$
mill
ions
No.
of I
Ps
Global Technology IPO Review Q1 2017 11
United States
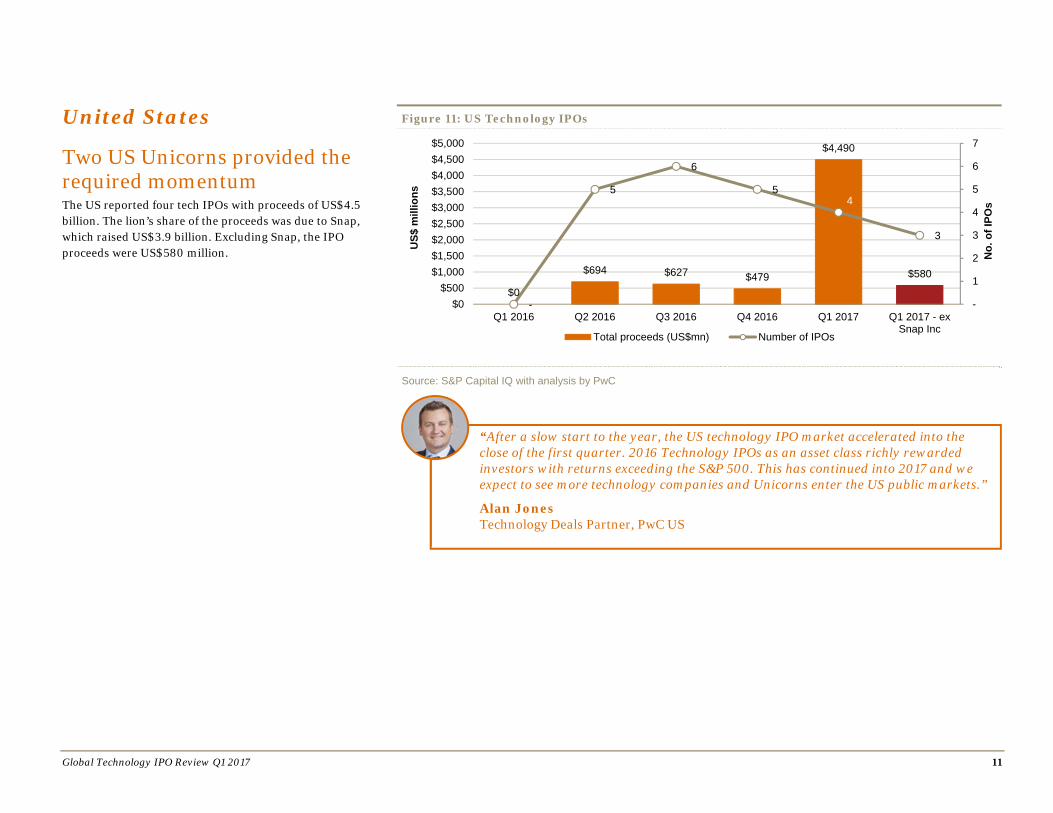
Two US Unicorns provided the required momentum The US reported four tech IPOs with proceeds of US$4.5 billion. The lion’s share of the proceeds was due to Snap, which raised US$3.9 billion. Excluding Snap, the IPO proceeds were US$580 million.
Figure 11: US Technology IPOs
Source: S&P Capital IQ with analysis by PwC
$0
$694 $627 $479
$4,490
$580
-
5
6
5 4
3
-
1
2
3
4
5
6
7
Q1 2016 Q2 2016 Q3 2016 Q4 2016 Q1 2017 Q1 2017 - exSnap Inc
$0$500
$1,000$1,500$2,000$2,500$3,000$3,500$4,000$4,500$5,000
Total proceeds (US$mn) Number of IPOs
No.
of I
POs
US$
mill
ions
“After a slow start to the year, the US technology IPO market accelerated into the close of the first quarter. 2016 Technology IPOs as an asset class richly rewarded investors with returns exceeding the S&P 500. This has continued into 2017 and we expect to see more technology companies and Unicorns enter the US public markets.”
Alan Jones Technology Deals Partner, PwC US

Global Technology IPO Review Q1 2017 12
All other geographies Japan was the only country outside China and the US to register IPOs for technology companies. Though the European continent witnessed a drought in Q1 2017, the outlook may improve once elections are over and Brexit’s impact is better understood.
Figure 12: All other geographies Tech IPOs
“Along with the consumer service and retail sectors, the tech sector continued to drive a strong Japanese IPO market in Q1 2017. The Tech sector represented a quarter of the total Japanese IPOs in Q1 2017.”
Masaru Koshida IPO Solution Leader & Venture Support Centre Leader, PwC Japan
$503 $418
$4,145
$441$126
7
4
5
3
2
-
1
2
3
4
5
6
7
8
Q1 2016 Q2 2016 Q3 2016 Q4 2016 Q1 2017$0
$500
$1,000
$1,500
$2,000
$2,500
$3,000
$3,500
$4,000
$4,500
Total proceeds (US$mn) Number of IPOs
No.
of I
POs
US$
mill
ions
Source: S&P Capital IQ with analysis by PwC
Global Technology IPO Review Q1 2017 13
Europe
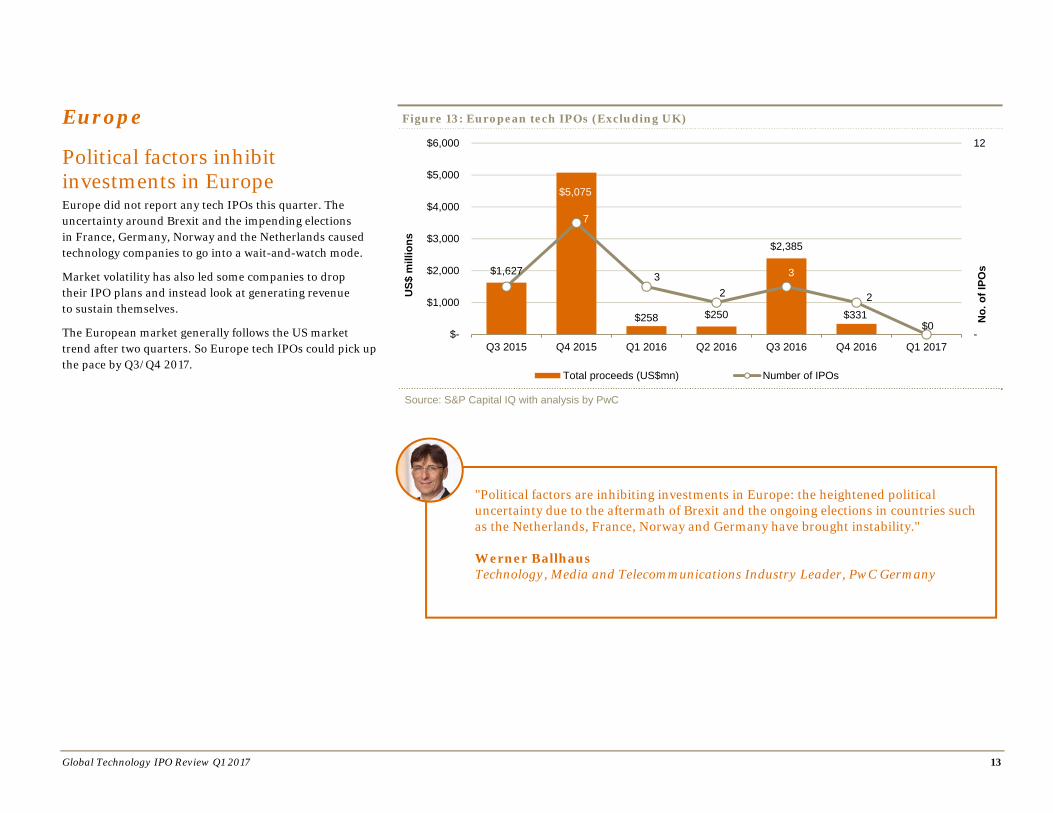
Political factors inhibit investments in Europe Europe did not report any tech IPOs this quarter. The uncertainty around Brexit and the impending elections in France, Germany, Norway and the Netherlands caused technology companies to go into a wait-and-watch mode.
Market volatility has also led some companies to drop their IPO plans and instead look at generating revenue to sustain themselves.
The European market generally follows the US market trend after two quarters. So Europe tech IPOs could pick up the pace by Q3/Q4 2017.
Figure 13: European tech IPOs (Excluding UK)
Source: S&P Capital IQ with analysis by PwC
$1,627
$5,075
$258 $250
$2,385
$331$0
3
7
3 2
3
2
- -
12
Q3 2015 Q4 2015 Q1 2016 Q2 2016 Q3 2016 Q4 2016 Q1 2017 $-
$1,000
$2,000
$3,000
$4,000
$5,000
$6,000
Total proceeds (US$mn) Number of IPOs
US$
mill
ions
No.
of I
POs
"Political factors are inhibiting investments in Europe: the heightened political uncertainty due to the aftermath of Brexit and the ongoing elections in countries such as the Netherlands, France, Norway and Germany have brought instability." Werner Ballhaus Technology, Media and Telecommunications Industry Leader, PwC Germany
Global Technology IPO Review Q1 2017 14
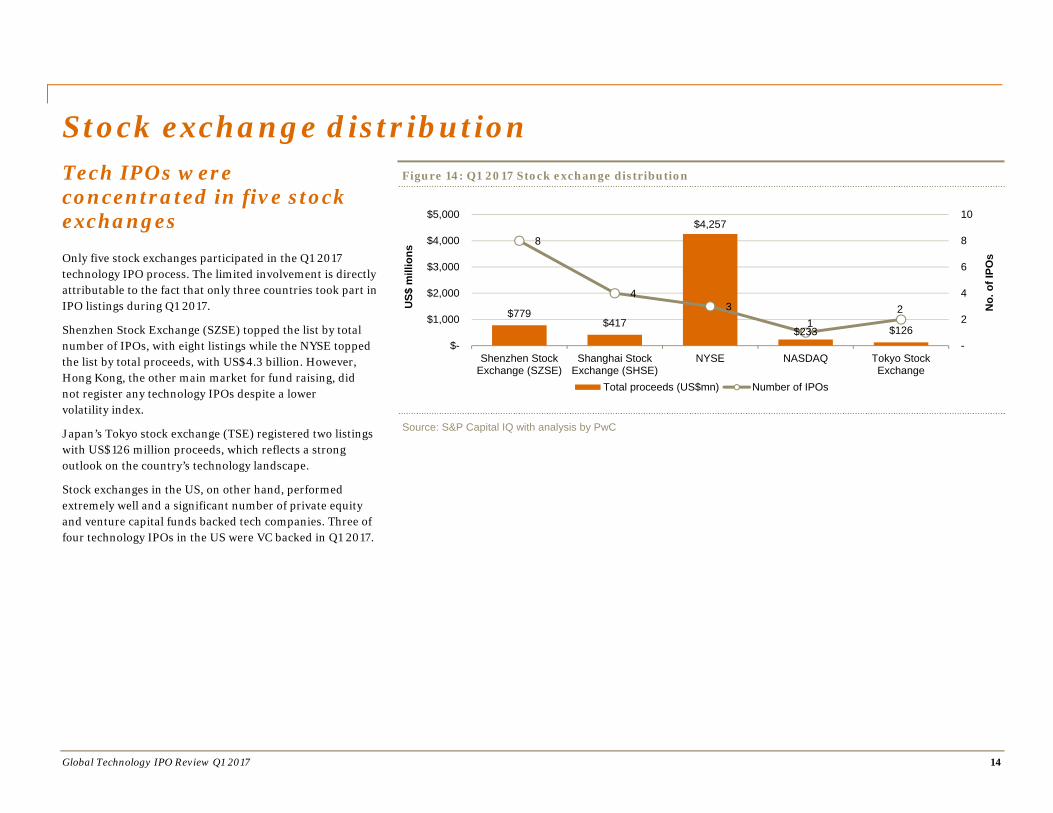
Stock exchange distribution Tech IPOs were concentrated in five stock exchanges Only five stock exchanges participated in the Q1 2017 technology IPO process. The limited involvement is directly attributable to the fact that only three countries took part in IPO listings during Q1 2017.
Shenzhen Stock Exchange (SZSE) topped the list by total number of IPOs, with eight listings while the NYSE topped the list by total proceeds, with US$4.3 billion. However, Hong Kong, the other main market for fund raising, did not register any technology IPOs despite a lower volatility index.
Japan’s Tokyo stock exchange (TSE) registered two listings with US$126 million proceeds, which reflects a strong outlook on the country’s technology landscape.
Stock exchanges in the US, on other hand, performed extremely well and a significant number of private equity and venture capital funds backed tech companies. Three of four technology IPOs in the US were VC backed in Q1 2017.
Figure 14: Q1 2017 Stock exchange distribution
Source: S&P Capital IQ with analysis by PwC
$779$417
$4,257
$233 $126
8
4 3
1 2
-
2
4
6
8
10
Shenzhen StockExchange (SZSE)
Shanghai StockExchange (SHSE)
NYSE NASDAQ Tokyo StockExchange
$-
$1,000
$2,000
$3,000
$4,000
$5,000
Total proceeds (US$mn) Number of IPOs
US$
mill
ions
No.
of I
POs

Global Technology IPO Review Q1 2017 15
Subsector distribution – Q1 2017 Internet Software & Services was the leading category in tech IPOs in Q1 2017. Semiconductors and Communications Equipment are the other two subsectors that witnessed strong growth owing to increased participation by Chinese companies.
While the Semiconductors subsector had three listings with US$345 million proceeds, marking a 176% year-on-year growth, the Communications Equipment subsector raised US$426 million, up 223% year on year with four Chinese listings.
Figure 15: Q1 2017 Subsector distribution
Source: S&P Capital IQ with analysis by PwC
$426$59
$169
$4,395
$293 $345$126
4
1
2
5
2
3
1
-
1
2
3
4
5
6
CommunicationsEquipment
Computers &Peripherals
ElectronicComputer
Manufacturing
Internet Software &Services
IT Consulting &Services
Semiconductors Software $-
$500
$1,000
$1,500
$2,000
$2,500
$3,000
$3,500
$4,000
$4,500
$5,000
Total proceeds (US$mn) Number of IPOs
US$
mill
ions
No.
of I
POs

Global Technology IPO Review Q1 2017 16
Distribution of VC and non-VC backed IPOs Ten of the 18 tech IPOs were VC-backed. Four of the 10 VC-backed IPOs were from the Internet Software & Services subsector.
China had six VC-backed tech IPOs, followed by the US with three and Japan with one.
The US raised proceeds of US$4.3 billion from VC-backed companies, followed by China (US$482 million) and Japan (US$78 million).
Figure 16: VC-backed & non-VC-backed IPOs – Q1 2017
Source: S&P Capital IQ with analysis by PwC
$482$78
$4,257
$714
$48$233
6
1
3
0
1
2
3
4
5
6
7
China Japan US $-
$500
$1,000
$1,500
$2,000
$2,500
$3,000
$3,500
$4,000
$4,500
No.
of I
POs
VC-backed total proceeds Non VC-backed total proceeds No. of VC-backed IPOs
US$
mill
ions

Global Technology IPO Review Q1 2017 17
Q1 2017 tech IPOs – Offering details Table 1: Q1 2017 tech IPOs – By issue date
Issue date Company Subsector Proceeds (US$mn)
Primary exchange
Domicile nation
Q1 03/01/2017 Snap Inc Internet Software &
Services 3,910.0 NYSE United States
03/16/2017 Yealink Network Technology Co Ltd
Communications Equipment
240.1 Shenzhen Stock Exchange
China
03/09/2017 Presidio, Inc IT Consulting & Services 233.3 Global Select United States
03/16/2017 MuleSoft, Inc Internet Software & Services
221.0 NYSE United States
01/06/2017 Shenzhen Kinwong Electronic Co Ltd Semiconductor 159.8 Shanghai Stock Exchange China
01/03/2017 G-bits Network Technology(Xiamen) Co Ltd
Internet Software & Services
138.4 Shanghai Stock Exchange China
03/23/2017 Alteryx, Inc Software 126.0 NYSE United States
01/18/2017 Guangzhou Shiyuan Electronic Technology Co Ltd
Electronic Computer Manufacturing
112.9 Shenzhen Stock Exchange
China
03/13/2017 Jiangsu JieJie Microelectronics Co Ltd Semiconductors 94.3 Shenzhen Stock
Exchange China
02/19/2017 Shanghai Fullhan Microelectronics Co Ltd Semiconductors 90.1 Shenzhen Stock
Exchange China

Global Technology IPO Review Q1 2017 18
Q1 2017 tech IPOs – Offering details Table 1: Q1 2017 tech IPOs – By issue date
Issue date Company Subsector Proceeds (US$mn)
Primary exchange
Domicile nation
01/10/2017 Queclink Wireless Solutions Co Ltd
Communications Equipment
82.3 Shenzhen Stock Exchange
China
03/16/2017 Beaglee Inc Internet Software & Services
78.1 The Tokyo Stock Exchange
Japan
01/19/2017 Shanghai Athub Co Ltd IT Consulting & Services 59.8 Shanghai Stock Exchange
China
03/10/2017 Tanyuan Technology Co Ltd Computers & Peripherals 59.3 Shanghai Stock Exchange
China
01/24/2017 Shenzhen TXD Technology Co Ltd
Electronic Computer Manufacturing
56.0 Shenzhen Stock Exchange
China
03/20/2017 Shanghai Huace Navigation Technology Ltd
Communications Equipment
55.1 Shenzhen Stock Exchange
China
03/29/2017 Aucnet Inc Internet Software & Services
48.0 The Tokyo Stock Exchange
Japan
01/22/2017 Jilin Jlu Communication Design Institute Co Ltd
Communications Equipment
48.3 Shenzhen Stock Exchange
China
Source: S&P Capital IQ with analysis by PwC

Global Technology IPO Review Q1 2017 19
Key financials – Q1 2017 The average last twelve months’ (LTM) revenue for the 18 technology IPOs in Q1 was US$356 million. Only four of the 18 companies reported losses. However, the magnitude of losses for the larger companies, including the two Unicorns, resulted in an average net loss for all companies combined. The average LTM loss for Q1 2017 stood at US$8 million. Still, 78% of the companies registered net income, a striking shift from the last quarter of 2016, in which 80% reported net losses. The four Q1 IPO companies that reported losses were Alteryx Inc, MuleSoft, Presidio Inc, and Snap. These are all American companies and Snap, the biggest, reported the largest loss, US$515 million.
The Internet Software & Services subsector had an average LTM revenue of US$204 million, average LTM EBITDA of (US$92 million) and average enterprise value of US$5.7 billion. The subsector also registered the highest EV/LTM revenue of 27.9x.
The Communications Equipment subsector had one IPO in Q4 and none in Q2 and Q3 2016. However, the subsector rebounded and registered four new IPOs in Q1. The average LTM revenue was US$77 million, and LTM EBITDA stood at US$24 million. The subsector reported an average net income of US$25 million.
The Semiconductors subsector has been consistent in its performance and reported an average revenue of US$181 million from three listings. All three are Chinese companies. The subsector recorded a healthy average net income of US$36 million.
The Computers & Peripherals subsector reported revenue of US$67 million from a single listing in Q1 2017.
Among other subsectors, IT Consulting & Services and Electronics each registered two IPOs. IT Consulting & Services had the highest average revenue at US$1.4 billion, and average LTM EBITDA of US$109 million. The Electronics subsector registered average LTM revenue of US$765 million and LTM net income of US$58 million.
Figure 17: Full-year and Q1 2017 tech IPOs – Net income
Source: S&P Capital IQ with analysis by PwC
78%
22%
Q1 2017
Net income Net loss
20%
80%
Q4 2016
Net income Net loss

Global Technology IPO Review Q1 2017 20
Figure 18: Q1 2017—Average LTM revenue
Source: S&P Capital IQ with analysis by PwC
Figure 19: Q1 2017—Average LTM EBITDA
Source: S&P Capital IQ with analysis by PwC
$204$77
$181
$1,424
$86 $67
$765
$3565
4
32
11 2
18
0
4
8
12
16
20
$-
$200.0
$400.0
$600.0
$800.0
$1,000.0
$1,200.0
$1,400.0
$1,600.0
Internet Software &Services
CommunicationsEquipment
Semiconductors IT Consulting &Services
Software Computers &Peripherals
ElectronicComputer
Manufacturing
All sectors
No.
of I
POs
LTM revenue No. of IPOs
In U
S$ m
illio
ns
-$92
$24 $49
$109
($21)
$13
$66
$13
54
32
1 1 2
18
0
4
8
12
16
20
-$150
-$100
-$50
$0
$50
$100
$150
Internet Software &Services
CommunicationsEquipment
Semiconductors IT Consulting &Services
Software Computers &Peripherals
Electronic ComputerManufacturing
All sectors
No.
of I
POs
LTM EBITDA No. of IPOs
In U
S$ m
illio
ns

Global Technology IPO Review Q1 2017 21
Figure 20: Q1 2017—Average LTM net income
Source: S&P Capital IQ with analysis by PwC
($92)
$25 $36
$3
($24)
$12
$58
($8)5
43
21 1
2
18
0
4
8
12
16
20
$(100.0)
$(80.0)
$(60.0)
$(40.0)
$(20.0)
$-
$20.0
$40.0
$60.0
$80.0
Internet Software &Services
CommunicationsEquipment
Semiconductors IT Consulting &Services
Software Computers &Peripherals
ElectronicComputer
Manufacturing
All sectors
No.
of I
POs
LTM net income No. of IPOs
In U
S$ m
illio
ns

Global Technology IPO Review Q1 2017 22
Figure 21: Q1 2017—Average total debt
Source: S&P Capital IQ with analysis by PwC
$11 $0 $19
$666
$0 $0$0 $80
54
32
1 12
18
0
4
8
12
16
20
$-
$100.0
$200.0
$300.0
$400.0
$500.0
$600.0
$700.0
Internet Software &Services
CommunicationsEquipment
Semiconductors IT Consulting &Services
Software Computers &Peripherals
ElectronicComputer
Manufacturing
All sectors
No.
of I
POs
LTM debt No. of IPOs
In U
S$ m
illio
ns

Global Technology IPO Review Q1 2017 23
Figure 22: Q1 2017—Average enterprise value
Source: S&P Capital IQ with analysis by PwC
$5,674
$1,468 $1,614$2,078
$1,004 $960
$2,848 $2,828
54
32
1 12
18
0
4
8
12
16
20
$-
$1,000.0
$2,000.0
$3,000.0
$4,000.0
$5,000.0
$6,000.0
Internet Software &Services
CommunicationsEquipment
Semiconductors IT Consulting &Services
Software Computers &Peripherals
ElectronicComputer
Manufacturing
All sectors
No.
of I
POs
Enterprise value No. of IPOs
In U
S$ m
illio
ns

Global Technology IPO Review Q1 2017 24
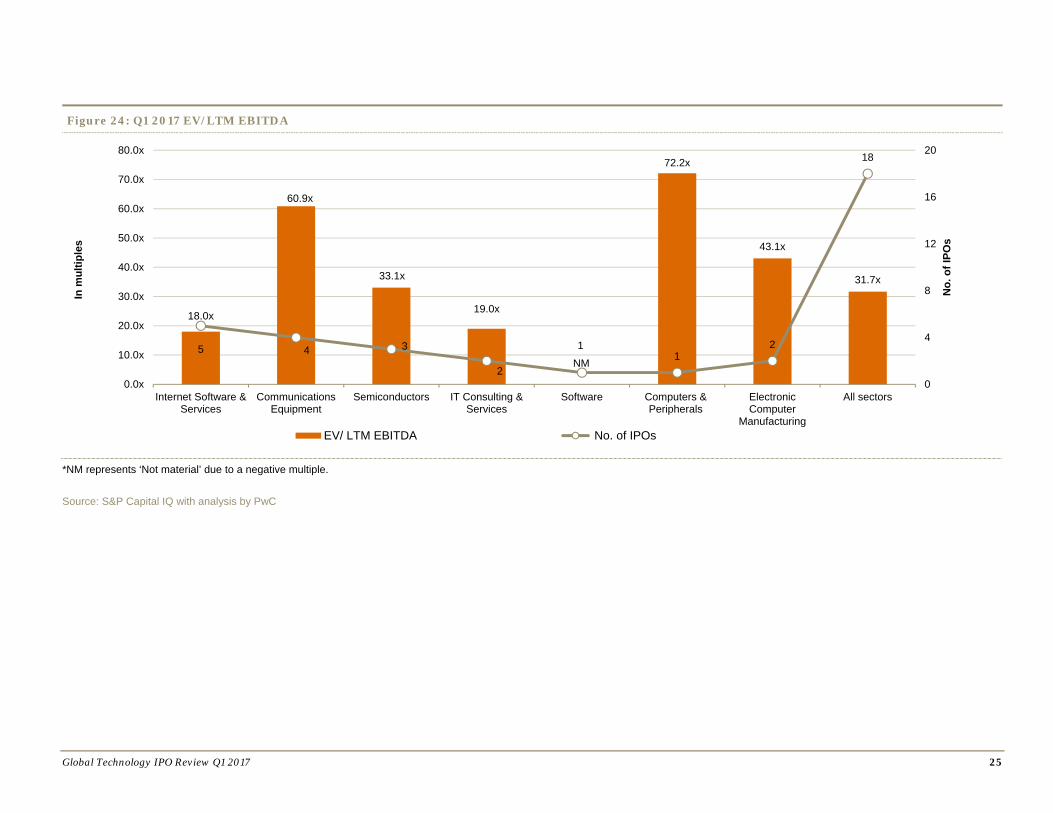
Q1 2017 Technology IPO listings – Valuation metrics The overall EV/LTM Revenue of technology IPOs increased from 5.1x in Q4 2016 to 8x in Q1 2017. Internet Software & Services and Communications Equipment led the valuation metrics as these subsectors registered the highest average EV/LTM Revenue multiple.
Computers & Peripherals registered the highest EV/LTM EBITDA of 72.2x owing to a single listing. This was followed by the Communications Equipment subsector with 60.9x.
Figure 23: Q1 2017 EV/LTM revenue
Source: S&P Capital IQ with analysis by PwC
27.9x
19.0x
8.9x
1.5x
11.7x
14.4x
3.7x
8.0x54
32
1 12
18
0
4
8
12
16
20
0.0x
5.0x
10.0x
15.0x
20.0x
25.0x
30.0x
InternetSoftware &Services
CommunicationsEquipment
Semiconductors IT Consulting &Services
Software Computers &Peripherals
ElectronicComputer
Manufacturing
All sectors
No.
of I
POs
EV/LTM revenue No. of IPOs
In m
ultip
les
Global Technology IPO Review Q1 2017 25
Figure 24: Q1 2017 EV/LTM EBITDA
*NM represents ‘Not material’ due to a negative multiple.
Source: S&P Capital IQ with analysis by PwC
18.0x
60.9x
33.1x
19.0x
NM
72.2x
43.1x
31.7x
5 4 3
2
11
2
18
0
4
8
12
16
20
0.0x
10.0x
20.0x
30.0x
40.0x
50.0x
60.0x
70.0x
80.0x
Internet Software &Services
CommunicationsEquipment
Semiconductors IT Consulting &Services
Software Computers &Peripherals
ElectronicComputer
Manufacturing
All sectors
No.
of I
POs
EV/ LTM EBITDA No. of IPOs
In m
ultip
les

Global Technology IPO Review Q1 2017 26
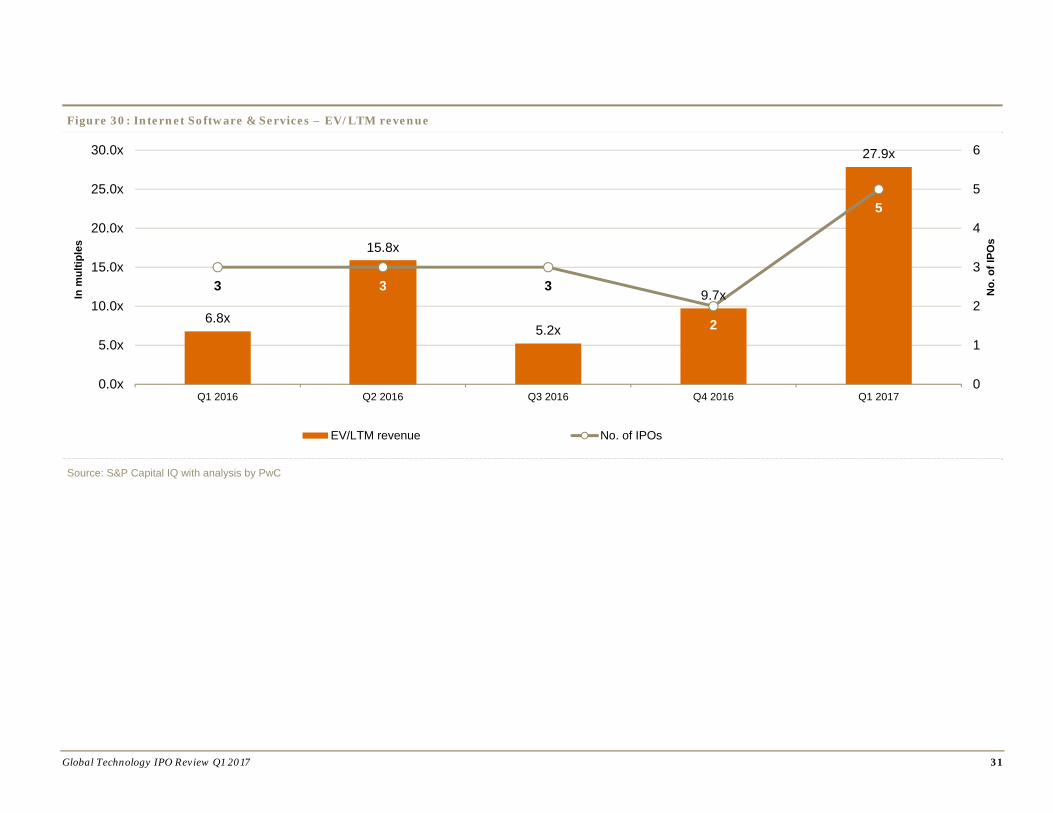
Top three subsectors in Q1 2017 Internet Software & Services The Internet Software & Services subsector registered five IPO listings in Q1 2017, with average LTM revenue of US$204 million compared to US$472 million in Q4 2016. The subsector witnessed significant growth both sequentially (380%) and year on year (1,470%) in proceeds. This massive growth is primarily attributable to the IPO of Snap, which helped the subsector to record US$4.4 billion, with its solo contribution of US$3.9 billion.
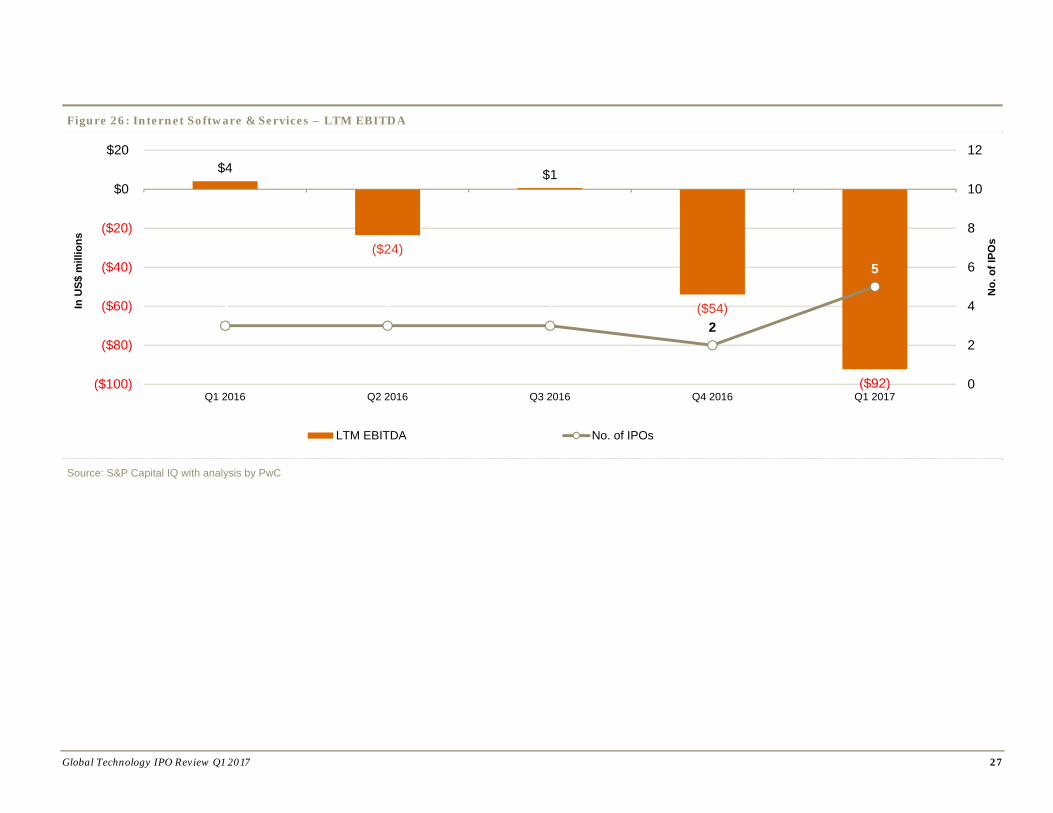
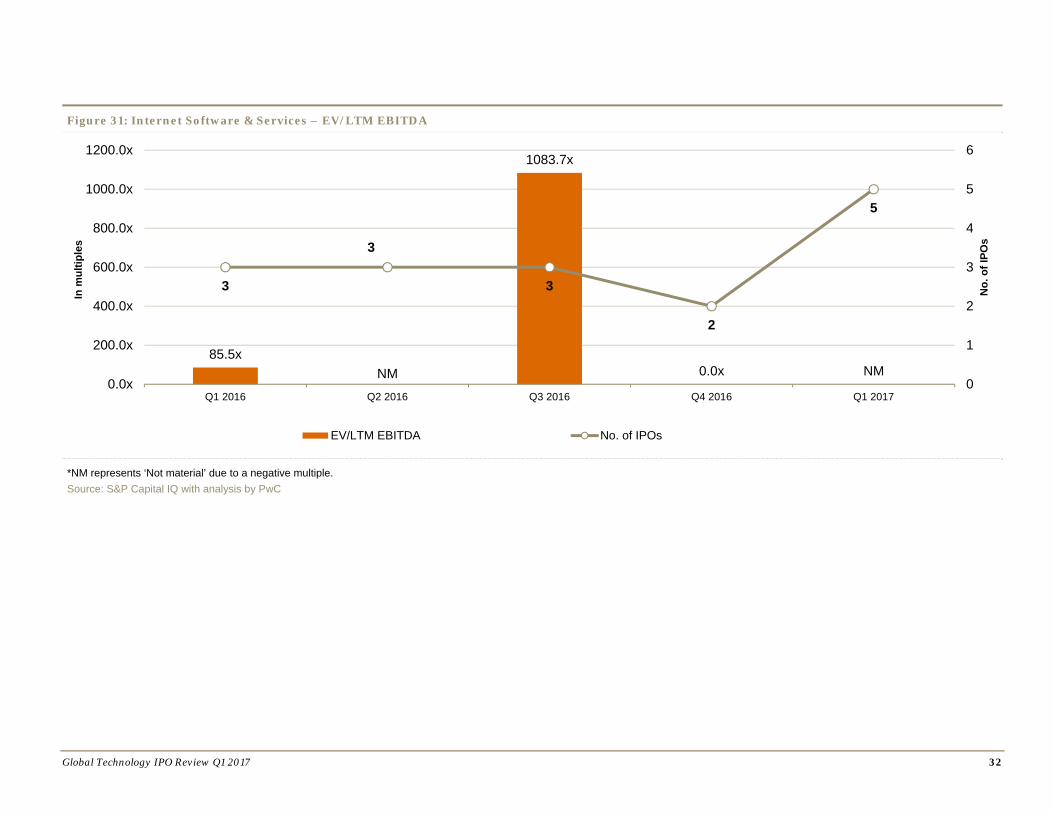
Average LTM EBITDA for the same quarter was negative US$92 million, compared to negative US$54 million in Q4 2016. Average net loss for the period also stood at US$92 million compared to a net loss of US$479 million in Q4 2016. The subsector has been incurring average net losses since Q2 2016.
Average debt declined by 61% to US$11 million in Q1 2017 from US$28 million in Q4 2016.
EV/LTM revenue jumped to 27.9x in Q1 2017 from 9.7x in Q4 2016.
Figure 25: Internet Software & Services – LTM revenue
Source: S&P Capital IQ with analysis by PwC
$52 $96
$131
$472
$204
3 3
32
5
0
2
4
6
8
10
12
$0
$50
$100
$150
$200
$250
$300
$350
$400
$450
$500
Q1 2016 Q2 2016 Q3 2016 Q4 2016 Q1 2017
No.
of I
POs
LTM revenue No. of IPOs
In U
S$ m
illio
ns
Global Technology IPO Review Q1 2017 27
Figure 26: Internet Software & Services – LTM EBITDA
Source: S&P Capital IQ with analysis by PwC
$4
($24)
$1
($54)
($92)
3 3 32
5
0
2
4
6
8
10
12
($100)
($80)
($60)
($40)
($20)
$0
$20
Q1 2016 Q2 2016 Q3 2016 Q4 2016 Q1 2017
No.
of I
POs
LTM EBITDA No. of IPOs
In U
S$ m
illio
ns

Global Technology IPO Review Q1 2017 28
Figure 27: Internet Software & Services – LTM net income
Source: S&P Capital IQ with analysis by PwC
$4
($28) ($14)
($479)
($92)
3 3 32
5
0
2
4
6
8
10
12
($600)
($500)
($400)
($300)
($200)
($100)
$0
$100
Q1 2016 Q2 2016 Q3 2016 Q4 2016 Q1 2017
No.
of I
POs
LTM Net income No. of IPOs
In U
S$ m
illio
ns

Global Technology IPO Review Q1 2017 29
Figure 28: Internet Software & Services – Enterprise Value
Source: S&P Capital IQ with analysis by PwC
$351
$1,526
$686
$4,587
$5,674
3 3
3
2
5
0
1
2
3
4
5
6
$0
$1,000
$2,000
$3,000
$4,000
$5,000
$6,000
Q1 2016 Q2 2016 Q3 2016 Q4 2016 Q1 2017
No.
of I
POs
Enterprise value No. of IPOs
In U
S$ m
illio
ns

Global Technology IPO Review Q1 2017 30
Figure 29: Internet Software & Services – Total debt
Source: S&P Capital IQ with analysis by PwC
$1
$8
$18
$28
$11
3 3
3 2
5
0
1
2
3
4
5
6
$0
$5
$10
$15
$20
$25
$30
Q1 2016 Q2 2016 Q3 2016 Q4 2016 Q1 2017
No.
of I
POs
Total debt No. of IPOs
In U
S$ m
illio
ns
Global Technology IPO Review Q1 2017 31
Figure 30: Internet Software & Services – EV/LTM revenue
Source: S&P Capital IQ with analysis by PwC
6.8x
15.8x
5.2x
9.7x
27.9x
3 3 3
2
5
0
1
2
3
4
5
6
0.0x
5.0x
10.0x
15.0x
20.0x
25.0x
30.0x
Q1 2016 Q2 2016 Q3 2016 Q4 2016 Q1 2017
No.
of I
POs
EV/LTM revenue No. of IPOs
In m
ultip
les
Global Technology IPO Review Q1 2017 32
Figure 31: Internet Software & Services – EV/LTM EBITDA
*NM represents ‘Not material’ due to a negative multiple. Source: S&P Capital IQ with analysis by PwC
85.5xNM
1083.7x
0.0x NM
3
3
3
2
5
0
1
2
3
4
5
6
0.0x
200.0x
400.0x
600.0x
800.0x
1000.0x
1200.0x
Q1 2016 Q2 2016 Q3 2016 Q4 2016 Q1 2017
No.
of I
POs
EV/LTM EBITDA No. of IPOs
In m
ultip
les

Global Technology IPO Review Q1 2017 33
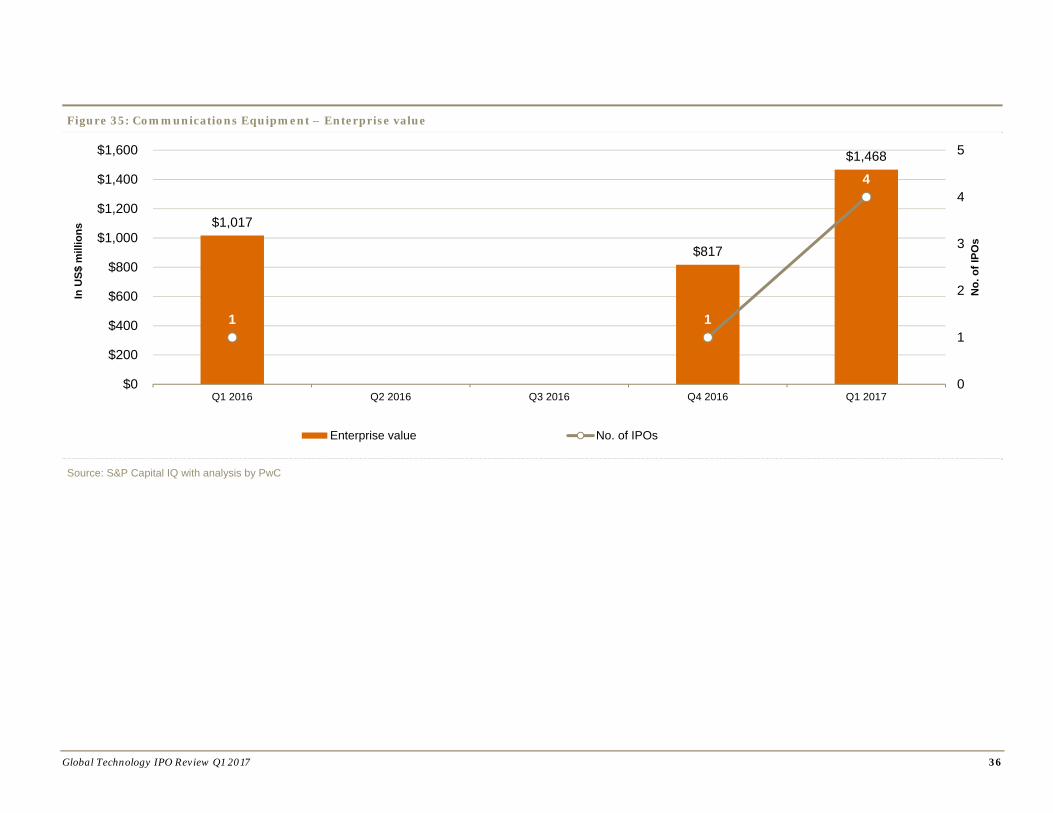
Communications Equipment The Communications Equipment subsector registered four listings with total proceeds of US$426 million. Despite the 300% increase in number of IPOs in Q1 2017, the average LTM revenue declined 34% sequentially, and 62% year on year.
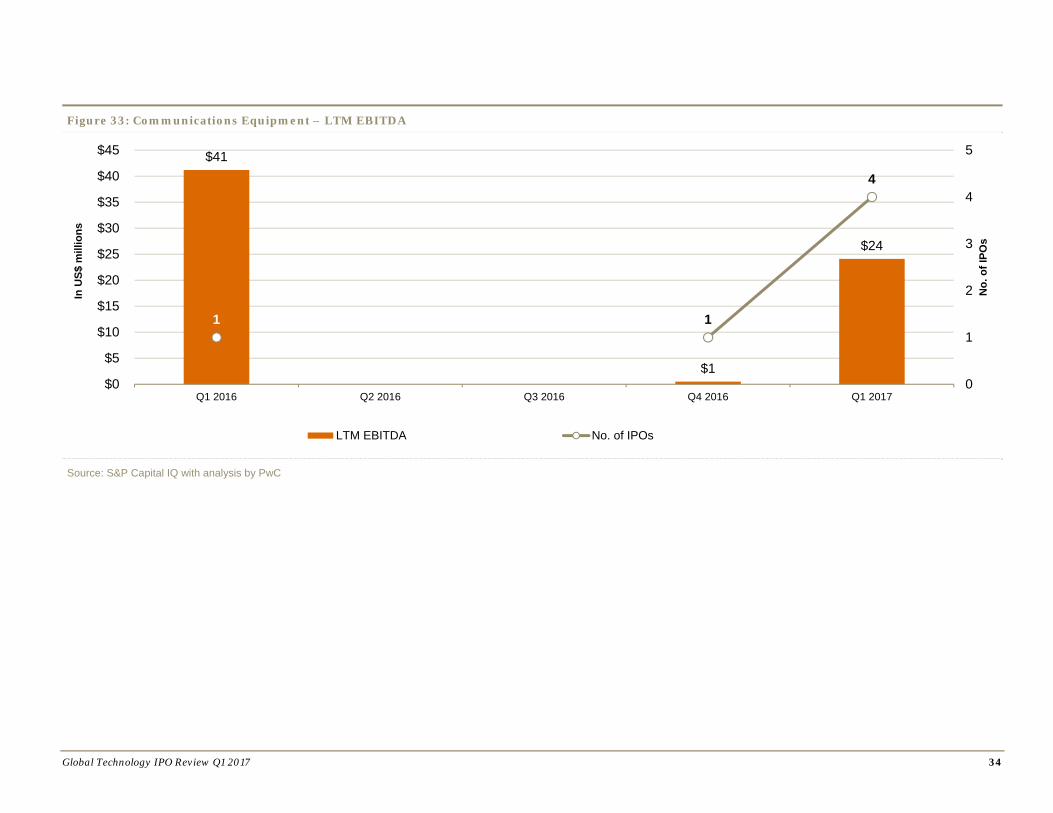
As for average LTM EBITDA, significant growth was noticed in Q1 2017 a 2,300% increase compared to Q4 2016. However, average LTM EBITDA declined 41% year on year. Average net income was US$25 million, a year-on-year decline of 34%.
EV/LTM revenue increased to 19x, both sequentially (Q4 2016 – 7.0x) and year on year (Q1 2016 – 5.0x). EV/LTM EBITDA declined drastically quarter on quarter to 60.9x from 1,634.6x in Q4 2016.
Figure 32: Communications Equipment – LTM revenue
Source: S&P Capital IQ with analysis by PwC
$205
$117
$77
1 1
4
0
1
2
3
4
5
$0
$50
$100
$150
$200
$250
Q1 2016 Q2 2016 Q3 2016 Q4 2016 Q1 2017
No.
of I
POs
LTM revenue No. of IPOs
In U
S$ m
illio
ns
Global Technology IPO Review Q1 2017 34
Figure 33: Communications Equipment – LTM EBITDA
Source: S&P Capital IQ with analysis by PwC
$41
$1
$24
1 1
4
0
1
2
3
4
5
$0
$5
$10
$15
$20
$25
$30
$35
$40
$45
Q1 2016 Q2 2016 Q3 2016 Q4 2016 Q1 2017
No.
of I
POs
LTM EBITDA No. of IPOs
In U
S$ m
illio
ns

Global Technology IPO Review Q1 2017 35
Figure 34: Communications Equipment – LTM net income
Source: S&P Capital IQ with analysis by PwC
$38
($2)
$25
11
4
0
1
2
3
4
5
($5)
$0
$5
$10
$15
$20
$25
$30
$35
$40
Q1 2016 Q2 2016 Q3 2016 Q4 2016 Q1 2017
No.
of I
POs
LTM net income No. of IPOs
In U
S$ m
illio
ns
Global Technology IPO Review Q1 2017 36
Figure 35: Communications Equipment – Enterprise value
Source: S&P Capital IQ with analysis by PwC
$1,017
$817
$1,468
1 1
4
0
1
2
3
4
5
$0
$200
$400
$600
$800
$1,000
$1,200
$1,400
$1,600
Q1 2016 Q2 2016 Q3 2016 Q4 2016 Q1 2017
No.
of I
POs
Enterprise value No. of IPOs
In U
S$ m
illio
ns

Global Technology IPO Review Q1 2017 37
Figure 36: Communications Equipment – Total debt
Source: S&P Capital IQ with analysis by PwC
$0
$6
$0
1 1
4
0
1
2
3
4
5
$0
$1
$2
$3
$4
$5
$6
$7
Q1 2016 Q2 2016 Q3 2016 Q4 2016 Q1 2017
No.
of I
POs
Total debt No. of IPOs
In U
S$ m
illio
ns

Global Technology IPO Review Q1 2017 38
Figure 37: Communications Equipment – EV/LTM revenue
Source: S&P Capital IQ with analysis by PwC
5.0x
7.0x
19.0x
1 1
4
0
1
2
3
4
0.0x
2.0x
4.0x
6.0x
8.0x
10.0x
12.0x
14.0x
16.0x
18.0x
20.0x
Q1 2016 Q2 2016 Q3 2016 Q4 2016 Q1 2017
No.
of I
POs
EV/LTM revenue No. of IPOs
In m
ultip
les

Global Technology IPO Review Q1 2017 39
Figure 38: Communications Equipment – EV/LTM EBITDA
Source: S&P Capital IQ with analysis by PwC
24.7x
1634.6x
60.9x
1 1
4
0
1
2
3
4
0.0x
200.0x
400.0x
600.0x
800.0x
1000.0x
1200.0x
1400.0x
1600.0x
1800.0x
Q1 2016 Q2 2016 Q3 2016 Q4 2016 Q1 2017
No.
of I
POs
EV/LTM EBITDA No. of IPOs
In m
ultip
les

Global Technology IPO Review Q1 2017 40
Semiconductors The average revenue for semiconductor IPO companies in Q1 2017 was US$181 million, a decrease of 1% sequentially and 66% decline year on year. The subsector registered three IPOs, which grew 50% over the previous quarter.
Average LTM EBITDA increased by 1,125% quarter on quarter from US$4 million in Q4 2016 to US$49 million in Q1 2017, while growing 188% on a year-on-year basis from US$17 million to US$49 million.
Semiconductor EV increased 372% on a sequential basis from US$342 million in Q4 2016 to US$1.6 billion in Q1 2017.
LTM net income increased significantly from US$14 million in Q1 2016 to US$36 million in Q1 2017, registering 157% year-on- year growth.
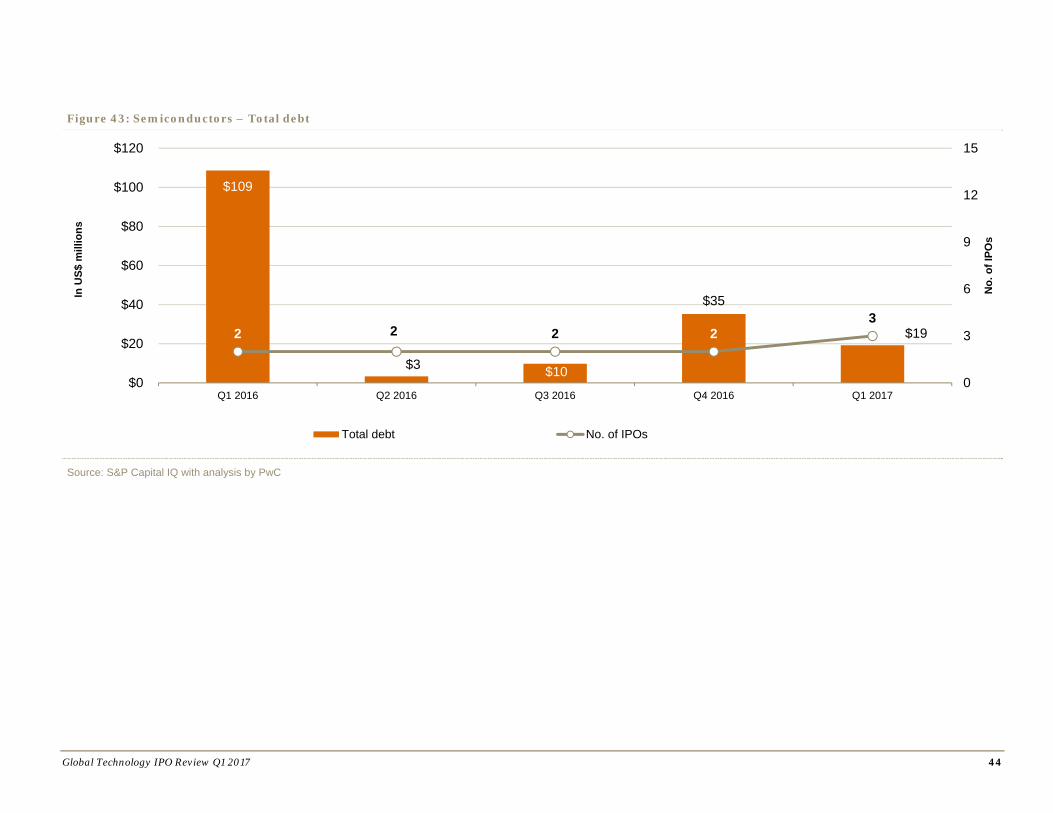
Total debt for Q1 2017 decreased by 84% at US$19 million compared to US$35 million in Q4 2016.
The subsector’s valuation multiple of EV/LTM revenue increased from 1.9x in Q4 2016 to 8.9x in Q1 2017. However, EV/LTM EBITDA declined to 33.1x in Q1 2017 from 77.7x in Q4 2016.
Figure 39: Semiconductors – LTM revenue
Source: S&P Capital IQ with analysis by PwC
$529
$276
$147$183 $181
2 2 2 23
0
3
6
9
12
15
$0
$100
$200
$300
$400
$500
$600
Q1 2016 Q2 2016 Q3 2016 Q4 2016 Q1 2017
No.
of I
POs
LTM revenue No. of IPOs
In U
S$ m
illio
ns

Global Technology IPO Review Q1 2017 41
Figure 40: Semiconductors – LTM EBITDA
Source: S&P Capital IQ with analysis by PwC
$17
$57
$15
$4
$49
2
2 2 2 3
0
3
6
9
12
15
$0
$10
$20
$30
$40
$50
$60
Q1 2016 Q2 2016 Q3 2016 Q4 2016 Q1 2017
No.
of I
POs
LTM EBITDA No. of IPOs
In U
S$ m
illio
ns

Global Technology IPO Review Q1 2017 42
Figure 41: Semiconductors – LTM net income
Source: S&P Capital IQ with analysis by PwC
$14
$51
$13
($8)
$36
2 2 2 23
0
3
6
9
12
15
($20)
($10)
$0
$10
$20
$30
$40
$50
$60
Q1 2016 Q2 2016 Q3 2016 Q4 2016 Q1 2017
No.
of I
POs
LTM net income No. of IPOs
In U
S$ m
illio
ns

Global Technology IPO Review Q1 2017 43
Figure 42: Semiconductors – Enterprise value
Source: S&P Capital IQ with analysis by PwC
$345
$1,279
$1,689
$342
$1,614
2 2 2
2
3
0
1
2
3
4
$0
$200
$400
$600
$800
$1,000
$1,200
$1,400
$1,600
$1,800
Q1 2016 Q2 2016 Q3 2016 Q4 2016 Q1 2017
No.
of I
POs
Enterprise value No. of IPOs
In U
S$ m
illio
ns
Global Technology IPO Review Q1 2017 44
Figure 43: Semiconductors – Total debt
Source: S&P Capital IQ with analysis by PwC
$109
$3 $10
$35
$192 2 2 23
0
3
6
9
12
15
$0
$20
$40
$60
$80
$100
$120
Q1 2016 Q2 2016 Q3 2016 Q4 2016 Q1 2017
No.
of I
POs
Total debt No. of IPOs
In U
S$ m
illio
ns

Global Technology IPO Review Q1 2017 45
Figure 44: Semiconductors – EV/LTM revenue
Source: S&P Capital IQ with analysis by PwC
0.7x
4.6x
11.5x
1.9x
8.9x
2 2 2
2
3
0
3
6
9
12
15
0.0x
2.0x
4.0x
6.0x
8.0x
10.0x
12.0x
14.0x
Q1 2016 Q2 2016 Q3 2016 Q4 2016 Q1 2017
No.
of I
POs
EV/LTM revenue No. of IPOs
In m
ultip
les

Global Technology IPO Review Q1 2017 46
Figure 45: Semiconductors – EV/LTM EBITDA
Source: S&P Capital IQ with analysis by PwC
20.8x 22.6x
113.4x
77.7x
33.1x
2 2
2 2
3
0
1
2
3
4
5
0.0x
20.0x
40.0x
60.0x
80.0x
100.0x
120.0x
Q1 2016 Q2 2016 Q3 2016 Q4 2016 Q1 2017
No.
of I
PO's
EV/LTM EBITDA No. of IPOs
In M
ultip
les

Global Technology IPO Review Q1 2017 47
Methodology The Global Technology IPO Review for Q1 2017 is based on PwC’s analysis of transaction data extracted from S&P Capital IQ. The analysis considers IPOs across all countries worldwide during the period 1 January 2017 to 31 March 2017 (Q1), financial data was also obtained from S&P Capital IQ.
The definition of the Technology subsector is based on the S&P Capital IQ database industry classifications and includes the following subsectors:
Internet Software & Services IT Consulting & Services Professional Services (e.g., Application Software, Software Solutions) Semiconductors Software Computers & Peripherals
– Computers, Computers Peripheral Equipment – Computers, Storage Device Manufacturing
Electronic Computer Manufacturing (“Electronics”) Communications Equipment
Only IPOs with issue size greater than US$40 million were included in the analysis.
All monetary amounts are in US dollars unless otherwise indicated.
LTM – Last 12 months
Most figures are rounded to one decimal.

Global Technology IPO Review Q1 2017 48
For more information
If you would like to discuss how these findings might impact your business or your future strategy, please reach out to any of our technology industry leaders listed below.
Raman Chitkara Global Technology Leader Phone: 1 408 817 3746 Email: [email protected]
Rod Dring – Australia Phone: 61 2 8266 7865 Email: [email protected]
Estela Vieira – Brazil Phone: 55 1 3674 3802 Email: [email protected]
Christopher Dulny – Canada Phone: 1 416 869 2355 Email: [email protected]
Jianbin Gao – China Phone: 86 21 2323 3362 Email: [email protected]
Pierre Marty – France Phone: 33 1 5657 58 15 Email: [email protected]
Werner Ballhaus – Germany Phone: 49 211 981 5848 Email: [email protected]
Sandeep Ladda – India Phone: 91 22 6689 1444 Email: [email protected]
Masahiro Ozaki – Japan Phone: 81 3 5326 9090 Email: [email protected]
Masaru Koshida – Japan (IPO Solutions Leader) Phone: 81 90 9971 9116 Email: [email protected]
Hoonsoo Yoon – Korea Phone: 82 2 709 0201 Email: [email protected]
Ilja Linnemeijer – The Netherlands Phone: 31 88 792 4956 Email: [email protected]
Yury Pukha – Russia Phone: 7 495 223 5177 Email: [email protected]
Mark Jansen – Singapore Phone: 65 6236 7388 Email: mailto:[email protected]
Jass Sarai – UK Phone: 44 0 1895 52 2206 Email: [email protected]
Mark McCaffrey – US Phone: 1 408 817 4199 Email: mailto:[email protected]
Alan Jones – US (Deals partner) Phone: 1 415 498 7398 Email: [email protected]

About PwC’s technology institute The Technology Institute is PwC’s global research network that studies the business of technology and the technology of business with the purpose of creating thought leadership that offers both fact-based analysis and experience-based perspectives. Technology Institute insights and viewpoints originate from active collaboration between our professionals across the globe and their first-hand experiences working in and with the technology industry.
About PwC At PwC, our purpose is to build trust in society and solve important problems. We’re a network of firms in 157 countries with more than 223,000 people who are committed to delivering quality in assurance, advisory and tax services. Find out more and tell us what matters to you by visiting us at http://www.pwc.com/
This content is for general information purposes only and should not be used as a substitute for consultation with professional advisors.
© 2017 PwC. All rights reserved. PwC refers to the US member firm or one of its subsidiaries or affiliates, and may sometimes refer to the PwC network. Each member firm is a separate legal entity. Please see www.pwc.com/structure for further details.