IP Viewpoint - Income Partnerss... · · 2014-08-01Page | 4 IP VIEWPOINT JULY 2014 (“CNY”)...
24
IP VIEWPOINT JULY 2014 China’s Onshore and Offshore RMB Markets HEAD OFFICE Suite 3311-3313, Two International Finance Centre. 8 Finance Street Central Hong Kong T +852 2169 2100 BEIJING OFFICE Unit 910, 9/F Tower E1, The Towers Oriental Plaza 1 East Chang An Ave, Dong Cheng District Beijing 100738, China T +8610 8518 7388 INVESTMENT TEAM EMIL NGUY Group CIO JOB CAMPBELL Senior Portfolio Manager RAYMOND GUI Senior Portfolio Manager SUVIR MUKHI Senior Portfolio Manager JAMES HU Portfolio Manager RELATIONSHIP MANAGEMENT SHEN TAN [email protected] T +852 2169 2010 SARAH CALLAGHAN [email protected] T +852 2169 2112 AGNES FONG [email protected] T +852 2169 2179 YUAN WANG [email protected] T +852 2169 2181 EXECUTIVE SUMMARY The rapid pace of Renminbi* (“RMB”) internationalization in recent years is paving the way for RMB to become a global reserve currency, which has already, and will continue to trigger an ongoing substantial global asset allocation into China’s bond market. As the world’s third largest bond market which is increasingly open to global investors, the Chinese onshore bond market offers a unique value proposition with its diverse and higher yielding bonds. Chinese onshore bonds are particularly attractive with very low correlation relative to other Developed Markets (“DM”) mainly due to the fact that the Chinese interest rate cycle is at a different stage to the US and other DMs. China’s recent financial reform aimed at capital account liberalization has greatly improved access to the domestic capital markets; foreign investors now can invest in China’s onshore interbank bond market which is highly liquid. China offers attractive opportunity in both onshore and offshore bond markets - A diversified onshore RMB Investment Grade (“IG”) portfolio can achieve 5% - 6% yield in RMB, while an offshore RMB IG portfolio offers 3% - 5% yield in CNH*. Moreover, a well- diversified CNH High Yield (“HY”) portfolio can achieve 8% - 9% yield in CNH. Despite an increased two-way volatility introduced earlier this year, we believe RMB will continue to appreciate against the USD at a milder pace in coming years. With more market-based mechanism and continued stability in currency and economy, we believe the RMB will become a global reserve currency. It is not a matter of if, but when. * Renminbi, (“RMB”, meaning “People’s currency”) is the official name for China’s combined Onshore and Offshore currency. The main unit of the Onshore RMB is the Chinese Yuan (“CNY”), with foreign exchange rates set by China’s Central Bank, The Offshore RMB abbreviation is “CNH” (as in “H” for Hong Kong), which was the first offshore center to freely trade the fully convertible offshore RMB, since the 2010 introduction of international trade settlement in RMB, which marked the real start of the liberalization of China’s capital controls, and the vital internationalization of RMB, as it moves towards Reserve Currency status.
Transcript of IP Viewpoint - Income Partnerss... · · 2014-08-01Page | 4 IP VIEWPOINT JULY 2014 (“CNY”)...

IP VIEWPOINT JULY 2014
China’s Onshore and Offshore
RMB Markets
HEAD OFFICE
Suite 3311-3313, Two International Finance Centre. 8 Finance Street Central Hong Kong
T +852 2169 2100
BEIJING OFFICE
Unit 910, 9/F Tower E1, The Towers Oriental Plaza 1 East Chang An Ave, Dong Cheng District Beijing 100738, China
T +8610 8518 7388
INVESTMENT TEAM EMIL NGUY Group CIO
JOB CAMPBELL Senior Portfolio Manager
RAYMOND GUI Senior Portfolio Manager
SUVIR MUKHI Senior Portfolio Manager
JAMES HU Portfolio Manager
RELATIONSHIP MANAGEMENT SHEN TAN [email protected]
T +852 2169 2010
SARAH CALLAGHAN [email protected]
T +852 2169 2112
AGNES FONG [email protected]
T +852 2169 2179
YUAN WANG [email protected]
T +852 2169 2181
EXECUTIVE SUMMARY
The rapid pace of Renminbi* (“RMB”) internationalization in recent years is paving the way for RMB to become a global reserve currency, which has already, and will continue to trigger an ongoing substantial global asset allocation into China’s bond market.
As the world’s third largest bond market which is increasingly open to global investors, the Chinese onshore bond market offers a unique value proposition with its diverse and higher yielding bonds. Chinese onshore bonds are particularly attractive with very low correlation relative to other Developed Markets (“DM”) mainly due to the fact that the Chinese interest rate cycle is at a different stage to the US and other DMs.
China’s recent financial reform aimed at capital account liberalization has greatly improved access to the domestic capital markets; foreign investors now can invest in China’s onshore interbank bond market which is highly liquid.
China offers attractive opportunity in both onshore and offshore bond markets - A diversified onshore RMB Investment Grade (“IG”) portfolio can achieve 5% - 6% yield in RMB, while an offshore RMB IG portfolio offers 3% - 5% yield in CNH*. Moreover, a well-diversified CNH High Yield (“HY”) portfolio can achieve 8% - 9% yield in CNH.
Despite an increased two-way volatility introduced earlier this year, we believe RMB will continue to appreciate against the USD at a milder pace in coming years. With more market-based mechanism and continued stability in currency and economy, we believe the RMB will become a global reserve currency. It is not a matter of if, but when.
* Renminbi, (“RMB”, meaning “People’s currency”) is the official name for China’s combined Onshore and
Offshore currency. The main unit of the Onshore RMB is the Chinese Yuan (“CNY”), with foreign exchange rates
set by China’s Central Bank, The Offshore RMB abbreviation is “CNH” (as in “H” for Hong Kong), which was the
first offshore center to freely trade the fully convertible offshore RMB, since the 2010 introduction of
international trade settlement in RMB, which marked the real start of the liberalization of China’s capital
controls, and the vital internationalization of RMB, as it moves towards Reserve Currency status.

Page | 2
IP VIEWPOINT
JULY 2014
Contents
A. Internationalization of the RMB 3
B. China’s Onshore bond market - an emerging asset class of global significance 5
C. China’s Onshore Bond Market – Foreign Access 10
D. Why Invest in China Onshore Bond Market 12
E. China’s Offshore RMB (“CNH”) Bond Market 16
F. View on RMB Exchange Rate 21
In Summary 23

Page | 3
IP VIEWPOINT
JULY 2014
A. Internationalization of the RMB
China is now the second largest economy and the largest export nation in the world. Given its high growth potential, the importance of China in the global economy (China represents 12% of global GDP, and 12% of international trade) will only increase over the coming years. However, the role of RMB in either global trade settlement or investment has been far less represented compared with China’s economic size and dominance in global trade.
This under-representation has been a result of historical policy choices. Since China opened up its economy in the 1970s, China has adopted a rather cautious approach towards currency liberalization and has instead focused on fixed asset investment and exports as engines of growth. However, since 2006, there has been a notable shift in attitude towards RMB from the policy makers - the use of RMB as a transactional currency has since been established, and is rising with China’s increasing importance in global trade. Moreover, the use of the RMB as a global financing and investment currency also broke new grounds and is expected to rise substantially as China accelerates the opening of its capital account.
China has established a three-step approach to internationalize the RMB:
i) expanding the currency’s role in cross-border trade settlement
ii) developing the currency’s role in cross-border financing and investments
iii) promoting the RMB as a global reserve currency
1. RMB becomes a global trade currency
Significant progress has been made in RMB’s role in cross-border trade settlements. China has signed currency swap agreements with at least 20 central banks, including those in Japan, South Korea, Thailand, New Zealand, Argentina and Malaysia as well as the European Central Bank and the Bank of England. Towards the end of 2013, RMB overtook the EURO to become the second most commonly used currency in global trade finance after the USD. As of May 2014, RMB became the second most used currency for cross border payments between China and Hong Kong and the seventh most used global payment currency, according to Society for Worldwide Interbank Financial Telecommunication (“SWIFT”).
Figure 1 below shows the breakdown of RMB’s usage in each region’s trade payments with China and Hong Kong.
Figure 1: Regional Evolution of RMB Usage and Position in Payments with China and Hong Kong
Source: IMF
2. RMB becomes a global investment currency
To establish RMB as a global investment currency, China has created a fully open, offshore RMB (“CNH”) market, which is distinct and separate from the existing onshore RMB

Page | 4
IP VIEWPOINT
JULY 2014 (“CNY”) market. This effectively promotes internationalization more independently of the liberalization of domestic financial markets. Hong Kong was the first CNH center where RMB trading was officially sanctioned, with designated RMB clearing banks. Singapore, London, Taiwan, Seoul and Frankfurt soon joined as global CNH centers, with Paris and Luxembourg to follow. These new centers help to expand the existing CNH regime, because CNH is already freely transferrable and fungible. CNH deposits across all global centers have grown rapidly to exceed RMB 1tn. However, compared with the RMB 100tn of CNY deposits in domestic China, the CNH market has plenty of growth potential.
Using the RMB as an investment tool is increasingly common. The issuance of CNH bonds and wider access to China’s onshore capital markets through programs such as Qualified Foreign Institutional Investor (QFII) and Renminbi Qualified Foreign Institutional Investor (RQFII) programmes are signs that China’s authorities are committed to a further opening up of the capital account. The fast growing CNH deposits significantly improved market liquidity and supported the creation of the CNH or “Dim Sum” bond market in Hong Kong, which has grown over 10 times to nearly CNH 730bn as of July 2014.
The Shanghai Free Trade Zone (FTZ) is the latest key development towards gradual lifting of capital controls within parts of China. FTZ allows setting up of free trade accounts in CNY and foreign currency, with free transfer between these accounts. The accounts will also allow for cross-border financing, with RMB and foreign currency funds exchanged freely. The FTZ will be an important onshore test ground for a fully convertible RMB and capital account.
3. RMB on track to become a global reserve currency
The rapid pace of the CNH market development speaks to China’s commitment to make RMB a global reserve currency. This is being recognized by global reserve managers who are already preparing for diversification into RMB. Since 2010, Central Banks and Sovereign Wealth Funds across Asia (including Australia), South America and Africa have gradually increased their reserve allocation to RMB-denominated assets. Currently, US dollars, Euro, and Japanese Yen collectively represent over 90% of global foreign exchange reserves (See Figure 2). However, given China’s increasing economic influence and the pace of currency liberalization outlined above, RMB is expected to play a key role and become a major global reserve currency in the coming decade.
Figure 2: Currencies Held by Global Foreign Exchange Reserve
Source: IMF, 1Q14
Conclusion: As both RMB internationalization and financial reforms continue to accelerate, we think the expansion of the RMB’s role in global trade, investments and reserve management will likely trigger an ongoing global asset allocation to China’s bond markets.

Page | 5
IP VIEWPOINT
JULY 2014
0%
5%
10%
15%
20%
25%
30%
-
5,000
10,000
15,000
20,000
25,000
30,000
35,000Corporate Govt Support
Local Government Private Placement Note
CP and others Enterprise
MTN CGB
Financial Bonds
B. China’s Onshore bond market - An emerging asset class of global significance
Market Growth
It is widely known that China’s economy surpassed Japan’s in 2010, and is now ranked as the second largest in the world. However, it may surprise many investors that China’s domestic onshore bond market is now the world’s third largest, trailing only the US and Japan. As of July 2014, the total outstanding debt in China’s onshore bond market was RMB 32.6tn (USD 5.4tn) and has grown at an average rate of 14% for the past five years.
As of July 2014, 62% of outstanding bonds are rates products and the remaining 38% are credit products. Figure 3 below illustrates the rapid growth and increased sophistication of the Chinese onshore bond market since 1998.
Figure 3: Total Outstanding Bonds by Type (CNY bn)
Source: Wind, July 2014
Types of Bonds
China Government Bonds (CGBs), policy bank bonds (PFBs), and PBOC bills are classified as rates bonds in the onshore market. Together, they account for 62% of outstanding onshore bonds. Non-financial credits account for 25% of the market, and are issued under various programmes; they include enterprise bonds, Medium Term Notes (“MTNs”), commercial paper (CPs), short-term commercial paper (SCPs) and corporate bonds. The remaining 13% includes private placements, bonds issued by non-policy financial institutions, asset-backed securities, Panda bonds and other instruments. Figure 4 shows the outstanding amount of different types of onshore bonds as of July 2014.
Figure 4: Outstanding Bond Percentage by Type
Source: Wind, July 2014
Page | 6
IP VIEWPOINT
JULY 2014
3.0%
3.5%
4.0%
4.5%
5.0%
5.5%
6.0%
6.5%
1Y 3Y 5Y 7Y 10Y 15Y 20Y 30Y 50Y
CGBsPFBsCredit (AAA)
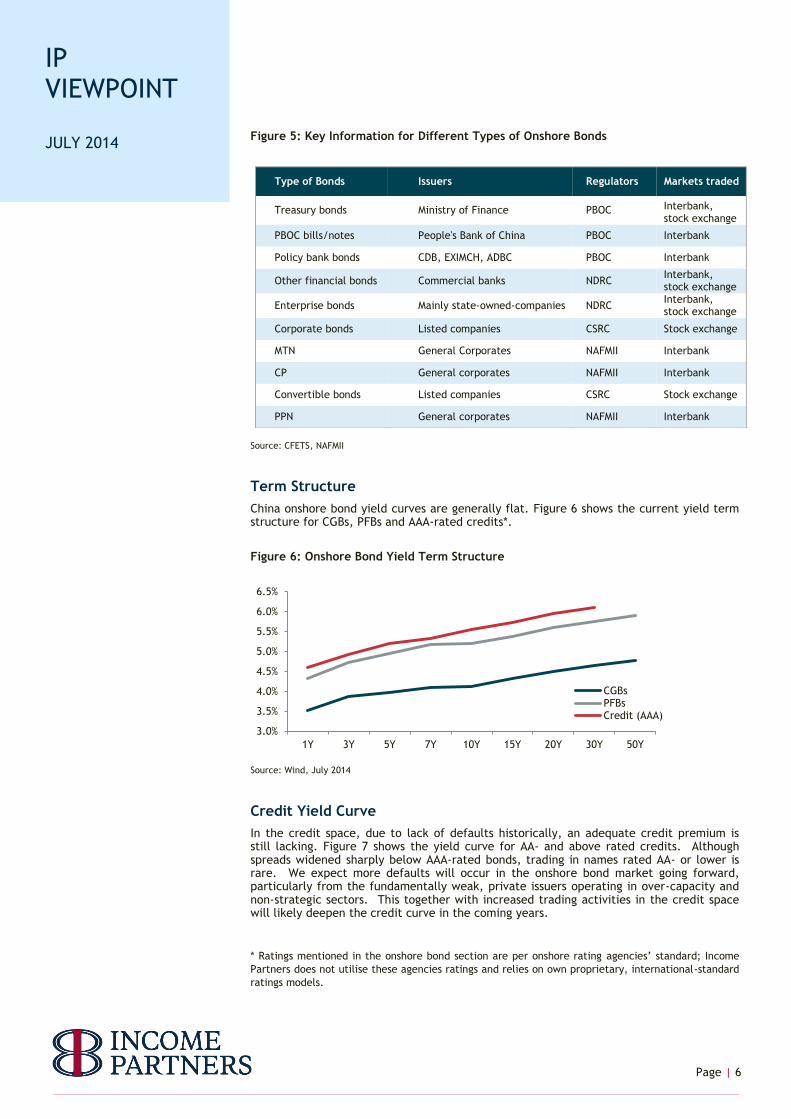
Figure 5: Key Information for Different Types of Onshore Bonds
Source: CFETS, NAFMII
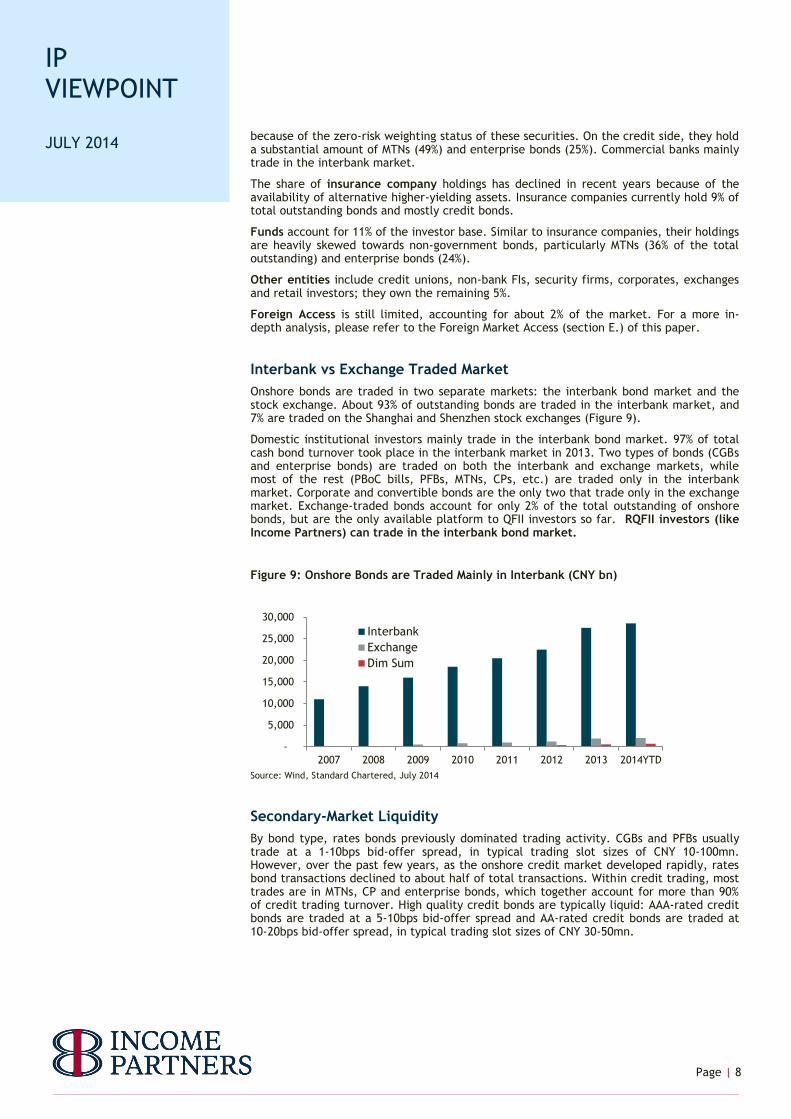
Term Structure
China onshore bond yield curves are generally flat. Figure 6 shows the current yield term structure for CGBs, PFBs and AAA-rated credits*.
Figure 6: Onshore Bond Yield Term Structure
Source: Wind, July 2014
Credit Yield Curve
In the credit space, due to lack of defaults historically, an adequate credit premium is still lacking. Figure 7 shows the yield curve for AA- and above rated credits. Although spreads widened sharply below AAA-rated bonds, trading in names rated AA- or lower is rare. We expect more defaults will occur in the onshore bond market going forward, particularly from the fundamentally weak, private issuers operating in over-capacity and non-strategic sectors. This together with increased trading activities in the credit space will likely deepen the credit curve in the coming years.
* Ratings mentioned in the onshore bond section are per onshore rating agencies’ standard; Income
Partners does not utilise these agencies ratings and relies on own proprietary, international-standard
ratings models.
Type of Bonds Issuers Regulators Markets traded
Treasury bonds Ministry of Finance PBOC Interbank, stock exchange
PBOC bills/notes People's Bank of China PBOC Interbank
Policy bank bonds CDB, EXIMCH, ADBC PBOC Interbank
Other financial bonds Commercial banks NDRC Interbank, stock exchange
Enterprise bonds Mainly state-owned-companies NDRC Interbank, stock exchange
Corporate bonds Listed companies CSRC Stock exchange
MTN General Corporates NAFMII Interbank
CP General corporates NAFMII Interbank
Convertible bonds Listed companies CSRC Stock exchange
PPN General corporates NAFMII Interbank

Page | 7
IP VIEWPOINT
JULY 2014
0%
10%
20%
30%
40%
50%
AAA AA+ AA AA- A+ A A- B+ NR
AAA+
AAA
AA+
AA
AA-
4.50%
5.00%
5.50%
6.00%
6.50%
7.00%
7.50%
8.00%
1Y 3Y 5Y 7Y 10Y 15Y 20Y 30Y
Figure 7: Onshore Credit Bond Yield Curve
Source: Wind, July 2014
Onshore Credit Ratings
China’s onshore credit market started in 1998 with the launch of the enterprise bond programme. Growth picked up after the National Association of Financial Market Institutional Investors (NAFMII) introduced CP and MTN programmes in 2005. Due to the lack of defaults historically, onshore credit ratings are heavily skewed towards the high side. There had been no defaults in China’s bond market until 1Q14, when Chaori Solar became the first onshore public bond issuer to default on a coupon payment. A number of troubled trust companies have also failed to repay committed interest. So far, the losses have been confined to interest payments, and no entity has defaulted on principal payments (although some issues have gone through lengthy restructuring processes).
There are 10 recognized rating agencies onshore. The most important three – China Chengxin International Credit Rating, China Lianhe Credit Rating and Dagong International Credit Rating - have had a combined market share of over 80% in recent years. Some of these agencies have close links to the three major international credit rating agencies - Chengxin is 49% owned by Moody’s; Lianhe is 49% owned by Fitch and Shanghai Brilliance has signed a co-operation agreement with S&P. Although their onshore credit analyses are conducted separately.
The China onshore market follows different rating categories compared to international markets. A key difference is the existence of the ‘super AAA’ or ‘AAA+’ category. 10 issuers are currently in this category: Ministry of Railways, PetroChina, CNOOC, Sinopec, China Telecom, China Unicom, China Mobile, State Grid, China Southern Power Grid, China Shenhua. They typically trade only a touch wider than PBFs, and are considered to have the strongest government support. Figure 8 below shows current onshore bond rating breakdown.
Figure 8: Onshore Credit Bond Rating (%)
Source: Wind, July 2014
Types of Investors
Commercial banks are the dominant investors in onshore bonds, holding 64% of total outstanding bonds of all types. By instrument, they hold 70% of CGBs and 82% of PFBs
Page | 8
IP VIEWPOINT
JULY 2014
-
5,000
10,000
15,000
20,000
25,000
30,000
2007 2008 2009 2010 2011 2012 2013 2014YTD
Interbank
Exchange
Dim Sum
because of the zero-risk weighting status of these securities. On the credit side, they hold a substantial amount of MTNs (49%) and enterprise bonds (25%). Commercial banks mainly trade in the interbank market.
The share of insurance company holdings has declined in recent years because of the availability of alternative higher-yielding assets. Insurance companies currently hold 9% of total outstanding bonds and mostly credit bonds.
Funds account for 11% of the investor base. Similar to insurance companies, their holdings are heavily skewed towards non-government bonds, particularly MTNs (36% of the total outstanding) and enterprise bonds (24%).
Other entities include credit unions, non-bank FIs, security firms, corporates, exchanges and retail investors; they own the remaining 5%.
Foreign Access is still limited, accounting for about 2% of the market. For a more in-depth analysis, please refer to the Foreign Market Access (section E.) of this paper.
Interbank vs Exchange Traded Market
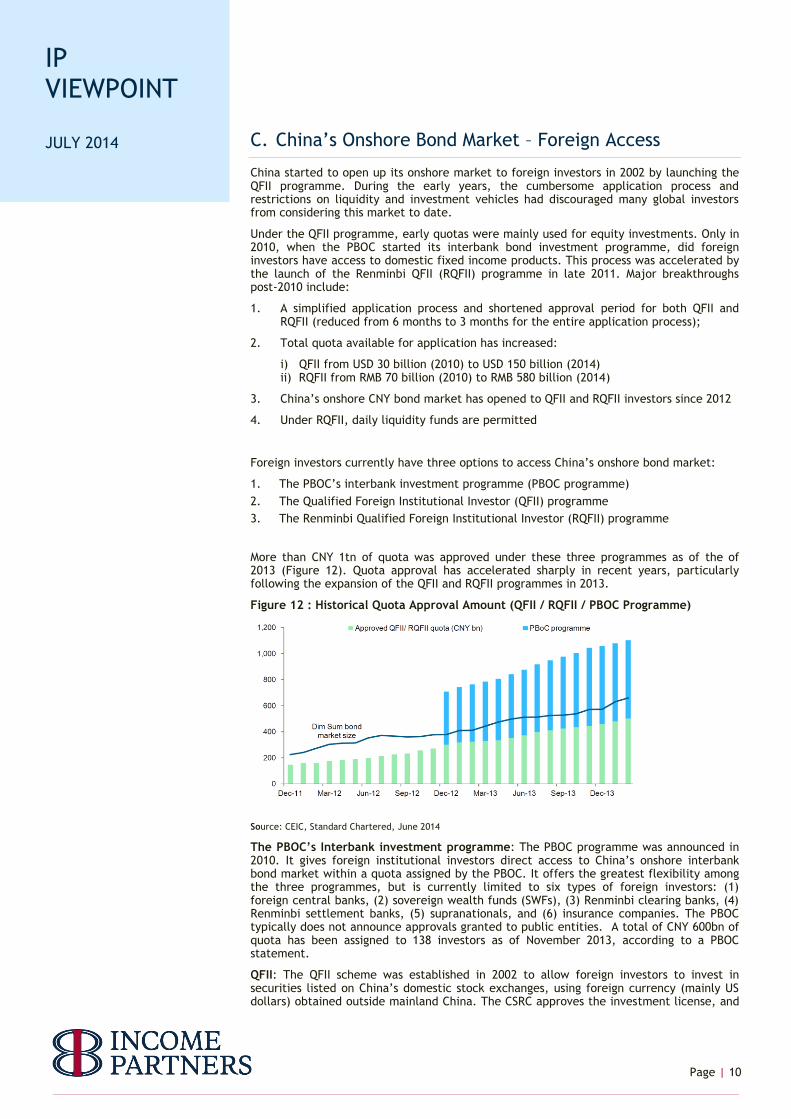
Onshore bonds are traded in two separate markets: the interbank bond market and the stock exchange. About 93% of outstanding bonds are traded in the interbank market, and 7% are traded on the Shanghai and Shenzhen stock exchanges (Figure 9).
Domestic institutional investors mainly trade in the interbank bond market. 97% of total cash bond turnover took place in the interbank market in 2013. Two types of bonds (CGBs and enterprise bonds) are traded on both the interbank and exchange markets, while most of the rest (PBoC bills, PFBs, MTNs, CPs, etc.) are traded only in the interbank market. Corporate and convertible bonds are the only two that trade only in the exchange market. Exchange-traded bonds account for only 2% of the total outstanding of onshore bonds, but are the only available platform to QFII investors so far. RQFII investors (like Income Partners) can trade in the interbank bond market.
Figure 9: Onshore Bonds are Traded Mainly in Interbank (CNY bn)
Source: Wind, Standard Chartered, July 2014
Secondary-Market Liquidity
By bond type, rates bonds previously dominated trading activity. CGBs and PFBs usually trade at a 1-10bps bid-offer spread, in typical trading slot sizes of CNY 10-100mn. However, over the past few years, as the onshore credit market developed rapidly, rates bond transactions declined to about half of total transactions. Within credit trading, most trades are in MTNs, CP and enterprise bonds, which together account for more than 90% of credit trading turnover. High quality credit bonds are typically liquid: AAA-rated credit bonds are traded at a 5-10bps bid-offer spread and AA-rated credit bonds are traded at 10-20bps bid-offer spread, in typical trading slot sizes of CNY 30-50mn.

Page | 9
IP VIEWPOINT
JULY 2014 Figure 10 : Onshore Bond Trading Turnover Breakdown (%)
Source: Wind, Standard Chartered, July 2014
Figure 11 : Onshore Credit Trading Turnover Breakdown (%)
Source: Wind, Standard Chartered, July 2014
Tax
China has yet to introduce a complete tax system for foreign investors. It is generally guided that either 10% or a lower treaty rate (in accordance with double-tax treaties between China and individual countries) be applied for non-government bonds. This withholding tax is imposed on coupons. The capital gains tax has not been collected so far. QFII/RQFII investors have historically made a provision of 10% on capital gains (by their custodian banks).
Derivatives
While the onshore derivatives market is still a new and developing market, it is becoming increasingly sophisticated. Currently derivatives in the onshore rates market include Interest rate swaps (“IRS”), bond forwards (offered in interbank trading), bond lending (interbank) and bond futures (exchange). IRS is the most active instrument while others are also being advocated by regulators. The recent development in centralizing IRS trading settlements and clearance by the Shanghai Clearing House has paved the way for a more regulated onshore bond derivatives market.
Onshore IRS is currently not accessible by foreign investors, but they can invest via non-deliverable IRS (NDIRS) traded in the offshore market and denominated in USD. As NDIRS are benchmarked against the same onshore floating rates, they are priced similarly to onshore-deliverable IRS products. The most commonly traded product is the 7-day repo-based NDIRS.
Page | 10
IP VIEWPOINT
JULY 2014 C. China’s Onshore Bond Market – Foreign Access
China started to open up its onshore market to foreign investors in 2002 by launching the QFII programme. During the early years, the cumbersome application process and restrictions on liquidity and investment vehicles had discouraged many global investors from considering this market to date.
Under the QFII programme, early quotas were mainly used for equity investments. Only in 2010, when the PBOC started its interbank bond investment programme, did foreign investors have access to domestic fixed income products. This process was accelerated by the launch of the Renminbi QFII (RQFII) programme in late 2011. Major breakthroughs post-2010 include:
1. A simplified application process and shortened approval period for both QFII and RQFII (reduced from 6 months to 3 months for the entire application process);
2. Total quota available for application has increased:
i) QFII from USD 30 billion (2010) to USD 150 billion (2014) ii) RQFII from RMB 70 billion (2010) to RMB 580 billion (2014)
3. China’s onshore CNY bond market has opened to QFII and RQFII investors since 2012
4. Under RQFII, daily liquidity funds are permitted
Foreign investors currently have three options to access China’s onshore bond market:
1. The PBOC’s interbank investment programme (PBOC programme)
2. The Qualified Foreign Institutional Investor (QFII) programme
3. The Renminbi Qualified Foreign Institutional Investor (RQFII) programme
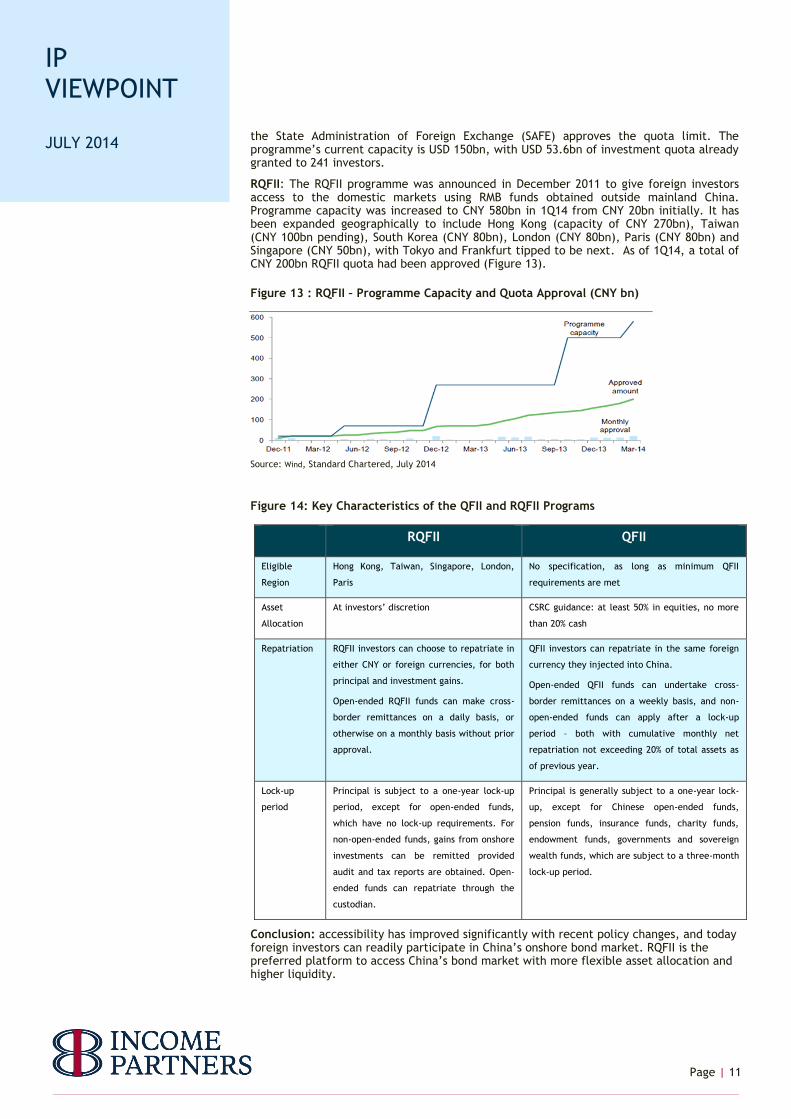
More than CNY 1tn of quota was approved under these three programmes as of the of 2013 (Figure 12). Quota approval has accelerated sharply in recent years, particularly following the expansion of the QFII and RQFII programmes in 2013.
Figure 12 : Historical Quota Approval Amount (QFII / RQFII / PBOC Programme)
Source: CEIC, Standard Chartered, June 2014
The PBOC’s Interbank investment programme: The PBOC programme was announced in 2010. It gives foreign institutional investors direct access to China’s onshore interbank bond market within a quota assigned by the PBOC. It offers the greatest flexibility among the three programmes, but is currently limited to six types of foreign investors: (1) foreign central banks, (2) sovereign wealth funds (SWFs), (3) Renminbi clearing banks, (4) Renminbi settlement banks, (5) supranationals, and (6) insurance companies. The PBOC typically does not announce approvals granted to public entities. A total of CNY 600bn of quota has been assigned to 138 investors as of November 2013, according to a PBOC statement.
QFII: The QFII scheme was established in 2002 to allow foreign investors to invest in securities listed on China’s domestic stock exchanges, using foreign currency (mainly US dollars) obtained outside mainland China. The CSRC approves the investment license, and
Page | 11
IP VIEWPOINT
JULY 2014 the State Administration of Foreign Exchange (SAFE) approves the quota limit. The programme’s current capacity is USD 150bn, with USD 53.6bn of investment quota already granted to 241 investors.
RQFII: The RQFII programme was announced in December 2011 to give foreign investors access to the domestic markets using RMB funds obtained outside mainland China. Programme capacity was increased to CNY 580bn in 1Q14 from CNY 20bn initially. It has been expanded geographically to include Hong Kong (capacity of CNY 270bn), Taiwan (CNY 100bn pending), South Korea (CNY 80bn), London (CNY 80bn), Paris (CNY 80bn) and Singapore (CNY 50bn), with Tokyo and Frankfurt tipped to be next. As of 1Q14, a total of CNY 200bn RQFII quota had been approved (Figure 13).
Figure 13 : RQFII – Programme Capacity and Quota Approval (CNY bn)
Source: Wind, Standard Chartered, July 2014
Figure 14: Key Characteristics of the QFII and RQFII Programs
Conclusion: accessibility has improved significantly with recent policy changes, and today foreign investors can readily participate in China’s onshore bond market. RQFII is the preferred platform to access China’s bond market with more flexible asset allocation and higher liquidity.
RQFII QFII
Eligible
Region
Hong Kong, Taiwan, Singapore, London,
Paris
No specification, as long as minimum QFII
requirements are met
Asset
Allocation
At investors’ discretion CSRC guidance: at least 50% in equities, no more
than 20% cash
Repatriation RQFII investors can choose to repatriate in
either CNY or foreign currencies, for both
principal and investment gains.
Open-ended RQFII funds can make cross-
border remittances on a daily basis, or
otherwise on a monthly basis without prior
approval.
QFII investors can repatriate in the same foreign
currency they injected into China.
Open-ended QFII funds can undertake cross-
border remittances on a weekly basis, and non-
open-ended funds can apply after a lock-up
period – both with cumulative monthly net
repatriation not exceeding 20% of total assets as
of previous year.
Lock-up
period
Principal is subject to a one-year lock-up
period, except for open-ended funds,
which have no lock-up requirements. For
non-open-ended funds, gains from onshore
investments can be remitted provided
audit and tax reports are obtained. Open-
ended funds can repatriate through the
custodian.
Principal is generally subject to a one-year lock-
up, except for Chinese open-ended funds,
pension funds, insurance funds, charity funds,
endowment funds, governments and sovereign
wealth funds, which are subject to a three-month
lock-up period.

Page | 12
IP VIEWPOINT
JULY 2014
0%
1%
2%
3%
4%
1Y 2Y 5Y 7Y 10Y
China USA
Germany Japan
0%
1%
1%
2%
2%
3%
0%
1%
2%
3%
4%
5%
6%
2007 2008 2009 2010 2011 2012 2013 2014
China US
Germany Japan (RHS)
D. Why Invest in China Onshore Bond Market
1. Global structural asset allocation
Due to historical limited foreign access and closed capital account, China onshore bonds so far account for less than 1.0% of global fixed income investors’ allocation.
In anticipation of RMB becoming a global reserve currency, we firmly believe global investors will soon consider China’s bond market as an inevitable addition to their portfolios driven by structural global asset allocation.
Recently we saw signs of a global structural asset allocation shift into China taking place. Central Banks around the globe have already or plan to invest in RMB assets in their reserve management. This shift is facilitated by China’s ongoing policies to relax their capital controls to encourage foreign investors to invest in their domestic capital markets.
2. Higher yielding, uncorrelated asset class in today’s low rate environment
China’s onshore government bond market offers an attractive yield pick-up over developed countries, particularly in today’s low interest rate environment (Figure 15).
Figure 15 : Government Bond Yield Comparison
Source: Bloomberg, June 2014
Unlike other emerging markets, China’s onshore government bond’s attractive yield has been further enhanced by the gradual appreciation and low volatility of RMB since 2005. We believe the gradual appreciation trend is still intact but expect to experience higher volatility which is inevitable in the RMB internationalization process.
In addition, unlike the downward trend in bond yields in DM over the past two decades, China government bond yield has fluctuated in a narrow range of around 200bps given its stable interest rate cycle (Figure 16). We believe this stability will continue in the coming years supported by China’s high economic growth and controlled inflation.
Figure 16 : 10 Year Government Bond Yield
Source: Bloomberg, June 2014

Page | 13
IP VIEWPOINT
JULY 2014 Due to the different interest rate cycles, historical correlation between China’s government bond yields and developed countries’ government bond yields has been very low, which is an added attractive diversification benefit for global investors
Figure 17 : 10Y Government Bond Correlation Matrix (2009 - 2013)
Source: IP, Bloomberg
3. China’s sovereign rating is AA-, and remains on an upgrade trend Over the past decade, while the sovereign ratings of most developed countries have been or are being downgraded, China’s sovereign rating has been upgraded to AA- from BBB (by international ratings agencies), on the back of its higher economic growth, significant foreign reserves and improving fundamentals. We expect China remains on track for future potential upgrades.
Figure 18 : Sovereign Rating Change Since 2000
Source: IP, Bloomberg; June 2014
4. Unfolding opportunities in the credit sector
China’s domestic bond market has developed under the strict control of the central government, consequently, Sovereign and Quasi-Sovereign bonds represent 62% of China’s onshore bond market, with corporate issues accounting for the remaining 38%.
For various reasons, the development of China’s domestic bond market has largely lagged behind that of China’s domestic equity market. However, the Chinese government has realized the importance of having a well-developed and structured corporate bond market for optimal resource allocation, particularly after RMB 4 trillion of largely poor quality bank loans issued since 2009 in response to the global financial crisis.
Going forward, the government will encourage corporates to raise funds through the bond and equity markets, rather than the loan market. In particular, the Chinese regulator has highlighted the following objectives in the current onshore bond market 5-year plan:
1. Enhance the support of financial markets for the real economy
2. Increase the percentage of direct financing in the overall financing plan;
3. Further develop the bond market, particularly the corporate bond sector.
Historically, stated 5-Year Plan objectives have always been achieved. With the current plan, we expect China’s onshore corporate bond market will continue to develop and grow. Increased corporate issuance from the private sector will potentially create interesting opportunities going forward.
10yr - CGB 10yr - UST 10yr - Bund 10yr - JGB
10yr - CGB
0.10 -0.09 -0.28
10yr - UST 0.10
0.91 0.80
10yr - Bund -0.09 0.91
0.93
10yr - JGB -0.28 0.80 0.93

Page | 14
IP VIEWPOINT
JULY 2014 5. Moving from a centrally planned to a market-oriented bond market
Most onshore bond issues historically went through a stringent approval process with Chinese regulators and backed by the states, as a result, regulators have effectively conducted first-level credit selection. However, in recent years, regulators have publicly announced plans to develop a more efficient and market-oriented bond market, where fundamental credit analysis will play an increasingly important role as corporate issuance accelerates.
Furthermore, the new Reform scheme, reinforced after the Third Plenary Session in November 2013, allowed the market to play a “decisive role” in resource allocation. Policy makers will pace the implementation of concrete measures in key areas including fiscal, financial, land, migrant labour and household (“Hukou”) registration system, State-Owned-Enterprises (“SOEs”) and demographics. The scheme also focuses on liberalization of interest rates, the exchange rate and the capital account. Measures were outlined to allow private capital to establish banks and financial institutions as well as exit strategies for failed financial entities. This is a major breakthrough to enable China to have mixed-ownership banks, and to address the funding inefficiencies currently encountered in the private sector.
6. Important investor considerations: liquidity, credit value and rating
1. Reasonable liquidity, but only for knowledgeable investors
Currently there are 25 market makers in the interbank market regulated by PBOC, who are required to maintain bid and offer quotes for benchmark CGBs, PFBs and selected high quality credit bonds. As a result, liquidity for the above mentioned bonds are generally good in the interbank market. However, as investors go down the credit risk spectrum, fundamental analysis and “on the ground” knowledge would be desired.
2. Credit premium is still lacking for HY credits
Because of the highly concentrated buy-and-hold investor base and lack of historical defaults, local investors trade on names rather than on fundamentals (the state controlled market has fuelled this trend). As a result, HY credit spreads are often not wide enough to compensate for the underlying credit risk. That said, select opportunities do exist but require rigorous analysis.
3. Most bonds are not rated by international ratings agencies
The majority of onshore bonds are rated by three local Chinese rating agencies that use a different rating system from international ratings agencies. In addition, the onshore bonds have a relatively short credit history (almost no defaults) and have not been tested by any major domestic crisis.
As a result, foreign investors assessing China’s onshore bond market are urged to consider the following:
- Understand the trading behavior of the incumbent investors; develop local expertise in managing liquidity and execution;
- Perform rigorous credit analysis and due diligence to understand credit risks, implied ratings, and appropriate pricing.

Page | 15
IP VIEWPOINT
JULY 2014 Figure 19 : China’s Onshore Bond Market and Other Developed Bond Markets
7. Onshore investment opportunity: A diversified, high credit quality portfolio
To reiterate, most onshore high yield credits are mispriced given insufficient default history and inactive investor base. Therefore, we recommend an investment portfolio with high credit quality (implied IG rating per International Rating standard) with relatively short duration.
Based on our analysis, a well-diversified (30 to 40 credit names), implied BBB-rated (per Moodys/S&P/Fitch methodology), short duration (~3 years) China onshore bond portfolio can offer an average yield of 5 – 6% in RMB.
Figure 20 shows the credit exposures for a model portfolio adopting the above-mentioned strategy:
Figure 20 : Onshore Portfolio Exposures
Source: Income Partners, June 2014
China’s onshore bond market
Developed bond market (USD, EUR)
Implications
Investor Base Over 60% are buy-and-hold Chinese commercial banks
Very diversified Understanding Chinese banks’ behavior is important to grasp the onshore interest rate cycle
Brokers and Dealers
Only 2-3 active brokers, most trades are matched by institutional investors directly
OTC trading is very efficient via dealers and brokers
Local relationships with other institutional investors especially Chinese banks is important for best execution
Liquidity Benchmark trading lots will be RMB 50 million for most bonds, only high credit quality (AAA/AA rated per local standard) bonds are liquid
Good liquidity during non-stressed periods
Due to highly concentrated buy-and-hold investor base and under development dealer’s market, local relationships with other institutional investors and deep knowledge on local market are key for liquidity management
Credit Pricing Local investors trade on names rather than on credit fundamentals; high yield spreads are not wide enough to compensate for the underlying credit risk
Efficient, as credit risk is reflected by credit spread
Investment grade bonds offer greater value, as high yield bonds are facing re-pricing risk; detailed credit analysis is critical to determine appropriate credit pricing
Credit Rating Most issues/issuers are only rated by local Chinese rating agencies that use a different rating system from Moody’s/S&P/Fitch, with no tested default history
Most issues/issuers are rated by Moody’s/S&P/Fitch at an internationally accepted standard
Diligently maintaining an international standard of credit analysis is critical to understand the underlying credit risk and implied credit rating
Private 9.5%
SOE 73.9%
Quasi-soverei
gn 16.4%
Exposure by Issuer Type
Indus- trial
14.9%
Oil&Gas 9.3% Utilities
22.4%
Pharmaceutical 3.2%
Real Estate 6.4%
TMT 8.3%
Consumer 6.3% Diversifi
ed 3.1%
Transportation 9.4%
Financial 16.4%
Exposure by Industry

Page | 16
IP VIEWPOINT
JULY 2014
0
100
200
300
400
500
600
Jul-10 Jan-11 Jul-11 Jan-12 Jul-12 Jan-13 Jul-13 Jan-14
E. China’s Offshore RMB (“CNH”) Bond Market
1. Genesis of the CNH market
With China’s growing importance in global economy and international trade, China has a strong motivation to internationalize the RMB to reduce foreign currency risks faced by domestic companies and to promote further economic growth. More importantly, it is in China’s best interest to develop the RMB as a major reserve currency.
As a result, in 2010 China initiated the offshore RMB (“CNH”) market, which is fully transferable and fungible, and is distinct and separate from the existing onshore RMB (“CNY”) market. The current CNH market is comparable to the early days of the Eurodollar market initiated in London in the 1970s and has potential to grow in size considering the scale of China’s economy. Furthermore, the RMB internationalization process is driven by global trade flow and reflects the real demand for the currency.
2. Early years of the CNH market
In July 2010, China selected Hong Kong as the first offshore clearing centre for RMB, with two governing policies:
i) allow Mainland Chinese companies to participate in RMB cross-border trade settlement with any foreign trade partner in Hong Kong, and
ii) allow RMB business accounts to be freely opened in Hong Kong, with no upper limit on the amounts to buy/sell RMB in Hong Kong.
With these two breakthrough policies, RMB became fully convertible and deliverable in Hong Kong. Subsequently, CNH deposits started to accumulate in Hong Kong supplied by cross-border trade settlement.
The deposit built-up demanded and led a rapid development of CNH investment products (RMB-denominated bonds, REITs and equities, CNH Spot and Forwards, CNH cross-currency swaps, and CNH HIBOR) in Hong Kong and later on in other CNH centres.
3. Rapid growth of the CNH market
With an increasing number of investors favouring RMB given its historical stability and appreciation potential, cross-border trade settlements grew rapidly and has become major CNH source.
Since 2010, CNH deposits in Hong Kong grew from RMB 90 billion to RMB 956bn (USD 160bn equivalent) and currently represent over 12% of Hong Kong’s entire deposit base (Figure 21). Hong Kong has been and still is the largest CNH centre, but new global CNH centres have emerged over the last two years and continue to grow and improve the global liquidity of the CNH market. CNH is fully fungible between different centres and there is no control over RMB flows between Hong Kong and other offshore RMB centres.
Figure 21 : Hong Kong RMB Cross-Border Trade Settlement (CNH billion)
Source: Bloomberg; June 2014
As of today, Singapore, Sydney, London, Taiwan, Korea, Paris and Frankfurt joined Hong Kong as global CNH centres and total CNH deposits globally well exceeded CNH 1tn (USD

Page | 17
IP VIEWPOINT
JULY 2014
0
100
200
300
400
500
600
700
800
2007 2008 2009 2010 2011 2012 2013 2014
Gross issuance (optimistic)
Gross issuance (base)
Amount issued
Outstanding (base)
Outstanding (optimistic)
CNH (Bn)
170bn) (Figure 22). Market participants believe that each of these centers offer irreplaceable advantages and can be “cooperative and supplementary rather than competitive” to expand the CNH schemes.
Figure 22 : A rapid Build-Up of RMB Liquidity Pool in Major Offshore RMB Hubs
Source: Bloomberg, HSBC, May 2014
The rapid growth of CNH deposits in Hong Kong has been a key driver for CNH bond issuance. Since 2010, the CNH market has grown to CNH 700bn (USD 115bn) in size, out of which CNH 400bn (USD 65bn) in CNH bonds and CNH 300bn (USD 50bn) in CNH CDs (Figure 23).
Figure 23 : CNH Bond Market Growth
Source: Income Partners, HSBC estimates
Despite the impressive growth, the CNH market is still markedly smaller compared to the more established Asian USD bond market, which is over USD 600bn in size. The CNH market currently has around 300 issuers while the USD market has over 800 issuers. Given the growth momentum and increased international appeal, we expect the CNH market to achieve significant market size, sufficient market depth, diversification and sophistication.
4. International standards attract international issuers
Since inception, the CNH bond market has been developed in line with international market standards thanks to Hong Kong’s integrated, sophisticated and free financial markets. The CNH bond market operates within the same market convention and standards compared with the offshore USD bond market, in terms of issuance, trading, liquidity and settlement.
There are over 10 active market makers in CNH bonds in Hong Kong, and the investor base is highly diversified, including local banks, insurance companies, global asset managers with an Asian focus, regional private banks and the like. The typical Bid/Ask spread for investment grade CNH bonds is 5-10bps, which is similar to the Asian USD bond market. All CNH bonds are settled through CMU, a settlement system promoted and regulated by the Hong Kong Monetary Authority (HKMA), and with a linkage to Euroclear.
As a result, it attracts multinational companies (MNCs) to issue CNH bonds to fund their business operation in China and also to match their assets and liabilities in RMB. This

Page | 18
IP VIEWPOINT
JULY 2014 funding popularity has been well supported by major global and regional market players, such as Caterpillar, who has been a frequent issuer (3 issues over 3 years). Increasingly, more MNCs and global/regional sovereigns have started to tap the CNH bond market as a popular and attractive funding currency. Most CNH bonds from MNCs are issued under their EMTN programs with standardized documentation.
Examples of “household-name” international issuers who have raised funds in offshore RMB market are shown below:
Source: IP, Bloomberg
5. Attractive relative value over USD/EUR denominated bonds
Most CNH bonds are trading at a yield premium over the same issuer’s USD or EUR denominated bonds on a currency hedged basis. This creates free arbitrage opportunities; if an investor purchases the CNH bond, hedges the CNH currency risk with USDCNH forwards, the investor can receive a yield pick-up for no additional risk. The table below shows a range of yield premiums implied by recent CNH issuance:
Issuers Yield in CNH
Coupon Rate
Maturity
Date
CNH Yield Premium range in 1H14 (bps)
Country Industry
ICICI 3.65% 4.00% 06/25/16 20-110 India Financial
Caterpillar 2.55% 3.25% 06/26/15 30-110 USA Industrial
BP 3.25% 3.65% 02/28/19 30-70 UK Oil & Gas
Volkswagen 3.15% 3.50% 01/23/19 20-50 Germany Industrial
Air Liquide 3.35% 3.95% 09/19/18 65-100 France Industrial
Renault 3.50% 4.65% 04/11/16 60-180 France Industrial
Source: IP, Bloomberg, July 2014
Issue Date Issuer Coupon Maturity Size (CNH mn)
Country
2010/09/16 McDonald's 3.00% 2013/09/16 200 USA
2010/10/21 Asian Development Bank 2.85% 2020/10/21 1,200 Supranational
2010/12/01 Caterpillar Financial Services Corp 2.00% 2012/12/01 1,000 USA 2011/01/18 Sinochem 1.80% 2014/01/18 3,500 China
2011/01/27 IFC 1.80% 2016/01/27 150 Supranational
2011/03/31 Unilever 1.15% 2014/03/31 300 UK 2011/05/23 Volkswagen 2.15% 2016/05/23 1,500 Germany 2011/06/27 Fonterra 1.10% 2014/06/27 300 New Zealand 2011/09/01 Tesco 1.75% 2014/09/01 725 UK 2011/09/19 Air Liquide Finance 3.00% 2016/09/19 1,750 France 2011/09/29 YUM! Brands Inc 2.38% 2014/09/29 350 USA 2011/10/26 CNPC 2.55% 2013/10/26 2,500 China 2012/02/16 Lanxess Finance BV 3.95% 2015/02/16 500 France 2012/03/26 Ford Motor Credit Co LLC 4.88% 2015/03/26 1,000 USA 2012/03/01 Baosteel Group Corporation 4.15% 2017/03/01 1,500 China 2012/03/16 Caterpillar Financial Services Corp 2.90% 2014/03/16 1,260 USA 2012/03/22 Hitachi Capital Corp 3.75% 2015/03/22 500 Japan 2012/07/24 BSH Bosch und Siemans HA 3.80% 2017/07/24 800 Germany 2012/09/18 Axiata 3.75% 2014/09/18 1,000 Malaysia 2012/09/21 ICICI 4.90% 2015/09/21 500 India 2012/10/30 VTB 4.50% 2015/10/30 1,000 Russia 2012/11/22 Volvo 3.80% 2015/11/22 1,000 Swiden 2012/11/26 Caterpillar Financial Services Corp 3.35% 2014/11/26 1,000 USA 2013/01/30 Noble 4.00% 2016/01/30 1,000 Hong Kong 2013/02/08 America Movil SAB de CV 3.50% 2015/02/08 1,000 Mexico 2013/02/09 Lotte Shopping Co Ltd 4.00% 2015/02/09 750 South Korea 2013/02/16 Lanxess Finance BV 3.95% 2015/02/16 500 France 2013/03/26 Ford Motor Credit Co LLC 4.88% 2015/03/26 1,000 USA 2013/03/16 Caterpillar Financial Services Corp 2.90% 2014/03/16 1,260 USA 2013/03/22 Hitachi Capital Corp 3.75% 2015/03/22 500 Japan 2013/04/11 RENAULT S.A. 4.65% 2016/04/11 750 France 2013/05/15 I.T LTD 6.25% 2018/05/15 1,000 Hong Kong 2013/07/12 Swire Pacific 3.90% 2023/09/09 300 Hong Kong 2013/10/08 BP Capital Markets Plc 3.95% 2018/10/08 1,200 UK

Page | 19
IP VIEWPOINT
JULY 2014
China 74%
Hong Kong 13%
Cash & others
4% Sweden
3% Singa-
pore 3% Germany
2%
Russia 2%
Industrial 25%
Utilities 19%
Banking & Finance
11%
Transporta- tion 9%
Automobile 5%
Technology 5%
Telecom 4%
Insurance 4%
Cash & others 4%
Resources 4% Chemical
3% Real Estate
3%
Consumer, Non-
Cyclical 2%
Sovereign 0%
6. Offshore & onshore interest rate convergence
With increasing cross-border flows, CNH interest rates have converged to onshore rates. Since 2012, 1y CNH Certificate of Deposit (“CD”) rate issued by large Chinese banks remained largely within a range of 2.7% – 3.3%, compared to the onshore 1y CNY deposit rate which has been fixed at 3.0%. This compares a 200bps premium in 2010.
As the CNH interest rates continue to evolve and converge to onshore levels, investors will seek further duration risk. As a result, we expect the current predominantly short-term (3y) issuance to extend to longer-dated (5-10y) maturities, providing investors with further opportunity to enhance yield along a maturing yield curve. With a more liberalized onshore interest rate scheme and elongated yield curve offshore, the CNH bond market will develop further market depth and create more investment opportunities.
Figure 24 : Overview of China’s Onshore and Offshore RMB Bond Markets
7. CNH market investment opportunity
a) Investment Grade Strategy - a short duration, geographically diversified, investment grade CNH bond portfolio
We recommend a diversified, BBB rated pure CNH IG portfolio (30 – 50 names) with very short duration (2y) and a yield of 4% with the following credit exposures:
Figure 25 : Offshore Investment Grade Portfolio Exposures
Source: Income Partners, June 2014
Onshore RMB (“CNY”) Bond Market
Offshore RMB ("CNH") Bond Market
Market Cap USD 5.4 trillion USD 104 billion
Issuers Over 3,000 names Over 300 names
Credit Quality Mostly local rated “AAA” IG 70% / HY 30%
Issuer Profile CGBs, Policy Banks, Corporates Asian Banks, MNCs, Chinese SOEs, Property (HY)
Maturity Typically, 1 - 10 years Typically, 1 - 3 years
Average IG Yield
5 - 6% 3 - 4 %
Liquidity liquid for CBGs, PFBs and selected SOE credits, better liquidity for Interbank Market
B/O: IG names: 5-10bps HY names: 20-40bps
Investor Base Commercial Banks (~60%) are the typical buy-and-hold investors; Foreign participation is less than 2%
Asian local banks, Global Asset Managers, Private Banks
Credit Rating
Unrated by international ratings agencies; Local Ratings are biased - requires independent research expertise
IG predominant, mostly A rated credits
Geographic Exposure
Industry Exposure

Page | 20
IP VIEWPOINT
JULY 2014
0.00%
1.00%
2.00%
3.00%
4.00%
5.00%
6.00%
7.00%
Oct-11 Apr-12 Oct-12 Apr-13 Oct-13 Apr-14
CNH 1m fwd carry (annualized) CNH 12m fwd carry
China 55%
Hong Kong 16%
Indone- sia 7%
Philip- pines 5%
Cash & Others
4% India 3% Singa-
pore 3% Taiwan
2%
France 1%
Australia 1%
Russia 0%
Real Estate 37%
Industrial 11%
Banking & Finance
9% Utilities
7% Techno- logy 5%
Resources 5%
Cash & Others 5% Automo- bile 3%
Retail 3% Telecom
3%
Consumer, Non-
Cyclical 3%
Conglomerate 3%
Consumer, Cyclical
2%
Quasi-Sov 2%
Machinery 2%
Transport 1%
b) High Yield Strategy - a short duration, well diversified HY portfolio consisting of both USD-denominated Asian bonds swapped into CNH and CNH-denominated bonds, with a yield of 8% - 9% in CNH
Due to the youth of the CNH bond market, it is still predominantly an Investment-Grade market. The CNH high yield (HY) market is in its early stages of development, with limited capacity (around CNH 88bn, USD 15bn equivalent i.e. accounts for only 12% of the entire CNH market), market depth (only around 100 issuers) and an insufficient credit premium. Investors need to be mindful of the credit quality and deal structures. However, a diversified and scalable CNH HY portfolio can be constructed with select CNH HY bonds and USD-denominated Asian HY bonds swapped into CNH. This strategy has been proven successful.
Currently the USD Asian HY bond market has a market value of USD135bn, with over 300 issuers. This greatly diversifies and deepens the investment universe for a CNH HY strategy. More importantly, by swapping the USD exposure to CNH via USDCNH forwards, which are highly liquid, the strategy can lock in additional risk-free return as the forwards have been consistently trading with a positive carry. At current market levels, the currency overlay can achieve a 2.8% annual return for the RMB swap ‘overlay’. Figure 26 shows the historical carry for USDCNH forwards.
Figure 26 : Positive Carry of the USDCNH Forward
Source: Bloomberg, July 2014
Currently, a diversified, BB rated, 3-year duration, mixed portfolio consisting both CNH and USD HY bonds swapped back to CNH with USDCNH forwards (60 – 80 names) can yield as high as 9% in CNH (including risk-free carry in the CNH forwards), with the following credit exposures:
Figure 27 : Offshore High Yield Portfolio Exposures
S
S
Source: Income Partners, June 30 2014
Geographic Exposure
Industry Exposure

Page | 21
IP VIEWPOINT
JULY 2014
6.00
6.10
6.20
6.30
6.40
6.50
6.60
Jan-11 Jul-11 Jan-12 Jul-12 Jan-13 Jul-13 Jan-14 Jul-14
USDCNH USDCNY
6.00
6.05
6.10
6.15
6.20
6.25
6.30
Jan-14 Feb-14 Mar-14 Apr-14 May-14 Jun-14 Jul-14
USDCNH Spot
USDCNY Spot
USDCNY Fixing
Upper Band
Lower Band
In conclusion, we believe the following strategies provide the best risk-adjusted return in China’s onshore and offshore bond markets:
1. Onshore IG: An investment grade portfolio consisting short duration (3 years), mostly SOE bonds offers around 5 -6% yield in RMB
2. Offshore IG: A short duration (2 years), “BBB+” rated credit quality, diversified CNH IG bond portfolio yielding around 4% in CNH
3. Offshore HY: A short duration (3 years), “BB” rated, highly diversified portfolio consisting of a combination of USD-denominated Asian bonds swapped into RMB plus CNH-denominated offshore issues, with an attractive risk-adjusted yield of 8% to 9% in CNH
F. View on RMB Exchange Rate
Since 2005, China has carefully controlled the RMB exchange rate to achieve a decade of low volatility and long-run gradual appreciation. It is in China’s best interest to do so, as currency and economic stability has historically been proven essential in order to internationalize a nation’s currency. However, since 1Q14, the appreciation trend shifted slightly with short-term depreciation pressure since February. PBOC allowed the CNY to depreciate by setting the fixing rate higher in February and subsequently widened the daily spot trading band from ±1% to ± 2% in mid-March 2014. Both the CNY and the CNH spots have been trading near the upper band (1.0% - 1.4% higher than the daily fixing rate), this compares to an average -1% lower than the fixing rate (at lower end of the band) throughout 2013 when market expected an uninterrupted one-way RMB appreciation.
Figure 28 : RMB One-Way Gradual Appreciation Up To 2014
Source: Bloomberg; July 2014
We view this policy change as a positive step by allowing two-way volatility and squeezing out speculators; furthermore, it serves as another significant step in the RMB’s internationalization. We do not believe it is PBOC’s intention to depreciate RMB continuously and undermine asset prices and financial stability in China. More recently, the PBOC started to set the fixing rate markedly lower since early June. This is consistent with our expectations and we expect further increased two-way volatility in RMB.
Figure 29 : 2014 Two-Way Volatility After Widened Band
Source: Bloomberg, July 2014

Page | 22
IP VIEWPOINT
JULY 2014
-4.00%
-3.50%
-3.00%
-2.50%
-2.00%
-1.50%
-1.00%
-0.50%
0.00%
2006 2007 2008 2009 2010 2011 2012 2013 2014
USDCNY
CNY fixing
-7%
-6%
-5%
-4%
-3%
-2%
-1%
0%
1%
2%
CNY EUR GBP JPY AUD KRW SGD MYR INR IDR
May-12 Jun-13
That said, the PBOC has managed the USDCNY daily fixing with very low volatility historically. Since 2006, when China allowed RMB to float with controlled daily USDCNY fixings, the maximum historical fixing drawdown was capped at -1.3% (Figure 30).
During the round of policy-induced RMB depreciation in 1Q14, the maximum drawdown was also capped at -1.3%. And since the fixings determine the daily trading band of the USDCNY spot, the low historical fixing drawdown has contributed to the low volatility of the USDCNY spot.
Figure 30 : USDCNY Daily Fixing Drawdown Has Been Low
Source: Bloomberg; July 2014
Moreover, even in times of economic crisis, be it Asian financial crisis in 1997, global financial crisis in 2008 or the subsequent European debt crisis in 2011/12, China never used a weaker RMB policy to support exports as a growth engine. This speaks to policy makers’ vision in relation to the role of its currency, which is to help develop and boost investor confidence in the Chinese economy, rather than a short-term manipulative tool.
As a result, the RMB has outperformed major hard currencies and EM currencies during recent crises. For example, during the latest round of the European Debt Crisis in May 2012, the RMB depreciated only 1.0% against the USD, while other major hard currencies and EM currencies depreciated over 5.0%. More recently, during the 2013 summer market sell-off led by the Fed tapering concerns, RMB again remained resilient (stayed flat) while the rest of risk currencies depreciated notably (Figure 31).
Figure 31 : Performance of RMB and Other Major Currencies vs. USD
Source: Bloomberg
In the future, we expect to see more a market-based mechanism in the RMB exchange rate scheme. However we still expect to see continued RMB stability to encourage more usage as a global currency. Despite increased volatility, we expect RMB to continue to appreciate against the US at a milder pace in the coming years, supported by the following fundamental factors:
1. China is still growing at a higher rate than the US. Despite challenging economic conditions and particularly pressure in the property sector, China’s domestic economy is stabilizing after the recent mini-stimulus and sectorial RRR cut; China is going through

Page | 23
IP VIEWPOINT
JULY 2014 significant structural reform, to transition its export and investment driven economy to a more domestic consumption-led economy.
As a result, the Chinese government is less incentivized to depreciate its currency to boost its export. Furthermore, strong domestic consumption demand does benefit from a stable and appreciating currency, and Chinese government is determined to continue to “manage” its currency convertibility, to reflect economic equilibrium, interest rate liberalization, and also to control inflation and excess capital inflows particularly driven by the quantitative easing programs from developed nations.
2. China runs both current account and capital account surpluses and continues to accumulate foreign exchange reserves. Premier Li mentioned in May 2014 that the $4 trillion FX reserves have become a burden and could affect inflation when translated into base currency.
3. Last but not least, the PBOC intends to introduce a more market-driven monetary policy, which requires less future intervention in the spot market than we have previously experienced.
In Summary
As China’s economy has grown at a rate of about 10% in the last two decades, its bond market has grown from virtually non-existent into one of the world’s largest. With China’s recent market development and policy support to accelerate the process to open its capital account and liberalize its financial market, we believe now is an exciting time to consider the Chinese bond market as an imminent asset class option for global investors.
Asian bonds have consistently outperformed global and Asian equity indices over the last decade on both an absolute and risk-adjusted basis. The emergence of the RMB bond markets offers investors greater and more exciting opportunities to capture the growth story of Asia and China in the coming decades.
We expect China’s onshore bond market to provide 5-6% yield (in RMB) for an Investment Grade portfolio, China’s offshore (CNH and USD) non-Investment Grade bond market offers approximately 8% - 9% yield (in CNH).
The rapid development of RMB internationalization in recent years is preparing the way for RMB to become a global reserve currency. This trend has already started, and will continue to attract substantial global asset re-allocation demand towards China’s bond market.
To conclude, we believe China’s bond market today offers a range of dynamic and attractive risk-adjusted investment solutions to capitalize on the economic growth story of China.
On behalf of
Income Partners Asset Management (HK) Ltd.

Page | 24
IP VIEWPOINT
JULY 2014
This report is for distribution only under such circumstances as may be permitted by applicable law. Nothing in this report constitutes a
representation that any investment strategy or recommendation contained herein is suitable or appropriate to a recipient’s individual
circumstances or otherwise constitutes a personal recommendation. It is provided to you solely for information purposes only and is not
intended as an offer, solicitation, advice or recommendation to enter into any transaction. No representation or warranty, either express or
implied, is provided in relation to the accuracy, completeness or reliability of the information contained herein, nor is it intended to be a
completed statement or summary of the securities, markets or developments referred to in the report. We have prepared this report
without consideration of the investment objectives, financial situation or particular needs of any individual investor. You should consider
your own investment objectives, financial situation and particular needs before taking any action with respect to a financial product
referred to in this presentation. In particular, we are not acting as your adviser or assuming any duty of care in this respect. To the extent
permitted by applicable law, none of Income Partners, its affiliates, or any officer or employee of Income Partners, accepts any liability
whatsoever for any direct or consequential loss arising from any use of this report or its contents, including for negligence. Investments
involve risk. Under some market conditions it may be impossible to liquidate a position. Losses incurred in trading can be substantial and
can exceed the funds deposited. Markets referred to in this report can be highly volatile.