IP-Link Documentation - Read the Docs · IP-Link Documentation Release 0.2 Cédric Bonhomme,...
15
IP-Link Documentation Release 0.2 Cédric Bonhomme, Jérôme Hussenet Oct 02, 2018 Contents 1 Installation 1 2 How it works 1 2.1 How it works ............................................... 1 2.2 Extraction of the data ........................................... 2 3 Tutorial 4 3.1 Generate a pcap file ............................................ 4 3.2 GraphViz ................................................. 4 3.3 Chord diagram with Circos ........................................ 5 3.4 Bézier curve ................................................ 6 3.5 Scatter plot with ploticus ......................................... 7 3.6 Picviz ................................................... 8 3.7 RealTime Graph 3D ............................................ 9 3.8 MooWheel ................................................ 10 3.9 Histogram ................................................. 12 3.10 Filter by date ............................................... 12 4 Documentation 13 4.1 Extraction ................................................. 13 4.2 Visualization ............................................... 14 5 Donation 14 The goal of IP-Link is to show the relationships between different IP addresses from network traffic capture, thus quickly determining for a given address the IP address with which it communicates the most.
Transcript of IP-Link Documentation - Read the Docs · IP-Link Documentation Release 0.2 Cédric Bonhomme,...

IP-Link DocumentationRelease 0.2
Cédric Bonhomme, Jérôme Hussenet
Oct 02, 2018
Contents
1 Installation 1
2 How it works 12.1 How it works . . . . . . . . . . . . . . . . . . . . . . . . . . . . . . . . . . . . . . . . . . . . . . . 12.2 Extraction of the data . . . . . . . . . . . . . . . . . . . . . . . . . . . . . . . . . . . . . . . . . . . 2
3 Tutorial 43.1 Generate a pcap file . . . . . . . . . . . . . . . . . . . . . . . . . . . . . . . . . . . . . . . . . . . . 43.2 GraphViz . . . . . . . . . . . . . . . . . . . . . . . . . . . . . . . . . . . . . . . . . . . . . . . . . 43.3 Chord diagram with Circos . . . . . . . . . . . . . . . . . . . . . . . . . . . . . . . . . . . . . . . . 53.4 Bézier curve . . . . . . . . . . . . . . . . . . . . . . . . . . . . . . . . . . . . . . . . . . . . . . . . 63.5 Scatter plot with ploticus . . . . . . . . . . . . . . . . . . . . . . . . . . . . . . . . . . . . . . . . . 73.6 Picviz . . . . . . . . . . . . . . . . . . . . . . . . . . . . . . . . . . . . . . . . . . . . . . . . . . . 83.7 RealTime Graph 3D . . . . . . . . . . . . . . . . . . . . . . . . . . . . . . . . . . . . . . . . . . . . 93.8 MooWheel . . . . . . . . . . . . . . . . . . . . . . . . . . . . . . . . . . . . . . . . . . . . . . . . 103.9 Histogram . . . . . . . . . . . . . . . . . . . . . . . . . . . . . . . . . . . . . . . . . . . . . . . . . 123.10 Filter by date . . . . . . . . . . . . . . . . . . . . . . . . . . . . . . . . . . . . . . . . . . . . . . . 12
4 Documentation 134.1 Extraction . . . . . . . . . . . . . . . . . . . . . . . . . . . . . . . . . . . . . . . . . . . . . . . . . 134.2 Visualization . . . . . . . . . . . . . . . . . . . . . . . . . . . . . . . . . . . . . . . . . . . . . . . 14
5 Donation 14
The goal of IP-Link is to show the relationships between different IP addresses from network traffic capture, thusquickly determining for a given address the IP address with which it communicates the most.

1 Installation
$ sudo apt install libpcap0.8$ git clone https://gitlab.com/cedric/ip-link.git$ cd ip-link/$ pipenv install$ pipenv shell
2 How it works
This section exposes the principles of IP-Link.
2.1 How it works
This page explain the process of the data extraction of the captured traffic.

2.2 Extraction of the data
Ways of data extraction
We can see that pcap_to_sqlite.py, pcap_to_sqlite1.py and pcap_to_sqlite.sh are three alternatives to generate theSQLite base. So, it is not necessary to use Python (although recommended) to generate the base. Once the basecreated, a Python script or anything other programming language can easily examine it.
Storing the results of extraction
SQLite base
It is possible to store the extraction results (in this case timestamp, source and destination IP) in a database.

Python serialized object
Structure of the Python serialized object
>>> dic_ip = {'212.110.251.3' : {'212.110.251.5' : 20, '212.110.251.12' : 16,'212.112.245.2' : 451},
'212.112.245.2' : {'212.110.251.3' : 48, '80.114.227.3' : 2},...
}
Some tests
>>> import pickle>>> dic_obj = open("./dic.pyobj", "r")>>> dic_ip = pickle.load(dic_obj)>>> for i in dic_ip['212.110.251.3']:
a += dic_ip['212.110.251.3'][i]>>> print a2815911>>> len(dic_ip['212.110.251.3'])893436
We see here that 212.110.251.3 has contacted 738,585 different IP, for a total of 2,815,911 contacts.
>>> (len(dic_ip['212.110.251.3'])/(len(dic_ip)*1.0))18.037144671290417
This already represents a significant part of sources ip.
>>> liste = dic_ip['212.110.251.3'].items() # list of IP contacted by 212.110.251.3>>> liste.sort(key = operator.itemgetter(1), reverse = True)>>> liste[0]('69.16.172.40', 204909) # most contacted by 212.110.251.3>>> liste[1]('149.20.20.133', 114881)>>> liste[-1]('83.9.4.233', 1) # less contacted by 212.110.251.3
>>> liste[-43527]('83.9.122.249', 1)>>> liste[-43528]('206.1.38.179', 2)
212.110.251.3 has contacted 43,527 different IP one time.
What can we do with this object ?
So we have seen that this is very simple to deal with this object to obtain what we want. This object represent thepart of the base that you want to exploit. It can be created with sqlite_to_object.py. Remember that the SQLite basecontains all the informations of the Pcap. So, if you want, you can filter these informations before visualizing. Forexample :
cedric@debian:~/IP-Link/source$ python sqlite_to_object.py -i data/ip.sql -r time -p→˓2009-1-15-22-00-00:2009-1-16-02-00-00DB connectRequest sent to the base :
SELECT ip_src, ip_dst FROM ip_link WHERE tts >= 1232053200.0 AND tts <=→˓1232067600.0Creating object...Reading the result of the query...Serialization...
Here, you will extract all the traffic between 2009/01/15 22h00m00s and 2009/01/16 02h00m00s. Now, for exampleyou can generate the Circos matrix and a MooWheel graph :
cedric@debian:~/IP-Link/source$ python object_to_circos.py -i jub-dic.pyobj -o ip.→˓circosLoading objet...Searching IP that are source and destination...Circos matrix generation...Saving the matrix...
cedric@debian:~/IP-Link/source$ python object_to_moowheel.pyLoading dictionary...Creating MooWheel file...Writting file.
3 Tutorial
This section explains how to generate the different visualizations.
3.1 Generate a pcap file
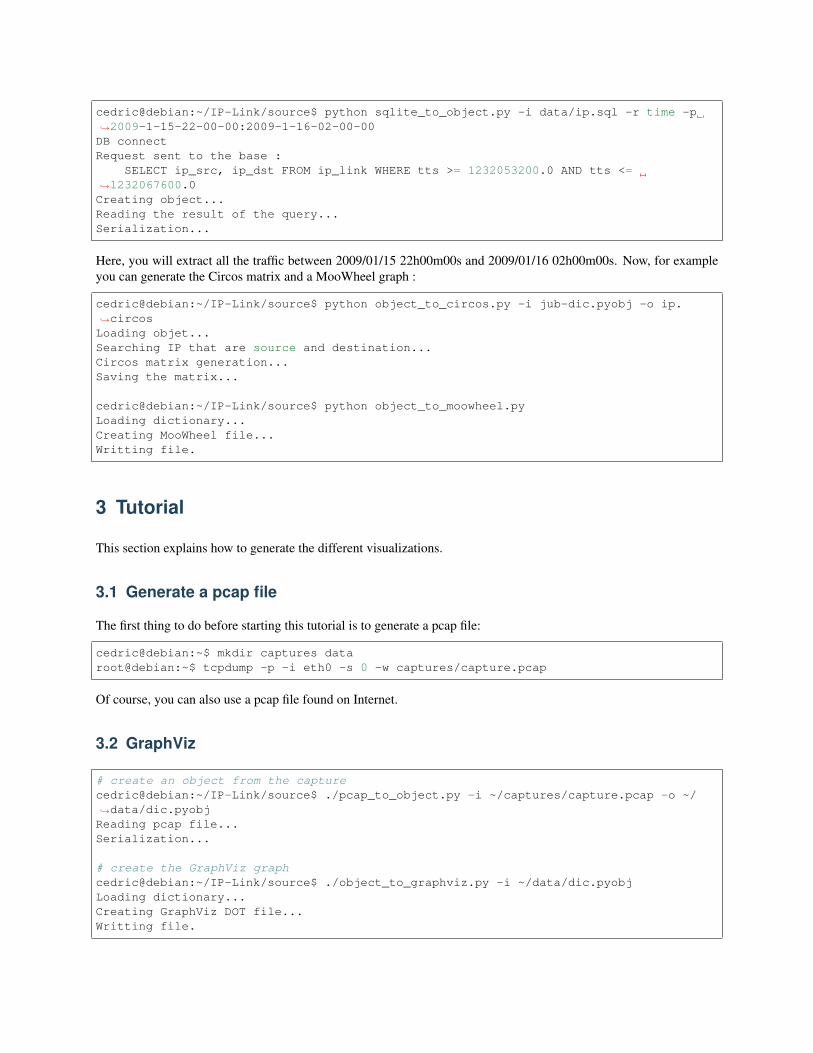
The first thing to do before starting this tutorial is to generate a pcap file:
cedric@debian:~$ mkdir captures dataroot@debian:~$ tcpdump -p -i eth0 -s 0 -w captures/capture.pcap
Of course, you can also use a pcap file found on Internet.
3.2 GraphViz
# create an object from the capturecedric@debian:~/IP-Link/source$ ./pcap_to_object.py -i ~/captures/capture.pcap -o ~/→˓data/dic.pyobjReading pcap file...Serialization...
# create the GraphViz graphcedric@debian:~/IP-Link/source$ ./object_to_graphviz.py -i ~/data/dic.pyobjLoading dictionary...Creating GraphViz DOT file...Writting file.

The first command create a pcap. tcpdump captures all the network traffic on all interfaces and create cap-tures/capture.pcap. The second one parse the pcap and generate a serialized graph. The last command create theDOT file from the saved serialized graph.
Now you can see the result by typing:
dotty ~/data/ip.dot
or :
dot -Tpng -o graphviz.png ~/data/ip.dot
Result
3.3 Chord diagram with Circos
Circos installation
First, download the latest version of CIRCOS and the Circos tools (for the table viewer). The required Perl modulecan be installed with:
cpan -i module_name
You can download this example of Circos configuration.
Generation of the input matrix for Circos
cedric@debian:~/ip-link/source$ ./pcap_to_object.py -i ~/captures/capture.pcap -o ~/→˓data/capture.pyObjReading pcap file...Serialization...
cedric@debian:~/ip-link/source$ ./object_to_circos.py -i ~/data/capture.pyObj -o ~/→˓data/capture.circosLoading objet...Searching IP that are source and destination...Circos matrix generation...Saving the matrix...
The first command generated a graph from the network capture. The second one create the matrix capture.circosof relation between IPs,from serialized object capture.pyObj. Here is the generated matrix. The matrix cap-ture.circos will be the input for the Circos table viewer.

Generation of the chord diagram
cedric@debian:~/circos-0.67-5$ cat capture.circos | tools/tableviewer/bin/parse-table→˓ | tools/tableviewer/bin/make-conf -dir datacedric@debian:~/circos-0.67-5$ ./bin/circos -conf circos.conf
The first command use the tool provided with Circos, tableviewer, to create Circos data files from matrix. The secondone execute Circos, with the data files generated, and create the graph.
Here is the generated chord diagram:
3.4 Bézier curve
More details on this page. This view enables to see the relations between ports.

3.5 Scatter plot with ploticus
cedric@debian:~/IP-Link/source$ ./pcap_to_object.py -i ~/captures/capture.capReading pcap file...Serialization...
cedric@debian:~/IP-Link/source$ ./sqlite_to_object.py -r tts -p 1231950347:1231950547DB connectQuery sent to the base :
SELECT ip_src, ip_dst FROM ip_link WHERE tts >= 1231950347 AND tts <=→˓1231950547Creating object...Reading query result...Serialization...
cedric@debian:~/IP-Link/source$ ./object_to_scatterplot.pyLoading dictionary...Creating categories fileCreating ploticus data fileCommand to execute :
ploticus -o ./scatterplot/scatterplot.png -png ./scatterplot/scatterplot -→˓csmap -maxproclinesCreating HTML map
Result

3.6 Picviz
cedric@debian:~/IP-Link/source$ ./pcap_to_sqlite.py -i ~/captures/capture.cap -o ~/→˓data/ip.sql
cedric@debian:~/IP-Link/source$ ./sqlite_to_picviz.py -i ~/data/ip.sql -r time -p→˓2009-1-16-00-03-00:2009-1-16-00-05-00DB connectQuery sent to the base :
SELECT tts, ip_src, ip_dst FROM ip_link WHERE tts >= 1232060580.0 AND tts <=→˓1232060700.0Creating Picviz file...Writting file...

With these otions sqlite_to_picviz.py extract the traffic between 2009/01/16 00h03m00s and 2009/01/16 00h05m00s.Then it creates the Picviz file.
Result
3.7 RealTime Graph 3D
cedric@debian:~/IP-Link/source$ ./pcap_to_object.py -i ~/captures/capture.pcapReading pcap file...Serialization...
cedric@debian:~/IP-Link/source$ ./object_to_rtgraph.py
Result

3.8 MooWheel
cedric@debian:~/IP-Link/source$ ./pcap_to_sqlite.py -i ~/captures/capture.cap
cedric@debian:~/IP-Link/source$ ./sqlite_to_object.pyDB connectQuery sent to the base :
SELECT ip_src, ip_dst FROM ip_linkCreating object...Reading query result...Serialization...
cedric@debian:~/IP-Link/source$ ./object_to_moowheel.pyLoading dictionary...Creating MooWheel file...Writting file.
Result

Pointing your mouse over 212.110.251.3 will let you see that 5 IP are not contacted by 212.110.251.3. If you want tosee better, you can make a filter this way :
cedric@debian:~/IP-Link/source$ ./sqlite_to_object.py -r ip_src -p 212.110.251.3DB connectQuery sent to the base :
SELECT ip_src, ip_dst FROM ip_link WHERE ip_src = "212.110.251.3"Creating object...Reading query result...Serialization...
cedric@debian:~/IP-Link/source$ ./object_to_moowheel.py -q
Now, 82.0.72.48, 86.0.48.47, 125.211.214.144, 123.129.255.167 and 91.121.165.159 are missing. These IP are nevercontacted by 212.110.251.3.

Another output with a bit more IP: http://cedric.bonhomme.free.fr/ip-link/moowheel/moowheel1.html
3.9 Histogram
cedric@debian:~/IP-Link/source$ ./pcap_to_object.py -i ~/captures/capture.capReading pcap file...Serialization...
cedric@debian:~/IP-Link/source$ ./object_to_csv.pyLoading dictionary...Writting CSV file...cedric@debian:~/IP-Link/source$ ./csv_to_histogram.py -s 192.168.1.2
Result
Here, for the moment, the legend is not display because histograms are used with the HTML gallery.
3.10 Filter by date
cedric@debian:~/IP-Link/source$ ./sqlite_to_object.py -i ~/data/ip.sql -r time -p→˓2009-1-15-22-00-00:2009-1-16-02-00-00DB connect
(continues on next page)

(continued from previous page)
Request sent to the base :SELECT ip_src, ip_dst FROM ip_link WHERE tts >= 1232053200.0 AND tts <=
→˓1232067600.0Creating object...Reading the result of the query...Serialization...
cedric@debian:~/IP-Link/source$ ./object_to_graphviz.py -q
cedric@debian:~/IP-Link/source$ dot -Tpng data/ip.dot -o pic.png
Result
The generated graph represent the traffic between 2009/01/15 22h00m00s and 2009/01/16 02h00m00s.
4 Documentation
This section explains how to use the different components.
4.1 Extraction
pcap_to_sqlite.py
Generate the SQLite base.
Read the pcap file given in parameter, extracts source and destination IP and create the SQLite base.
Options:
• -i, —input pcap file, (provided by tcpdump for example)
• -o, —output sqlite file
• -q, —quiet disable print on stdout
pcap_to_sqlite.sh
Generate the SQLite base.
This script uses tcpdump and sqlite3.
Parameters:
• pcap file

pcap_to_object.py
Generate a serialized graph object.
Read the pcap file given in parameter, extracts source and destination IP and create the graph object.
Options:
• -i, —input pcap file
• -o, —output python serialized object
• -q, —quiet disable print on stdout
4.2 Visualization
object_to_circos.py
Generate an input file (matrix) for Circos.
Loads a serialized graph object in memory and create the matrix for Circos.
Options:
• -i, —input Python serialized object
• -o, —output Circos input file
• -q, —quiet disable print on stdout
object_to_moowheel.py
Generate an HTML file using JavaScript and the <canvas> object.
Loads a serialized graph object in memory and create the MooWheel connections graph.
Options:
• -i, —input Python serialized object
• -o, —output MooWheel HTML file
• -q, —quiet disable print on stdout
5 Donation
If you wish and if you like IP-Link, you can donate via bitcoin. My bitcoin address:
1GVmhR9fbBeEh7rP1qNq76jWArDdDQ3otZ. Thank you!