Iowa Medicaid Non-Emergency Medical Transportation … · Iowa Medicaid Non-Emergency Medical...
134
Paul F. Hanley Nikhil Sikka Gavin Ferguson Ben Kober Jielin Sun September 30 2008 Iowa Medicaid Non-Emergency Medical Transportation System Review and Options for Improvements
Transcript of Iowa Medicaid Non-Emergency Medical Transportation … · Iowa Medicaid Non-Emergency Medical...
Paul F. Hanley Nikhil Sikka Gavin Ferguson Ben Kober Jielin Sun September 30 2008
Iowa Medicaid Non-Emergency Medical Transportation System Review and Options for Improvements
Iowa Medicaid Non-Emergency Medical Transportation System Review and Options for Improvements
Paul F. Hanley
Nikhil Sikka
Gavin Ferguson
Ben Kober
Jielin Sun
September 30 2008

Table of Contents
Contents Executive Summary ................................................................................................................................... 7
Reason for the Study ................................................................................................................................. 9
Study Team ............................................................................................................................................... 9
Study Tasks ................................................................................................................................................ 9
Study Task Result Highlight ....................................................................................................................... 9
Recommendations for NEMT services .................................................................................................... 10
Next Step ................................................................................................................................................. 11
Chapter 1 Introduction ........................................................................................................................... 13
Transportation and Access to Medicaid Services ................................................................................... 15
Origin of the Project ................................................................................................................................ 16
Management of the Brokerage Project .................................................................................................. 17
Components of the Project ..................................................................................................................... 18
Gap Analysis ........................................................................................................................................ 18
The Context for Issue Identification .................................................................................................... 18
Review of States’ Experience .............................................................................................................. 19
Development of System Design Recommendations ............................................................................... 19
The 2005 Deficit Reduction Act Provisions on Medicaid‐Funded Brokerage Systems ........................... 20
Report Structure ..................................................................................................................................... 20
Next Steps ............................................................................................................................................... 20
Acknowledgements ................................................................................................................................. 21
Part 1: Transportation Supply & Demand ............................................................................... 23
Chapter 2 Medicaid Consumers ............................................................................................................ 25
Medicaid Consumer Survey .................................................................................................................... 27
Getting Around Day to Day ..................................................................................................................... 32
General Travel Needs .............................................................................................................................. 32
Travel Needs by Purpose ........................................................................................................................ 33
Medical Care Related Trips ................................................................................................................. 33
Non‐Medical Related Trips ................................................................................................................. 34
Missed Trips ............................................................................................................................................ 34
Travel Demand for Medical Care ............................................................................................................ 37
Quality of Service of Public Transit ......................................................................................................... 38
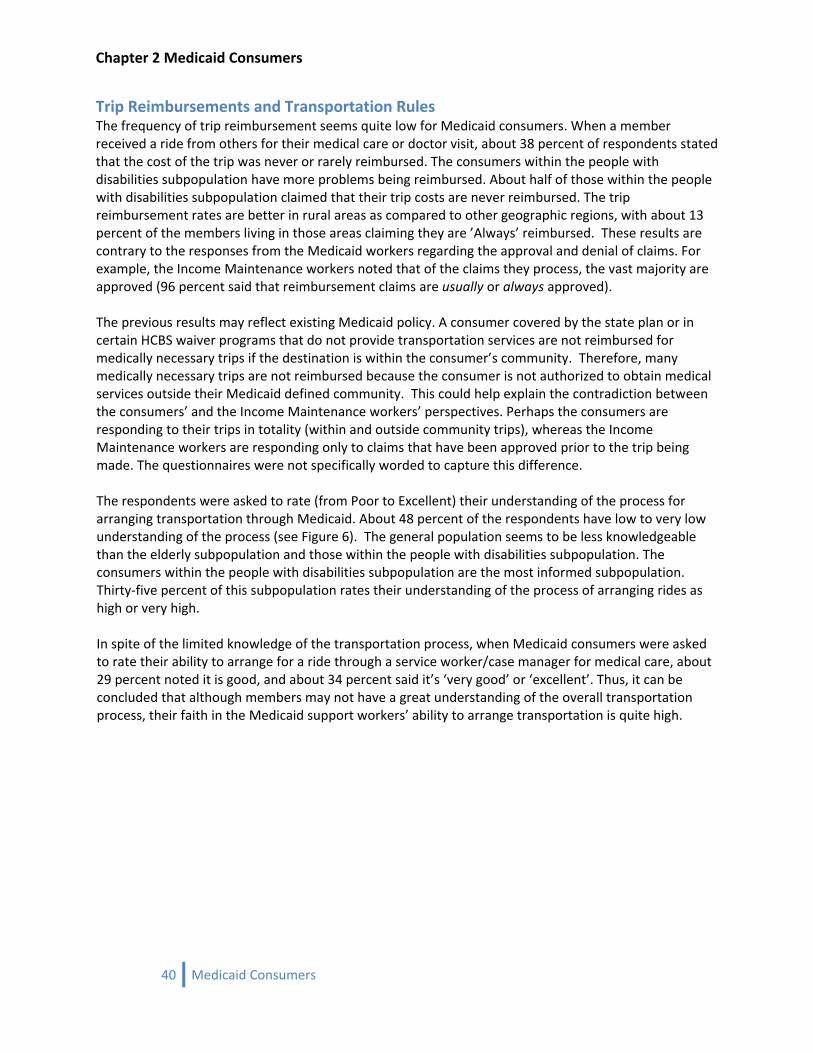
Trip Reimbursements and Transportation Rules .................................................................................... 40
3 Contents
Table of Contents
Public Transportation Use ....................................................................................................................... 41
Demographic Information ....................................................................................................................... 43
Importance of Transportation to the Consumer .................................................................................... 44
Conclusions ............................................................................................................................................. 44
Chapter 3 Income Maintenance Workers ........................................................................................... 47
Medicaid Income Maintenance Worker Survey ..................................................................................... 49
Income Maintenance Workers’ Survey Results ...................................................................................... 51
Medicaid Consumers’ Trip Demand .................................................................................................... 51
Verification of Transportation Reimbursement Claims ...................................................................... 51
Transportation Reimbursement Claim Approval ................................................................................ 52
Impact of Claim Denials ...................................................................................................................... 52
Perception of Transportation Service ................................................................................................. 53
Conclusion ............................................................................................................................................... 54
Chapter 4 Case Managers and Service Workers ................................................................................. 55
Case Managers and Service Workers Survey .......................................................................................... 57
Medicaid Consumers’ Trip Demand ........................................................................................................ 61
Medical Related Trips ......................................................................................................................... 61
Non‐medical Related Trips .................................................................................................................. 62
Transportation Service Assistance .......................................................................................................... 63
Consumers’ Knowledge of Medicaid Transportation Rules .................................................................... 64
CM/SW Perception of Public Transportation .......................................................................................... 64
Impact of Reimbursement Denials ......................................................................................................... 64
CM/SW Suggestions ................................................................................................................................ 65
Consumer Demand by Regional Transit Districts (RTD) and County ...................................................... 66
Conclusions ............................................................................................................................................. 70
Chapter 5 Transportation Providers ..................................................................................................... 71
Transportation Service Providers ............................................................................................................ 73
Passenger Transportation Services Survey ............................................................................................. 73
Overview ............................................................................................................................................. 73
Survey Analysis ........................................................................................................................................ 76
Nongovernment Organizations Interviews ............................................................................................. 77
Selection Process ................................................................................................................................ 77
Interview Analysis ............................................................................................................................... 79
Conclusions ............................................................................................................................................. 81
Chapter 6 Gap Analysis ........................................................................................................................... 83
4 Contents
Table of Contents
Gap Analysis between Transportation Services and Demand ................................................................ 85
Unmet Transportation Needs ................................................................................................................. 85
Study Subpopulation Analysis ............................................................................................................. 85
Who are missing trips within these areas? ............................................................................................. 86
Geographic Impacts on Study Subpopulation .................................................................................... 86
Where are the locations of the activities that are being missed? .......................................................... 87
Why might Medicaid consumers have difficulty getting to activities? ................................................... 89
Do those who are missing activities have a higher reliance on other people for transportation? .... 89
Elderly subpopulation is distinctive .................................................................................................... 89
Interaction between Elderly subpopulation and area type ................................................................ 90
Gaps in Trip Reimbursements and Understanding of the Process ......................................................... 91
Gaps in Transportation Services and Funding .................................................................................... 94
Conclusions ............................................................................................................................................. 95
Part 2: NEMT Brokerages ................................................................................................................ 97
Chapter 7 NEMT Brokerage Options .................................................................................................... 99
General Brokerage Characteristics ....................................................................................................... 101
The Assurance of Medical Transportation ........................................................................................ 101
Traditional Provision of Non‐Emergency Medicaid Transportation ................................................. 101
Provision of NEMT with a Transportation Broker ............................................................................. 101
Existing Brokerage Systems .................................................................................................................. 102
Operating Area .................................................................................................................................. 102
Method of Payment .......................................................................................................................... 102
Type of Broker ................................................................................................................................... 103
Brokers as Providers ......................................................................................................................... 104
Coordination with Human Services Programs ...................................................................................... 104
Advantages of the Brokerage Model .................................................................................................... 105
Existing NEMT Brokerage Descriptions by State ................................................................................... 109
Interviews with Key Medicaid Programs .......................................................................................... 109
Conclusions ........................................................................................................................................... 111
Chapter 8 General Trip Cost Estimates for NEMT ............................................................................ 113
Transportation Costs for NEMT Services .............................................................................................. 115
National Estimates ................................................................................................................................ 119
Additional Transportation Cost Estimates ............................................................................................ 120
Conclusions ........................................................................................................................................... 122
5 Contents
Table of Contents
6 Contents
Part 3: Recommendations ............................................................................................................ 123
Chapter 9 Recommendations for NEMT Brokerage in Iowa .......................................................... 125
Increasing focus on NEMT ..................................................................................................................... 127
Establishing an NEMT Brokerage .......................................................................................................... 128
Going State‐Wide .................................................................................................................................. 128
Actual Transportation Costs plus Fixed Brokerage Fee ........................................................................ 129
Equalizing Eligibility for NEMT .............................................................................................................. 129
Centralized Brokerage Oversight Function at IME ................................................................................ 130
Acceptance of a NEMT Brokerage ........................................................................................................ 130
Conclusion ............................................................................................................................................. 131
Part 4: Appendices ................................................................................................ Separate Publication Appendix 1 .................................................................................................................................................. A5
Medicaid Consumer Questionnaire ........................................................................................................ A7
Medicaid Consumer Responses ............................................................................................................ A21
Appendix 2 .............................................................................................................................................. A173
Income Maintenance Worker Questionnaire ..................................................................................... A175
Income Maintenance Worker Responses ........................................................................................... A179
Appendix 3 .............................................................................................................................................. A187
Case Managers and Service Worker Questionnaire ........................................................................... A189
Case Manager and Service Worker Responses ................................................................................... A203
Case Manager and Service Worker Qualitative Responses ................................................................ A217
Appendix 4 .............................................................................................................................................. A267
Public Transportation Providers Questionnaire ................................................................................. A269
Nongovernmental Organization Transportation Providers Questionnaire ........................................ A277
Transportation Providers Responses .................................................................................................. A285
Appendix 5 .............................................................................................................................................. A291
NEMT Brokerage Literature ................................................................................................................ A293
NEMT Brokerage Bibliography ............................................................................................................ A305
Transcripts of NEMT Brokerage Interviews ........................................................................................ A313
Appendix 6 .............................................................................................................................................. A323
Stakeholder Input Session Summaries...................................................................................................A325

Executive Summary
Executive Summary
7 Summary

Executive Summary
8 Summary
Executive Summary
Reason for the Study Inadequate transportation has long been identified as a major issue in rural Iowa, and it is particularly acute for people of all ages with disabilities and their families, including Medicaid members. In 2005 the Iowa Department of Human Services (DHS) received a federal Real Choices Systems Transformation Grant to address a number of barriers to community living faced by this population, including transportation. Iowa Medicaid Enterprise (IME), charged with administration of the grant, was interested in the ways in which a statewide, Medicaid‐funded transportation brokerage could improve services for Medicaid members. Currently, Medicaid members are reimbursed for transporting themselves, or providers are reimbursed for transporting individuals, which places the bulk of the responsibility on consumers, DHS Income Maintenance workers and case managers. Under a brokerage, IME would contract with an entity to (1) establish a network of transportation providers; (2) maintain a call center; (3) ensure compliance with Medicaid regulations related to eligibility of the individual and trip; (4) arrange and pay for the trips; and (5) monitor services and transportation providers for compliance and quality. States that have established brokerages have, in general, experienced an increase in the number of trips and a reduction in the cost per trip. In some instances, significant problems with fraud have been addressed. The brokerage concept has been actively supported at the federal level for both Medicaid and the general population.
Study Team A goal of the study was to provide guidance for consistent access to non‐emergency health care services by pointing the way towards coordinated non‐emergency medical transportation (NEMT) services through a centralized transportation brokerage. To achieve the goal, the University of Iowa’s Public Policy Center (PPC) under contract with the Iowa Department of Transportation (IADOT) researched the feasibility of serving the transportation needs of Medicaid members with such an NEMT brokerage service. A small interagency group was actively involved with the study as it progressed. Members of the interagency working groups included members from the DHS—IME, IADOT, the University of Iowa’s Center for Disabilities and Development (CDD), and the PPC.
Study Tasks The study had four main tasks that culminated in recommendations for an NEMT brokerage service. The four tasks were: 1) Assessment of Medicaid transportation needs; 2) Inventory of available transportation services; 3) Gap Analysis; and 4) Specifying the functional requirements for transportation brokerage services. The results of these tasks are presented in this report and companion appendices. The report includes design recommendations for a transportation brokerage system and suggests related policy changes for the IME, and the IADOT.
Study Task Result Highlight The gap analysis was performed in order to understand where there is unmet demand in the state of Iowa. Data for the gap analysis were gathered through telephone and web‐based surveys of (1) Medicaid members; (2) DHS Income Maintenance (IM) workers, who have responsibilities for determining Medicaid eligibility and the eligibility of trips under State Plan NEMT services; (3) Case managers and service workers who work with individual Medicaid members, including HCBS waiver participants, in developing their service plans and in assuring their access to needed services; and (4) transportation providers, including public transit systems and private providers. The PPC also used information on providers collected by the IADOT as part of the state’s transportation planning process.
9 Summary
Executive Summary
Medicaid members were divided into three groups (adults with disabilities, those 65 years and older, and the remaining adult Medicaid members), in addition to being identified by geographical area (urban area with fixed‐route transit, urban area without fixed‐route transit, and rural area without fixed‐route transit). They were asked about their recent experiences with Medicaid‐funded transportation, what transportation modes they used and whether they were reimbursed for their expenses, whether they were getting to where they needed to go, and whether they and their case managers understood Medicaid rules and the benefits to which they were entitled. IM workers, case managers and service workers were asked for their perspective on demand for services, their knowledge of the system, and how well it was working for members. Transportation providers were asked about demand and service capacity, and their interest in participating in specific types of transportation coordination initiatives. Transportation services do not seem to be a major problem for most Medicaid members. Nearly 93 percent of all members reported they have not missed a medical service due to lack of transportation. As a whole, those who rely on fixed‐route transportation report that it is almost always available, and those who do not drive themselves arrange rides with family and friends. However, the results are not uniform across the study groups. For example, people with disabilities miss more medical services and desired activities than the other Medicaid members. Strikingly, people who live within urban areas with access to fixed‐route transportation missed the most medical visits and other activities. A reoccurring finding was a lack of education and understanding of transportation resources and reimbursement eligibility among Medicaid members. Not only did Medicaid members speak of their confusion, but Medicaid workers and transportation providers also identified the complexity and variation in NEMT transportation policy as an issue. Additionally, the Medicaid members expressed a high acceptance of the concept of a NEMT brokerage. The Medicaid workers also agreed that a brokerage system would be helpful to increase access. Based on the interview results and public input sessions with transportation providers, acceptance of an NEMT brokerage that did not disrupt their ability to provide passenger transportation is high.
Recommendations for NEMT services The study explored Medicaid programs within U.S. that use a NEMT brokerage. Approximately 21 states utilize a brokerage system for some or all NEMT services. Models vary from one state to another. Some are statewide; others serve only certain regions. Sometimes a single broker is used, and sometimes states contract with a number of brokers serving specific regions. Public, private for‐profit and nonprofit entities can serve as brokers. Different approaches are taken to reimbursement of brokers. One state contracts with a broker to serve Medicaid recipients, but the broker also serves the non‐Medicaid population as well. The PPC collected data from a variety of published sources. In addition, staff of a number of Medicaid agencies around the country was interviewed to learn from their experiences and elicit their opinions on system design and reimbursement methodologies.
10 Summary
Executive Summary
11 Summary
The research conducted and documented within this report has been reviewed by the interagency working group and several public committees and public groups. The following are the study’s final recommendations: 1. Increase support for non‐emergency medical transportation (NEMT) throughout Iowa
2. Create a transportation brokerage for NEMT through the new federal provisions under the 2005
Deficit Reduction Act allowing States to provide brokerages as a State Plan service, securing a higher federal matching rate without going through the waiver approval process
3. Establish a single state‐wide brokerage for NEMT
4. Create at least one new full‐time NEMT manager within IME to oversee the brokerage, monitor and enforce quality control assurances, arbitrate consumer and transportation provider grievances not resolved by the broker, and review NEMT operating costs
5. Because of a lack of historic information on transportation costs and the anticipation that this program will grow significantly, the Iowa NEMT brokerage should initially be established based on reimbursement of actual transportation costs, plus a fixed administrative fee for the broker
6. Consider eliminating the state‐established policy to exclude “in‐town” NEMT
7. Consider equalizing the eligibility for NEMT across Medicaid State Plan services and waiver programs.
Next Step The working group has offered recommendations for system design, reimbursement methodology and other program requirements in Chapter 9 of this report, to be incorporated into a Request for Proposal. IME staff is developing cost estimates for various system components and for policy changes, recommended for consideration, which will expand definitions of trip eligibility. Such changes would require action by the Iowa Legislature.

Chapter 1 Introduction
12 Introduction

Chapter 1 Introduction
Chapter 1 Introduction
13 Introduction

Chapter 1 Introduction
14 Introduction
Chapter 1 Introduction
15 Introduction
Transportation and Access to Medicaid Services In 1965 Congress amended the Social Security Act to ensure access to healthcare for low‐income Americans. Under the new Medicaid program (Title XIX of the Act), states received federal funding to cover a major portion (the percentage varies from state to state) of healthcare services in exchange for developing and operating programs that comply with federal regulations. Some services in state Medicaid Plans are mandatory, but states are also given the latitude to include optional services as approved by the federal Center for Medicare and Medicaid Services (CMS), which currently provide program oversight nationwide. In 1982, states were given additional latitude to address the needs of individuals qualifying for Medicaid under the “Aged, Blind and Disabled” categories, who required a level of care that qualified them for nursing homes or other institutions. States could design Home and Community Based Services Waivers to provide supports in people’s homes and communities, including supports for participation in community life that states regarded as “medically necessary.” Recognition of the importance of transportation in accessing not just acute care but also non‐emergency medical services led to the federal requirement that states ensure that Medicaid recipients had a way to get to those services. States have considerable flexibility in establishing rules covering when people will be reimbursed for the cost of gas (for themselves or for someone willing to drive them), for public transportation, for cabs or ambulances or even airfare out of state for individuals requiring specialized care. Shinogle and Weiner1 found that approximately 10 percent of Medicaid consumers participating in Home and Community‐Based Services (n=2597) reported transportation problems as the primary reason for unmet prescription drug needs. Holding all else constant, lack of transportation increased the likelihood by 4 percent that these consumers would report they did not obtain the medication they thought they needed. Wallace, et al.2 reported survey participants who delayed care for transportation‐related reasons have a higher rate of medical conditions, of all 18 conditions examined in the survey, as well as more extensive related illnesses. Using survey data, Arcury, et al.3 found that having a driver’s license results in 2.29 times more visits for chronic care and 1.92 times more visits for routine care. The presence of a relative or friend who regularly provides rides to the respondent resulted in 1.58 more medical visits. Transportation is clearly an important issue for many people receiving Medicaid (in Iowa this population is referred to as “Medicaid members or consumers”), because they are low‐income and/or because they may have disabilities creating special transportation needs. Many older people and people with disabilities—even significant disabilities like quadriplegia—can and do drive their own vehicles to services, but the population of individuals who need assistance with transportation can only be expected to grow, as will the need for various transportation modes to respond to the demand. The elderly population (65+) is increasing dramatically throughout the United States. This population is expected to double from the current 36 million to 72 million in 2030. This represents an increase of
1 Shinogle, J. and Wiener, J.M., (2006). Medication Use Among Medicaid Users of Home and Community‐Based Services. Health Care Financing Review, 28; 1: 103‐116.
2 Wallace, R., Hughes‐Cromwick, P., Mull, H., Khasnabis, S. (2005). Access to Health Care and Non‐emergency Medical Transportation. Washington DC: Transportation Research Board.
3 Arcury, T.A., Presser, J., Gesler, W., & Powers, J.M. (2005). Access to Transportation and Health Care Utilization in a Rural Region. The Journal of Rural Health, 21; 1: 31‐38.
Chapter 1 Introduction
16 Introduction
from 12 to 20 percent of the entire population. The reason for the dramatic increase is the “baby boom” generation (people born between the years of 1946 and 1964). Another factor contributing to the increase in the elderly population is the fact that life expectancy is increasing. Life expectancy for people aged 65 in 1960 was 14.3 more years; in 1980 it was 16.4; and in 2000 it was 17.9, for both sexes4. In 2000, Iowa ranked 4th in the nation in terms of the proportion of elderly (65+), with 14.9 percent of the entire population falling into this group, as compared to the national average of 12.4 percent. This was a slight reduction from 1990, when Iowa ranked 2nd only to Florida with 15.3 percent. The population of elderly aged 85+ in Iowa also increased to 2.2 percent in 2000, making Iowa second only to North Dakota.5 He, et al. also note that 30 percent of Iowa’s elderly population resides alone, which increases their dependence on transportation assistance. Non‐elderly people with disabilities are another increasing population likely to require transportation assistance. Although, as noted above, many people with significant mobility limitations drive their own adaptive vehicles, people who require assistance with one or more “Activities of Daily Living” (ADLs), such as dressing, bathing, eating, or getting around inside the home6 might reasonably be expected to require transportation assistance as well. In 2004, 39.4 million people or 14.8 percent of the U.S. population had some type of disability, and 7.092 million or 2.7 percent needed assistance with at least one ADL. To compare the state of Iowa to the national average, 390,000 people or 14 percent of the population have some type of disability and 66,000 or 2.5 percent of people require assistance with at least one ADL (U.S. American Community Survey, 2004). In a study conducted by Kennedy, et al. in 1996, nationally there was an increase in people with disabilities requiring assistance with ADLS among the working‐age population (age 18 – 64) from 2.0 percent in 1980 to 2.7 percent in 1993. This indicates that the transportation needs of people with disabilities are increasing throughout the nation.
Origin of the Project This report, produced by the University of Iowa Public Policy Center (PPC) under contract with the Iowa Department of Transportation, responds to a request by the Iowa Department of Human Services (DHS) – Iowa Medicaid Enterprise (IME) for assistance in improving non‐emergency medical transportation services (NEMT) for Medicaid members in Iowa. IME has undertaken numerous initiatives in the last five years to improve the quality of Medicaid services in such areas as simplifying access to services, placing a new emphasis on prevention and wellness, addressing the particular challenges faced by rural residents in need of healthcare, and expanding opportunities for full participation in community life for older Iowans and people with disabilities. Transportation is fundamental to the achievement of successful outcomes in all these areas. Federal regulations require that states receiving Medicaid funds must ensure necessary transportation for recipients to and from healthcare providers. Such transportation is thus a service available to all 4 He, W., Sengupta, M., Velkoff, V. A., & DeBarros, K. A. (2005). 65+ in the United States. U.S. Census Bureau, Current Population Reports, 23‐209. Washington, DC: US Government Printing Office.
5 Ibid 6 Kennedy, J., LaPlante, M. P., & Kaye, S. (1997). Disability Statistics Abstract, Number 18: Need for Assistance in the Activities of Daily Living. In, A profile of adults needing assistance with activities of daily living (1992‐1992). Disability Statistics Report, (11). Washington, DC: National Institute on Disability and Rehabilitation Research, U.S. Department of Education.

Chapter 1 Introduction
Medicaid members in Iowa’s State Plan for Medicaid. In 2007, IME spent $5,964,061 on transportation services (data are not available on how many of the roughly 300,000 people enrolled in Medicaid used these services). The state can and does establish policies to ensure appropriate use of services. Additional transportation services are available to specific populations served by several (though not all) of Iowa’s seven Home and Community Based (Section 1915(c)) Waivers: Elderly, Mental Retardation, Brain Injury and Physical Disability. States are allowed to apply to the federal Centers for Medicare and Medicaid Services (CMS) for waivers to allow them to serve limited populations who otherwise would be eligible to receive services in institutions. These Home and Community Based Services (HCBS) waivers provide a wide range of supports to enable individuals to maintain community living, including in‐home health and personal attendant care, employment services, and services which prevent social isolation. Trips related to employment, shopping, and social activities can be included in individual service plans. States have wide latitude in defining the services to be provided. Inadequate transportation has long been identified as a major issue in rural Iowa, and it is particularly acute for people of all ages with disabilities and their families, including Medicaid members. In 2005 the Iowa Department of Human Services (DHS) received a federal Real Choices Systems Transformation Grant to address a number of barriers to community living faced by this population, including transportation. IME, charged with administration of the grant, was interested in the ways in which a statewide, Medicaid‐funded transportation brokerage could improve services for Medicaid members. Currently, Medicaid members are reimbursed for transporting themselves, or providers are reimbursed for transporting individuals, which places the bulk of the responsibility on consumers, DHS Income Maintenance workers and case managers. Under a brokerage, IME would contract with an entity to (1) establish a network of transportation providers; (2) maintain a call center; (3) ensure compliance with Medicaid regulations related to eligibility of the individual and trip; (4) arrange and pay for the trips; and (5) monitor services and transportation providers for compliance and quality. States that have established brokerages have, in general, experienced an increase in the number of trips and a reduction in the cost per trip. In some instances, significant problems with fraud have been addressed. The brokerage concept has been actively supported at the federal level for both Medicaid and the general population. Iowa has a long history of state involvement in promoting coordination of publicly funded passenger transportation at the regional and local level. Iowa Code requires coordination of public resources for transportation through the state’s designated public transit systems. Many Medicaid trips are arranged through Iowa’s public transit systems, which provide the rides themselves or arrange for another provider. IME stated its intention at the outset of the project that the brokerage be designed in such a way as to complement or even strengthen the existing system, rather than operate as a stand‐alone. In light of the IADOT’s responsibilities and expertise in public transit and human services transportation coordination, DHS asked IADOT to undertake an analysis of the demand for Medicaid‐funded transportation services, the capacity of providers to meet that demand, and the nature and scope of the service gap. State experiences with existing brokerages were to be reviewed and recommendations on system design presented to IME.
Management of the Brokerage Project State Medicaid Director Eugene Gessow is Principal Investigator for the 2005 Real Choices Grant and provides oversight for the brokerage project. IADOT contracted with the University of Iowa PPC in 2006 to complete the service gap analysis, review state experiences with brokerage systems, and develop design recommendations. Paul Hanley, Director of the Transportation Policy Research Program at the
17 Introduction
Chapter 1 Introduction
PPC, directed research effort on the contract. A small interagency working team assisted the PPC in developing the project, including Sue Stairs, Program Manager for Transportation Services with IME; Amanda Martin and Craig O’Riley project managers for the IADOT; Peter Hallock, Assistant Director of the Office of Public Transit of the IADOT; and Elizabeth O’Hara, Disability Policy Analyst of the University of Iowa Center for Disabilities and Development, which is assisting IME in coordination of all Real Choices Grant activities and securing appropriate stakeholder input. Stakeholder input was secured in a number of ways prior to and during the brokerage project. IME asked the interagency Transportation Coordination Council, which monitors and promotes coordination of human services transportation under Iowa Code, to serve as an advisory body for the project. The Council was provided with regular updates and a dialogue on design recommendations was conducted in September 2008. Dialogues were also held directly with consumers throughout Iowa. A special session was conducted in June 2008 with the Cedar Rapids‐based Peer Advocates Disability Support (PADS), consisting predominantly of individuals with disabilities, many of whom rely upon accessible public transit and who have been actively engaged for years in advocacy on transportation issues. The Iowa Public Transit Association was provided with regular project updates and conveyed their recommendations on system design in July 2008.
Components
Gap Analysis
of the Project
Data for the gap analysis were gathered through telephone and web‐based surveys of (1) Medicaid members; (2) DHS Income Maintenance (IM) workers, who have responsibilities for determining Medicaid eligibility and the eligibility of trips under State Plan NEMT services; (3) case managers and service workers who work with individual Medicaid members, including HCBS waiver participants, in developing their service plans and assuring their access to needed services; and (4) transportation providers, including public transit systems and private providers. The PPC also used information on providers collected by the IADOT as part of the state’s transportation planning process. Medicaid members were asked about their recent experiences with Medicaid‐funded transportation: what transportation modes they used and whether they were reimbursed for their expenses; whether they were getting to where they needed to go; and whether they and their case managers understood Medicaid rules and the benefits to which they were entitled. IM workers, case managers and service workers were asked for their perspective on demand for services and their knowledge of the system and how well it was working for members. Transportation providers were asked about demand and service capacity, and their interest in participating in specific types of transportation coordination initiatives.
The Context for Issue Identification Most Medicaid members get to healthcare services either by driving themselves or going with a friend or family member, and do not report difficulties related to transportation. Others must depend on the assistance of paid volunteers, on public transit or other providers. The gap analysis and consultation with stakeholders identified a number of issues perceived by Medicaid members, DHS workers and case managers, and providers. Some important examples included the inability of some members (6 percent of respondents) to get to medical appointments due to a lack of transportation in the previous month, and the lack of information about the policies and procedures related to Medicaid‐funded transportation. The latter was a problem for both members and DHS workers and case managers.
18 Introduction
Chapter 1 Introduction
These are the kinds of problems that a brokerage system can ameliorate by providing a single phone number to call and consolidating administrative functions through the brokerage entity. However, the results of the gap analysis need to be understood within the context of key Medicaid policies on who is eligible for what types of trips. Users of state plan transportation services do not receive reimbursement for trips within a contiguous urban area, for example, and must rely on their own resources. Des Moines’ contiguous urban area extends from Waukee to Pleasant Hill, so individuals living in the far reaches of Waukee cannot be reimbursed for travel to medical facilities anywhere in this area, even though some trips may exceed 20 miles. As noted earlier, not all Medicaid members have the same level of support in getting where they need to go. Transportation to work, shopping and social activities is included in the service plans of participants in many, but not all, Home and Community Based Services (HCBS) Waivers, but is not available to most Medicaid members. Sometimes the transportation provided to waiver participants is reimbursed separately, and in other cases, HCBS service providers include within their scope of services the transportation of their clients to work, daytime activities or other destinations. Survey results on the extent to which people were able to get the transportation they needed for these kinds of trips reflect the differences in trip eligibility across the State Plan and the seven waivers. Survey data showing a lack of awareness and information about Medicaid‐funded transportation was strongly reinforced by the dialogues with consumer stakeholder groups. Participants frequently complained that the system was confusing even for their case managers. Consumers did not understand why trips supporting participation in employment and community life were available to some groups but not others. A woman in the Cedar Rapids area stated that she is only able to get out once a month for her doctor visit and that, “I want more of a life than that.” A woman in Shenandoah, coping with mental health issues, stated that her recurring depression is only aggravated by the fact that she can never go anywhere. The monitoring team considers it important to distinguish between the kinds of problems that can be addressed by a brokerage system and those that can only be remedied by changes in Medicaid policy. Both approaches to enhancing access to transportation carry cost implications.
Review of States’ Experience Approximately 21 states currently utilize a brokerage system for some or all NEMT services. Models vary from state to state. Some programs are statewide; others serve only certain regions. Sometimes a single broker is used, and sometimes states contract with a number of brokers serving specific regions. Public, private for‐profit and nonprofit entities can serve as brokers. Different approaches are taken to reimbursement of brokers. One state contracts with a broker to serve Medicaid recipients, but the broker also serves the non‐Medicaid population as well. The PPC collected data from a variety of published sources. In addition, the PPC and the working group interviewed staff of a number of Medicaid agencies around the country to learn their experiences with brokers and elicit their opinions on system design and reimbursement methodologies. Development of System Design Recommendations All states were generally happy with the performance of their brokerage systems and their impact on service quality and cost‐effectiveness. The PPC and the working group concluded that IME should adapt any of the various system features that seem to best meet the needs of and conditions in Iowa. Factors that received particular attention included simplicity of the system for IME, the speed and ease with
19 Introduction
Chapter 1 Introduction
20 Introduction
which it could be put into operation across the State, complementarity with current efforts to coordinate transportation, as well as the kinds of incentives created by various reimbursement methodologies for service quality and cost‐effectiveness. The working group recommends that a Request for Proposal be issued for a single statewide broker. The working group also proposes that the broker establish working relationships with Iowa’s public transit systems in building the capacity of the transportation provider network to respond to the needs of Medicaid members. Reimbursement should be based upon direct costs plus an administrative fee.
The 2005 Deficit Reduction Act Provisions on MedicaidFunded Brokerage Systems The 2005 Deficit Reduction Act contained numerous provisions related to administration of the Medicaid Program. One provision important to this report provides states with the option of including a transportation brokerage in state plans for Medicaid. One significant advantage of this is the opportunity it provides for higher reimbursement rates (FMAP) for states. States have commonly supported their brokerage systems as a Medicaid administrative expense, for which they receive a lower (50%) federal reimbursement rate, or have secured the higher reimbursement available for Medicaid services by filing a waiver application for a brokerage. The waiver application must be renewed periodically and can be somewhat cumbersome. Providing services under a waiver, however, provides flexibility to states.
Report Structure After the introduction (Chapter 1), the report is presented in three main parts: Part 1. Transportation Supply and Demand; Part 2. NEMT Brokerage Options; and Part 3. Recommendations. The gap analysis is composed of the Medicaid Member survey analysis (Chapter 2), Income Maintenance Workers survey analysis (Chapter 3), the Case Managers and Service Worker survey analysis (Chapter 4), and the public transit and non‐governmental organization transportation providers interviews (Chapter 5). Each of the surveys is presented in individual chapters for ease of reference. Complete descriptive analysis of the questions contained in each questionnaire is presented as appendices (Appendix 1 through 4). The gap analysis discussion (Chapter 6) concludes Part 1 of this report. Part 2 of the report contains the summary of an extensive literature review and key‐informant interviews of existing NEMT brokerages (Chapter 7). The majority of the detailed brokerage descriptions are included in Appendix 5. Chapter 8 contains estimated trip costs for IME’s use in forecasting total expenditures for NEMT. The report concludes with Chapter 9, which contains recommendations for a NEMT brokerage appropriate for Iowa. The parts of the report that precede the concluding chapter are provided to support the recommendations offered for the Director of IME’s consideration.
Next Steps The working group has offered recommendations for system design, reimbursement methodology and other program requirements in Chapter 9 of this report, to be incorporated into a Request for Proposal. IME staff is developing cost estimates for various system components, as well as for policy changes, recommended for consideration, which will expand definitions of trip eligibility. Such changes would require action by the Iowa Legislature.
Chapter 1 Introduction
21 Introduction
Acknowledgments This report was written by the Transportation Policy Research Program (TPRP) in the University of Iowa’s Public Policy Center. Several researchers made important contributions to this project. Gavin Ferguson, a graduate student in Urban & Regional Planning, assisted with the collection of information on transportation brokerages. David Stoner and Rebecca Raab, a graduate student in Urban & Regional Planning and an undergraduate student in Geography, respectively, helped greatly with the telephone interviews of the nongovernmental organizations. Nikhil Sikka, a PhD student in Civil Engineering, and Jielin Sun a graduate student in Urban & Regional Planning, assembled and analyzed the survey results presented in the appendices. Lori Jarmon, project manager at the PPC, and Melia Pieper‐Marek, assistant to the project manager, obtained project approval from the Institutional Review Board, coordinated the conference calls with the transportation brokers, performed the telephone interviews with transportation providers, completed the qualitative analysis for the survey results. They also collected miscellaneous data from Medicaid programs throughout the project. Lastly, Associate Professor Linda Boyle contributed to the design and test of the Medicaid consumer questionnaire. The report preparation was a collaborative effort with the CDD, and the Offices of Public Transit and Systems Planning at the IADOT. The members of the TPRP gratefully acknowledge ELizabeth O’Hara from CDD for contributing to the Introduction to this report and Peter Hallock from the IADOT for structuring the Recommendation chapter. We also acknowledge the great contribution of Amanda Martin and Craig O’Riley as project managers, who had the unenviable task of coordinating the efforts of two state agencies (IME and IADOT) and two university centers (PPC and CDD). Lastly, Sue Stairs’ expertise on Medicaid rules, regulations, and program descriptions was invaluable to the team. This study was funded by the Iowa Department of Transportation and the Iowa Medicaid Enterprise. The conclusions are the independent products of university research and do not necessarily reflect the views of the funding agencies.

Chapter 2 Medicaid Consumers
22 Medicaid Consumers

Chapter 2 Medicaid Consumers
Part 1: Transportation Supply & Demand
23 Medicaid Consumers

Chapter 2 Medicaid Consumers
24 Medicaid Consumers

Chapter 2 Medicaid Consumers
Chapter 2 Medicaid Consumers
25 Medicaid Consumers

Chapter 2 Medicaid Consumers
26 Medicaid Consumers
Chapter 2 Medicaid Consumers
27 Medicaid Consumers
Medicaid Consumer Survey The following presents the analysis of the Medicaid Consumers’ survey conducted to collect data regarding how the Iowa Medicaid program is meeting the transportation needs of its consumers. The survey questionnaire was designed by the PPC study team and reviewed by the IME and IADOT monitoring team. In addition, the questionnaire was reviewed by the Cedar Rapids‐based Peer Advocates Disability Support (PADS) prior to approval by the University of Iowa’s Institutional Review Board. The final questionnaire was approved by IME prior to its administration. The survey included questions asking about the transportation services consumers used to get to medical and non‐medical services and their perceptions and experience with transportation within Iowa. The questionnaire is contained in Appendix 1 along with a complete descriptive analysis of the responses to each question. Upon approval, the Medicaid consumer questionnaire was printed and mailed to 30 Medicaid consumers as a pilot test. Based on the pilot, the PPC study team elected to administer the questionnaire by telephone. The survey was conducted using a common script to administer the questions. A list of all Medicaid consumers obtained from the Iowa Department of Human Services (DHS) was used as the sample frame. Medicaid consumers were divided into three subpopulations: People with Disabilities, Elderly, and General Medicaid. The people with disabilities subpopulation included those who are supplemental security income (SSI)‐program‐eligible adults (age 18+), Home and Community‐Based Services (HCBS) Waiver eligible, and non‐institutionalized.7 The elderly population were those 65 years and older, not included in the people with disabilities subpopulation (as defined previously), and non‐institutionalized. The remaining adult Medicaid consumers were categorized as General. Random samples were drawn from the subpopulations. The subpopulations were further assigned to one of three geographic areas. Area one was urban areas with access to public transit. Urban was defined by the U.S. Census Bureau’s designation8 and access was defined as within ½ mile of a fixed bus route. The second area was urban areas without access to public transit, defined as those within a U.S. Census Bureau‐defined urban area9 with a fixed‐route system, but further than ½ mile from a fixed bus route. The third area was defined as all other areas within Iowa. The goal was to reach a representative sample of consumers in all regions of the state. The final number of respondents was 1,724 consumers. Map 1 shows the distribution of Medicaid consumers by county in November 2007. A more telling illustration of the consumers’ geographical distribution is shown in Map 2, in which one can see how the consumers cluster in and around our urban centers. We chose to
7 Aid types used for identifying people with disabilities were 640: SSI‐D recipients of SSI or mandatory supplement, 643: SSI‐D persons eligible for SSI who receive no cash benefits, 642: Disabled persons ineligible for SSI or SSA because of Social Security COLA, 645: Ill and handicapped waiver, 636: SSI‐D NF, income exceeds SSI max or Brain Injury waiver or AIDS waiver, 731: Skilled nursing care or injury waiver or AIDS waiver, 136: SSI‐A NF, income exceeds SSI max or Elderly waiver or AIDS waiver, 37E: Medically needy or AIDs waiver, 733: MR waiver or ICF‐MR, 734: SSI Hospital or AIDS waiver. Elderly aid types were 140: SSI‐A recipients of SSI or mandatory supplement, 142: Aged, 143: SSI‐persons eligible for SSI who receive no cash benefits. All other aid types belong to General.
8 An urbanized area consists of densely settled territory that contains 50,000 or more people. For this study the 7 urban places with public transit systems were included too. See transportation provider chapter for a listing of the public transit systems within Iowa.
9 See footnote 8.
Chapter 2 Medicaid Consumers
28 Medicaid Consumers
include the spatial distributions to show how closely the sample distribution followed the distribution of all Medicaid consumers. In Map 3, our sample tends to cluster in the same way as the total population. This close spatial match to the total population provides us with more confidence in reporting differing characteristics as they arise in our study. To be able to estimate population totals, we calculated weights based on the probability of being selected in the sample.
Map 1. Medicaid Members by County
Map 2. Total Medicaid Members
Map 3. Responses for Member Survey
Chapter 2 Medicaid Consumers
32 Medicaid Consumers
Getting Around Day to Day The ability of Medicaid consumers to drive, measured in terms of possessing a valid driver’s license, is lower than that of the general U.S. population. Slightly more than two‐thirds (69 percent) of respondents hold a valid driver’s license, compared to the national value of 84 percent.10 The percentage of people with disabilities holding a valid driver’s license is the lowest (57 percent) of the study subpopulations (rates are 67 percent for the elderly subpopulation and 81 percent for the general subpopulation). When categorized into different geographic areas, the percentage of consumers living in urban areas with fixed‐route transit access having a valid driver’s license is lowest (61 percent) compared to consumers living in urban areas without fixed‐route transit access (68 percent) and in rural areas (78 percent). Following the same trend, car ownership among the consumers with a valid driver’s license is lowest for the people with disabilities subpopulation (76 percent) and as high as 95 percent for the general subpopulation. Overall, about 88 percent of the consumers holding a valid driver’s license own personal vehicles. When asked how often health problems prevent them from driving, consumers within the people with disabilities subpopulation experienced more problems than others (26 percent of people with disabilities subpopulation said ‘Sometimes’, 9 percent said ‘Usually’, and 12 percent said ‘Always’). The analysis at the geographic level provides interesting results. The members in the urban areas with transit access claim to have more problems in terms of health problems preventing them from driving (24 percent said ‘Sometimes’, 4 percent said ‘Usually’, and 10 percent said ‘Always’), whereas the consumers living in rural areas seem to have fewer problems as compared to the other subpopulations.
General Travel Needs The choice of transportation mode for the day‐to‐day trips is quite different across the three study subpopulations. As much as half of the respondents use more than one mode for their day‐to‐day travel needs. The general study subpopulation relies mainly on privately owned autos for daily travel needs, with 70 percent using a personal vehicle; this number increases to 77 percent in rural areas. On the other hand, only 40 percent of the consumers within the people with disabilities subpopulation and 46 percent of the elderly subpopulation use private modes for their daily travel needs. However, friend’s/ family’s car is the most important mode of transportation for consumers within the people with disabilities and elderly subpopulations. Around 63 percent of consumers within the people with disabilities subpopulation, 59 percent of those within the elderly subpopulation, and 57 percent of those within the general subpopulation use friends’ and/or family’s car for their daily transportation needs. The survey results are quite interesting regarding use of transit modes for the three study subpopulations. Overall, the percentage of Medicaid consumers using transit is quite high as compared to the average use statewide. The use of fixed‐route transit modes is around 9 percent. The percent breakdown for all three subpopulations is similar for using transit (obviously the percentages are higher for each subpopulation in urban areas where fixed‐route transit service is accessible). However, the paratransit (dial‐a‐ride) is heavily used by consumers within the people with disabilities subpopulation (about 10 percent of the respondents) and rarely used by general population (only 1 percent). This result was expected because paratransit’s target riders are those who could not otherwise use fixed‐route transit due to disability or frailness. The elderly also use paratransit modes quite frequently, with about 5 percent of respondents using paratransit modes for day‐to‐day trips. Similar trends are
10 Federal Highway Administration, Highway Statistics 2006, US Department of Transportation, Washington D.C.
Chapter 2 Medicaid Consumers
observed with the use of nongovernmental organization transportation providers (including volunteer agencies, individuals, and religious groups). About 19 percent of consumers within the people with disabilities subpopulation use nongovernment organizations for transportation, followed by 9 percent of the elderly subpopulation. Only 6 percent of the general subpopulation use nongovernment organization transportation for their daily travel needs.
Travel Needs by Purpose
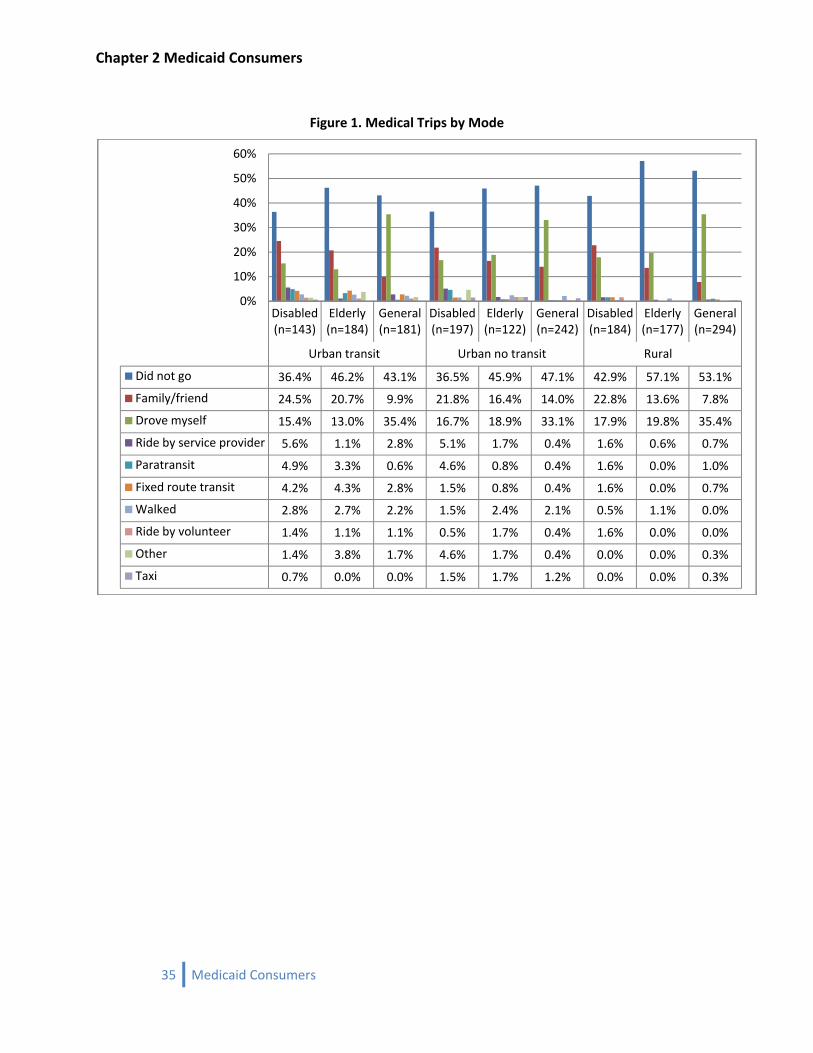
Medical Care Related Trips This section provides details regarding the type of mode used by Medicaid members for medical related purposes (including medical care visits and trips to drugstores and pharmacies). Figure 1 shows the percentage of each subpopulation (and overall percentage) using different kinds of modes for medical related trips in three different geographical areas. Overall, slightly less than half (43 percent) of the respondents did not need to go for medical related purposes (in the past week). Of those who did travel for medical proposes, demand is greater in urban areas with access to fixed‐route transit (primarily because of the size of these urban areas) than in urban areas without access to fixed‐route transit and in rural areas. The results show people with disabilities make the highest number of medical related trips with 61 percent making medical related visits every week. Many people within this study subpopulation (25 percent) drive themselves followed by those (16 percent) relying on family/friends to drive them to medical appointments. The people with disabilities and the elderly study subpopulations are more reliant on family’s/friend’s cars. The use of transit modes and volunteer transportation is quite limited across all the subpopulations as shown in the chart below. However, the consumers within the people with disabilities subpopulation use these modes more frequently as compared to others. When asked how many times they were unable to get to their medical care visits, about 95 percent of the members who needed to go said they never had any problems and only about 6 percent said they missed their appointments one to three times due to the unavailability of transportation. Overall, 25 percent of the respondents who missed their activities noted that the place they wanted to go was in the same town/city or county they live in. Damiano, et al (1994) found that Iowa’s rural elders take 92 percent of their trips by automobile and less than 1 percent by public transportation. The most common purpose of transit trips was to obtain medical care. Only 13 percent of those surveyed reported having used transit in the last year. About half of those who had not taken a trip were unaware that transit services were available to them. Those with a driver’s license were only about half as likely to have used transit in the past year as those without. Similarly, those who do not live alone were about 54 percent less likely to use transit than those who do live alone. In addition, 80 percent of those who had used transit agreed with the statement that the availability of transit made them feel more independent. Approximately 38 percent of respondents reported that they would have been unable to make their last trip if transit had not been available. This indicates few elders use transit, but those that do are very dependent on it. Less than 2 percent of respondents in the study by Damiano, et al (1994) indicated that lack of transportation prevented them from accessing medical care in the past year.
33 Medicaid Consumers
Chapter 2 Medicaid Consumers
Non‐Medical Related Trips
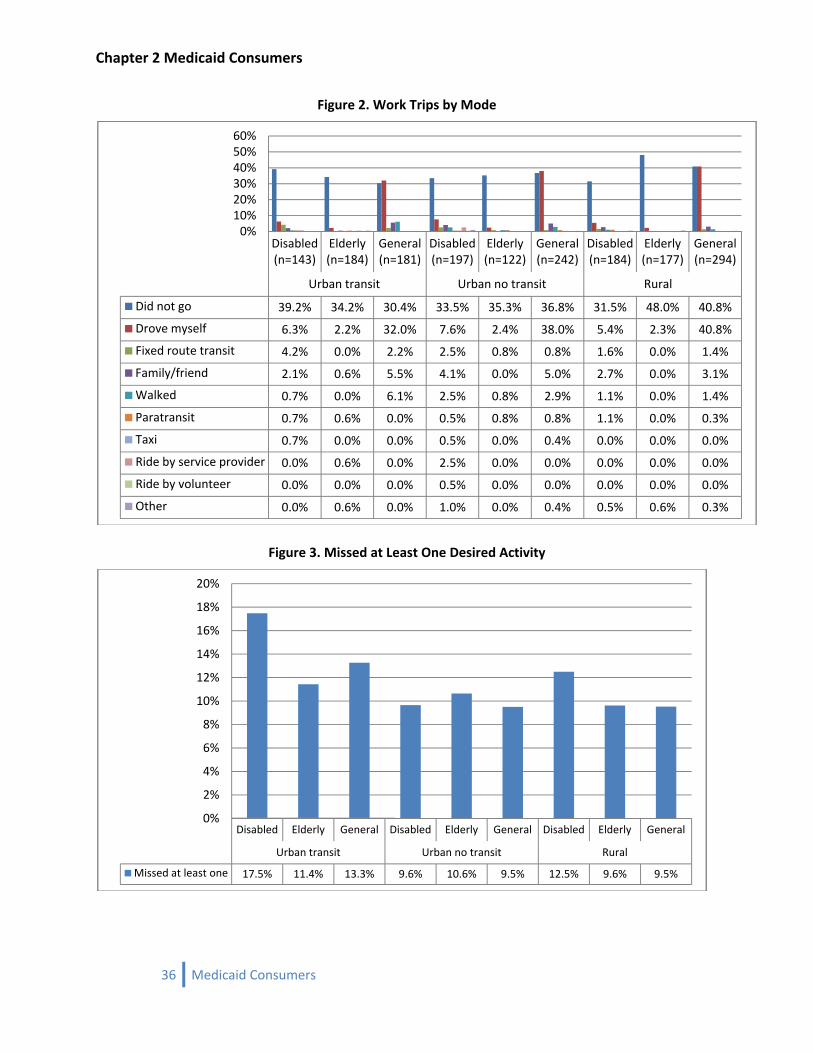
Work Trips Figure 2 shows the percentage of each subpopulation and the overall percentage using different kinds of modes to travel to work in the past week. As expected, a large portion of the Medicaid consumers (42 percent) don’t go to work and about 34 percent of the respondents who do have some kind of job did not go to work in the past week, showing the temporary nature of their work. Thirty‐seven percent of the general study subpopulation drives to work as opposed to 7 percent of the consumers within the people with disabilities subpopulation and 2 percent of elderly subpopulation. When asked if they had any difficulties getting to work in the past week, about 96 percent noted that they never had any problems.
Other Trips The other trips, which include shopping, religious, and social trips, show similar kinds of trends with driving a personal car and taking rides in a family/friend car as the most frequently used modes.
Missed Trips Medicaid consumers were asked if they have missed a desired activity or trip in the past week. Results revealed 11 percent of all Medicaid consumers had missed a desired activity (excluding medical related trips) due to lack of transportation (Figure 3). The analysis also shows slight differences between subpopulations. The consumers within the people with disabilities subpopulation have the highest percentage of missed activities (13 percent) followed by the elderly and general subpopulations (11 and 10 percent respectively). When asked how many times they were unable to get to their medical care or drug store visits, about 93 percent of the members who needed to go said they never had any problems. Of those who did miss medical services, the consumers within the people with disabilities subpopulation had the highest percentage (8 percent), followed by the elderly and general subpopulations (6 percent each). There is a geographic pattern to the missed trips by consumers. The Medicaid consumers living close to urban areas with fixed‐route transit access miss more trips than members living in other areas. Sixteen percent of Medicaid consumers, as a subpopulation who live within urban areas with fixed‐route transit access, do miss desired activities. In comparison, 14 percent of the Medicaid consumers who are living in urban areas without fixed‐route transit access or rural areas do miss desired activities.
34 Medicaid Consumers
Chapter 2 Medicaid Consumers
Figure 1. Medical Trips by Mode
Disabled (n=143)
Elderly (n=184)
General (n=181)
Disabled (n=197)
Elderly (n=122)
General (n=242)
Disabled (n=184)
Elderly (n=177)
General (n=294)
Urban transit Urban no transit Rural
Did not go 36.4% 46.2% 43.1% 36.5% 45.9% 47.1% 42.9% 57.1% 53.1%
Family/friend 24.5% 20.7% 9.9% 21.8% 16.4% 14.0% 22.8% 13.6% 7.8%
Drove myself 15.4% 13.0% 35.4% 16.7% 18.9% 33.1% 17.9% 19.8% 35.4%
Ride by service provider 5.6% 1.1% 2.8% 5.1% 1.7% 0.4% 1.6% 0.6% 0.7%
Paratransit 4.9% 3.3% 0.6% 4.6% 0.8% 0.4% 1.6% 0.0% 1.0%
Fixed route transit 4.2% 4.3% 2.8% 1.5% 0.8% 0.4% 1.6% 0.0% 0.7%
Walked 2.8% 2.7% 2.2% 1.5% 2.4% 2.1% 0.5% 1.1% 0.0%
Ride by volunteer 1.4% 1.1% 1.1% 0.5% 1.7% 0.4% 1.6% 0.0% 0.0%
Other 1.4% 3.8% 1.7% 4.6% 1.7% 0.4% 0.0% 0.0% 0.3%
Taxi 0.7% 0.0% 0.0% 1.5% 1.7% 1.2% 0.0% 0.0% 0.3%
0%
10%
20%
30%
40%
50%
60%
35 Medicaid Consumers
Chapter 2 Medicaid Consumers
Figure 2. Work Trips by Mode
Disabled (n=143)
Elderly (n=184)
General (n=181)
Disabled (n=197)
Elderly (n=122)
General (n=242)
Disabled (n=184)
Elderly (n=177)
General (n=294)
Urban transit Urban no transit Rural
Did not go 39.2% 34.2% 30.4% 33.5% 35.3% 36.8% 31.5% 48.0% 40.8%
Drove myself 6.3% 2.2% 32.0% 7.6% 2.4% 38.0% 5.4% 2.3% 40.8%
Fixed route transit 4.2% 0.0% 2.2% 2.5% 0.8% 0.8% 1.6% 0.0% 1.4%
Family/friend 2.1% 0.6% 5.5% 4.1% 0.0% 5.0% 2.7% 0.0% 3.1%
Walked 0.7% 0.0% 6.1% 2.5% 0.8% 2.9% 1.1% 0.0% 1.4%
Paratransit 0.7% 0.6% 0.0% 0.5% 0.8% 0.8% 1.1% 0.0% 0.3%
Taxi 0.7% 0.0% 0.0% 0.5% 0.0% 0.4% 0.0% 0.0% 0.0%
Ride by service provider 0.0% 0.6% 0.0% 2.5% 0.0% 0.0% 0.0% 0.0% 0.0%
Ride by volunteer 0.0% 0.0% 0.0% 0.5% 0.0% 0.0% 0.0% 0.0% 0.0%
Other 0.0% 0.6% 0.0% 1.0% 0.0% 0.4% 0.5% 0.6% 0.3%
0%10%20%30%40%50%60%
Figure 3. Missed at Least One Desired Activity
Disabled Elderly General Disabled Elderly General Disabled Elderly General
Urban transit Urban no transit Rural
Missed at least one 17.5% 11.4% 13.3% 9.6% 10.6% 9.5% 12.5% 9.6% 9.5%
0%
2%
4%
6%
8%
10%
12%
14%
16%
18%
20%
36 Medicaid Consumers
Chapter 2 Medicaid Consumers
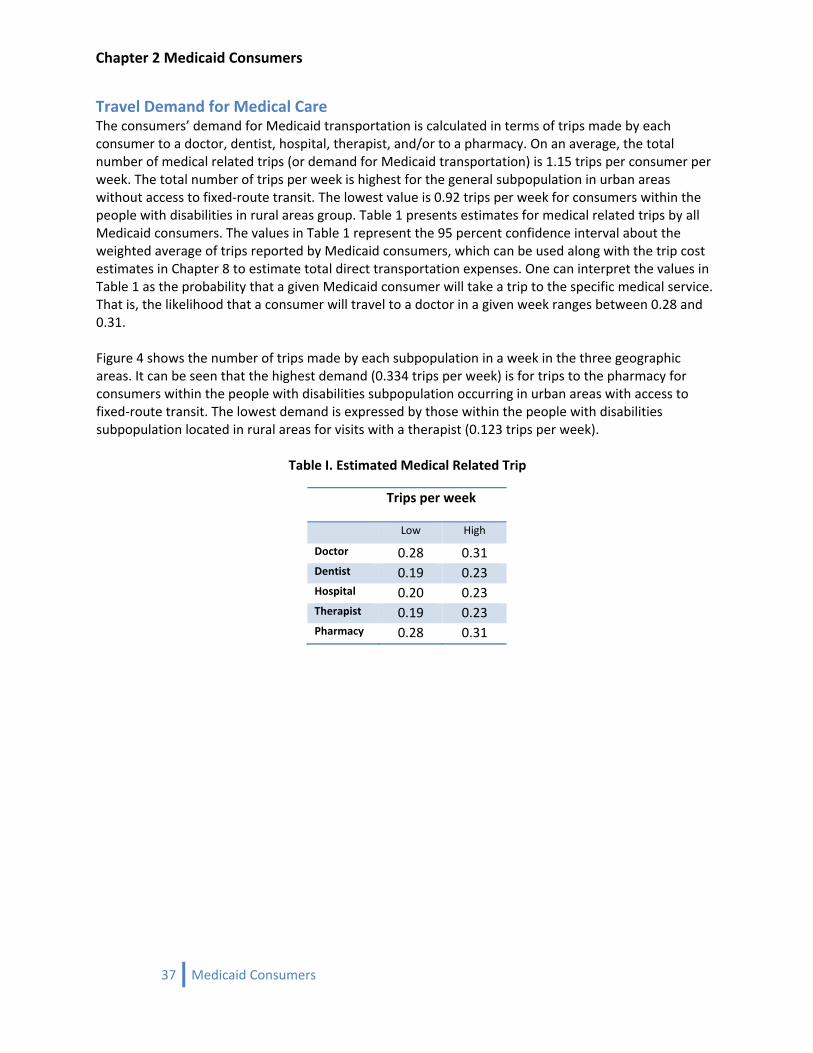
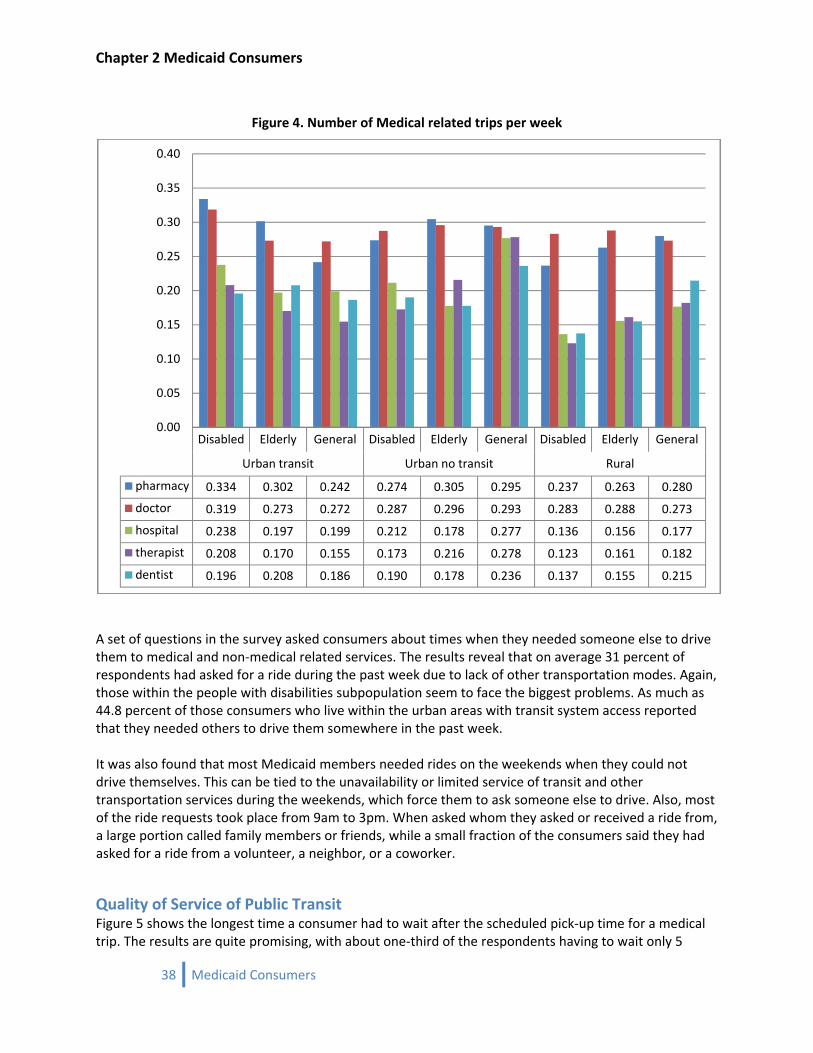
Travel Demand for Medical Care The consumers’ demand for Medicaid transportation is calculated in terms of trips made by each consumer to a doctor, dentist, hospital, therapist, and/or to a pharmacy. On an average, the total number of medical related trips (or demand for Medicaid transportation) is 1.15 trips per consumer per week. The total number of trips per week is highest for the general subpopulation in urban areas without access to fixed‐route transit. The lowest value is 0.92 trips per week for consumers within the people with disabilities in rural areas group. Table 1 presents estimates for medical related trips by all Medicaid consumers. The values in Table 1 represent the 95 percent confidence interval about the weighted average of trips reported by Medicaid consumers, which can be used along with the trip cost estimates in Chapter 8 to estimate total direct transportation expenses. One can interpret the values in Table 1 as the probability that a given Medicaid consumer will take a trip to the specific medical service. That is, the likelihood that a consumer will travel to a doctor in a given week ranges between 0.28 and 0.31. Figure 4 shows the number of trips made by each subpopulation in a week in the three geographic areas. It can be seen that the highest demand (0.334 trips per week) is for trips to the pharmacy for consumers within the people with disabilities subpopulation occurring in urban areas with access to fixed‐route transit. The lowest demand is expressed by those within the people with disabilities subpopulation located in rural areas for visits with a therapist (0.123 trips per week).
Table I. Estimated Medical Related Trip
Trips per week
Low High
Doctor 0.28 0.31 Dentist 0.19 0.23 Hospital 0.20 0.23 Therapist 0.19 0.23 Pharmacy 0.28 0.31
37 Medicaid Consumers
Chapter 2 Medicaid Consumers
Figure 4. Number of Medical related trips per week
Disabled Elderly General Disabled Elderly General Disabled Elderly General
Urban transit Urban no transit Rural
pharmacy 0.334 0.302 0.242 0.274 0.305 0.295 0.237 0.263 0.280
doctor 0.319 0.273 0.272 0.287 0.296 0.293 0.283 0.288 0.273
hospital 0.238 0.197 0.199 0.212 0.178 0.277 0.136 0.156 0.177
therapist 0.208 0.170 0.155 0.173 0.216 0.278 0.123 0.161 0.182
dentist 0.196 0.208 0.186 0.190 0.178 0.236 0.137 0.155 0.215
0.00
0.05
0.10
0.15
0.20
0.25
0.30
0.35
0.40
A set of questions in the survey asked consumers about times when they needed someone else to drive them to medical and non‐medical related services. The results reveal that on average 31 percent of respondents had asked for a ride during the past week due to lack of other transportation modes. Again, those within the people with disabilities subpopulation seem to face the biggest problems. As much as 44.8 percent of those consumers who live within the urban areas with transit system access reported that they needed others to drive them somewhere in the past week. It was also found that most Medicaid members needed rides on the weekends when they could not drive themselves. This can be tied to the unavailability or limited service of transit and other transportation services during the weekends, which force them to ask someone else to drive. Also, most of the ride requests took place from 9am to 3pm. When asked whom they asked or received a ride from, a large portion called family members or friends, while a small fraction of the consumers said they had asked for a ride from a volunteer, a neighbor, or a coworker.
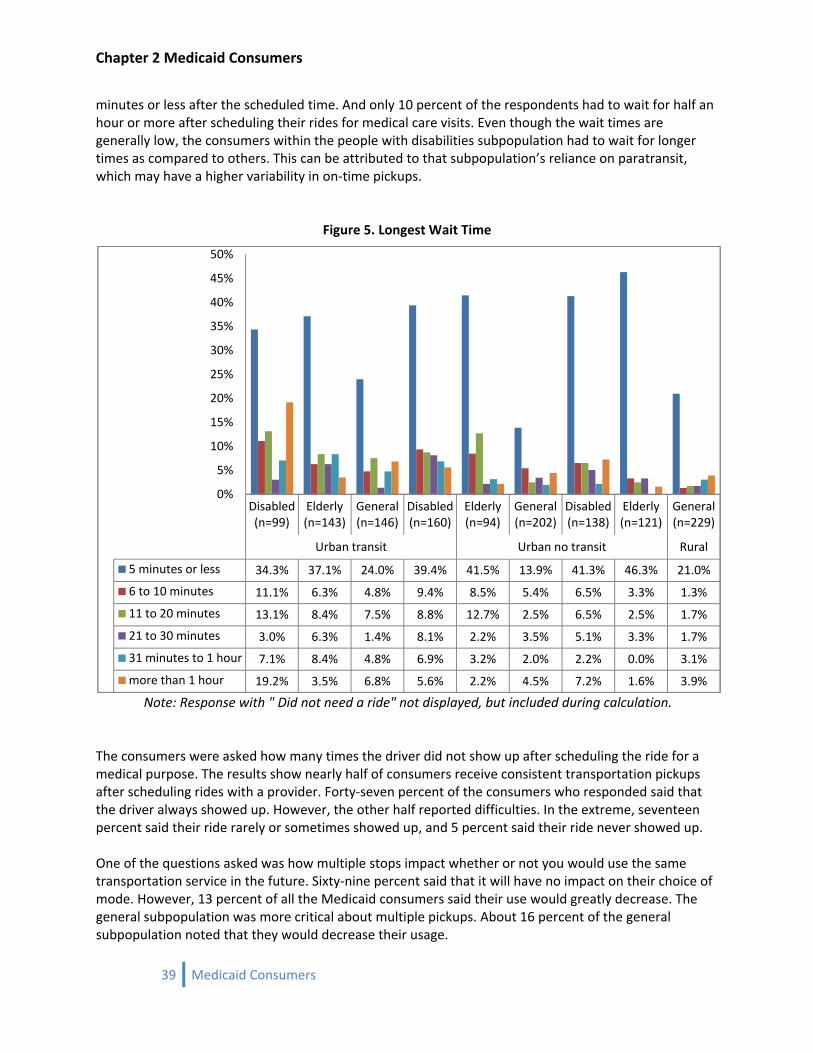
Quality of Service of Public Transit Figure 5 shows the longest time a consumer had to wait after the scheduled pick‐up time for a medical trip. The results are quite promising, with about one‐third of the respondents having to wait only 5
38 Medicaid Consumers
Chapter 2 Medicaid Consumers
minutes or less after the scheduled time. And only 10 percent of the respondents had to wait for half an hour or more after scheduling their rides for medical care visits. Even though the wait times are generally low, the consumers within the people with disabilities subpopulation had to wait for longer times as compared to others. This can be attributed to that subpopulation’s reliance on paratransit, which may have a higher variability in on‐time pickups.
Figure 5. Longest Wait Time
Note: Response with " Did not need a ride" not displayed, but included during calculation.
Disabled (n=99)
Elderly (n=143)
General (n=146)
Disabled (n=160)
Elderly (n=94)
General (n=202)
Disabled (n=138)
Elderly (n=121)
General (n=229)
Urban transit Urban no transit Rural
5 minutes or less 34.3% 37.1% 24.0% 39.4% 41.5% 13.9% 41.3% 46.3% 21.0%
6 to 10 minutes 11.1% 6.3% 4.8% 9.4% 8.5% 5.4% 6.5% 3.3% 1.3%
11 to 20 minutes 13.1% 8.4% 7.5% 8.8% 12.7% 2.5% 6.5% 2.5% 1.7%
21 to 30 minutes 3.0% 6.3% 1.4% 8.1% 2.2% 3.5% 5.1% 3.3% 1.7%
31 minutes to 1 hour 7.1% 8.4% 4.8% 6.9% 3.2% 2.0% 2.2% 0.0% 3.1%
more than 1 hour 19.2% 3.5% 6.8% 5.6% 2.2% 4.5% 7.2% 1.6% 3.9%
0%
5%
10%
15%
20%
25%
30%
35%
40%
45%
50%
The consumers were asked how many times the driver did not show up after scheduling the ride for a medical purpose. The results show nearly half of consumers receive consistent transportation pickups after scheduling rides with a provider. Forty‐seven percent of the consumers who responded said that the driver always showed up. However, the other half reported difficulties. In the extreme, seventeen percent said their ride rarely or sometimes showed up, and 5 percent said their ride never showed up. One of the questions asked was how multiple stops impact whether or not you would use the same transportation service in the future. Sixty‐nine percent said that it will have no impact on their choice of mode. However, 13 percent of all the Medicaid consumers said their use would greatly decrease. The general subpopulation was more critical about multiple pickups. About 16 percent of the general subpopulation noted that they would decrease their usage.
39 Medicaid Consumers
Chapter 2 Medicaid Consumers
Trip Reimbursements and Transportation Rules The frequency of trip reimbursement seems quite low for Medicaid consumers. When a member received a ride from others for their medical care or doctor visit, about 38 percent of respondents stated that the cost of the trip was never or rarely reimbursed. The consumers within the people with disabilities subpopulation have more problems being reimbursed. About half of those within the people with disabilities subpopulation claimed that their trip costs are never reimbursed. The trip reimbursement rates are better in rural areas as compared to other geographic regions, with about 13 percent of the members living in those areas claiming they are ’Always’ reimbursed. These results are contrary to the responses from the Medicaid workers regarding the approval and denial of claims. For example, the Income Maintenance workers noted that of the claims they process, the vast majority are approved (96 percent said that reimbursement claims are usually or always approved). The previous results may reflect existing Medicaid policy. A consumer covered by the state plan or in certain HCBS waiver programs that do not provide transportation services are not reimbursed for medically necessary trips if the destination is within the consumer’s community. Therefore, many medically necessary trips are not reimbursed because the consumer is not authorized to obtain medical services outside their Medicaid defined community. This could help explain the contradiction between the consumers’ and the Income Maintenance workers’ perspectives. Perhaps the consumers are responding to their trips in totality (within and outside community trips), whereas the Income Maintenance workers are responding only to claims that have been approved prior to the trip being made. The questionnaires were not specifically worded to capture this difference. The respondents were asked to rate (from Poor to Excellent) their understanding of the process for arranging transportation through Medicaid. About 48 percent of the respondents have low to very low understanding of the process (see Figure 6). The general population seems to be less knowledgeable than the elderly subpopulation and those within the people with disabilities subpopulation. The consumers within the people with disabilities subpopulation are the most informed subpopulation. Thirty‐five percent of this subpopulation rates their understanding of the process of arranging rides as high or very high. In spite of the limited knowledge of the transportation process, when Medicaid consumers were asked to rate their ability to arrange for a ride through a service worker/case manager for medical care, about 29 percent noted it is good, and about 34 percent said it’s ‘very good’ or ‘excellent’. Thus, it can be concluded that although members may not have a great understanding of the overall transportation process, their faith in the Medicaid support workers’ ability to arrange transportation is quite high.
40 Medicaid Consumers
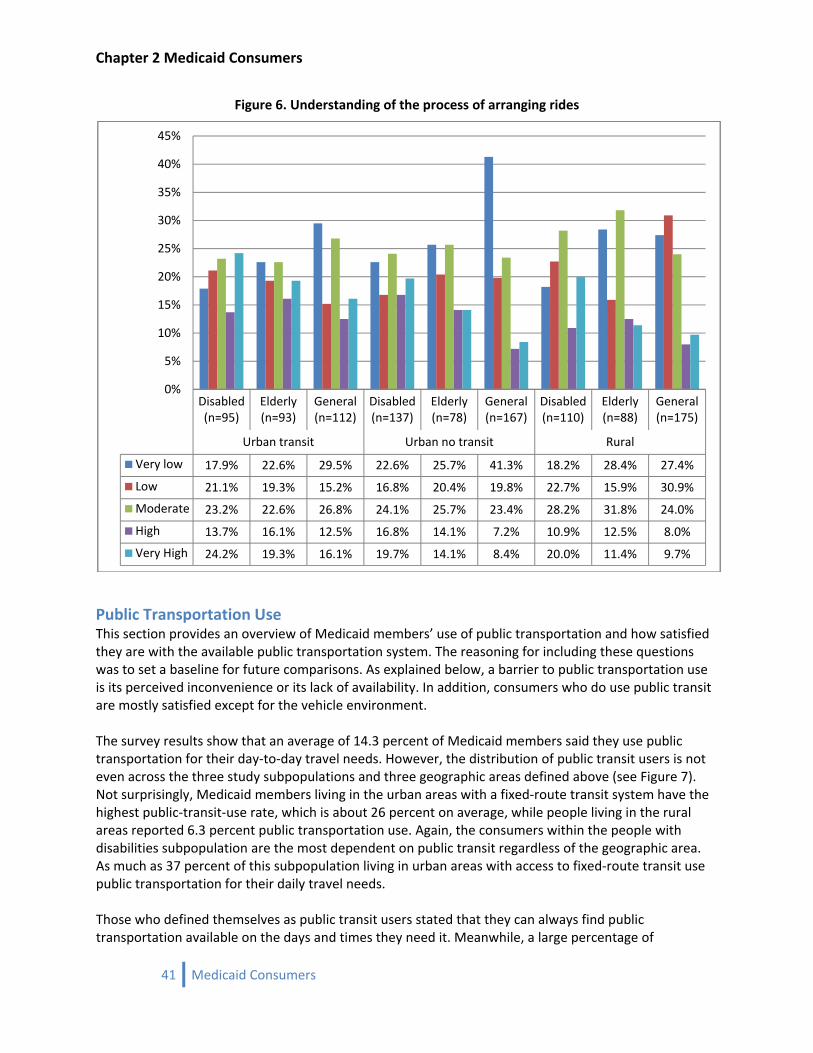
Chapter 2 Medicaid Consumers
Figure 6. Understanding of the process of arranging rides
Disabled (n=95)
Elderly (n=93)
General (n=112)
Disabled (n=137)
Elderly (n=78)
General (n=167)
Disabled (n=110)
Elderly (n=88)
General (n=175)
Urban transit Urban no transit Rural
Very low 17.9% 22.6% 29.5% 22.6% 25.7% 41.3% 18.2% 28.4% 27.4%
Low 21.1% 19.3% 15.2% 16.8% 20.4% 19.8% 22.7% 15.9% 30.9%
Moderate 23.2% 22.6% 26.8% 24.1% 25.7% 23.4% 28.2% 31.8% 24.0%
High 13.7% 16.1% 12.5% 16.8% 14.1% 7.2% 10.9% 12.5% 8.0%
Very High 24.2% 19.3% 16.1% 19.7% 14.1% 8.4% 20.0% 11.4% 9.7%
0%
5%
10%
15%
20%
25%
30%
35%
40%
45%
Public Transportation Use This section provides an overview of Medicaid members’ use of public transportation and how satisfied they are with the available public transportation system. The reasoning for including these questions was to set a baseline for future comparisons. As explained below, a barrier to public transportation use is its perceived inconvenience or its lack of availability. In addition, consumers who do use public transit are mostly satisfied except for the vehicle environment. The survey results show that an average of 14.3 percent of Medicaid members said they use public transportation for their day‐to‐day travel needs. However, the distribution of public transit users is not even across the three study subpopulations and three geographic areas defined above (see Figure 7). Not surprisingly, Medicaid members living in the urban areas with a fixed‐route transit system have the highest public‐transit‐use rate, which is about 26 percent on average, while people living in the rural areas reported 6.3 percent public transportation use. Again, the consumers within the people with disabilities subpopulation are the most dependent on public transit regardless of the geographic area. As much as 37 percent of this subpopulation living in urban areas with access to fixed‐route transit use public transportation for their daily travel needs. Those who defined themselves as public transit users stated that they can always find public transportation available on the days and times they need it. Meanwhile, a large percentage of
41 Medicaid Consumers
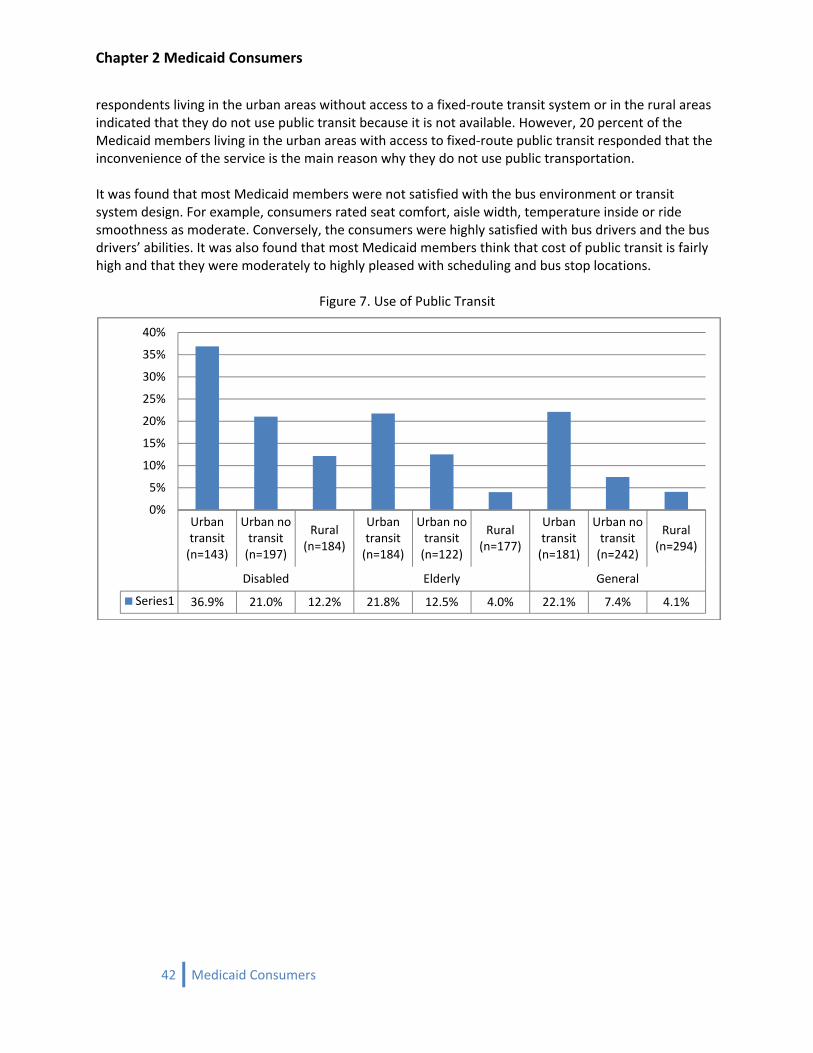
Chapter 2 Medicaid Consumers
respondents living in the urban areas without access to a fixed‐route transit system or in the rural areas indicated that they do not use public transit because it is not available. However, 20 percent of the Medicaid members living in the urban areas with access to fixed‐route public transit responded that the inconvenience of the service is the main reason why they do not use public transportation. It was found that most Medicaid members were not satisfied with the bus environment or transit system design. For example, consumers rated seat comfort, aisle width, temperature inside or ride smoothness as moderate. Conversely, the consumers were highly satisfied with bus drivers and the bus drivers’ abilities. It was also found that most Medicaid members think that cost of public transit is fairly high and that they were moderately to highly pleased with scheduling and bus stop locations.
Figure 7. Use of Public Transit
Urban transit (n=143)
Urban no transit (n=197)
Rural (n=184)
Urban transit (n=184)
Urban no transit (n=122)
Rural (n=177)
Urban transit (n=181)
Urban no transit (n=242)
Rural (n=294)
Disabled Elderly General
Series1 36.9% 21.0% 12.2% 21.8% 12.5% 4.0% 22.1% 7.4% 4.1%
0%
5%
10%
15%
20%
25%
30%
35%
40%
42 Medicaid Consumers
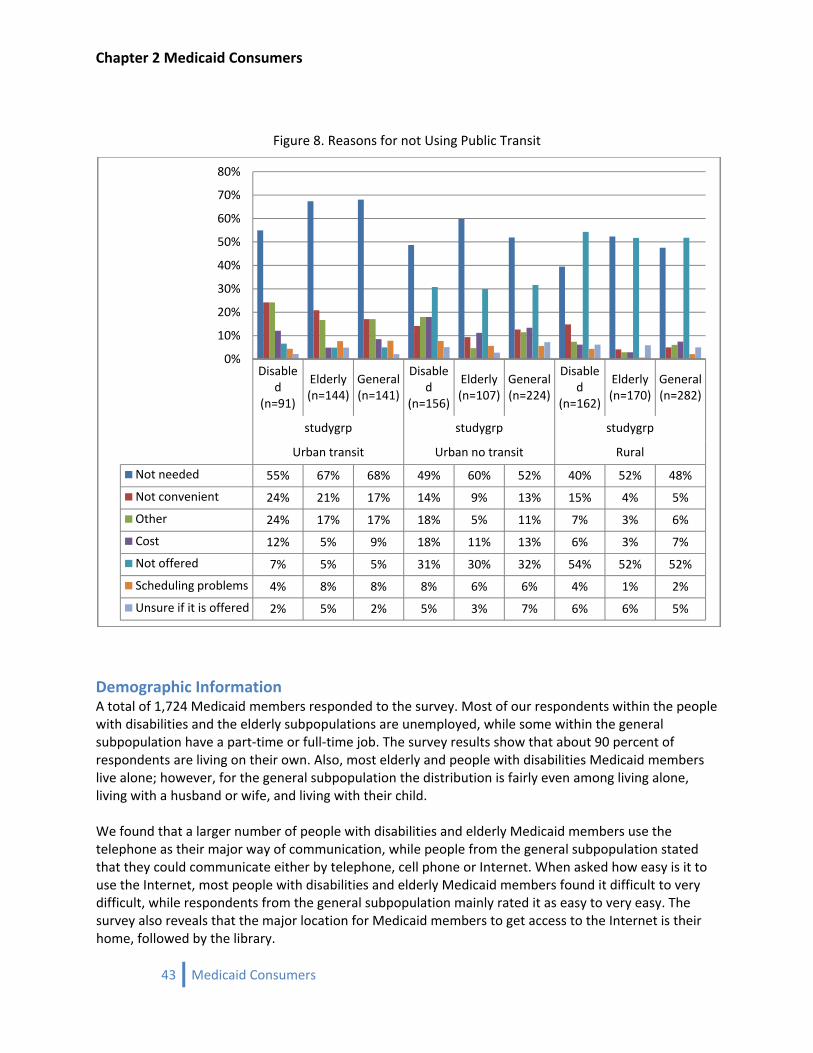
Chapter 2 Medicaid Consumers
Figure 8. Reasons for not Using Public Transit
Disabled
(n=91)
Elderly (n=144)
General (n=141)
Disabled
(n=156)
Elderly (n=107)
General (n=224)
Disabled
(n=162)
Elderly (n=170)
General (n=282)
studygrp studygrp studygrp
Urban transit Urban no transit Rural
Not needed 55% 67% 68% 49% 60% 52% 40% 52% 48%
Not convenient 24% 21% 17% 14% 9% 13% 15% 4% 5%
Other 24% 17% 17% 18% 5% 11% 7% 3% 6%
Cost 12% 5% 9% 18% 11% 13% 6% 3% 7%
Not offered 7% 5% 5% 31% 30% 32% 54% 52% 52%
Scheduling problems 4% 8% 8% 8% 6% 6% 4% 1% 2%
Unsure if it is offered 2% 5% 2% 5% 3% 7% 6% 6% 5%
0%
10%
20%
30%
40%
50%
60%
70%
80%
Demographic Information A total of 1,724 Medicaid members responded to the survey. Most of our respondents within the people with disabilities and the elderly subpopulations are unemployed, while some within the general subpopulation have a part‐time or full‐time job. The survey results show that about 90 percent of respondents are living on their own. Also, most elderly and people with disabilities Medicaid members live alone; however, for the general subpopulation the distribution is fairly even among living alone, living with a husband or wife, and living with their child. We found that a larger number of people with disabilities and elderly Medicaid members use the telephone as their major way of communication, while people from the general subpopulation stated that they could communicate either by telephone, cell phone or Internet. When asked how easy is it to use the Internet, most people with disabilities and elderly Medicaid members found it difficult to very difficult, while respondents from the general subpopulation mainly rated it as easy to very easy. The survey also reveals that the major location for Medicaid members to get access to the Internet is their home, followed by the library.
43 Medicaid Consumers
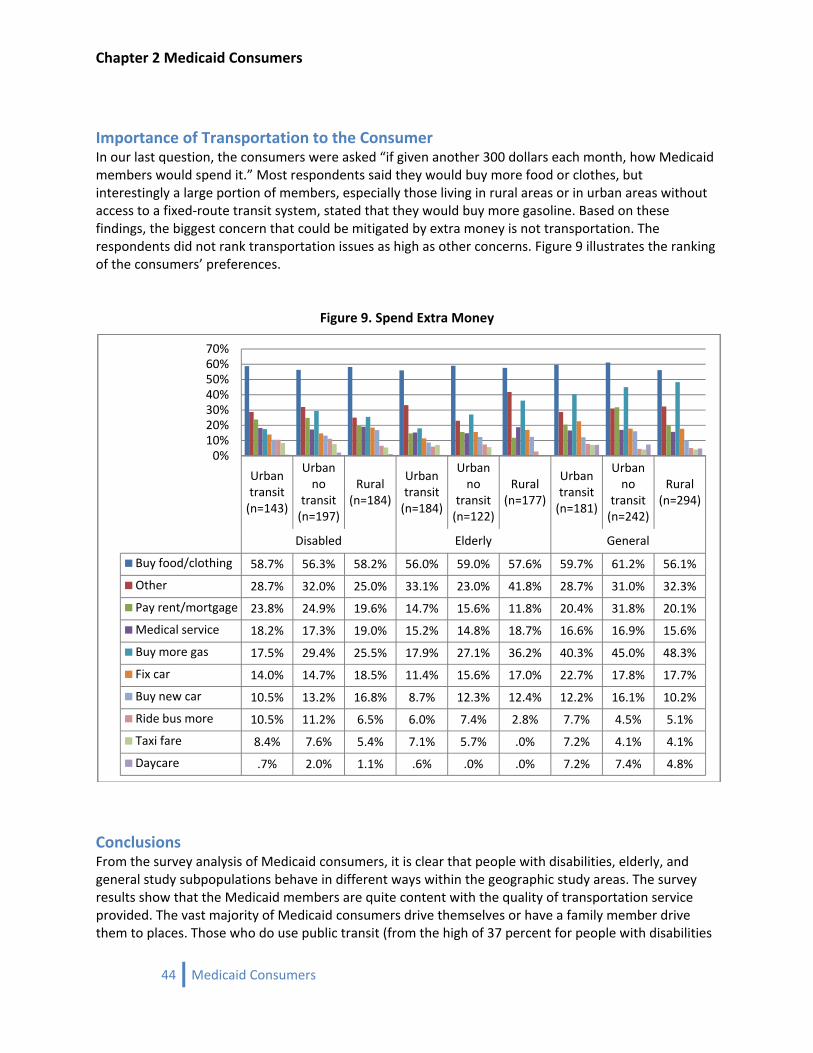
Chapter 2 Medicaid Consumers
Importance of Transportation to the Consumer In our last question, the consumers were asked “if given another 300 dollars each month, how Medicaid members would spend it.” Most respondents said they would buy more food or clothes, but interestingly a large portion of members, especially those living in rural areas or in urban areas without access to a fixed‐route transit system, stated that they would buy more gasoline. Based on these findings, the biggest concern that could be mitigated by extra money is not transportation. The respondents did not rank transportation issues as high as other concerns. Figure 9 illustrates the ranking of the consumers’ preferences.
Figure 9. Spend Extra Money
Urban transit (n=143)
Urban no
transit (n=197)
Rural (n=184)
Urban transit (n=184)
Urban no
transit (n=122)
Rural (n=177)
Urban transit (n=181)
Urban no
transit (n=242)
Rural (n=294)
Disabled Elderly General
Buy food/clothing 58.7% 56.3% 58.2% 56.0% 59.0% 57.6% 59.7% 61.2% 56.1%
Other 28.7% 32.0% 25.0% 33.1% 23.0% 41.8% 28.7% 31.0% 32.3%
Pay rent/mortgage 23.8% 24.9% 19.6% 14.7% 15.6% 11.8% 20.4% 31.8% 20.1%
Medical service 18.2% 17.3% 19.0% 15.2% 14.8% 18.7% 16.6% 16.9% 15.6%
Buy more gas 17.5% 29.4% 25.5% 17.9% 27.1% 36.2% 40.3% 45.0% 48.3%
Fix car 14.0% 14.7% 18.5% 11.4% 15.6% 17.0% 22.7% 17.8% 17.7%
Buy new car 10.5% 13.2% 16.8% 8.7% 12.3% 12.4% 12.2% 16.1% 10.2%
Ride bus more 10.5% 11.2% 6.5% 6.0% 7.4% 2.8% 7.7% 4.5% 5.1%
Taxi fare 8.4% 7.6% 5.4% 7.1% 5.7% .0% 7.2% 4.1% 4.1%
Daycare .7% 2.0% 1.1% .6% .0% .0% 7.2% 7.4% 4.8%
0%10%20%30%40%50%60%70%
Conclusions From the survey analysis of Medicaid consumers, it is clear that people with disabilities, elderly, and general study subpopulations behave in different ways within the geographic study areas. The survey results show that the Medicaid members are quite content with the quality of transportation service provided. The vast majority of Medicaid consumers drive themselves or have a family member drive them to places. Those who do use public transit (from the high of 37 percent for people with disabilities
44 Medicaid Consumers
Chapter 2 Medicaid Consumers
in urban areas with access to fixed‐route transit to a low of 4 percent for rural elderly) stated that they can always find public transportation available on the days and times they need it. The other striking theme that came out from this analysis is the lack of education about Medicaid rules among consumers. A near majority (43 percent) of Medicaid consumers are unaware of the fact that their trips can be reimbursed. The members (especially the people with disabilities) have a fairly good opinion of the Medicaid workers’ ability to arrange transportation, but they are quite unaware of the overall process and reimbursement procedures.
45 Medicaid Consumers

Chapter 2 Medicaid Consumers
46 Medicaid Consumers
Chapter 3 Income Maintenance Workers
Chapter 3 Income Maintenance Workers
47 Income Maintenance Workers

Chapter 3 Income Maintenance Workers
48 Income Maintenance Workers
Chapter 3 Income Maintenance Workers
49 Income Maintenance Workers
Medicaid Income Maintenance Worker Survey The Income Maintenance (IM) workers were invited to complete an on‐line questionnaire to assess their roles, experiences, and opinions on medical and non‐medical non‐emergency transportation. As defined in the Iowa Department of Human Services’ Employee Handbook, “[i]ncome maintenance workers determine eligibility for access to programs and services for families who need assistance in meeting basic needs for food, clothing, shelter, and medical care. Staff determine eligibility for the Family Investment Program (FIP), Food Assistance (formerly known as Food Stamps), Medical Services (Medicaid Title XIX), and Child Care Assistance. IM staff interview clients, verify the economic situation and service needs, determine benefit eligibility, and make program referrals.”11 Specific to transportation the IM worker is responsible for verifying: 1) consumers’ eligibility for transportation services, 2) if the trip is medically necessary, 3) the lowest cost mode that is most appropriate to meet the consumers’ needs, 4) if the trip is outside the consumers’ community for those on the state plan, 5) verify whether the trip was taken. The IM workers also process trip reimbursement claims. Invitations were distributed by email by the IM supervisors to each IM worker with two follow‐up reminders. In the questionnaire, the numbers of contacts they receive within a week’s time from Medicaid consumers for non‐emergency transportation, the performance of tasks related to these requests, and the processing of claims for reimbursement were solicited. They were also asked about their perceptions of how adequate the current transportation systems are for meeting the consumers’ needs. The questionnaire is located in Appendix 2 along with a complete descriptive analysis for each question. The number of IM workers that responded to the questionnaire was 446, which was a response rate of 59 percent (as of November 2007 there were a total of 758 IM workers employed by the Department of Human Services).12 Based on all those completing a questionnaire, the distribution of responding IM worker locations around the state are shown in Map 4. As shown, the number of IM workers is more concentrated in the urbanized counties, with some counties lacking responses. Non‐responding counties are located in west central Iowa, northern Iowa, and southern Iowa.
11DHS. (2006) Employee Handbook Iowa Department of Human Services, Des Moines, IA (http://www.dhs.state.ia.us/docs/Iowa%20DHS%20Employee%20Handbook%20October%202006.pdf)
12Department of Administrative Services. (2007) Salary Book Department of Administrative Services, Iowa Legislature General Assembly. Des Moines, IA (http://www.legis.state.ia.us/Fiscal/salbook/)
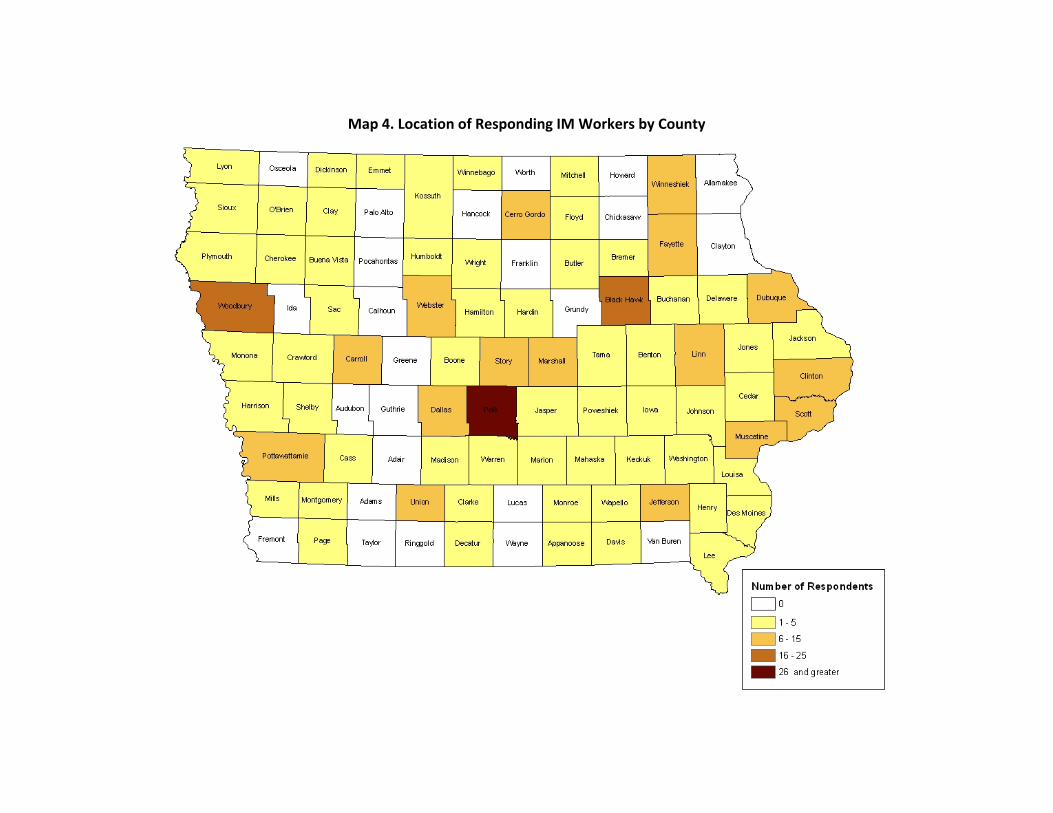
Map 4. Location of Responding IM Workers by County
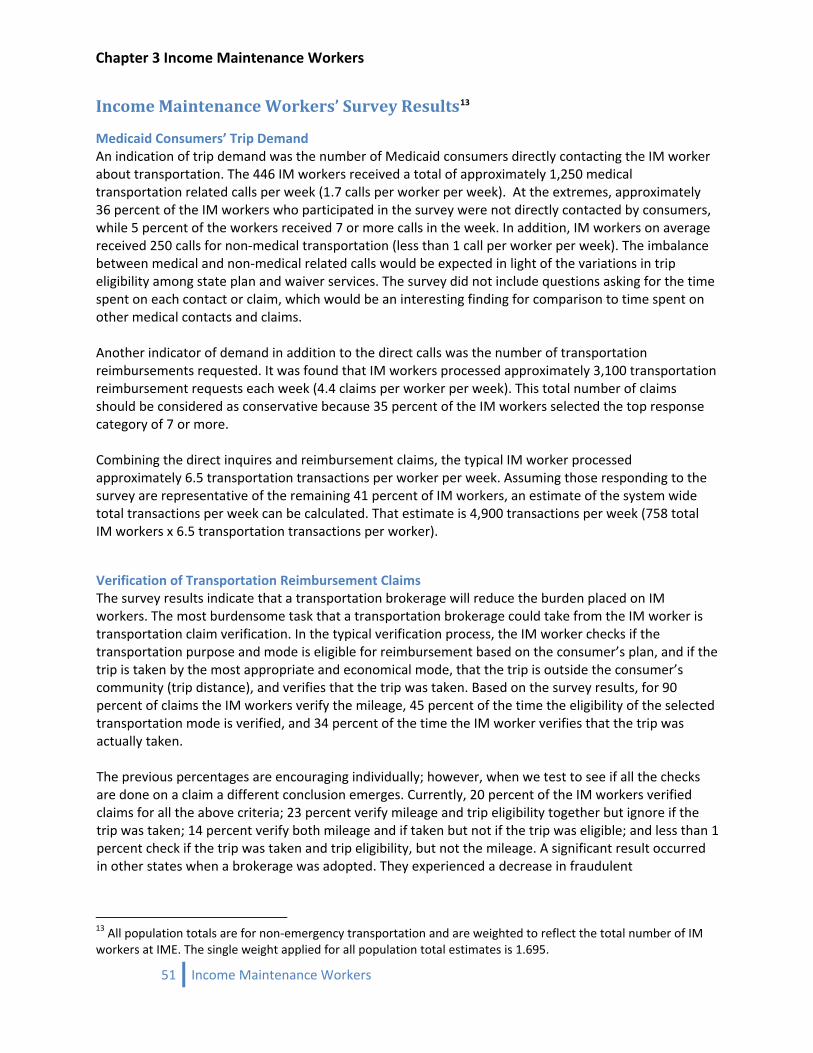
Chapter 3 Income Maintenance Workers
51 Income Maintenance Workers
Income Maintenance Workers’ Survey Results13
Medicaid Consumers’ Trip Demand An indication of trip demand was the number of Medicaid consumers directly contacting the IM worker about transportation. The 446 IM workers received a total of approximately 1,250 medical transportation related calls per week (1.7 calls per worker per week). At the extremes, approximately 36 percent of the IM workers who participated in the survey were not directly contacted by consumers, while 5 percent of the workers received 7 or more calls in the week. In addition, IM workers on average received 250 calls for non‐medical transportation (less than 1 call per worker per week). The imbalance between medical and non‐medical related calls would be expected in light of the variations in trip eligibility among state plan and waiver services. The survey did not include questions asking for the time spent on each contact or claim, which would be an interesting finding for comparison to time spent on other medical contacts and claims. Another indicator of demand in addition to the direct calls was the number of transportation reimbursements requested. It was found that IM workers processed approximately 3,100 transportation reimbursement requests each week (4.4 claims per worker per week). This total number of claims should be considered as conservative because 35 percent of the IM workers selected the top response category of 7 or more. Combining the direct inquires and reimbursement claims, the typical IM worker processed approximately 6.5 transportation transactions per worker per week. Assuming those responding to the survey are representative of the remaining 41 percent of IM workers, an estimate of the system wide total transactions per week can be calculated. That estimate is 4,900 transactions per week (758 total IM workers x 6.5 transportation transactions per worker).
Verification of Transportation Reimbursement Claims The survey results indicate that a transportation brokerage will reduce the burden placed on IM workers. The most burdensome task that a transportation brokerage could take from the IM worker is transportation claim verification. In the typical verification process, the IM worker checks if the transportation purpose and mode is eligible for reimbursement based on the consumer’s plan, and if the trip is taken by the most appropriate and economical mode, that the trip is outside the consumer’s community (trip distance), and verifies that the trip was taken. Based on the survey results, for 90 percent of claims the IM workers verify the mileage, 45 percent of the time the eligibility of the selected transportation mode is verified, and 34 percent of the time the IM worker verifies that the trip was actually taken. The previous percentages are encouraging individually; however, when we test to see if all the checks are done on a claim a different conclusion emerges. Currently, 20 percent of the IM workers verified claims for all the above criteria; 23 percent verify mileage and trip eligibility together but ignore if the trip was taken; 14 percent verify both mileage and if taken but not if the trip was eligible; and less than 1 percent check if the trip was taken and trip eligibility, but not the mileage. A significant result occurred in other states when a brokerage was adopted. They experienced a decrease in fraudulent
13 All population totals are for non‐emergency transportation and are weighted to reflect the total number of IM workers at IME. The single weight applied for all population total estimates is 1.695.
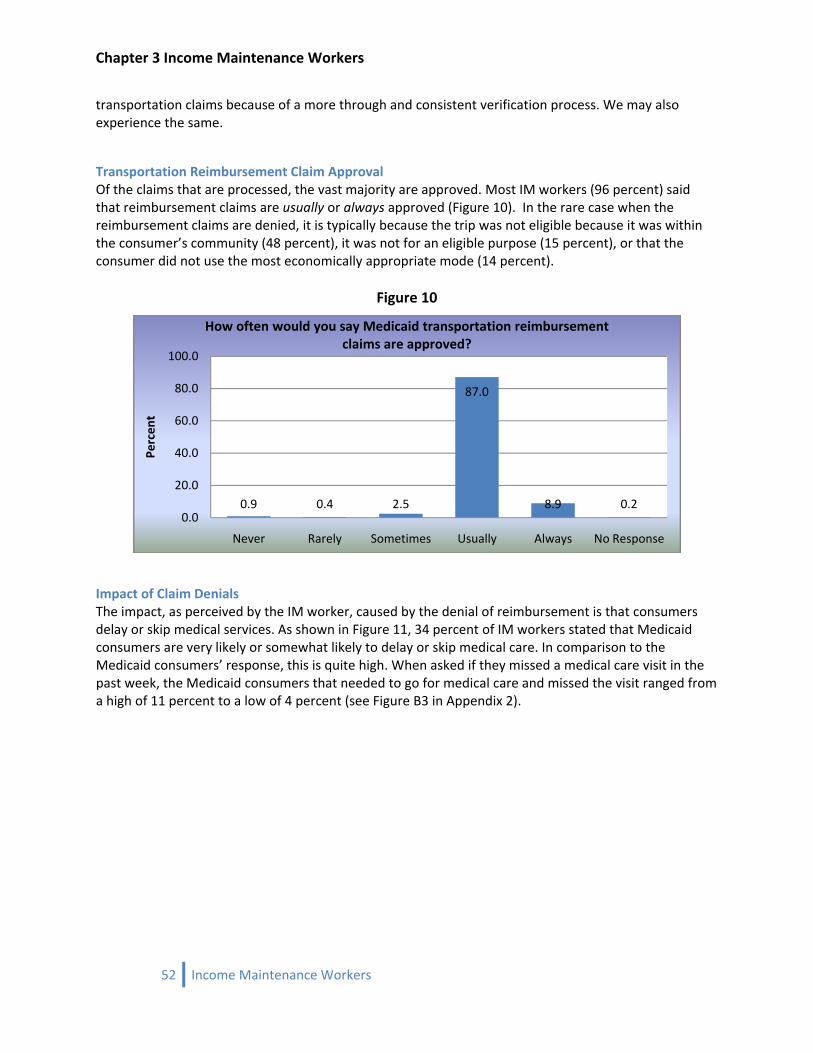
Chapter 3 Income Maintenance Workers
transportation claims because of a more through and consistent verification process. We may also experience the same.
Transportation Reimbursement Claim Approval Of the claims that are processed, the vast majority are approved. Most IM workers (96 percent) said that reimbursement claims are usually or always approved (Figure 10). In the rare case when the reimbursement claims are denied, it is typically because the trip was not eligible because it was within the consumer’s community (48 percent), it was not for an eligible purpose (15 percent), or that the consumer did not use the most economically appropriate mode (14 percent).
Figure 10
0.9 0.4 2.5
87.0
8.9 0.20.0
20.0
40.0
60.0
80.0
100.0
Never Rarely Sometimes Usually Always No Response
Percen
t
How often would you say Medicaid transportation reimbursement claims are approved?
Impact of Claim Denials The impact, as perceived by the IM worker, caused by the denial of reimbursement is that consumers delay or skip medical services. As shown in Figure 11, 34 percent of IM workers stated that Medicaid consumers are very likely or somewhat likely to delay or skip medical care. In comparison to the Medicaid consumers’ response, this is quite high. When asked if they missed a medical care visit in the past week, the Medicaid consumers that needed to go for medical care and missed the visit ranged from a high of 11 percent to a low of 4 percent (see Figure B3 in Appendix 2).
52 Income Maintenance Workers
Chapter 3 Income Maintenance Workers
Figure 11
8.9
25.3 20.8 21.5 21.3
2.20.0
10.020.030.040.050.060.070.080.090.0100.0
Very likely Somewhat likely
Neutral Somewhat unlikely
Very unlikely No Response
Percen
tHow likely are Medicaid members to delay or skip medical care as a result of being told that transportation to that care will not be reimbursable?
Perception of Transportation Service The IM workers were given a chance to comment on the state of transportation services. Understanding that the transportation system is complex, the IM workers rated their ability to assist Medicaid consumers. In addition, IM workers were asked for their perception of Medicaid consumers’ knowledge of the rules governing transportation eligibility. A startling near majority of IM workers rated their ability to help arrange transportation as “poor” (49 percent), as opposed to “fair” (28 percent), and “good to excellent” (24 percent). They rated consumers’ knowledge as moderate (48 percent), high to very high (29 percent), and low to very low (24 percent). Comparing the IM workers’ ability and consumers’ knowledge, we found a statistically strong, positive relationship between the two. That is, the higher IM workers rated their ability to assist consumers the higher the level of knowledge assigned to the consumer. This indicates that a program targeting the education of the Medicaid consumers on the rules will lead to an increase in IM worker ability to assist with transportation. IM workers were also asked to rate their experience with transportation within their county(ies). The majority, 52 percent, stated that none to a small part of medical transportation needs are met, whereas 23 percent state most to all medical transportation needs are met. Similar percentages were found for non‐medical transportation. Forty‐eight percent stated none to a small part of the need is met, and 22 percent stated that most to all needs are met. From the IM workers’ view, they perceive their ability to assist with medical trips increases as the transportation system’s adequacy increases. However, there is no significant pattern when IM worker perception regarding the ability to assist with non‐medical trips is checked against the transportation system’s adequacy. These results are explained by the IM workers’ lack of experience with non‐medical trips and the variations in trip eligibility among state plan and waiver services. Only a few waiver services include non‐medical transportation.
53 Income Maintenance Workers
Chapter 3 Income Maintenance Workers
54 Income Maintenance Workers
Conclusion The web‐based survey generated 446 responses, which was a response rate of 59 percent. From the responses, the average number of contacts regarding medical transportation was 1.7 calls per worker per week. In addition, IM workers on average received 250 calls for non‐medical transportation (less than 1 call per worker per week). IM workers also reported processing about 4.4 reimbursement claims per worker per week. The survey did not include questions asking for the time spent on each contact or claim, which would be an interesting finding for comparison to time spent on other medical contacts and claims. A transportation brokerage will reduce the burden placed on IM workers. The largest burdensome task that a transportation brokerage could take from the IM worker is transportation claim verification. Removing the burden from the IM for processing transportation claims would allow them to focus more on medical services. It would also help reduce fraud and abuse within the system based on the findings that only 20 percent of the IM workers verified claims for member eligibility, trip eligibility, if trip was taken, distance, and if the most appropriate mode was selected.
Chapter 4 Case Managers and Service Workers
Chapter 4 Case Managers and Service Workers
55 Case Managers and Service Workers

Chapter 4 Case Managers and Service Workers
56 Case Managers and Service Workers
Chapter 4 Case Managers and Service Workers
57 Case Managers and Service Workers
Case Managers and Service Workers Survey Case Managers (CM) and Service Workers (SW) were invited to complete an on‐line questionnaire to assess their roles, experiences, and opinions on medical and non‐medical non‐emergency transportation within each of the seven Medicaid waivers and four services.14 The CM/SW perspective was sought because of their close and continuing interaction with Medicaid consumers, which provides deeper insight into the consumers’ transportation needs than can the Income Maintenance (IM) workers. The roles of CMs/SWs and IM workers are important to the provision of services to Medicaid consumers. However, the relationship between CMs/SWs is typically long‐term unlike the IM workers. As stated by the Iowa Department of Human Services, “[Case management], [w]hile definitions and models vary greatly, must have some element of responsibility for client services, continuity of care, and accountability for service provision and coordination.”15 Typically, “[c]ase management is a service provided by human service agencies to manage multiple resources effectively for the benefit of Medicaid [consumers]. Case management services assist recipients in gaining access to appropriate and needed medical and interrelated social and educational services. The goal of case management is to ensure that: necessary evaluations are conducted; individual services and treatment plans are developed, implemented, monitored, and modified as necessary; and reassessment of [consumer] needs and service provision occurs on an ongoing and regular basis (but no less frequently than annually).”16 IME case manager supervisors distributed the survey invitation by email with two follow‐up reminders. In the questionnaire, the numbers of contacts they receive from Medicaid consumers for non‐emergency transportation and the performance of tasks related to these requests were solicited. The CMs/SWs were also asked about their perceptions of how adequate the current transportation systems are for meeting the consumers’ needs. A total of 328 CMs/SWs responded to the survey. The total number of respondents was comprised of 201 case managers, 93 service workers, and 25 people categorized as other workers (social workers and case management supervisors).17 Much like IM workers, CMs and SWs that responded were concentrated in Iowa’s urbanized counties (Map 5). The distribution of Medicaid consumers is also shown in Map 6 to provide a point of comparison. Comparing the two, there is a fairly good match between the concentration of Medicaid consumers and CM/SW respondents. The CMs/SWs who responded to the survey were directed to provide information regarding Medicaid members under their direct management. For example, if a CM is responsible for members within two waiver programs they were to provide information regarding only those two waiver programs and to leave the others blank. Therefore, the total number of responders within each waiver type and service program varies. It is also important for the interpretation of the results, especially when waiver types are compared to one another, that transportation coverage varies from one waiver type to another.
14 The seven waivers are Aids/HIV, Brain Injury, Children’s Mental Health, Elderly, Ill & Handicapped, Mental Retardation, and Physical Disability. The four services are Foster Care, Habilitation Services, Remedial Services, and Early Prevention, Screening Diagnosis and Treatment (PSDT).
15 DHS (2007) “Crisis Counseling Programs Mission.” Iowa Department of Human Services, Des Moines, IA website http://www.dhs.state.ia.us/mhdd/disaster_response/cc_mission.html#search='case%20managers%20'
16 DHS (2003) MR/CMI/DD CASE MANAGEMENT Iowa Department of Human Services, Des Moines, IA. 17 A response rate could not be calculated due to IME not having knowledge of the total number of CW and SW employed.

Chapter 4 Case Managers and Service Workers
58 Case Managers and Service Workers
Under the current Medicaid rules, transportation services beyond those offered in the state plan are available under Brain Injury, Children’s Mental Health, Elderly, Mental Retardation, and Physical Disability, but not Aids/HIV and Ill & Handicapped IH waivers.18 Non‐emergency medical transportation services under the state plan include cost reimbursement for necessary trips for the purpose of obtaining medical care and trips to pharmacies that are outside the consumer’s Medicaid defined community. A reason for including all waiver types and the four service programs despite the differing inclusion of transportation services is to allow for relative demand estimates. That is, should the enrollment or transportation services change within a waiver type, one could make reasonable percent utilization estimates based on existing rates within other waivers.
18 DHS (2002) “Medicaid Waiver Services Employees’ Manual, Title 16, Chapter K. (revised 2003)” page 5. Iowa Department of Human Services, Des Moines IA.
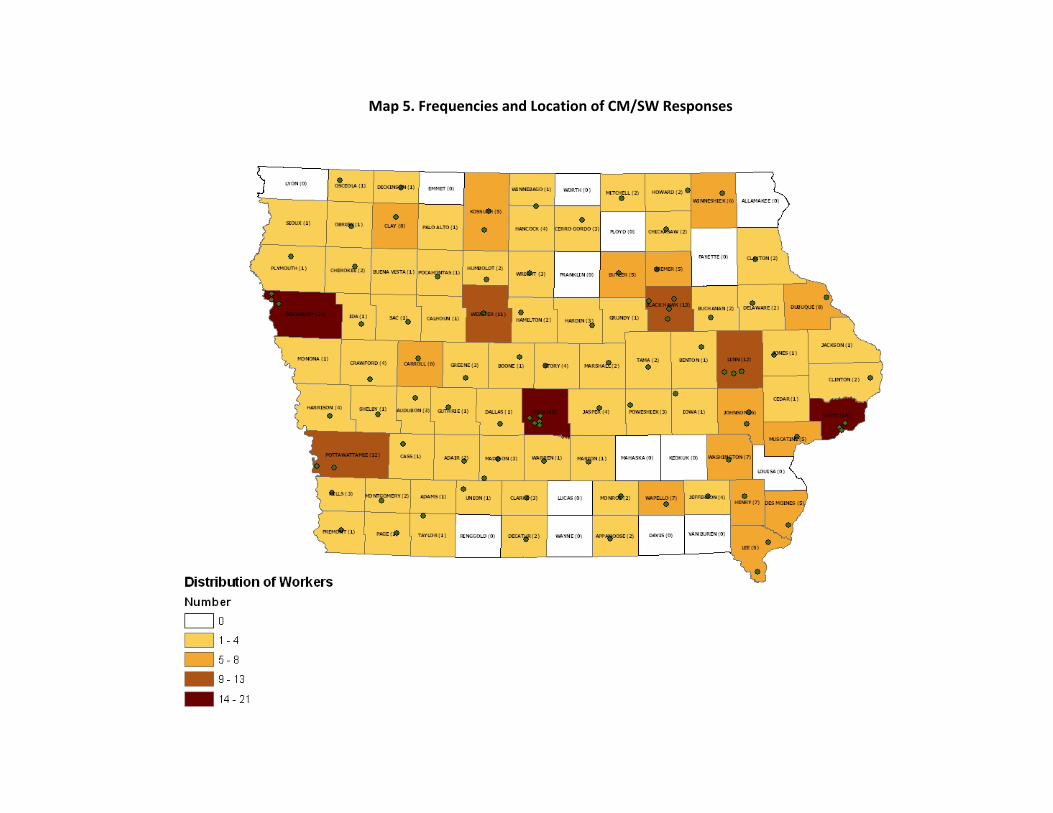
Map 5. Frequencies and Location of CM/SW Responses
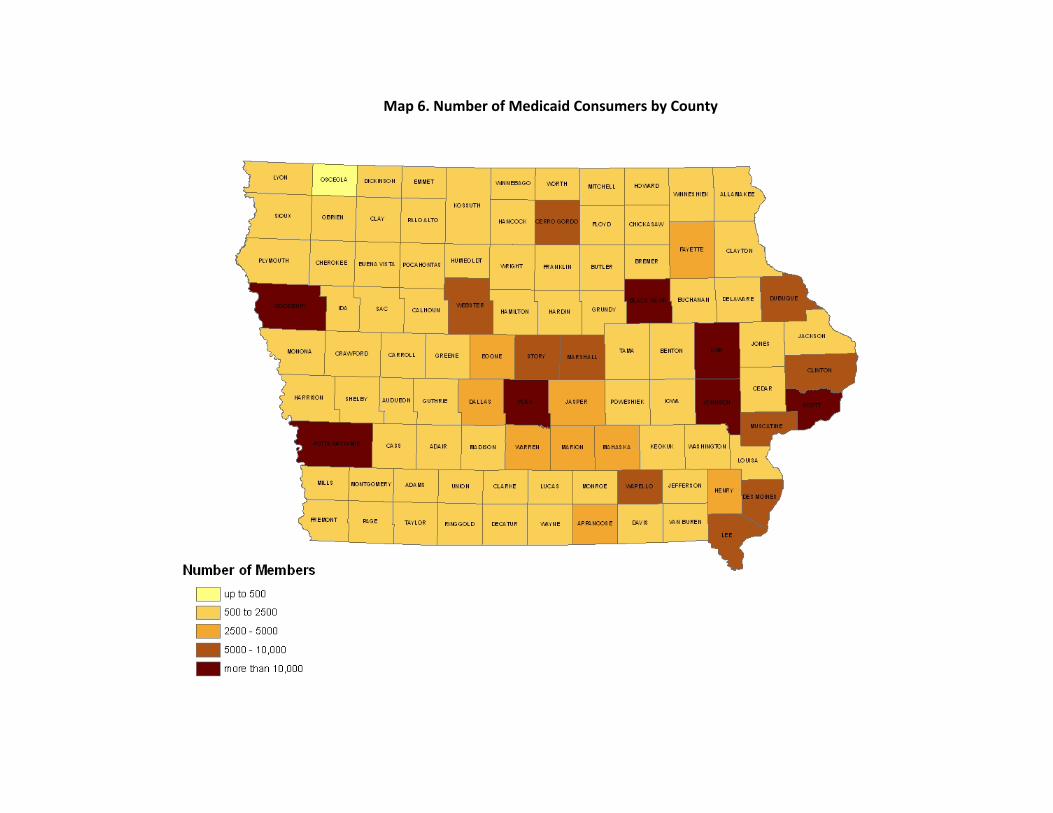
Map 6. Number of Medicaid Consumers by County
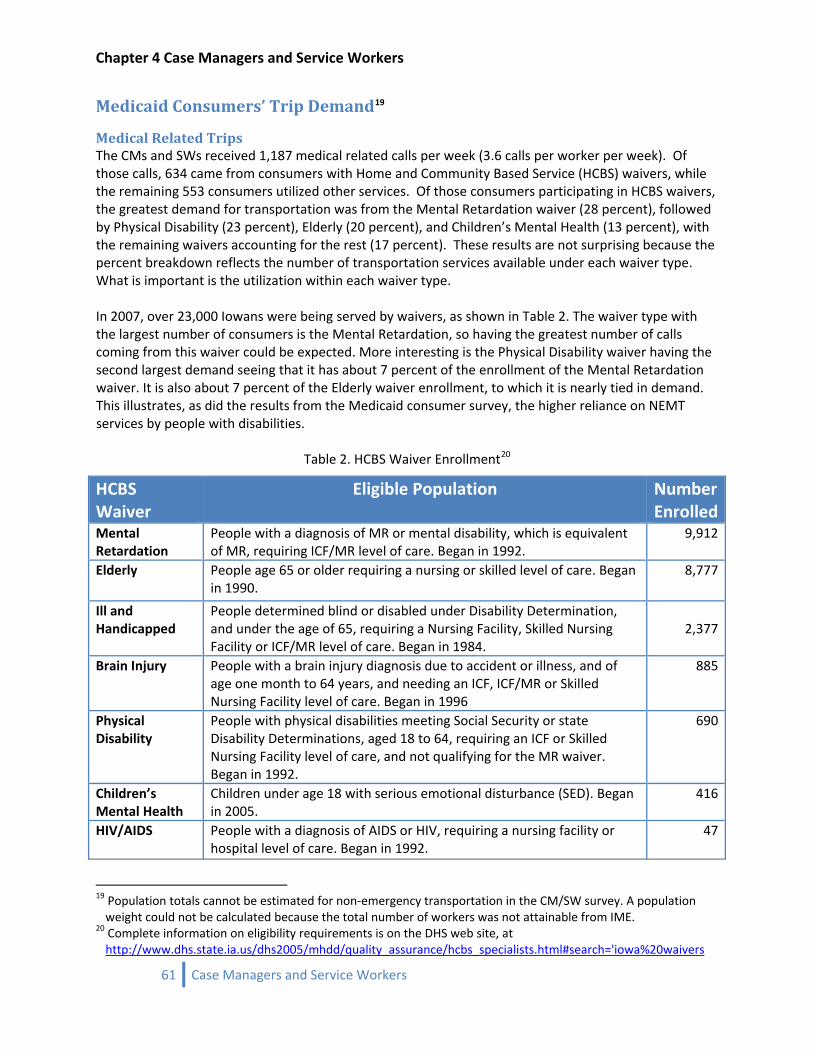
Chapter 4 Case Managers and Service Workers
61 Case Managers and Service Workers
Medicaid Consumers’ Trip Demand19
Medical Related Trips The CMs and SWs received 1,187 medical related calls per week (3.6 calls per worker per week). Of those calls, 634 came from consumers with Home and Community Based Service (HCBS) waivers, while the remaining 553 consumers utilized other services. Of those consumers participating in HCBS waivers, the greatest demand for transportation was from the Mental Retardation waiver (28 percent), followed by Physical Disability (23 percent), Elderly (20 percent), and Children’s Mental Health (13 percent), with the remaining waivers accounting for the rest (17 percent). These results are not surprising because the percent breakdown reflects the number of transportation services available under each waiver type. What is important is the utilization within each waiver type. In 2007, over 23,000 Iowans were being served by waivers, as shown in Table 2. The waiver type with the largest number of consumers is the Mental Retardation, so having the greatest number of calls coming from this waiver could be expected. More interesting is the Physical Disability waiver having the second largest demand seeing that it has about 7 percent of the enrollment of the Mental Retardation waiver. It is also about 7 percent of the Elderly waiver enrollment, to which it is nearly tied in demand. This illustrates, as did the results from the Medicaid consumer survey, the higher reliance on NEMT services by people with disabilities.
Table 2. HCBS Waiver Enrollment20
HCBS Waiver
Eligible Population
NumberEnrolled
Mental Retardation
People with a diagnosis of MR or mental disability, which is equivalent of MR, requiring ICF/MR level of care. Began in 1992.
9,912
Elderly People age 65 or older requiring a nursing or skilled level of care. Began in 1990.
8,777
Ill and Handicapped
People determined blind or disabled under Disability Determination, and under the age of 65, requiring a Nursing Facility, Skilled Nursing Facility or ICF/MR level of care. Began in 1984.
2,377
Brain Injury People with a brain injury diagnosis due to accident or illness, and of age one month to 64 years, and needing an ICF, ICF/MR or Skilled Nursing Facility level of care. Began in 1996
885
Physical Disability
People with physical disabilities meeting Social Security or state Disability Determinations, aged 18 to 64, requiring an ICF or Skilled Nursing Facility level of care, and not qualifying for the MR waiver. Began in 1992.
690
Children’s Mental Health
Children under age 18 with serious emotional disturbance (SED). Began in 2005.
416
HIV/AIDS People with a diagnosis of AIDS or HIV, requiring a nursing facility or hospital level of care. Began in 1992.
47
19 Population totals cannot be estimated for non‐emergency transportation in the CM/SW survey. A population weight could not be calculated because the total number of workers was not attainable from IME.
20 Complete information on eligibility requirements is on the DHS web site, at http://www.dhs.state.ia.us/dhs2005/mhdd/quality_assurance/hcbs_specialists.html#search='iowa%20waivers

Chapter 4 Case Managers and Service Workers
62 Case Managers and Service Workers
Demand for medical related trips from the consumers within the other programs was distributed even more evenly. The demand from Foster Care (36 percent), Habilitation Services (33 percent), and Remedial Services (30 percent) were about the same. The EPSDT (1 percent) program was the lowest in demand.
Nonmedical Related Trips The survey analysis showed that CMs and SWs receive a similar number of non‐medical related calls as medical related ones. CMs and SWs received 1,220 non‐medical related calls from Medicaid consumers per week (3.7 calls per worker per week). Of those consumers participating in HCBS waivers, the greatest demands for transportation were from the Mental Retardation waiver (40 percent), followed by Elderly (20 percent), Child Mental Health and Brain Injury (both with 13 percent) waivers, with the remaining waivers accounting for the rest. A difference between non‐medical and medical related trips is a single waiver, Mental Retardation, which accounts for twice as many trips as the next largest. Another striking difference in demand is that the Physical Disability waiver decreased from 23 percent for medical related trips to 5 percent of non‐medical related trips. The above ranking is not too meaningful when viewed alone. However, when enrollment, allowable transportation services, and demand for medical care related trips are considered one could make reasonable percent utilization estimates. The enrollment and available services are nearly equivalent for the Mental Retardation and Elderly waiver, but the utilization rate is not. As stated above, those participating in the Mental Retardation waiver utilization rate is twice that of those participating in the Elderly waiver. Additionally, non‐medical related trips for the Mental Retardation waiver is 12 percent higher than for medical care related trips. Therefore, should a change such as streamlining how to secure transportation services for those in the Elderly waiver occur, one would expect a comparatively large increase in services demanded. Similarly for those participating in the Physically Disabled waiver, one would expect an increase in demand based on demand for medical care trips and available transportation services.
Table 3. Non‐medical Transportation Services21
HCBS Waiver Transportation Services Provided
Mental Retardation Conduct business errands Essential shopping Travel to and from work or day programs Reduce social isolation
Elderly Conduct business errands Essential shopping Reduce social isolation
Ill and Handicapped None Brain Injury Conduct business errands
Essential shopping Travel to and from work or day programs
21 DHS (2002) “Medicaid Waiver Services Employees’ Manual, Title 16, Chapter K. (revised 2003)” page 5. Iowa Department of Human Services, Des Moines IA
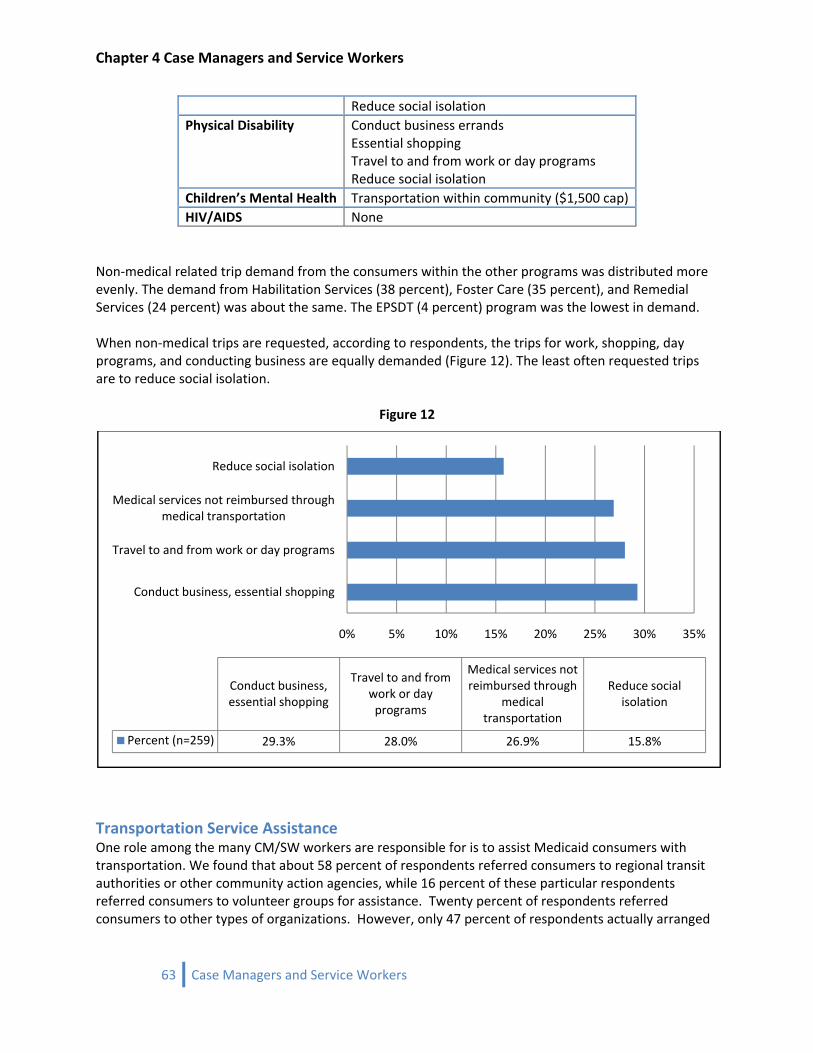
Chapter 4 Case Managers and Service Workers
Reduce social isolation Physical Disability Conduct business errands
Essential shopping Travel to and from work or day programs Reduce social isolation
Children’s Mental Health Transportation within community ($1,500 cap) HIV/AIDS None
Non‐medical related trip demand from the consumers within the other programs was distributed more evenly. The demand from Habilitation Services (38 percent), Foster Care (35 percent), and Remedial Services (24 percent) was about the same. The EPSDT (4 percent) program was the lowest in demand. When non‐medical trips are requested, according to respondents, the trips for work, shopping, day programs, and conducting business are equally demanded (Figure 12). The least often requested trips are to reduce social isolation.
Figure 12
0% 5% 10% 15% 20% 25% 30% 35%
Conduct business, essential shopping
Travel to and from work or day programs
Medical services not reimbursed through medical transportation
Reduce social isolation
Conduct business, essential shopping
Travel to and from work or day programs
Medical services not reimbursed through
medical transportation
Reduce social isolation
Percent (n=259) 29.3% 28.0% 26.9% 15.8%
Transportation Service Assistance One role among the many CM/SW workers are responsible for is to assist Medicaid consumers with transportation. We found that about 58 percent of respondents referred consumers to regional transit authorities or other community action agencies, while 16 percent of these particular respondents referred consumers to volunteer groups for assistance. Twenty percent of respondents referred consumers to other types of organizations. However, only 47 percent of respondents actually arranged
63 Case Managers and Service Workers

Chapter 4 Case Managers and Service Workers
the trips for the consumer, while only 33 percent assisted the Medicaid consumer in accessing reimbursement for a non‐medical related trip. Regarding the provision of transportation for Medicaid consumers, 62 percent of the CM/SW workers that responded identified the most economic and appropriate mode of transportation. Forty‐two percent referred the consumer to a provider, while 23 percent contacted the transportation provider themselves.
Consumers’ Knowledge of Medicaid Transportation Rules Each CM/SW was asked to rate their consumers’ understanding of the Medicaid rules for transportation. Very few respondents indicated that the consumers knew the rules well. The vast majority of those responding to the question stated either a low to very low level of knowledge. Seventy‐three percent of the CM/SW rated the knowledge of consumers within the Mental Retardation waiver as low to very low, while this waiver uses the greatest amount of transportation (see the previous discussion regarding the significance of enrollments in waivers). The pattern is similar to the IM workers’ evaluation; the level of knowledge is quite low.
CM/SW Perception of Public Transportation The CMs/SWs have a negative perception of the adequacy of public transportation to meet the medical transportation needs of Medicaid members. The largest percentage of respondents replied that public transportation “meets a small part” or “none” of consumers’ needs. The highest percentage within the “meets a small part” category falls within the Mental Retardation waiver. The same pattern holds for non‐medical needs. The most frequent response is “meets a small part of the needs.”
Impact of Reimbursement Denials CMs/SWs perceive a large percentage (47 percent) of Medicaid consumers to be likely to skip or delay medical services when the consumers are not reimbursed for the cost of their trips (Figure 13). This is higher than the IM workers’ perception. Thirty‐four percent of IM workers stated that the consumer is very likely or somewhat likely to skip or delay medical services. These are high estimates when compared to the Medicaid consumers’ responses. When asked how many times Medicaid consumers were unable to get to their medical care visits, about 95 percent of the members who needed to go said they never had any problems, and only about 6 percent said they missed their appointments one to three times due to the unavailability of transportation. The difference between the perception of the Medicaid workers and the experience of consumers could be due in part to only asking consumers about missed trips and not delayed trips, and to the possibilities that the Medicaid workers may be contacted by the most dependent consumers (those that are less self reliant for transportation), so the perception is not reflective of the total consumer population.
64 Case Managers and Service Workers
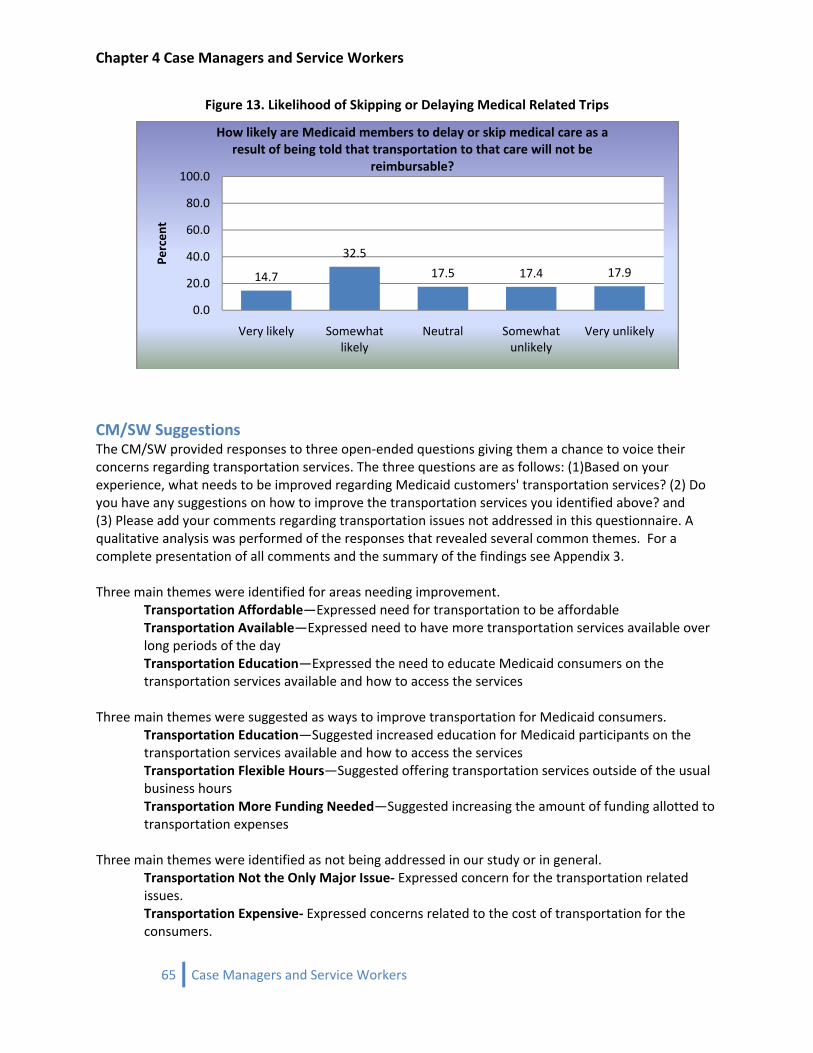
Chapter 4 Case Managers and Service Workers
Figure 13. Likelihood of Skipping or Delaying Medical Related Trips
14.7
32.5
17.5 17.4 17.9
0.0
20.0
40.0
60.0
80.0
100.0
Very likely Somewhat likely
Neutral Somewhat unlikely
Very unlikely
Percen
t
How likely are Medicaid members to delay or skip medical care as a result of being told that transportation to that care will not be
reimbursable?
CM/SW Suggestions The CM/SW provided responses to three open‐ended questions giving them a chance to voice their concerns regarding transportation services. The three questions are as follows: (1)Based on your experience, what needs to be improved regarding Medicaid customers' transportation services? (2) Do you have any suggestions on how to improve the transportation services you identified above? and (3) Please add your comments regarding transportation issues not addressed in this questionnaire. A qualitative analysis was performed of the responses that revealed several common themes. For a complete presentation of all comments and the summary of the findings see Appendix 3. Three main themes were identified for areas needing improvement.
Transportation Affordable—Expressed need for transportation to be affordable Transportation Available—Expressed need to have more transportation services available over long periods of the day Transportation Education—Expressed the need to educate Medicaid consumers on the transportation services available and how to access the services
Three main themes were suggested as ways to improve transportation for Medicaid consumers.
Transportation Education—Suggested increased education for Medicaid participants on the transportation services available and how to access the services Transportation Flexible Hours—Suggested offering transportation services outside of the usual business hours Transportation More Funding Needed—Suggested increasing the amount of funding allotted to transportation expenses
Three main themes were identified as not being addressed in our study or in general.
Transportation Not the Only Major Issue‐ Expressed concern for the transportation related issues. Transportation Expensive‐ Expressed concerns related to the cost of transportation for the consumers.
65 Case Managers and Service Workers
Chapter 4 Case Managers and Service Workers
66 Case Managers and Service Workers
Transportation Not Available‐ Expressed concern for lack of transportation services for individuals living in rural communities.
Allowing the CM/SW to respond in their own words has strengthened the study’s insight into the perspective of the Medicaid worker. Based on the recurring themes, it is clear that funding and affordability of transportation are concerns of the workers on behalf of the Medicaid consumer. They perceive that there is not enough funding within Medicaid to make transportation affordable to consumers. The other theme that is common within the responses is the limited availability of transportation outside regular business hours. Also quite interesting is that the CMs/SWs have identified low levels of understanding on the part of Medicaid consumers as to how to follow the programs’ rules. This theme is evident in the IM worker survey and the Medicaid consumer survey too.
Consumer Demand by Regional Transit Districts (RTD) and County Iowa has 16 regional transit districts, each of them covering from three to nine counties within their jurisdiction. Not surprisingly, the RTD with the highest amount of calls per week was RTD 11, which includes the city of Des Moines and its suburbs. Worth noting are the number of calls for RTD 14 and RTD 15. Regions 14 and 15 are shown as high demand regions, which is counterintuitive because these areas are mostly rural by Iowa standards (Map 7). This anomaly is explained in part by the policies adopted by these two RTDs. During a public presentation, the director of RTD 14 stated that they and RTD 15 require all Medicaid consumers to verify that the trip is eligible for reimbursement with a Medicaid worker prior to scheduling it. This insight is helpful in estimating the demand for NEMT. That is, by forcing the consumer to call before every trip is made reveals a value closer to the true demand. Within other districts, consumers may make trips without calling; therefore our results based on the number of calls in other rural districts may be too low.

Map 7. Average Number of Calls per Week (by RTD)

Chapter 4 Case Managers and Service Workers
The same demand (expressed in terms of number of calls per week) is then broken down at the county level. Again, more urbanized counties experience the highest amount of demand. However, Decatur County also experiences a high amount of calls from Medicaid consumers. Decatur County is located in southern Iowa, within RTD 14 (Map 8). As explained above, the higher expressed demand most likely is a result of the RTD policy that requires trip verification prior to scheduling a ride.
68 Case Managers and Service Workers
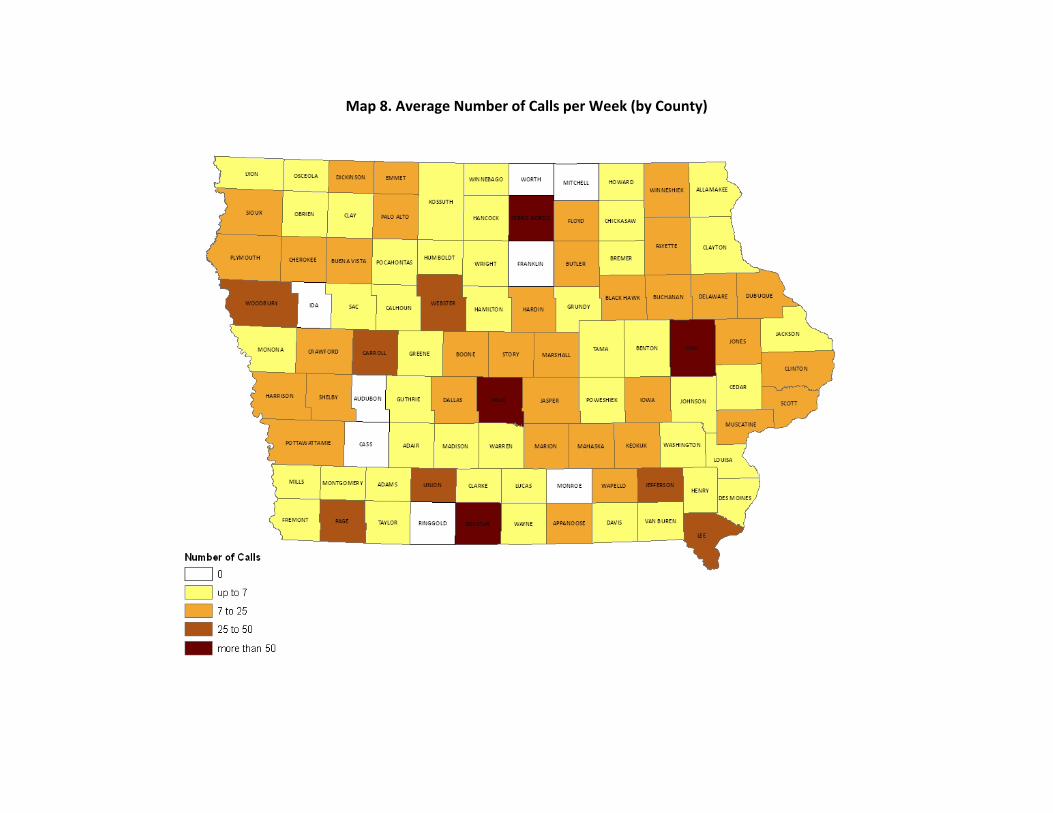
Map 8. Average Number of Calls per Week (by County)
Chapter 4 Case Managers and Service Workers
Conclusions A total of 328 CM/SWs responded to the survey. Within the total, there were 201 case managers, 93 service workers, and 25 other workers (social workers and case management supervisors). Based on the responses, CMs and SWs received 1,187 medical related calls per week (3.6 calls per worker per week). Of those calls, 634 come from consumers with Home and Community Based Service (HCBS) waivers, while the remaining 553 consumers utilize other services. Of those consumers within the HCBS programs, the greatest demand for transportation were from the Mental Retardation waiver (28 percent), followed by Physical Disability (23 percent), Elderly (20 percent), and Child Mental Health (13 percent), with the remaining waivers accounting for the rest (17 percent). The survey analysis showed that CMs and SWs receive a similar number of non‐medical related calls as medical‐related. CMs and SWs received 1,220 non‐medical related calls from Medicaid consumers per week (3.7 calls per worker per week). Of those consumers within the HCBS programs, the greatest demand for transportation were from the Mental Retardation waiver (40 percent), followed by Elderly (20 percent), and Child Mental Health and Brain Injury (both with 13 percent), with the remaining waivers accounting for the rest. The CM/SWs that responded to the open‐ended questions have made it clear that they are concerned about the lack of funding by Medicaid, affordability, lack of knowledge, and lack of off‐hour availability of transportation on behalf of the Medicaid consumer. Plainly, there are striking commonalities between the CM/SW and IM workers’ perceptions. They all have identified low levels of understanding on the part of Medicaid consumers as to how to follow the programs’ rules. The majority of them state that the transportation system meets only a small amount of the consumers’ needs. Another common perception is that Medicaid consumers are likely to delay or skip their medical care if there is no reimbursement for their trip.
70 Case Managers and Service Workers
Chapter 5 Transportation Providers
Chapter 5 Transportation Providers
71 Transportation Providers

Chapter 5 Transportation Providers
72 Transportation Providers
Chapter 5 Transportation Providers
73 Transportation Providers
Transportation Service Providers This section summarizes the results of two different surveys of the transportation service providers in the state of Iowa. One of the two surveys was for public transit agencies and the other one focused on private providers (including non‐government and volunteer organizations). The definition of private provider will include some private providers that contract with the public transit agencies to provide services. When possible the contracted private providers will be identified. The information collected in the surveys will help in benchmarking the existing Medicaid transportation demand and the supply of transportation services and determine the variance between them. Below is a summary that highlights the findings of these surveys.
Passenger Transportation Services Survey
Overview There are 35 public transit systems in the State of Iowa. Geographically, 16 of the systems are regional and 19 are urban‐based (Map 9). The 16 regional transit systems are organized into Regional Transit Authorities (RTA). The majority of RTAs provide demand‐responsive transit, while the urban‐based systems provide both demand‐responsive and fixed‐route services. Map 10 shows the extent of public transit services provided by individual RTAs. Urban transportation providers are located in Iowa’s larger communities. Some serve individual municipalities. For example, the Iowa City‐Coralville area has three separate urban transportation providers: Iowa City Transit, Coralville Transit Service, and the Cambus, which services the University of Iowa. Others, like the Des Moines Area Regional Transit Authority, serve a larger metropolitan region (in this case, Des Moines and its suburbs). Urban transportation agencies utilize both fixed‐route services, and in many cases, demand‐responsive service. In contrast, RTAs have wider service areas, seeking to serve smaller communities and rural residents in Iowa. RTAs fill the transportation niche that is not serviced by urban transportation agencies.
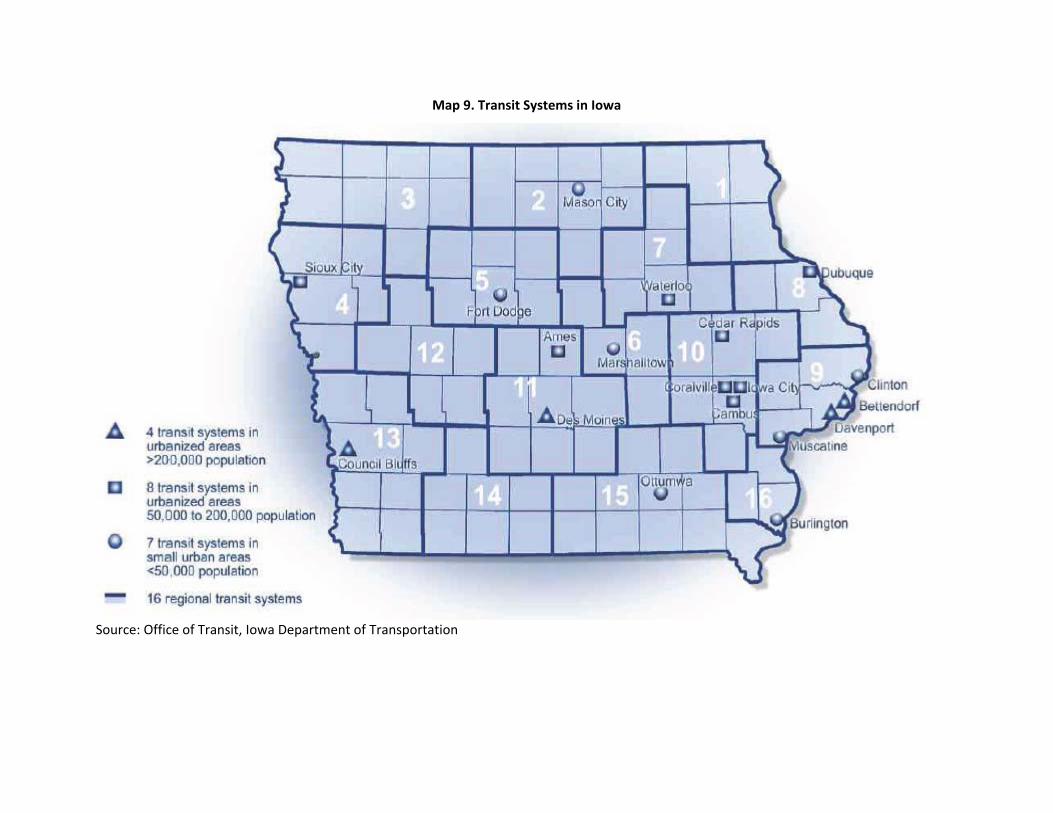
Map 9. Transit Systems in Iowa
Source: Office of Transit, Iowa Department of Transportation
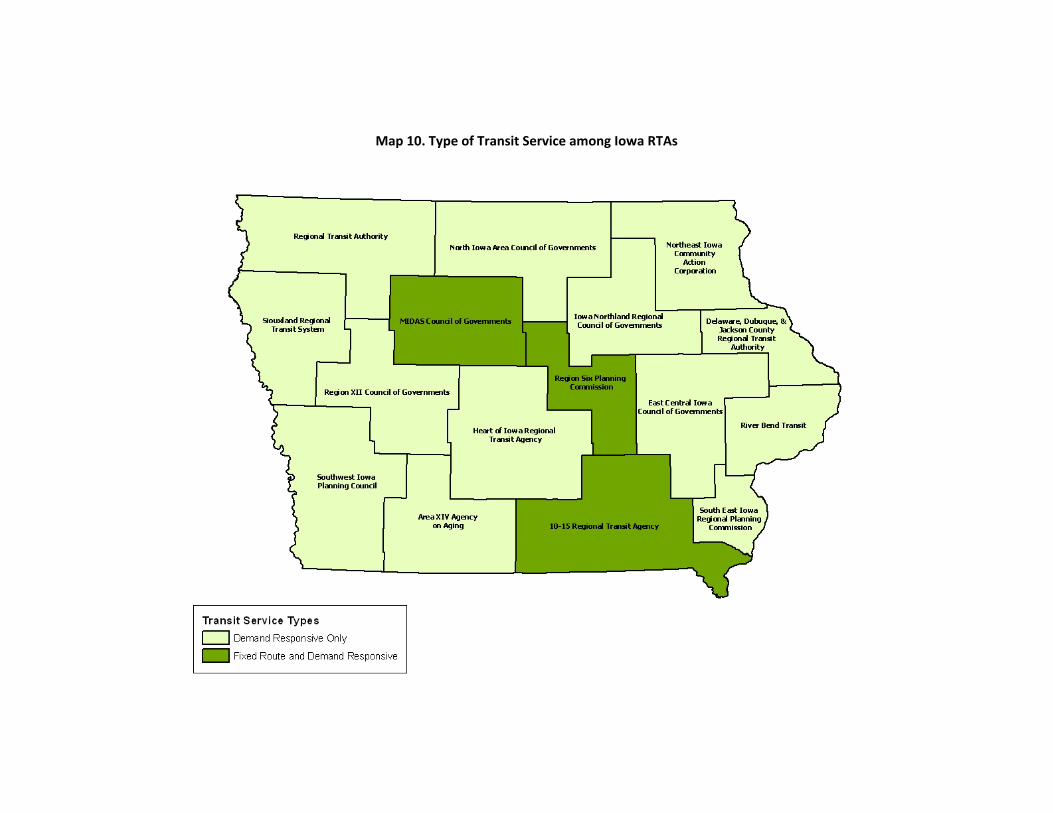
Map 10. Type of Transit Service among Iowa RTAs
Chapter 5 Transportation Providers
Survey Analysis Of the 35 transit authorities in the state of Iowa, 33 responded to the survey. Excluding questions about contact information, 31 questions were administered to transit authorities. The 31 questions covered various topics such as the types of services conducted, the service areas for each transit authority, reasons for travel, eligibility requirements, and the organization’s interest in new methods or technology, to name just a few. The 33 transportation providers vary in terms of the degree to which they operate their services. Because they utilize fixed‐routes, urban transportation providers are predisposed to directly operating their services. However, a number of these organizations responded by saying that they subcontract their paratransit services. For example, the Iowa City and Coralville transit authorities utilize Johnson County Seats, while Cedar Rapids Transit subcontracts to Linn County Lifts. There was a wide range of responses concerning the types of transportation service coordination in which transit authorities were interested. Twelve different options were listed on the survey and respondents were asked to check any that applied. Of the 33 transit authorities, 29 were interested in cooperatively purchasing their vehicles, 25 favored the idea of pooling training resources, 24 showed interest in ride‐tracking and scheduling technologies, and 23 favored the creation of a transportation and human services network across their areas of operation. Less appealing to providers were the issues of contracting to purchase transportation services (12 respondents), and centralizing services into a single provider (13 respondents). When asked about the manner in which their organizations could contribute to the coordination of transportation services, the general consensus was that coordination between different transportation providers, human services agencies, and other interested parties would be the best option for efficiency. In fact, some urban providers responded by stating that they already coordinate with other area transit organizations (the Iowa City‐Coralville‐Cambus triumvirate, Davenport Public Transit and others in the Quad Cities). One organization, the Des Moines Area Regional Transportation Authority, strongly stated that it is the only transit authority in their sphere of influence and does not coordinate with any other municipal organization. One of the major strengths cited by many of the organizations, particularly the RTAs that operate demand‐responsive services, was flexibility. Some organizations elaborated by saying that they are able to quickly respond to any demands. Even though they can respond quickly, most of the RTAs prefer 24 hours notice, especially ADA paratransit services. Organizations listed any unmet demands that could potentially be met. Most demand‐responsive services operate on limited hours, and the fact that this was listed by many of the RTAs suggests that there is demand for such an operation. Lack of funding and drivers willing to stay on call seems to hamper an organization’s ability in such a situation. In fact, the main barrier to meeting demands cited by respondents was funding. This manifests itself in a wide range of deficiencies such as lack of manpower, limited program size, inadequate vehicle maintenance, and education of what certain programs can offer.
76 Transportation Providers
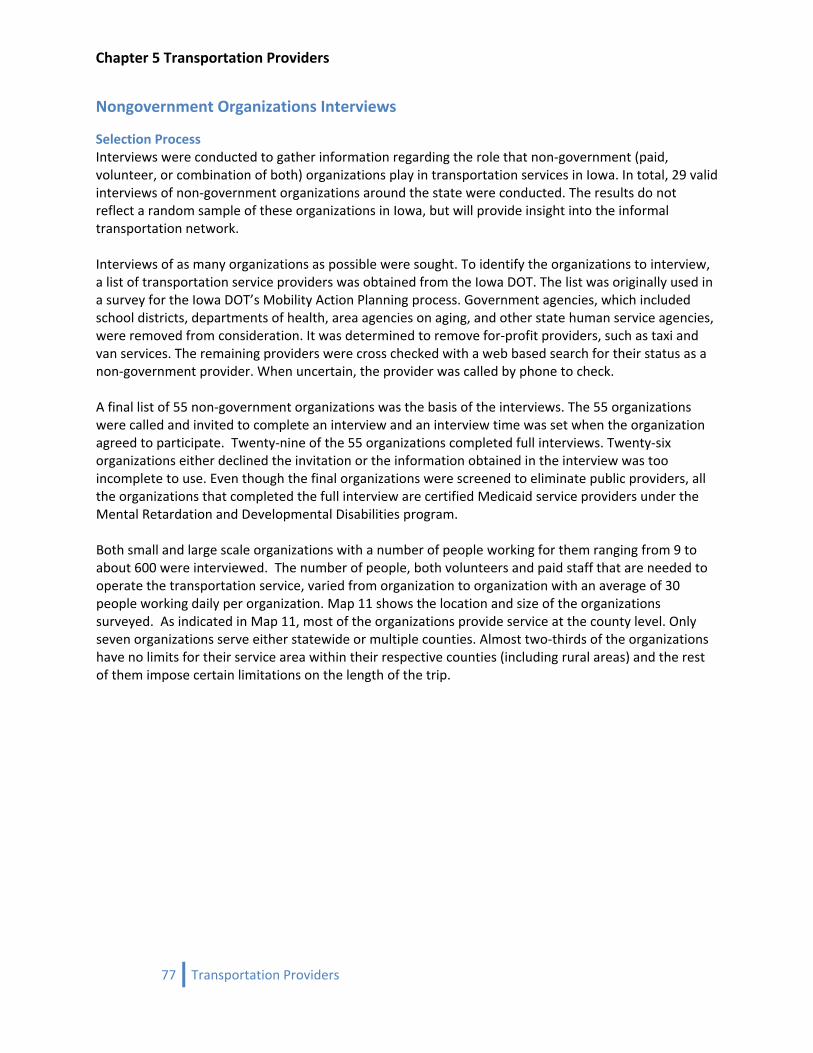
Chapter 5 Transportation Providers
77 Transportation Providers
Nongovernment Organizations Interviews
Selection Process Interviews were conducted to gather information regarding the role that non‐government (paid, volunteer, or combination of both) organizations play in transportation services in Iowa. In total, 29 valid interviews of non‐government organizations around the state were conducted. The results do not reflect a random sample of these organizations in Iowa, but will provide insight into the informal transportation network. Interviews of as many organizations as possible were sought. To identify the organizations to interview, a list of transportation service providers was obtained from the Iowa DOT. The list was originally used in a survey for the Iowa DOT’s Mobility Action Planning process. Government agencies, which included school districts, departments of health, area agencies on aging, and other state human service agencies, were removed from consideration. It was determined to remove for‐profit providers, such as taxi and van services. The remaining providers were cross checked with a web based search for their status as a non‐government provider. When uncertain, the provider was called by phone to check. A final list of 55 non‐government organizations was the basis of the interviews. The 55 organizations were called and invited to complete an interview and an interview time was set when the organization agreed to participate. Twenty‐nine of the 55 organizations completed full interviews. Twenty‐six organizations either declined the invitation or the information obtained in the interview was too incomplete to use. Even though the final organizations were screened to eliminate public providers, all the organizations that completed the full interview are certified Medicaid service providers under the Mental Retardation and Developmental Disabilities program. Both small and large scale organizations with a number of people working for them ranging from 9 to about 600 were interviewed. The number of people, both volunteers and paid staff that are needed to operate the transportation service, varied from organization to organization with an average of 30 people working daily per organization. Map 11 shows the location and size of the organizations surveyed. As indicated in Map 11, most of the organizations provide service at the county level. Only seven organizations serve either statewide or multiple counties. Almost two‐thirds of the organizations have no limits for their service area within their respective counties (including rural areas) and the rest of them impose certain limitations on the length of the trip.
Map 11. Locations of Organizations Surveyed

Chapter 6 Gap Analysis
Interview Analysis On average, all these organizations combined together transport about 6,500 people per week. The survey indicated that Hope Haven, Inc. (Sioux County), Link Associates (Polk County), Christian Opportunity Center (Warren County), Opportunity Village (Cerro Gordo County), and Horizons Unlimited of Palo Alto County, Inc. (Palo Alto County) are some of the busiest organizations in terms of passenger load and consumer demand. These organizations also contract with their RTA to fulfill some of the regional transportation services. Almost all of the organizations provide service for medical related reasons but a large portion of them also offer transportation services for other purposes, including shopping, recreational, work or school, and religious activities. Twenty‐four organizations mentioned that a majority of passengers use telephone, third party coordination or both to access or reserve the service. The largest organizations in terms of number of vehicles used to provide services are New Hope Village (Carroll County), Nishna Productions, Inc. (Montgomery County), and Hope Haven, Inc. (Sioux County), respectively. However, a very low percentage of the vehicles owned by volunteer organizations are ADA compliant. On average, only 36 percent of the vehicles are ADA compliant. This can be attributed to the fact that quite a few organizations do not own (or purchase) the vehicles, but instead, vehicles are donated, leased or privately owned by the volunteers. The interview data shows that 22 of 30 organizations either purchase the vehicles, or had them donated or both, and four agencies have vehicles that are solely privately owned by the volunteers. Concerns also exist regarding the operational efficiency of these volunteer organizations. Only 21 out of 30 organizations have fixed hours of operation and the rest of them operate on a call by call basis or provide service depending upon the availability of the vehicles. The service hours vary between 7 a.m. and 8 p.m. but most of the organizations provide service only between 8 a.m. and 5 p.m. with very limited service on weekends. Six of them do not provide service on weekends at all. However, 10 of the volunteer organizations provide 24‐hour service. The other issue with the volunteer organizations is the lack of coordination with each other and with government agencies. Less than one‐fourth of the organizations coordinate transportation services with other volunteer organizations and only about half of them coordinate with some government agencies including DOT, RTAs or city transit agencies. Volunteer organizations seem quite efficient in terms of speedy arrangement of rides. Almost half of them said that pick‐up can be scheduled in slightly more than an hour or as and when needed (Figure 14). Also, the denial rate of trip requests is quite low with most of the organizations expressing less than 10 percent denial rate in the last year. The main reasons for denying a trip included limited finances, inability to meet the need, out of service area, and limited hours of operation.
79 Gap Analysis between Transportation Services and Demand

Chapter 6 Gap Analysis
Figure 14. Ability of Organizations in Scheduling a Trip
11
8
1
3
0
4
2
0
2
4
6
8
10
12
More than an hour
More than a day
More than two days
More than a week
More than two weeks
On demand/As needed
Other
Num
ber o
f Organ
izations
Again, as with the public transit providers, funding avenues for the volunteer organizations also seem quite limited. However, unlike the public transit providers, these organizations largely depend on private donations and gifts for operating revenue. Nearly half of the organizations do not charge any fee for providing service. The remaining charge nominal fees depending either on the distance travelled or the location of clients. When asked “what is the primary barrier faced by your organization”, 18 organizations responded that it was finding adequate funding (Figure 15). The organizations expressed that as fewer transit services are being provided by public transit providers the number of referrals they receive has increased and therefore also demand. The organizations identified a compounding factor of the increased demand as a reduction in overall quality of the service because the fees they charge do not cover their operation costs. When asked “whether your organization would ever consider using a state‐coordinated brokerage system,” 23 of 29 organizations interviewed said yes they would.
80 Gap Analysis between Transportation Services and Demand

Chapter 6 Gap Analysis
Figure 15. Primary Barriers Faced by Volunteer Organizations
18
3 34
01
02468
101214161820
Finding adequate funding
Number of vehicles
Maintaining vehicles
Recruiting volunteers
Training drivers
Other
Num
ber o
f Organ
izations
Conclusions The overall transportation providers’ network in Iowa seems to adequately cover the state in terms of geography. However, there was a wide range in terms of how their operations are carried out. The general conclusion that can be drawn from the survey and interviews is that most regional transit authorities and non‐government organizations need to increase the scopes of their operations, potentially by increasing their operational hours or supplying more vehicles. Most of the demand responsive transportation only operated on a fixed schedule during weekdays, with very limited service during weekends. The strength that most organizations cited was the speedy arrangement of demand‐responsive services. This flexibility is reflected in the scheduling practices of these organizations, with most needing less than 24 hours advanced notice for transportation. The lack of evening and weekend service was also a limitation that the Income Maintenance, Case Managers, and Service Workers identified. According to the Medicaid workers, the lack of availability after regular business hours negatively impacts Medicaid consumers’ health and welfare. They perceive that the consumers are demanding extra hours. The other issue with the transportation providers is the lack of coordination with each other and with other government agencies. In helping to improve transportation effectiveness, many of the respondents believed that better coordination between different subpopulations was necessary. This includes cooperation between different transit authorities, providers, and most importantly the human service organizations that are in direct contact with consumers. Funding seems to be the biggest issue that limits the abilities of transit authorities and non‐government organizations. These organizations expressed that fewer transit services being provided by the state increases referrals and demands on them; on the other hand, transit agencies blame state and federal authorities for lack of funding that hampers their ability to provide expanded service. With better funding, organizations could extend their hours, hire more drivers, purchase more vehicles, and also educate the potential consumers of their services.
81 Gap Analysis between Transportation Services and Demand
Chapter 6 Gap Analysis
The surveys also indicated that transportation providers favor a state‐coordinated brokerage system over the existing system for providing transportation to Medicaid consumers.
82 Gap Analysis between Transportation Services and Demand

Chapter 6 Gap Analysis
Chapter 6 Gap Analysis
83 Gap Analysis between Transportation Services and Demand

Chapter 6 Gap Analysis
84 Gap Analysis between Transportation Services and Demand
Chapter 6 Gap Analysis
Gap Analysis between Transportation Services and Demand This chapter identifies and describes current gaps in non‐emergency medical transportation services available to Medicaid consumers based on the information collected from Medicaid consumers, Medicaid workers, and transportation providers through mail‐out, mail‐back surveys, Internet‐based surveys, and telephone interviews. Complete descriptions of the survey and interview results are presented in the preceding chapters. The gap analysis serves as a basis for determining the requirements for a statewide transportation brokerage service.
Unmet Transportation Needs
Study Subpopulation Analysis One way of understanding the unmet transportation needs in Iowa is to calculate the number of Medicaid consumers that have missed a desired activity or trip due to the lack of transportation. Results from the Medicaid consumer survey reveal 11 percent of all Medicaid consumers have missed a desired activity or medical care due to lack of transportation. A desired activity could be child or adult care, school or training, work, grocery shopping, shopping at a department store or shopping mall, business errands, social visits, religious functions, or leisure pursuits. The analysis also shows slight differences between the three study subpopulations. The three Medicaid subpopulations are: people with disabilities, elderly, and the remaining Medicaid population (referred to as the general subpopulation). The subpopulation with the highest percentage of missed activities is the people with disabilities subpopulation (13 percent) followed by the elderly and general subpopulations (11 and 10 percent respectively). Missed medical services follow a pattern similar to that of desired activities. Medical care is defined as a medical care visit, or trip to a pharmacy. Seven percent of all Medicaid consumers who needed to make a trip for a medical care visit or a drug store trip missed it. Of those who did miss medical services, those within the people with disabilities subpopulation have the highest percentage (8 percent), followed by the elderly and general subpopulations (6 percent each). The estimated total number of Medicaid consumers that miss medical care services in a given week is approximately 10,000. There is a geographic pattern to the missed trips by consumers. As explained in Chapter 2, the member responses were assigned to three geographic regions: urban with fixed‐route transit access, urban without fixed‐route transit access and rural without fixed‐route transit. There are some interesting results that came from the analysis. The Medicaid consumers living close to urban areas with fixed‐route transit access miss more trips than members living in other areas. Sixteen percent of all Medicaid consumers who live within urban areas with fixed‐route transit access do miss desired activities. In comparison, 14 percent of all Medicaid consumers who are living in urban areas without fixed‐route transit access or rural areas miss desired activities. This can be attributed to the fact that the area variable is a proxy for the availability of desired activities. For example, urban areas with fixed‐route transit would typically have more activities offered than rural areas without fixed‐route transit; therefore, Medicaid consumers in urban areas miss more desired activities simply because there are more to miss. Another reason could be the better social networks within the areas without access to fixed‐route transit, which allows Medicaid consumers to arrange for a ride with someone else.
85 Gap Analysis between Transportation Services and Demand
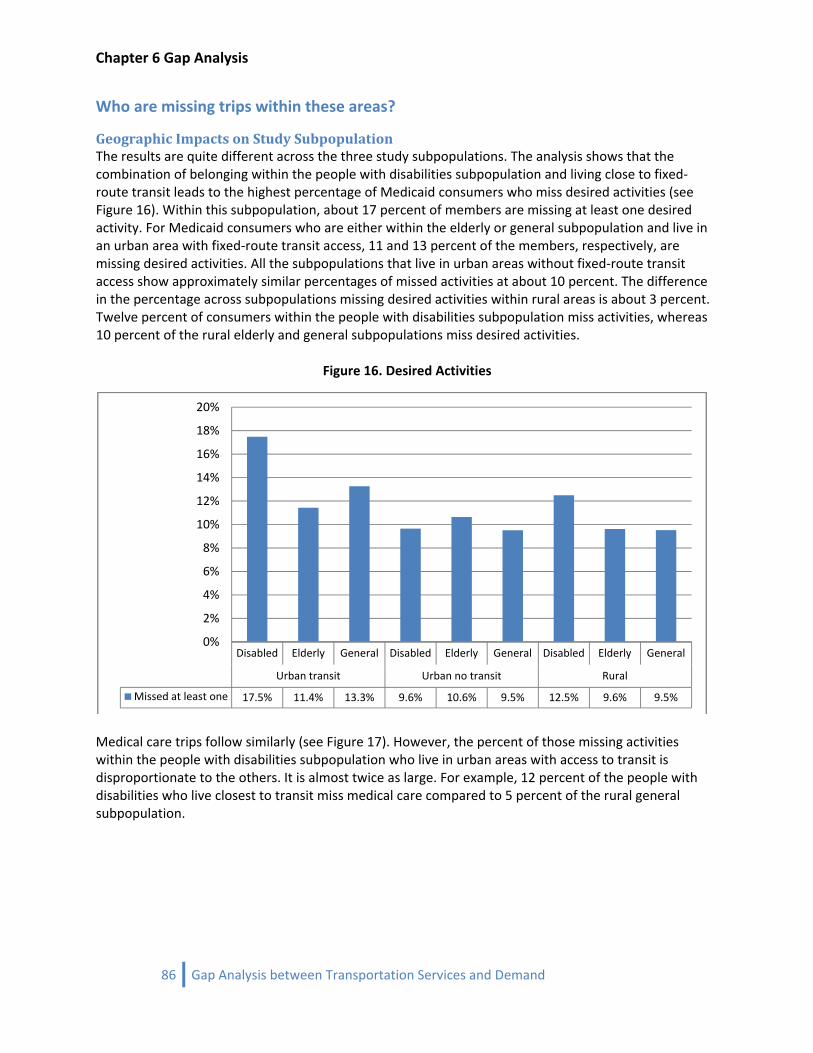
Chapter 6 Gap Analysis
Who are missing trips within these areas?
Geographic Impacts on Study Subpopulation The results are quite different across the three study subpopulations. The analysis shows that the combination of belonging within the people with disabilities subpopulation and living close to fixed‐route transit leads to the highest percentage of Medicaid consumers who miss desired activities (see Figure 16). Within this subpopulation, about 17 percent of members are missing at least one desired activity. For Medicaid consumers who are either within the elderly or general subpopulation and live in an urban area with fixed‐route transit access, 11 and 13 percent of the members, respectively, are missing desired activities. All the subpopulations that live in urban areas without fixed‐route transit access show approximately similar percentages of missed activities at about 10 percent. The difference in the percentage across subpopulations missing desired activities within rural areas is about 3 percent. Twelve percent of consumers within the people with disabilities subpopulation miss activities, whereas 10 percent of the rural elderly and general subpopulations miss desired activities.
Figure 16. Desired Activities
Disabled Elderly General Disabled Elderly General Disabled Elderly General
Urban transit Urban no transit Rural
Missed at least one 17.5% 11.4% 13.3% 9.6% 10.6% 9.5% 12.5% 9.6% 9.5%
0%
2%
4%
6%
8%
10%
12%
14%
16%
18%
20%
Medical care trips follow similarly (see Figure 17). However, the percent of those missing activities within the people with disabilities subpopulation who live in urban areas with access to transit is disproportionate to the others. It is almost twice as large. For example, 12 percent of the people with disabilities who live closest to transit miss medical care compared to 5 percent of the rural general subpopulation.
86 Gap Analysis between Transportation Services and Demand
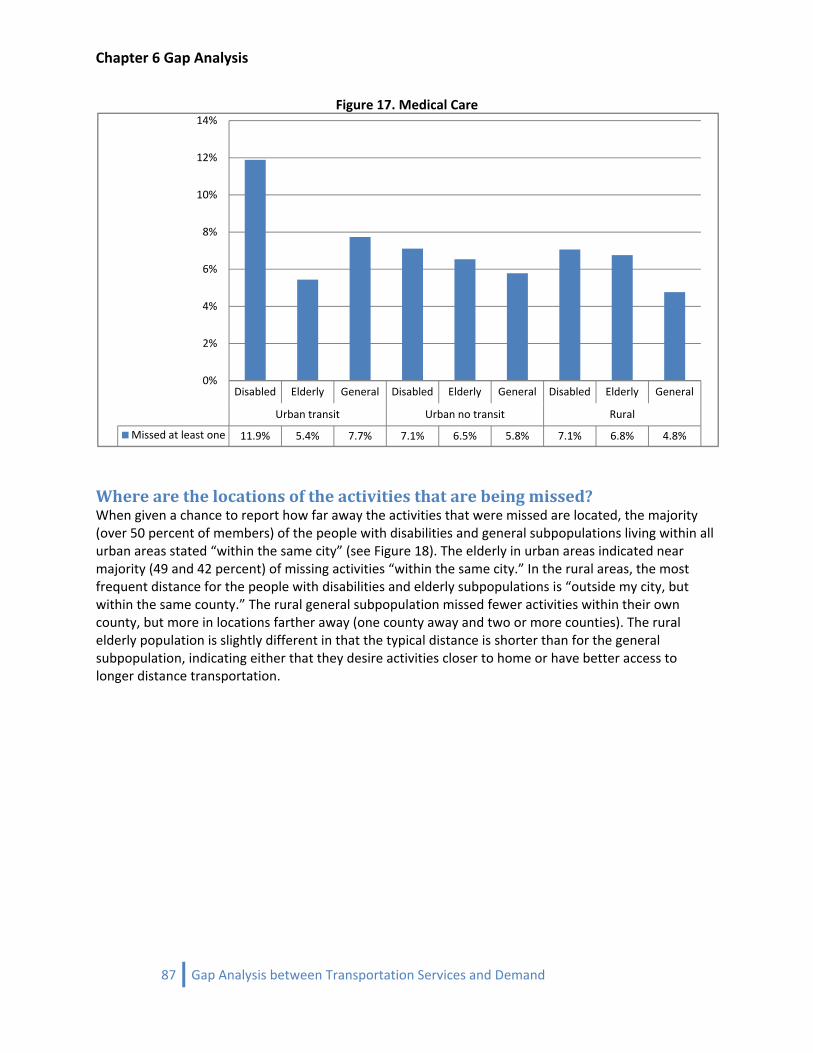
Chapter 6 Gap Analysis
Figure 17. Medical Care
Disabled Elderly General Disabled Elderly General Disabled Elderly General
Urban transit Urban no transit Rural
Missed at least one 11.9% 5.4% 7.7% 7.1% 6.5% 5.8% 7.1% 6.8% 4.8%
0%
2%
4%
6%
8%
10%
12%
14%
Where are the locations of the activities that are being missed? When given a chance to report how far away the activities that were missed are located, the majority (over 50 percent of members) of the people with disabilities and general subpopulations living within all urban areas stated “within the same city” (see Figure 18). The elderly in urban areas indicated near majority (49 and 42 percent) of missing activities “within the same city.” In the rural areas, the most frequent distance for the people with disabilities and elderly subpopulations is “outside my city, but within the same county.” The rural general subpopulation missed fewer activities within their own county, but more in locations farther away (one county away and two or more counties). The rural elderly population is slightly different in that the typical distance is shorter than for the general subpopulation, indicating either that they desire activities closer to home or have better access to longer distance transportation.
87 Gap Analysis between Transportation Services and Demand
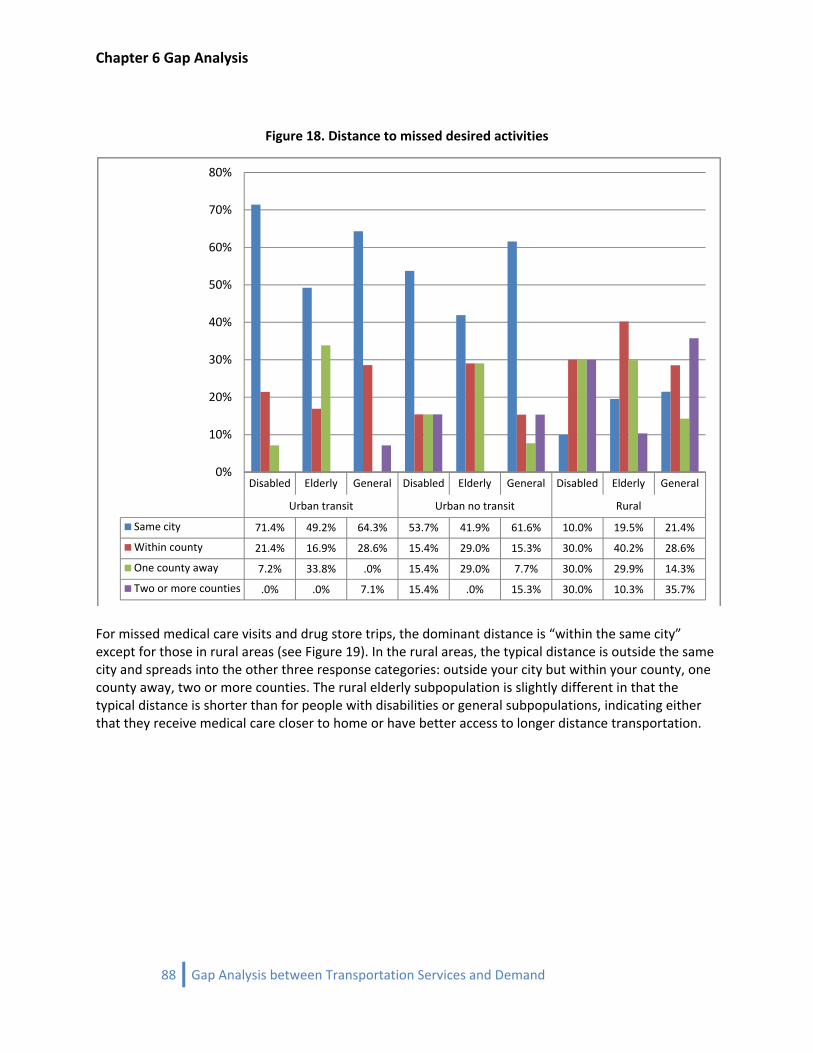
Chapter 6 Gap Analysis
Figure 18. Distance to missed desired activities
Disabled Elderly General Disabled Elderly General Disabled Elderly General
Urban transit Urban no transit Rural
Same city 71.4% 49.2% 64.3% 53.7% 41.9% 61.6% 10.0% 19.5% 21.4%
Within county 21.4% 16.9% 28.6% 15.4% 29.0% 15.3% 30.0% 40.2% 28.6%
One county away 7.2% 33.8% .0% 15.4% 29.0% 7.7% 30.0% 29.9% 14.3%
Two or more counties .0% .0% 7.1% 15.4% .0% 15.3% 30.0% 10.3% 35.7%
0%
10%
20%
30%
40%
50%
60%
70%
80%
For missed medical care visits and drug store trips, the dominant distance is “within the same city” except for those in rural areas (see Figure 19). In the rural areas, the typical distance is outside the same city and spreads into the other three response categories: outside your city but within your county, one county away, two or more counties. The rural elderly subpopulation is slightly different in that the typical distance is shorter than for people with disabilities or general subpopulations, indicating either that they receive medical care closer to home or have better access to longer distance transportation.
88 Gap Analysis between Transportation Services and Demand
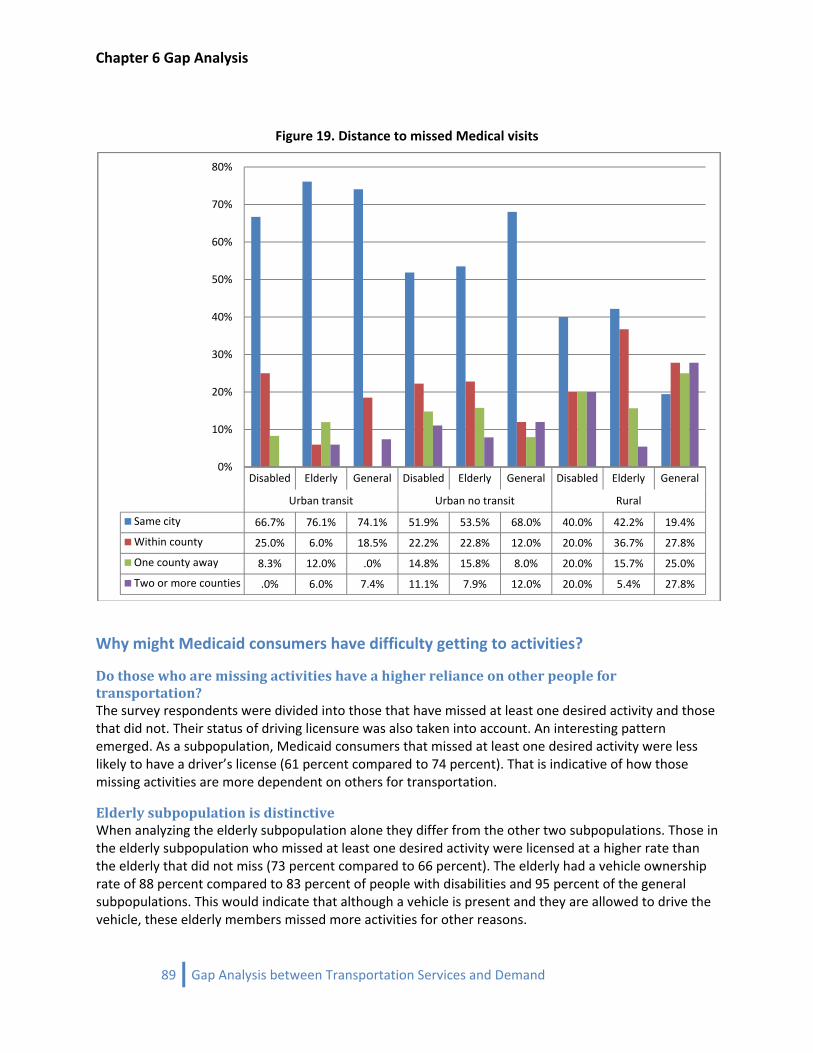
Chapter 6 Gap Analysis
Figure 19. Distance to missed Medical visits
Disabled Elderly General Disabled Elderly General Disabled Elderly General
Urban transit Urban no transit Rural
Same city 66.7% 76.1% 74.1% 51.9% 53.5% 68.0% 40.0% 42.2% 19.4%
Within county 25.0% 6.0% 18.5% 22.2% 22.8% 12.0% 20.0% 36.7% 27.8%
One county away 8.3% 12.0% .0% 14.8% 15.8% 8.0% 20.0% 15.7% 25.0%
Two or more counties .0% 6.0% 7.4% 11.1% 7.9% 12.0% 20.0% 5.4% 27.8%
0%
10%
20%
30%
40%
50%
60%
70%
80%
Why might Medicaid consumers have difficulty getting to activities?
Do those who are missing activities have a higher reliance on other people for transportation? The survey respondents were divided into those that have missed at least one desired activity and those that did not. Their status of driving licensure was also taken into account. An interesting pattern emerged. As a subpopulation, Medicaid consumers that missed at least one desired activity were less likely to have a driver’s license (61 percent compared to 74 percent). That is indicative of how those missing activities are more dependent on others for transportation.
Elderly subpopulation is distinctive When analyzing the elderly subpopulation alone they differ from the other two subpopulations. Those in the elderly subpopulation who missed at least one desired activity were licensed at a higher rate than the elderly that did not miss (73 percent compared to 66 percent). The elderly had a vehicle ownership rate of 88 percent compared to 83 percent of people with disabilities and 95 percent of the general subpopulations. This would indicate that although a vehicle is present and they are allowed to drive the vehicle, these elderly members missed more activities for other reasons.
89 Gap Analysis between Transportation Services and Demand
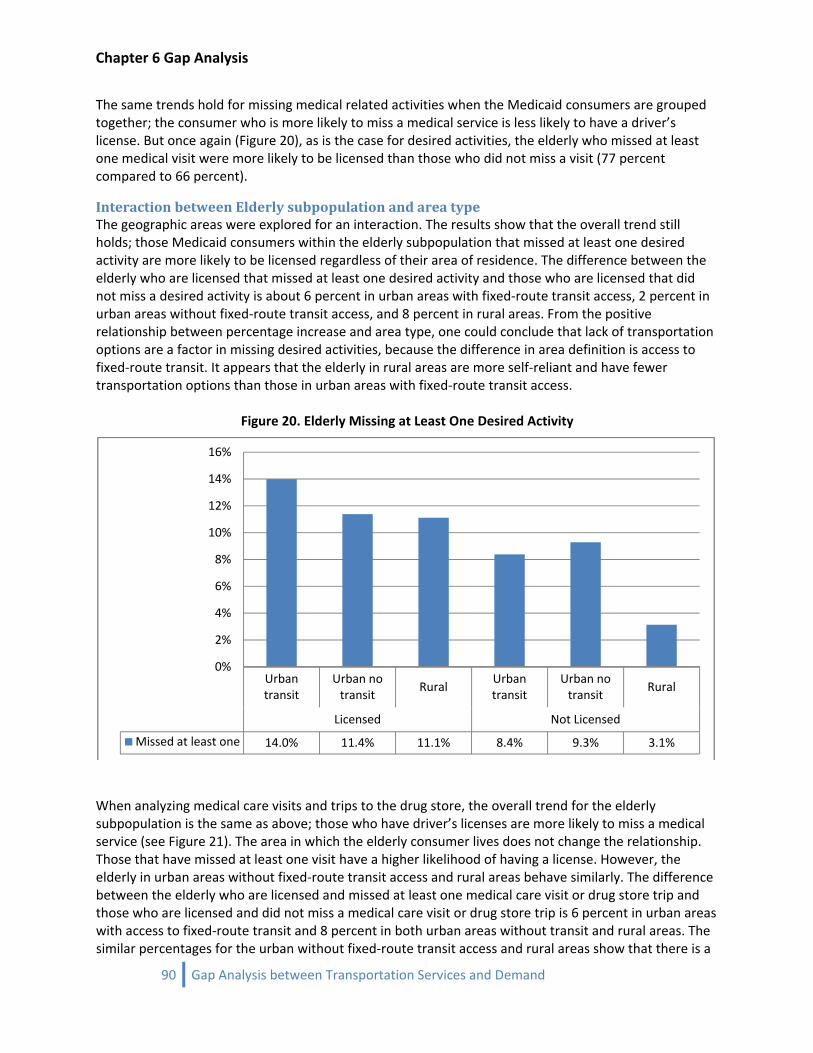
Chapter 6 Gap Analysis
The same trends hold for missing medical related activities when the Medicaid consumers are grouped together; the consumer who is more likely to miss a medical service is less likely to have a driver’s license. But once again (Figure 20), as is the case for desired activities, the elderly who missed at least one medical visit were more likely to be licensed than those who did not miss a visit (77 percent compared to 66 percent).
Interaction between Elderly subpopulation and area type The geographic areas were explored for an interaction. The results show that the overall trend still holds; those Medicaid consumers within the elderly subpopulation that missed at least one desired activity are more likely to be licensed regardless of their area of residence. The difference between the elderly who are licensed that missed at least one desired activity and those who are licensed that did not miss a desired activity is about 6 percent in urban areas with fixed‐route transit access, 2 percent in urban areas without fixed‐route transit access, and 8 percent in rural areas. From the positive relationship between percentage increase and area type, one could conclude that lack of transportation options are a factor in missing desired activities, because the difference in area definition is access to fixed‐route transit. It appears that the elderly in rural areas are more self‐reliant and have fewer transportation options than those in urban areas with fixed‐route transit access.
Figure 20. Elderly Missing at Least One Desired Activity
Urban transit
Urban no transit
RuralUrban transit
Urban no transit
Rural
Licensed Not Licensed
Missed at least one 14.0% 11.4% 11.1% 8.4% 9.3% 3.1%
0%
2%
4%
6%
8%
10%
12%
14%
16%
When analyzing medical care visits and trips to the drug store, the overall trend for the elderly subpopulation is the same as above; those who have driver’s licenses are more likely to miss a medical service (see Figure 21). The area in which the elderly consumer lives does not change the relationship. Those that have missed at least one visit have a higher likelihood of having a license. However, the elderly in urban areas without fixed‐route transit access and rural areas behave similarly. The difference between the elderly who are licensed and missed at least one medical care visit or drug store trip and those who are licensed and did not miss a medical care visit or drug store trip is 6 percent in urban areas with access to fixed‐route transit and 8 percent in both urban areas without transit and rural areas. The similar percentages for the urban without fixed‐route transit access and rural areas show that there is a
90 Gap Analysis between Transportation Services and Demand
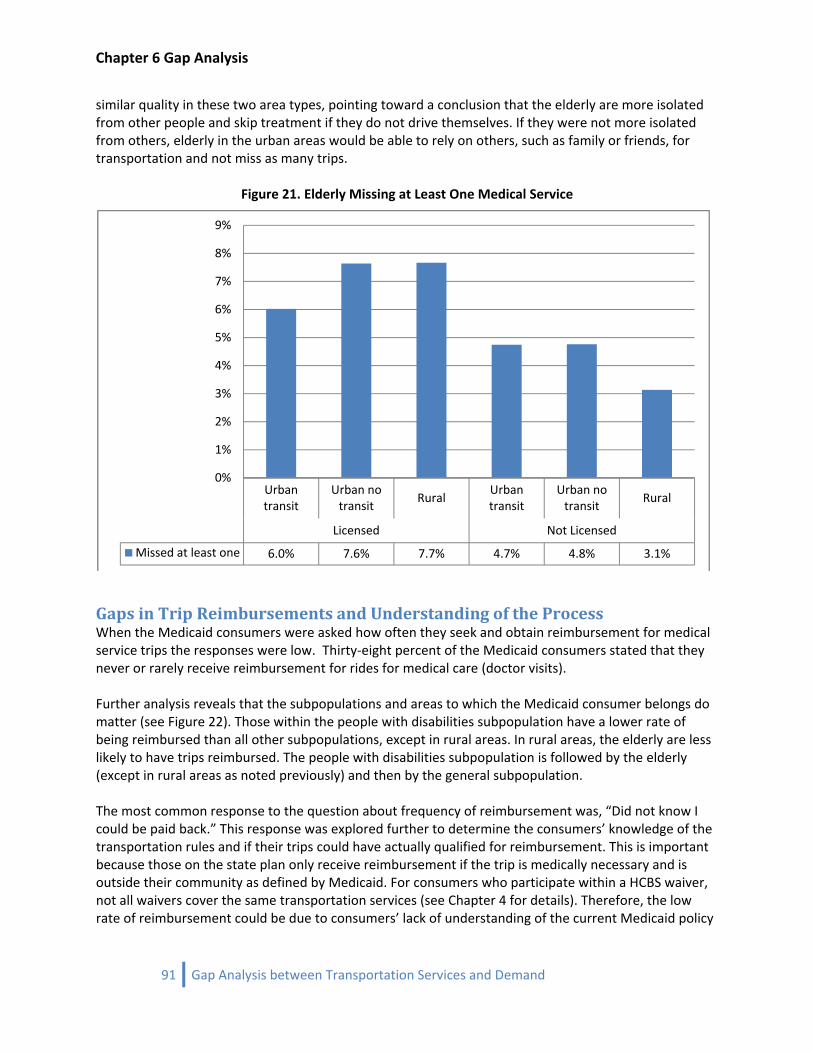
Chapter 6 Gap Analysis
similar quality in these two area types, pointing toward a conclusion that the elderly are more isolated from other people and skip treatment if they do not drive themselves. If they were not more isolated from others, elderly in the urban areas would be able to rely on others, such as family or friends, for transportation and not miss as many trips.
Figure 21. Elderly Missing at Least One Medical Service
Urban transit
Urban no transit
RuralUrban transit
Urban no transit
Rural
Licensed Not Licensed
Missed at least one 6.0% 7.6% 7.7% 4.7% 4.8% 3.1%
0%
1%
2%
3%
4%
5%
6%
7%
8%
9%
Gaps in Trip Reimbursements and Understanding of the Process When the Medicaid consumers were asked how often they seek and obtain reimbursement for medical service trips the responses were low. Thirty‐eight percent of the Medicaid consumers stated that they never or rarely receive reimbursement for rides for medical care (doctor visits). Further analysis reveals that the subpopulations and areas to which the Medicaid consumer belongs do matter (see Figure 22). Those within the people with disabilities subpopulation have a lower rate of being reimbursed than all other subpopulations, except in rural areas. In rural areas, the elderly are less likely to have trips reimbursed. The people with disabilities subpopulation is followed by the elderly (except in rural areas as noted previously) and then by the general subpopulation. The most common response to the question about frequency of reimbursement was, “Did not know I could be paid back.” This response was explored further to determine the consumers’ knowledge of the transportation rules and if their trips could have actually qualified for reimbursement. This is important because those on the state plan only receive reimbursement if the trip is medically necessary and is outside their community as defined by Medicaid. For consumers who participate within a HCBS waiver, not all waivers cover the same transportation services (see Chapter 4 for details). Therefore, the low rate of reimbursement could be due to consumers’ lack of understanding of the current Medicaid policy
91 Gap Analysis between Transportation Services and Demand
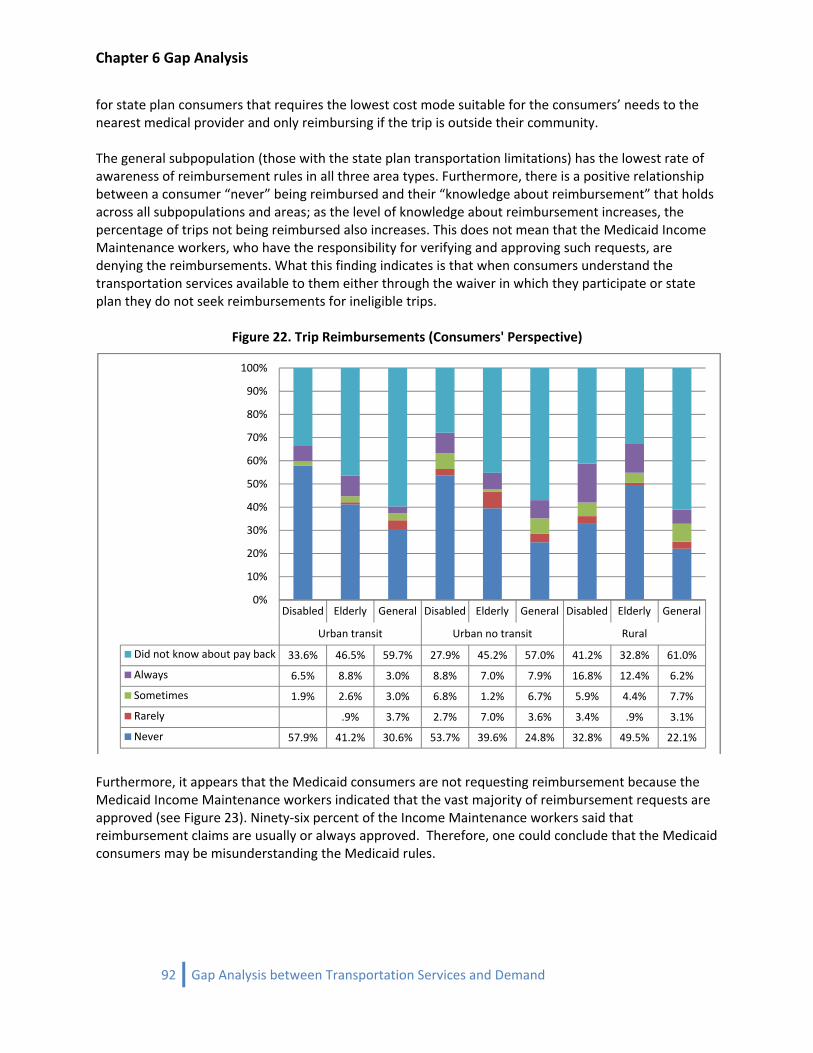
Chapter 6 Gap Analysis
for state plan consumers that requires the lowest cost mode suitable for the consumers’ needs to the nearest medical provider and only reimbursing if the trip is outside their community. The general subpopulation (those with the state plan transportation limitations) has the lowest rate of awareness of reimbursement rules in all three area types. Furthermore, there is a positive relationship between a consumer “never” being reimbursed and their “knowledge about reimbursement” that holds across all subpopulations and areas; as the level of knowledge about reimbursement increases, the percentage of trips not being reimbursed also increases. This does not mean that the Medicaid Income Maintenance workers, who have the responsibility for verifying and approving such requests, are denying the reimbursements. What this finding indicates is that when consumers understand the transportation services available to them either through the waiver in which they participate or state plan they do not seek reimbursements for ineligible trips.
Figure 22. Trip Reimbursements (Consumers' Perspective)
Disabled Elderly General Disabled Elderly General Disabled Elderly General
Urban transit Urban no transit Rural
Did not know about pay back 33.6% 46.5% 59.7% 27.9% 45.2% 57.0% 41.2% 32.8% 61.0%
Always 6.5% 8.8% 3.0% 8.8% 7.0% 7.9% 16.8% 12.4% 6.2%
Sometimes 1.9% 2.6% 3.0% 6.8% 1.2% 6.7% 5.9% 4.4% 7.7%
Rarely .9% 3.7% 2.7% 7.0% 3.6% 3.4% .9% 3.1%
Never 57.9% 41.2% 30.6% 53.7% 39.6% 24.8% 32.8% 49.5% 22.1%
0%
10%
20%
30%
40%
50%
60%
70%
80%
90%
100%
Furthermore, it appears that the Medicaid consumers are not requesting reimbursement because the Medicaid Income Maintenance workers indicated that the vast majority of reimbursement requests are approved (see Figure 23). Ninety‐six percent of the Income Maintenance workers said that reimbursement claims are usually or always approved. Therefore, one could conclude that the Medicaid consumers may be misunderstanding the Medicaid rules.
92 Gap Analysis between Transportation Services and Demand
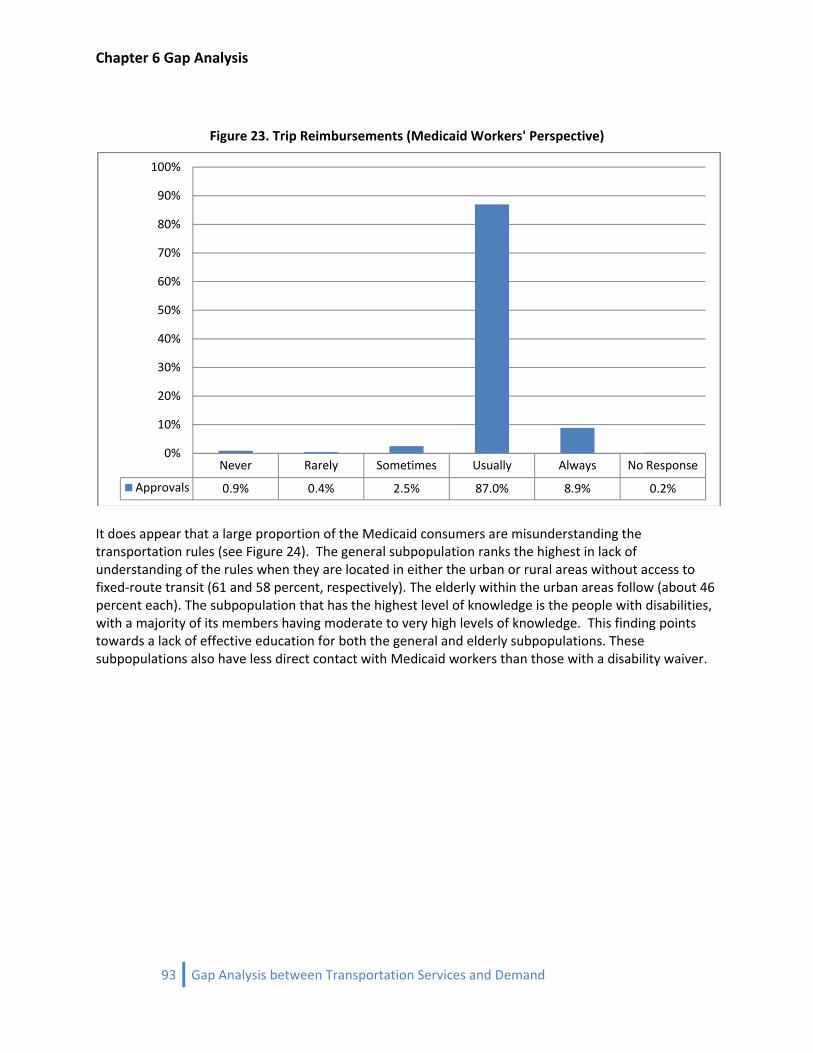
Chapter 6 Gap Analysis
Figure 23. Trip Reimbursements (Medicaid Workers' Perspective)
Never Rarely Sometimes Usually Always No Response
Approvals 0.9% 0.4% 2.5% 87.0% 8.9% 0.2%
0%
10%
20%
30%
40%
50%
60%
70%
80%
90%
100%
It does appear that a large proportion of the Medicaid consumers are misunderstanding the transportation rules (see Figure 24). The general subpopulation ranks the highest in lack of understanding of the rules when they are located in either the urban or rural areas without access to fixed‐route transit (61 and 58 percent, respectively). The elderly within the urban areas follow (about 46 percent each). The subpopulation that has the highest level of knowledge is the people with disabilities, with a majority of its members having moderate to very high levels of knowledge. This finding points towards a lack of effective education for both the general and elderly subpopulations. These subpopulations also have less direct contact with Medicaid workers than those with a disability waiver.
93 Gap Analysis between Transportation Services and Demand
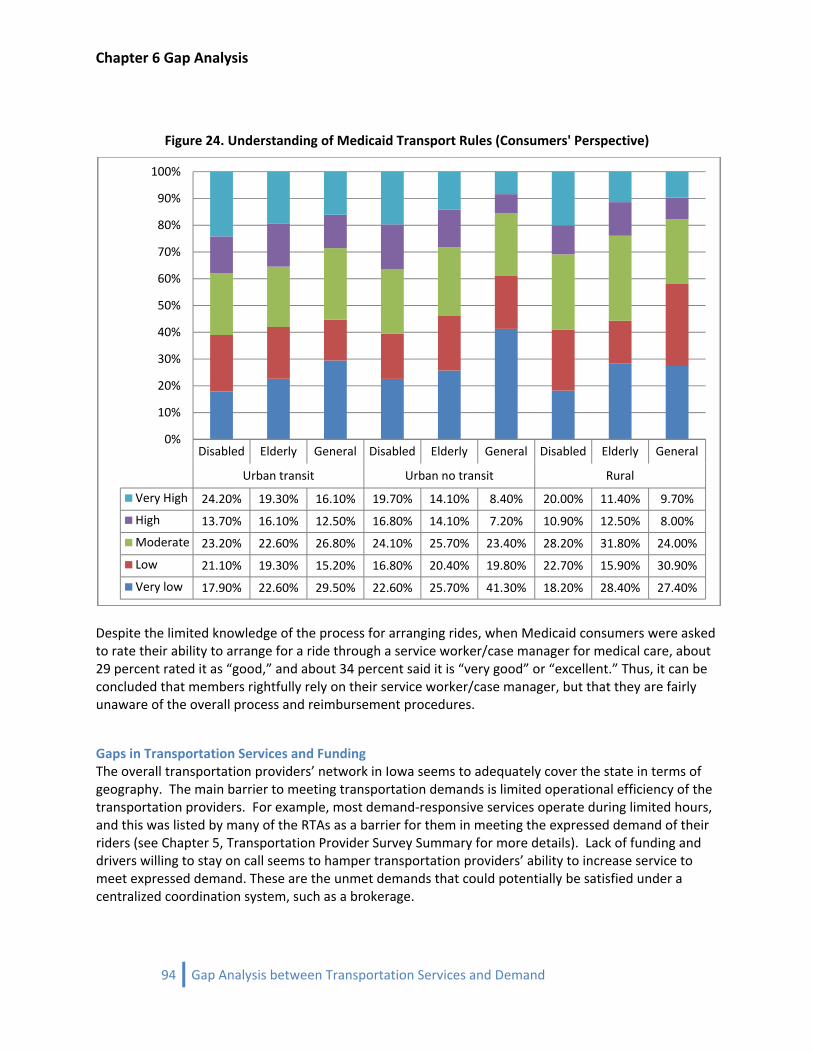
Chapter 6 Gap Analysis
Figure 24. Understanding of Medicaid Transport Rules (Consumers' Perspective)
Disabled Elderly General Disabled Elderly General Disabled Elderly General
Urban transit Urban no transit Rural
Very High 24.20% 19.30% 16.10% 19.70% 14.10% 8.40% 20.00% 11.40% 9.70%
High 13.70% 16.10% 12.50% 16.80% 14.10% 7.20% 10.90% 12.50% 8.00%
Moderate 23.20% 22.60% 26.80% 24.10% 25.70% 23.40% 28.20% 31.80% 24.00%
Low 21.10% 19.30% 15.20% 16.80% 20.40% 19.80% 22.70% 15.90% 30.90%
Very low 17.90% 22.60% 29.50% 22.60% 25.70% 41.30% 18.20% 28.40% 27.40%
0%
10%
20%
30%
40%
50%
60%
70%
80%
90%
100%
Despite the limited knowledge of the process for arranging rides, when Medicaid consumers were asked to rate their ability to arrange for a ride through a service worker/case manager for medical care, about 29 percent rated it as “good,” and about 34 percent said it is “very good” or “excellent.” Thus, it can be concluded that members rightfully rely on their service worker/case manager, but that they are fairly unaware of the overall process and reimbursement procedures.
Gaps in Transportation Services and Funding The overall transportation providers’ network in Iowa seems to adequately cover the state in terms of geography. The main barrier to meeting transportation demands is limited operational efficiency of the transportation providers. For example, most demand‐responsive services operate during limited hours, and this was listed by many of the RTAs as a barrier for them in meeting the expressed demand of their riders (see Chapter 5, Transportation Provider Survey Summary for more details). Lack of funding and drivers willing to stay on call seems to hamper transportation providers’ ability to increase service to meet expressed demand. These are the unmet demands that could potentially be satisfied under a centralized coordination system, such as a brokerage.
94 Gap Analysis between Transportation Services and Demand
Chapter 6 Gap Analysis
Funding seems to be the major issue that limits the abilities of transit authorities. With better funding, organizations could extend their hours, hire more drivers, purchase more vehicles, and also educate the potential consumers of their services. Many of the respondents to the transportation provider survey and interviews stated that better coordination between different subpopulations is necessary to improve transportation efficiency. This includes cooperation between different transit authorities, providers, and most importantly, the human service organizations that are in direct contact with Medicaid consumers. For a more thorough review, see the transportation provider summary document.
Conclusions From the discussion above, it is clear that people with disabilities, elderly, and general subpopulations behave differently in the geographic study areas. From the relationships observed above, one could conclude that the lack of transportation options is a factor in missing medical services and desired activities, but the extent to which transportation needs remain unmet for all Medicaid consumers is less than 8 percent (only about 6‐8 percent of members missing medical care trips). However, that is not evenly distributed across geographic areas. When the subpopulations are analyzed by area type, the highest is for those within the people with disabilities subpopulation residing in urban areas with fixed‐route transit access and the lowest is the general subpopulation residing in rural areas. Overall, Medicaid consumers residing in rural areas do not have the greatest unmet demand. While completing the analysis, it became clear that the unmet demand is not due to a lack of transportation options. The vast majority of Medicaid consumers drive themselves or have a family member drive them to places. When asked, their preferred mode was to drive themselves or ride with family. Those who do use public transit (from the high of 36 percent for the people with disabilities urban subpopulation to a low of 4 percent for rural elderly) consistently state that transit is “usually” or “always” available 70 to 80 percent of the time when needed. They also rate the drivers and vehicles between “high and very high” on all quality of service measures asked. Should a NEMT brokerage be created, it could assist those consumers who are most dependent on others for rides. A broker’s task would be to coordinate rides for all eligible Medicaid consumers, but specifically help the most in need. For example, the broker would be responsible for increasing access for those not able to drive themselves or rely on family/friends to transportation providers, which the consumers may not have access to now. The main point of concern is the limited knowledge Medicaid consumers have of the transportation rules and regulations. It appears that medical care is missed due to the consumers’ and transportation providers’ lack of understanding of the process for arranging rides. This coupled with the finding that a majority of the Case Workers and Service Workers do not fully know what transportation options are available, strongly indicates the need for a coordination service, such as a transportation brokerage (see Chapters 3 and 4 for the Case Workers and Service Workers Survey Summaries). A NEMT brokerage would streamline the transportation eligibility verification thereby decreasing the misunderstanding of Medicaid consumers. A broker would be a one‐stop shop for consumers. With one phone call, the consumer’s trip eligibility would be verified and the complete trip from origin to destination would be scheduled. All the consumer would need to know is the phone number of the brokerage. To decrease the potential confusion and difficulty crossing regional transportation district boundaries, a single, state‐wide brokerage would be superior to multiple regional brokers.
95 Gap Analysis between Transportation Services and Demand
Chapter 6 Gap Analysis
96 Gap Analysis between Transportation Services and Demand
Based on the five surveys/interviews completed to date, not surprisingly, transportation providers, Medicaid consumers, and Medicaid workers cite the need for more funding and better reimbursement as a major correction to fill the transportation gap. A brokerage could also help fill these gaps. It is possible that funding would be more reliable based on fewer denied trip cost reimbursements because of the broker’s screening process. A broker is a clearinghouse for trip demand. Therefore, transportation providers could easily identify if a consistent demand exists for after business hour trips and fill that gap. Experiences in other states with NEMT brokerages show that if a demand is shown and a profit can be made, transportation providers will meet the demand for trips (see Chapter 7 for a discussion of NEMT Brokerages).
Chapter 7 Brokerages
PB
art 2: NEMT rokerages
97 Brokerages

Chapter 7 Brokerages
98 Brokerages

Chapter 7 NEMT Brokerage Options
99 Brokerages

100 Brokerages

General Brokerage Characteristics
The Assurance of Medical Transportation Medicaid is an entitlement program jointly funded by the state and federal governments that provides health insurance to low income parents, children, seniors, and categories of persons with disabilities. Many Medicaid recipients have limited transportation resources, which can make medical care inaccessible. To remedy this, federal regulation 42 CFR 431.53 mandates that all states receiving federal Medicaid funds must “ensure necessary transportation for recipients to and from providers.” State Medicaid plans must describe how the state Medicaid agency will meet this requirement.
Traditional Provision of NonEmergency Medicaid Transportation States have traditionally ensured access to non‐emergency medical transportation (NEMT) by reimbursing recipients for transporting themselves or transportation providers for transporting recipients. However, this fee‐for‐service model has exhibited a number of deficiencies in some states, including failing to ensure the availability of appropriate transportation across all areas of a state, making the process of obtaining medical transportation difficult for recipients, creating inefficient transportation networks, and being prone to fraud and abuse. In response, states have been exploring alternative models for the provision of NEMT.
Provision of NEMT with a Transportation Broker The transportation brokerage model is the most common alternative model for the provision of NEMT. Transportation brokerage systems vary greatly by state, but the model fundamentally works by establishing an intermediary between Medicaid consumers and transportation providers, and between transportation providers and the state Medicaid agency. Typically, the state Medicaid agency contracts with one or more transportation brokers to perform the following functions.
• Establish a network of transportation providers o Manage NEMT trip intake o Maintain a call center to receive trip requests o Verify the Medicaid eligibility of the person requesting the trip o Verify that the requested trip is for a Medicaid‐covered service
• Arrange trips for consumers o Determine the least costly, appropriate mode of transportation o Dispatch the trip to an appropriate transportation provider, issue a transit pass, or
preauthorize recipient reimbursement o Contact the medical provider to ensure that the scheduled trip took place o Pay the transportation provider or reimburse the recipient
• Monitor transportation providers o Verify that transportation providers meet vehicle and driver standards o Compare trips sheets to authorized trip records to ensure that no unauthorized trips
take place
101 Brokerages
Existing Brokerage Systems About 21 states currently utilize a brokerage system for the provision of some or all NEMT. Brokerage models vary from state to state. However, several factors can be used to broadly characterize a brokerage system: the broker’s range of service, the method of payment to the broker, the broker type, whether NEMT is included in Medicaid managed care, whether the broker is allowed to provide trips, and whether the broker coordinates transportation for other human services agencies. It is important to note that little evidence exists to assert that certain brokerage structures are superior to others. As a result, as Barnes (2003) cautions in his study on coordinating human services transportation, “Knowing the features of another system does not necessarily provide much insight on how to implement something similar in one’s own area.”
Operating Area States typically either contract with a single broker for the entire state, partition the state into regions with one broker per region, or have one broker per county. Minnesota and Colorado each use the brokerage system for only a portion of the state. Seven states currently use a single, statewide broker: Delaware, Missouri, Nevada, Oklahoma, Rhode Island, Utah, and Virginia. Of these seven, all but Rhode Island contract with for‐profit medical transportation firms. In Rhode Island, five managed care companies that account for 69 percent of the Medicaid enrollment contract with the Rhode Island Public Transit Authority to be the statewide broker. Nine states use a system of regional brokers: Arkansas, Connecticut, Georgia, Kentucky, Maine, Massachusetts, Oregon, Vermont, and Washington. In addition, Colorado contracts with a broker for the multi‐county Denver metropolitan area. A common argument in support of regional brokers is that they are more responsive to local issues and are better able to utilize local transportation resources. Three states use county‐level brokers: Florida, Maryland, and Pennsylvania. In all three states, counties are either the brokers themselves or contract out the responsibility. Minnesota uses a broker for Hennepin County, which contains Minneapolis. Florida is generally regarded as one of the most successful examples of coordination of human services transportation, but state officials have stated that they would prefer a regional system because recipients sometimes encounter difficulty obtaining transportation across county boundaries.
Method of Payment States use five different methods to pay brokers: a fixed sum, a capitated rate, a flat fee per trip varied by mode, a flat fee per trip unvaried by mode, or an administrative fee plus direct trip cost reimbursement.
Fixed Sum Under the first method, the state pays the broker a fixed fee to administer NEMT for the term of the contract. Colorado and Rhode Island are the only states to use this payment method. The fixed sum payment offers budget predictability for the state. In addition, each trip reduces the broker’s revenue, so brokers have an incentive to ensure use of the least costly mode of transportation and to eliminate fraudulent trips. However, brokers also have an incentive to deny valid trips, so state oversight is necessary to ensure that trips are not denied unfairly and that recipients are not denied access to more costly modes of transportation when appropriate.
102 Brokerages
Capitated Rate Under the second method, brokers receive a risk‐based, capitated rate per Medicaid consumer in their jurisdiction per month. Eleven states use this payment method, making it the most common. It gives brokers the same set of incentives as the fixed sum method, but it is more responsive to changes in the number of Medicaid recipients. Missouri switched from a fee per trip model to the capitated rate model in 2005 after suspected abuse by Medical Transportation Management, Inc., its statewide broker at the time.
Flat Fee per Trip Varied by Mode The third method is to pay a flat fee per trip that varies by the type of trip. Massachusetts is the only state to use this method. The broker’s incentives depend on the rates. If rates for certain trips are relatively more profitable, the broker has an incentive to arrange excessive amounts of that type of trip. On the other hand, if reimbursement rates are too low for certain types of trips, the broker has an incentive to assign recipients to other, possibly inappropriate modes of transportation.
Flat Fee per Trip Unvaried by Mode The fourth method is payment of a flat per trip fee that does not vary by the type of trip. Oregon is the only state to use this method. The state evaluates the rate quarterly and adjusts it as necessary. Under this model brokers have an incentive to ensure use of the lowest‐cost providers, but they also have the incentive to deny trips requiring expensive modes of transportation.
Administrative Fee plus Direct Trip Cost Reimbursement The fifth method is the payment of a flat administrative fee plus reimbursement for the trip cost paid to the provider. Maine, Vermont, and Washington use this payment structure. This payment method provides less incentive for brokers to ensure use of the least costly trip type, but even so, Washington, which has one of the oldest brokerage systems, has been successful with this structure.
Type of Broker Brokers can be broadly categorized as for‐profit firms, transit authorities, or non‐profit human services organizations.
Forprofit Firms LogistiCare Solutions, LLC (LogistiCare), a for‐profit medical transportation firm, is the dominant NEMT broker. It is the broker for five of the seven states that use a single statewide broker: Delaware, Missouri, Nevada, Oklahoma, and Virginia. In addition, it is the regional broker for one or more regions in several states, including Connecticut, Georgia, and Virginia.
Nonprofit Organizations Non‐profit human services organizations are also brokers in several states. For example, Hennepin County’s Metropolitan Health Plan is the broker for the county. Local agencies on aging, development councils, and other non‐profit organizations are regional brokers in several states, including Oregon, Washington, and Arkansas. No human services agencies are statewide brokers.
103 Brokerages
Public Transit Agencies Transit authorities are the sole transportation brokers in Rhode Island and Massachusetts. In Massachusetts the nine regional transit agencies are the brokers for their respective regions. Oklahoma began its brokerage system with the Metropolitan Tulsa Transit Authority as the statewide broker, but the transit authority withdrew when the state imposed stricter payment caps, and LogistiCare took its place. In states with regional brokerage systems, it is common for a mix of agencies to be brokers. In Arkansas, for example, Medical Transportation Management, local agencies on aging, and development councils are brokers for the state’s eleven regions.
Managed Care States can carve medical transportation into managed care contracts, making managed care organizations (MCOs) responsible for providing NEMT for their clients. Even so, a state must still ensure access to NEMT for its fee‐for‐service population. Missouri accomplishes this through a statewide contract with LogistiCare. A number of states choose to carve NEMT out of managed care. In Delaware, for example, NEMT is carved out of Medicaid managed care and administered under a statewide contract with LogistiCare.
Brokers as Providers In some states brokers provide some trips directly and schedule others with subcontracted providers. In Kentucky the fact that ten brokers also provide trips directly has led to perceptions of unfairness in trip distribution among providers. Similarly, Washington state officials have stated that they would not allow brokers to provide trips if they could redesign their system, and the state offers financial incentives to brokers that do not provide any trips directly. Pending approval of proposed national Medicaid rules, the option of a broker operating as a provider will be prohibited. The exception will be that a broker can be the provider of last choice. Only when no other provider is available could the broker directly provide the trip.
Coordination with Human Services Programs Transportation brokers coordinate transportation for other human service agencies in several states. In Massachusetts, for example, regional brokers also serve the Department of Mental Retardation and the Department of Public Health Early Intervention Program. However, Medicaid recipients usually make up the vast majority of clients and occupy the largest share of a state’s human services transportation expenses. In addition, serving multiple programs may be difficult due to different procedures and provider standards for different programs. Several states, for example, Georgia, Utah, and Virginia, indicated that CMS rules prohibit combining Medicaid NEMT with other programs. On the other hand, Washington does coordinate their NEMT with other programs, which they are allowed to do because the cost for NEMT is kept separate from the other programs. It is a matter of keeping detailed and separate accounts between NEMT and other users.
104 Brokerages
105 Brokerages
Advantages of the Brokerage Model By performing the above listed functions, a transportation broker can ensure the availability of appropriate transportation throughout its range of service, simplify the process of obtaining NEMT for consumers, increase the efficiency of the transportation network, and virtually eliminate fraud and abuse. A transportation broker ensures the availability of appropriate transportation throughout its range of service by utilizing its greater flexibility in contracting with providers in order to meet the obligation of providing equal access to transportation service. In contrast, under the fee‐for‐service model, fees may not offer an adequate incentive for transportation providers to operate certain types of transportation, such as wheelchair vans in rural areas where trip costs are high. A broker simplifies the process of obtaining NEMT for recipients by providing a single number that all recipients in its range of service can call to obtain NEMT. Under the fee‐for‐service model, consumers are typically responsible for finding an appropriate transportation provider or contacting the local Medicaid office to obtain reimbursement after a trip has been taken. A broker increases the efficiency of the transportation network by reducing service duplication and coordinating trips to increase the number of passengers per vehicle. More efficient transportation networks can allow for longer service hours and the provision of more trips. A broker eliminates fraud and abuse by verifying the Medicaid eligibility of callers, confirming that trip requests are for Medicaid‐covered services, ensuring that scheduled trips take place, and ensuring that no unauthorized trips take place. The primary role of the state Medicaid agency in a brokerage system is to oversee broker operations. Agencies typically maintain a toll‐free complaint line; perform recipient surveys, on‐site reviews, and incognito ride‐alongs; and require financial audits of the broker. To summarize the options for NEMT brokerages, Tables 4 through 6 are presented.
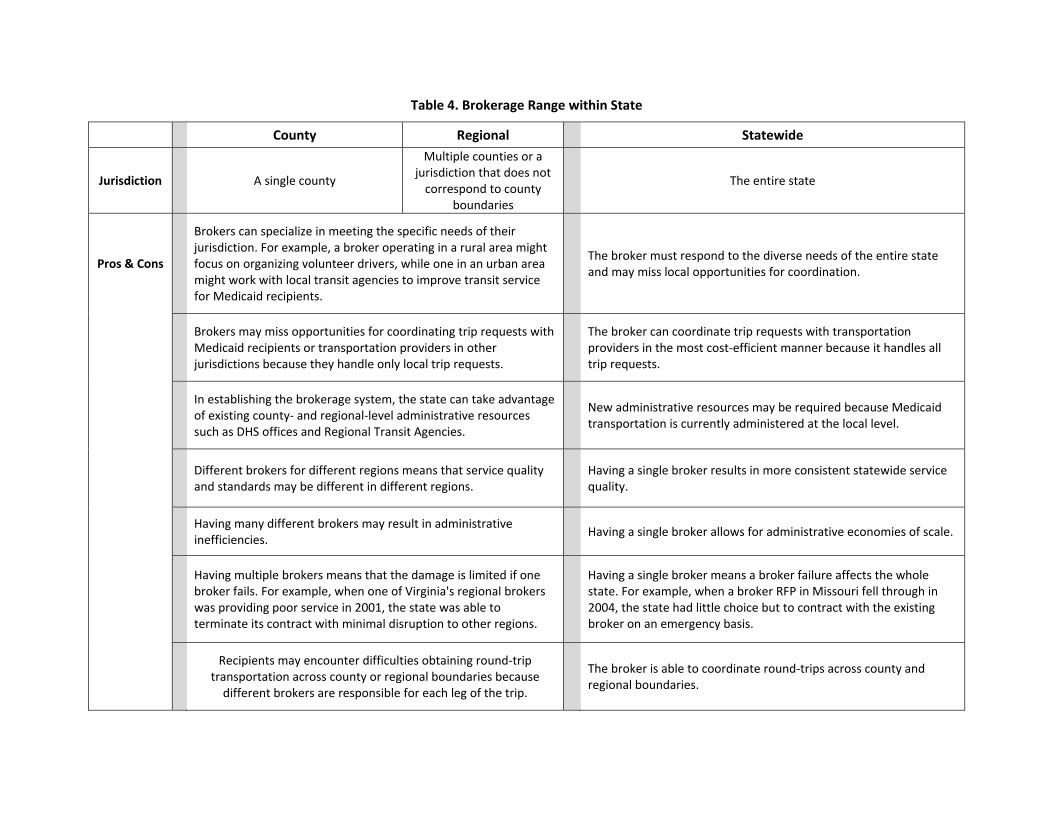
Table 4. Brokerage Range within State
County Regional Statewide
Jurisdiction
A single county
Multiple counties or a jurisdiction that does not correspond to county
boundaries
The entire state
Pros & Cons
Brokers can specialize in meeting the specific needs of their jurisdiction. For example, a broker operating in a rural area might focus on organizing volunteer drivers, while one in an urban area might work with local transit agencies to improve transit service for Medicaid recipients.
The broker must respond to the diverse needs of the entire state and may miss local opportunities for coordination.
Brokers may miss opportunities for coordinating trip requests with Medicaid recipients or transportation providers in other jurisdictions because they handle only local trip requests.
The broker can coordinate trip requests with transportation providers in the most cost‐efficient manner because it handles all trip requests.
In establishing the brokerage system, the state can take advantage of existing county‐ and regional‐level administrative resources such as DHS offices and Regional Transit Agencies.
New administrative resources may be required because Medicaid transportation is currently administered at the local level.
Different brokers for different regions means that service quality and standards may be different in different regions.
Having a single broker results in more consistent statewide service quality.
Having many different brokers may result in administrative inefficiencies.
Having a single broker allows for administrative economies of scale.
Having multiple brokers means that the damage is limited if one broker fails. For example, when one of Virginia's regional brokers was providing poor service in 2001, the state was able to terminate its contract with minimal disruption to other regions.
Having a single broker means a broker failure affects the whole state. For example, when a broker RFP in Missouri fell through in 2004, the state had little choice but to contract with the existing broker on an emergency basis.
Recipients may encounter difficulties obtaining round‐trip
transportation across county or regional boundaries because different brokers are responsible for each leg of the trip.
The broker is able to coordinate round‐trips across county and regional boundaries.
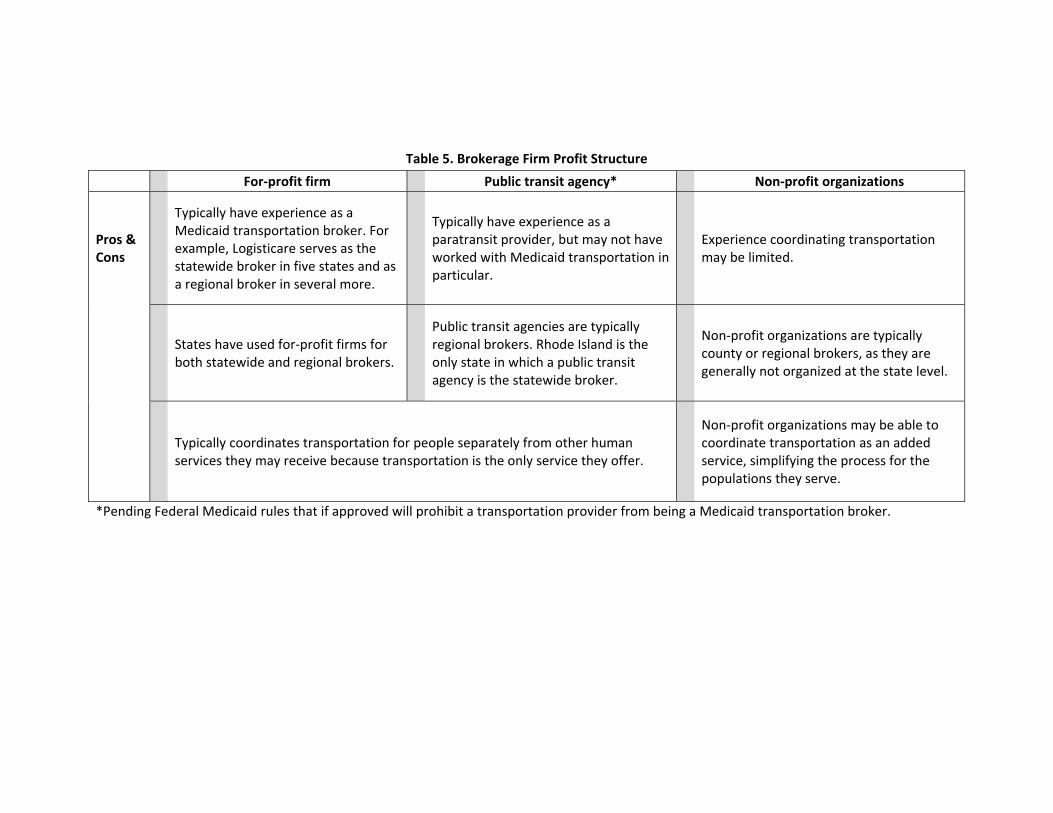
Table 5. Brokerage Firm Profit Structure
For‐profit firm Public transit agency* Non‐profit organizations
Pros & Cons
Typically have experience as a Medicaid transportation broker. For example, Logisticare serves as the statewide broker in five states and as a regional broker in several more.
Typically have experience as a paratransit provider, but may not have worked with Medicaid transportation in particular.
Experience coordinating transportation may be limited.
States have used for‐profit firms for both statewide and regional brokers.
Public transit agencies are typically regional brokers. Rhode Island is the only state in which a public transit agency is the statewide broker.
Non‐profit organizations are typically county or regional brokers, as they are generally not organized at the state level.
Typically coordinates transportation for people separately from other human services they may receive because transportation is the only service they offer.
*Pending Federal Medicaid rules that if approved will prohibit a transportation provider from being a Medicaid transportation broker.
Non‐profit organizations may be able to coordinate transportation as an added service, simplifying the process for the populations they serve.
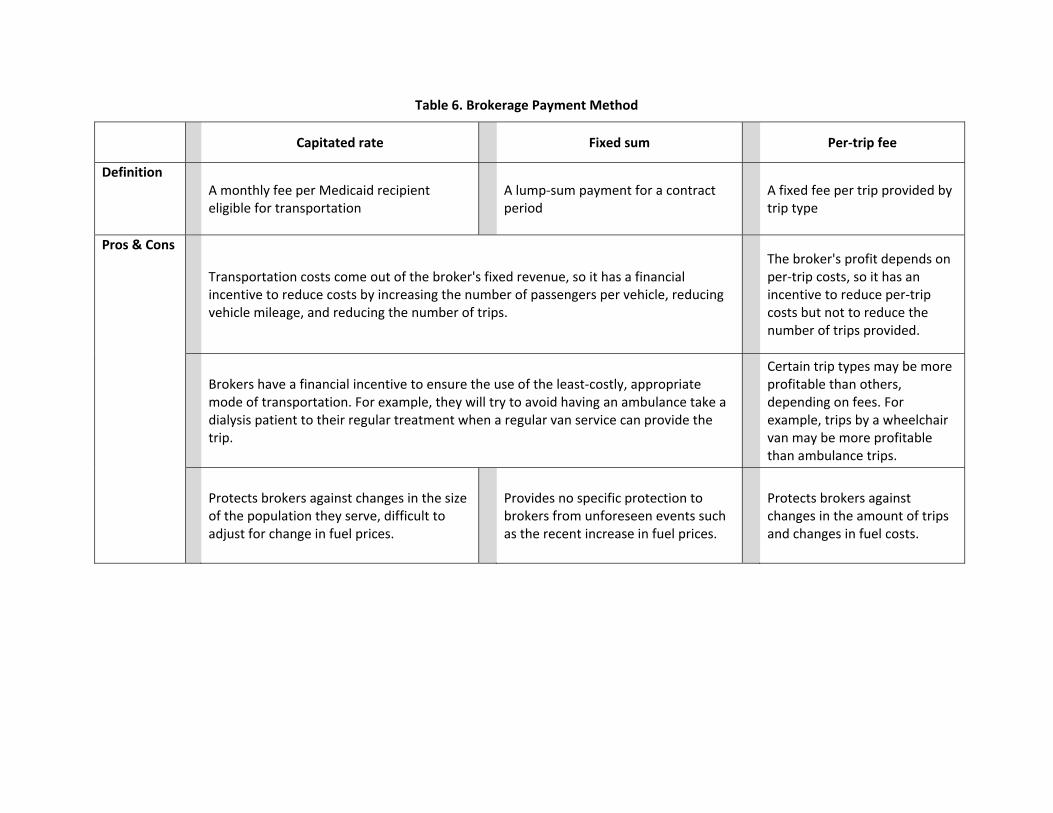
Table 6. Brokerage Payment Method
Capitated rate Fixed sum Per‐trip fee
Definition A monthly fee per Medicaid recipient eligible for transportation
A lump‐sum payment for a contract period
A fixed fee per trip provided by trip type
Pros & Cons
Transportation costs come out of the broker's fixed revenue, so it has a financial incentive to reduce costs by increasing the number of passengers per vehicle, reducing vehicle mileage, and reducing the number of trips.
The broker's profit depends on per‐trip costs, so it has an incentive to reduce per‐trip costs but not to reduce the number of trips provided.
Brokers have a financial incentive to ensure the use of the least‐costly, appropriate mode of transportation. For example, they will try to avoid having an ambulance take a dialysis patient to their regular treatment when a regular van service can provide the trip.
Certain trip types may be more profitable than others, depending on fees. For example, trips by a wheelchair van may be more profitable than ambulance trips.
Protects brokers against changes in the size of the population they serve, difficult to adjust for change in fuel prices.
Provides no specific protection to brokers from unforeseen events such as the recent increase in fuel prices.
Protects brokers against changes in the amount of trips and changes in fuel costs.
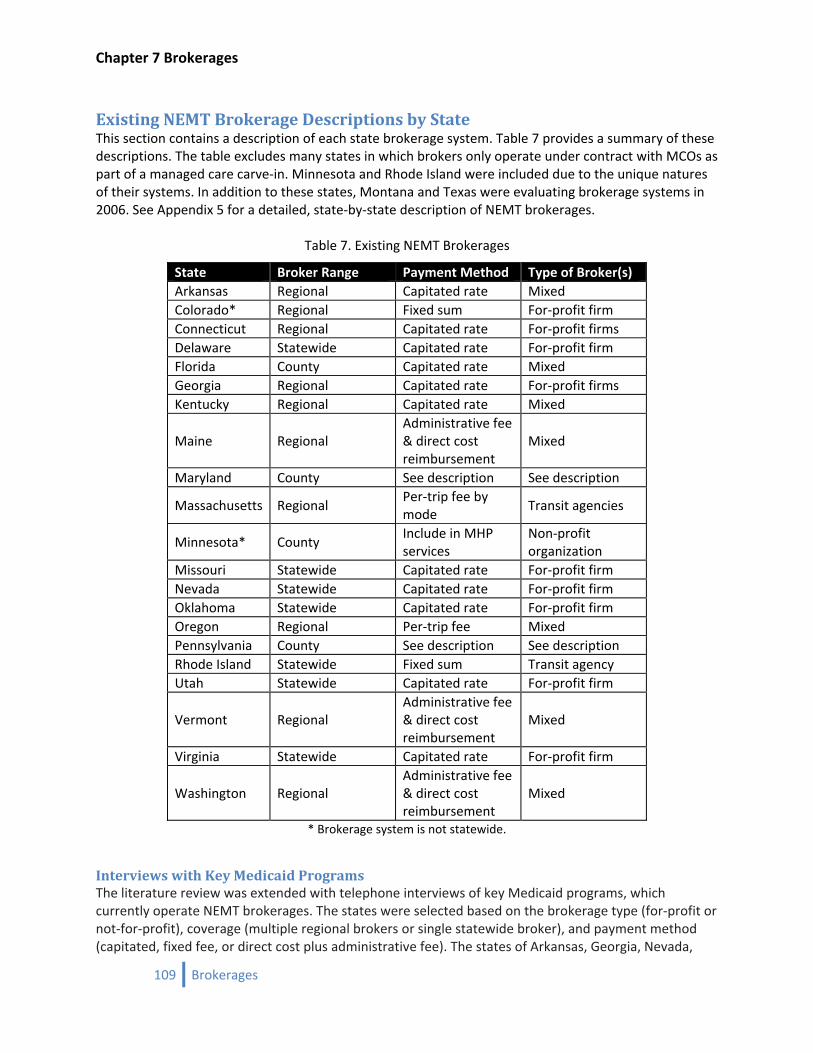
Chapter 7 Brokerages
Existing NEMT Brokerage Descriptions by State This section contains a description of each state brokerage system. Table 7 provides a summary of these descriptions. The table excludes many states in which brokers only operate under contract with MCOs as part of a managed care carve‐in. Minnesota and Rhode Island were included due to the unique natures of their systems. In addition to these states, Montana and Texas were evaluating brokerage systems in 2006. See Appendix 5 for a detailed, state‐by‐state description of NEMT brokerages.
Table 7. Existing NEMT Brokerages
State Broker Range Payment Method Type of Broker(s) Arkansas Regional Capitated rate Mixed Colorado* Regional Fixed sum For‐profit firm Connecticut Regional Capitated rate For‐profit firms Delaware Statewide Capitated rate For‐profit firm Florida County Capitated rate Mixed Georgia Regional Capitated rate For‐profit firms Kentucky Regional Capitated rate Mixed
Maine Regional Administrative fee & direct cost reimbursement
Mixed
Maryland County See description See description
Massachusetts Regional Per‐trip fee by mode
Transit agencies
Minnesota* County Include in MHP services
Non‐profit organization
Missouri Statewide Capitated rate For‐profit firm Nevada Statewide Capitated rate For‐profit firm Oklahoma Statewide Capitated rate For‐profit firm Oregon Regional Per‐trip fee Mixed Pennsylvania County See description See description Rhode Island Statewide Fixed sum Transit agency Utah Statewide Capitated rate For‐profit firm
Vermont Regional Administrative fee & direct cost reimbursement
Mixed
Virginia Statewide Capitated rate For‐profit firm
Washington Regional Administrative fee & direct cost reimbursement
Mixed
* Brokerage system is not statewide.
Interviews with Key Medicaid Programs The literature review was extended with telephone interviews of key Medicaid programs, which currently operate NEMT brokerages. The states were selected based on the brokerage type (for‐profit or not‐for‐profit), coverage (multiple regional brokers or single statewide broker), and payment method (capitated, fixed fee, or direct cost plus administrative fee). The states of Arkansas, Georgia, Nevada,
109 Brokerages
Chapter 7 Brokerages
Utah, Virginia, and Washington were interviewed. Complete transcripts (except for Arkansas) are included in Appendix 5.
Georgia Georgia began their brokerage in October of 1997. It is a mix of for‐profit firms and not‐for‐profit organizations (LogistiCare, SoutheastTrans, and South West Georgia Development Center). The system consists of five regions served by three brokers. LogistiCare serves three regions with the other two regions served by a broker each. Georgia uses a capitated rate that does not include price adjustments for increased fuel costs. They had about 370,000 members using the system in 2007 out of 1.1 million Medicaid members. The total number of trips was about 2.7 million. The Medicaid program attributes trip cost reductions due to a sharp reduction in fraud and abuse of the prior fee‐for‐service system.
Nevada Nevada began their brokerage in October 2005; It consists of a single, statewide, for‐profit firm (LogistiCare). Nevada uses a capitated rate of $4.10 per member per month ($2.00 per member per month in 2003). Nevada also has a complex adjustment scheme for compensating fuel cost increases. They require the brokerage firm to lose all its profits prior to increasing rates. The broker must also return excess profits if costs dip below the current contracted rate. Currently, the Medicaid population in Nevada is 185,000 ‐ 200,000 people. As of March 2008, they had 29,989 rides, whereas in March 2007 they had 26,719 rides.
Utah Utah began with an RFP for a statewide sole source provider in the 90s. The sole source provider is Pick‐Me‐Up (a for‐profit firm). They use a capitated rate for reimbursement of non‐emergency medical trips, which is $1.0175 per member per month. Pick‐Me‐Up serves a small subpopulation of Medicaid members. It is not available to all Medicaid members, only those that are found medically needy and do not have access to a private vehicle. Utah requires the consumer to either drive themselves or have someone else drive if there is a vehicle present in the household. This system is very restrictive and not a good model for Iowa.
Virginia Their broker began in 1998. They split the state into seven regions that followed boundaries of existing medical services. LogisticCare won all seven regions, so by default it is a single statewide provider running a single call center while keeping regional offices. Virginia uses a capitated rate that varies by Medicaid member classification (dollar/person/month for example ranges from $300/month $0.10/month). Currently they serve 775,000 people in Medicaid, most of those in managed care 230,000 fee‐for‐service members and make over 3.5 million rides with an additional 1 million for managed care.
Washington Washington developed the brokerage in the late 1980s due to high costs. They have multiple brokers serving 13 regions. There is a mix of firms, but all are local to the state. They use a direct cost plus an administrative fee structure for reimbursement. The administrative fees are about $3.00 per trip. Currently, they serve 4 to 6% of all Medicaid Members (1 million) per month adding up to three million trips at a cost of $70 million per year.
110 Brokerages
Chapter 7 Brokerages
111 Brokerages
General Recommendation from the Key States All the states interviewed recommend that oversight of the NEMT brokerage system to be done by at least one full‐time Medicaid staff person. The role of the person is critical to maintaining high quality transportation services by implementing a quality control program. The quality control should consist of regularly auditing transportation manifests, announced and surprise on‐site inspections of transportation providers and brokers for contract compliance, and an annual consumer satisfaction survey. Education and promotion of the NEMT system to new consumers and medical service providers falls under the purview of the Medicaid staff. Most importantly, the Medicaid staff is the arbiter of consumer grievances that could not be resolved by the broker. The common experience is the Medicaid staff members have a great working relationship with their brokers and therefore short circuit situations before they become large problems.
Conclusions At least 21 states use a transportation brokerage system to administer some or all non‐emergency Medicaid transportation (NEMT). The brokerage model boasts numerous advantages over the traditional fee‐for‐service model. A transportation broker can ensure the availability of appropriate transportation throughout its range of service, simplify the process of obtaining NEMT for recipients, increase the efficiency of the transportation network, and virtually eliminate fraud and abuse. A variety of brokerage systems exist, but they can be broadly categorized by the broker’s range of services, the method of payment to the broker, the broker type, whether NEMT is included in Medicaid managed care, whether the broker is allowed to provide trips, and whether the broker coordinates transportation for other human services agencies. A broker’s range of service can cover a single county, a multi‐county region, or an entire state. States pay brokers either a fixed amount, a capitated rate, a flat fee per trip varied by mode, a flat fee per trip unvaried by mode, or an administrative fee plus direct trip cost reimbursement. Brokers are a mix of for‐profit firms, transit agencies, and non‐profit human services organizations. Some states that have NEMT included in Medicaid managed care use a brokerage system for their fee‐for‐service population. Some brokers provide NEMT trips directly in addition to using subcontracted transportation providers. However, that model may not be allowed pending approval of Federal regulation that prohibits brokers from being transportation providers, except as a provider of last resort. Brokers in some states also coordinate trips for other human services agencies.

Chapter 8 Transportation Costs
112 Brokerages
Chapter 8 Transportation Costs
Chapter 8 General Trip Cost Estimates for NEMT
113 Brokerages

Chapter 8 Transportation Costs
114 Brokerages
Chapter 8 Transportation Costs
115 Brokerages
Transportation Costs for NEMT Services This section provides guidelines to develop cost estimates for non‐emergency medical transportation (NEMT) which can eventually be used by the DHS in analyzing the cost‐effectiveness of providing transportation services. NEMT costs, by their nature, differ by location (region of the state and urban or rural) and by the nature of transportation service required (i.e., ambulatory, fixed route, taxi etc.). In addition, cost per trip may vary depending on the managerial skills and technical know‐how of the transportation provider. For example, in the state of Georgia, LogistiCare Solutions, a for‐profit medical transportation firm and the most dominant NEMT broker in the country helped reduce costs through eligibility screening, scheduling, routing, dispatch, and billing from $30 per trip in 1997 to $16 per trip in 2003.22 Also, the reformed brokerage program in Kentucky helped in reducing the amount paid per trip from $29.03 to $23.86 which is equivalent to a 17.8 percent reduction in average cost in just two years.23 Given the lack of transportation cost data specific to the Iowa Medicaid program, we had to draw upon examples supplied by other states. Table 8 shows the characteristics of NEMT brokerage systems and per trip costs in states with NEMT brokerages. It is evident that costs per trip vary from one state to another. The cost per trip may be as high as $33.58 in Arkansas, which has a regional capitated rate system, and as low as $0.45 in Rhode Island which has a statewide service but follows a fixed sum payment method. For additional comparisons, we relied on national and regional transit data. For example, the Community Transportation Association of America (CTAA) conducted a survey in 2000 and estimated a national average cost for Medicaid trips at $16 per trip. The average is independent of transportation service type. More elaborate cost estimates are available for the state of Washington. As a reminder, Washington utilizes an administrative fee plus direct cost for reimbursement to the brokers. This payment method provides less incentive than other forms of payment for brokers to obtain the least costly trip, but even so, Washington, which has one of the oldest brokerage systems, has been successful with this structure. Table 9 provides the total number of trips and related costs (for year 2006‐07) for different kinds of modes including ambulatory, paratransit service, and other fixed‐route transportation. The average service cost per trip was $17.16. That increased to $20.46 when service charges for out‐of‐state trips were included. Virginia also provided detailed cost estimates for its NEMT services. The state ensures access to transportation for the fee‐for‐service population through a regional (seven in total), capitated contract with LogistiCare. Table 10 shows the total number of trips and cost per trip for three different kinds of modes (i.e., non‐emergency ambulance, taxi, and wheelchair van). The average cost per trip for a non‐ emergency ambulance is $148.60, whereas cost per trip for taxi is $10.75.
22 Sundeen, M., Reed, M., and Savage, M. (2005). Coordinated Human Service Transportation: State Legislative Approaches. National Conference of State Legislatures, Washington.
23 O’Connell, L. Grossardt, T., Siria, B., Marchand, S., McDormand, M. (2002). Efficiency Through Accountability: Some Lessons from Kentucky’s Improved Medicaid Transit Service. Journal of Transportation and Statistics.
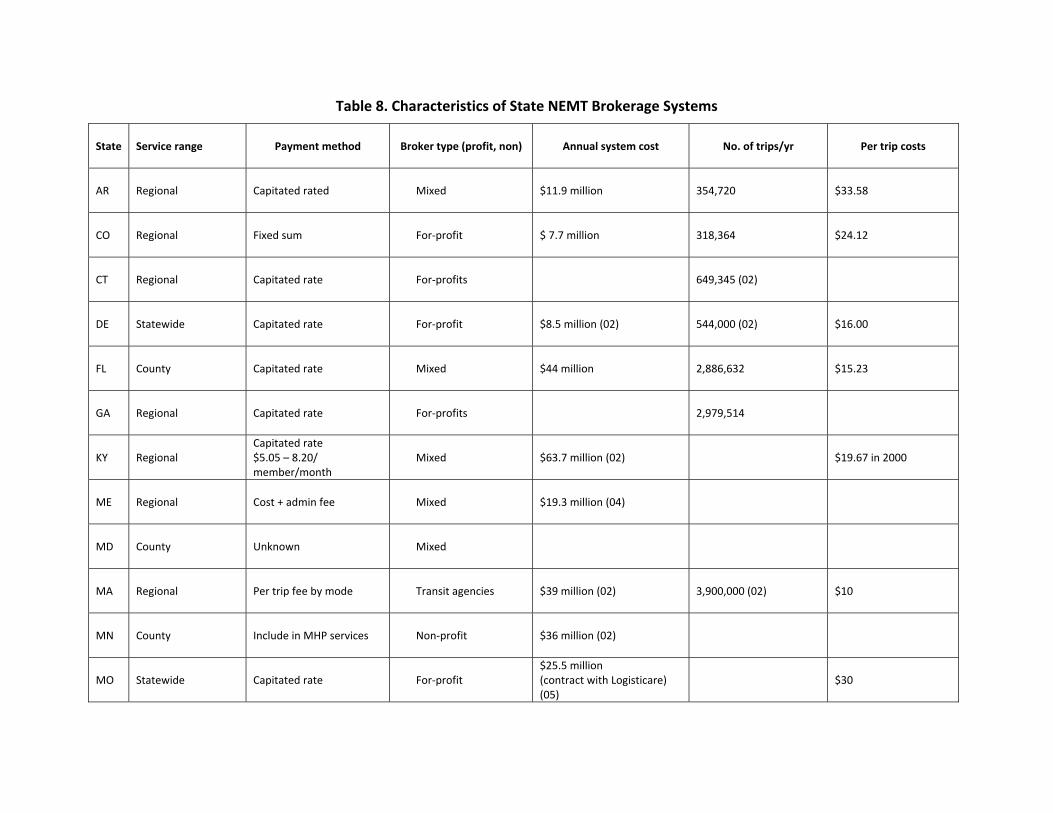
Table 8. Characteristics of State NEMT Brokerage Systems
State Service range Payment method Broker type (profit, non) Annual system cost No. of trips/yr Per trip costs
AR Regional Capitated rated Mixed $11.9 million 354,720 $33.58
CO Regional Fixed sum For‐profit $ 7.7 million 318,364 $24.12
CT Regional Capitated rate For‐profits 649,345 (02)
DE Statewide Capitated rate For‐profit $8.5 million (02) 544,000 (02) $16.00
FL County Capitated rate Mixed $44 million 2,886,632 $15.23
GA Regional Capitated rate For‐profits 2,979,514
KY Regional Capitated rate $5.05 – 8.20/ member/month
Mixed $63.7 million (02) $19.67 in 2000
ME Regional Cost + admin fee Mixed $19.3 million (04)
MD County Unknown Mixed
MA Regional Per trip fee by mode Transit agencies $39 million (02) 3,900,000 (02) $10
MN County Include in MHP services Non‐profit $36 million (02)
MO Statewide Capitated rate For‐profit $25.5 million (contract with Logisticare) (05)
$30
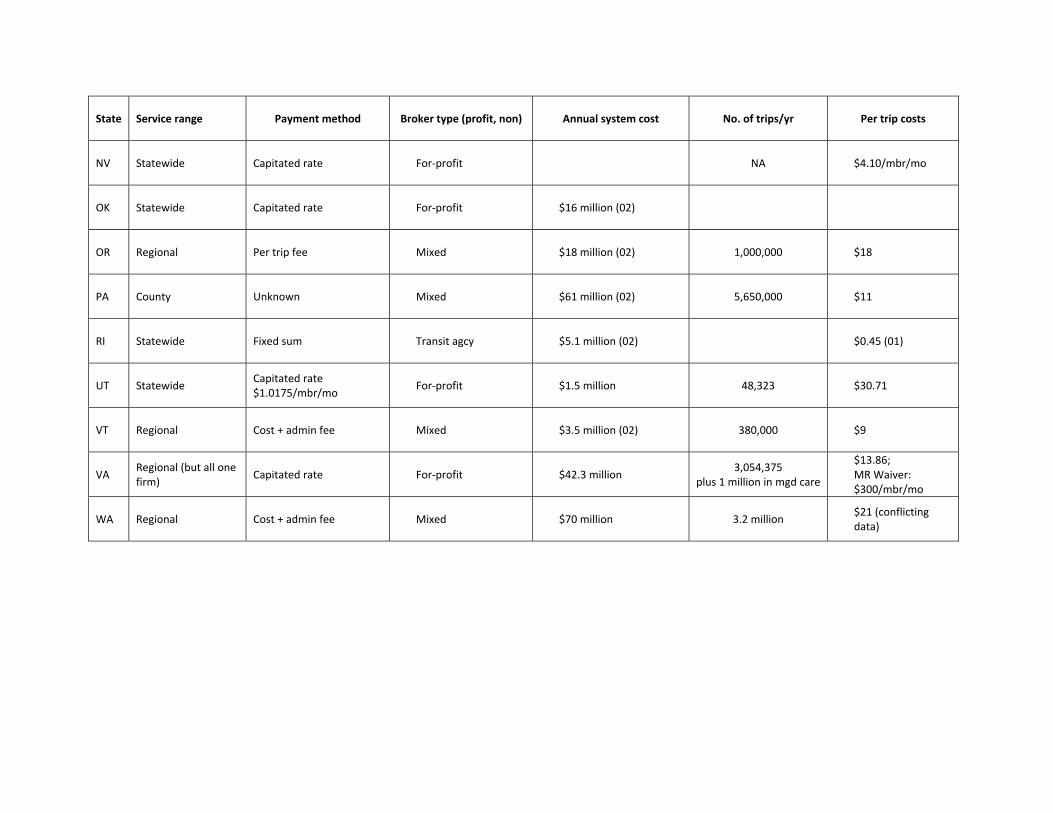
State Service range Payment method Broker type (profit, non) Annual system cost No. of trips/yr Per trip costs
NV Statewide Capitated rate For‐profit NA $4.10/mbr/mo
OK Statewide Capitated rate For‐profit $16 million (02)
OR Regional Per trip fee Mixed $18 million (02) 1,000,000 $18
PA County Unknown Mixed $61 million (02) 5,650,000 $11
RI Statewide Fixed sum Transit agcy $5.1 million (02) $0.45 (01)
UT Statewide Capitated rate $1.0175/mbr/mo
For‐profit $1.5 million 48,323 $30.71
VT Regional Cost + admin fee Mixed $3.5 million (02) 380,000 $9
VA Regional (but all one firm)
Capitated rate For‐profit $42.3 million 3,054,375
plus 1 million in mgd care
$13.86; MR Waiver: $300/mbr/mo
WA Regional Cost + admin fee Mixed $70 million 3.2 million $21 (conflicting data)
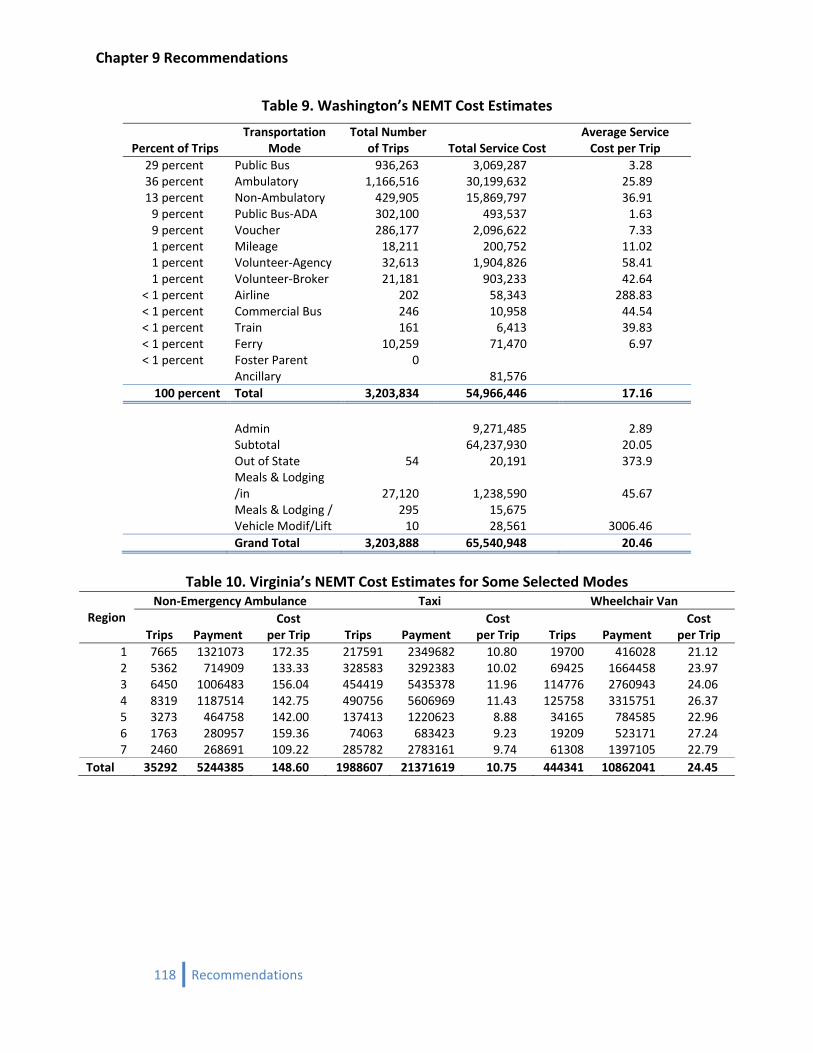
Chapter 9 Recommendations
Table 9. Washington’s NEMT Cost Estimates
Percent of Trips Transportation
Mode Total Number
of Trips Total Service Cost Average Service Cost per Trip
29 percent Public Bus 936,263 3,069,287 3.28 36 percent Ambulatory 1,166,516 30,199,632 25.89 13 percent Non‐Ambulatory 429,905 15,869,797 36.91 9 percent Public Bus‐ADA 302,100 493,537 1.63 9 percent Voucher 286,177 2,096,622 7.33 1 percent Mileage 18,211 200,752 11.02 1 percent Volunteer‐Agency 32,613 1,904,826 58.41 1 percent Volunteer‐Broker 21,181 903,233 42.64
< 1 percent Airline 202 58,343 288.83 < 1 percent Commercial Bus 246 10,958 44.54 < 1 percent Train 161 6,413 39.83 < 1 percent Ferry 10,259 71,470 6.97 < 1 percent Foster Parent 0
Ancillary 81,576100 percent Total 3,203,834 54,966,446 17.16
Admin 9,271,485 2.89 Subtotal 64,237,930 20.05 Out of State 54 20,191 373.9
Meals & Lodging /in 27,120 1,238,590 45.67
Meals & Lodging / 295 15,675 Vehicle Modif/Lift 10 28,561 3006.46 Grand Total 3,203,888 65,540,948 20.46
Table 10. Virginia’s NEMT Cost Estimates for Some Selected Modes
Region Non‐Emergency Ambulance Taxi Wheelchair Van
Trips Payment Cost
per Trip Trips Payment Cost
per Trip Trips Payment Cost
per Trip 1 7665 1321073 172.35 217591 2349682 10.80 19700 416028 21.12 2 5362 714909 133.33 328583 3292383 10.02 69425 1664458 23.973 6450 1006483 156.04 454419 5435378 11.96 114776 2760943 24.064 8319 1187514 142.75 490756 5606969 11.43 125758 3315751 26.37 5 3273 464758 142.00 137413 1220623 8.88 34165 784585 22.96 6 1763 280957 159.36 74063 683423 9.23 19209 523171 27.24 7 2460 268691 109.22 285782 2783161 9.74 61308 1397105 22.79
Total 35292 5244385 148.60 1988607 21371619 10.75 444341 10862041 24.45
118 Recommendations
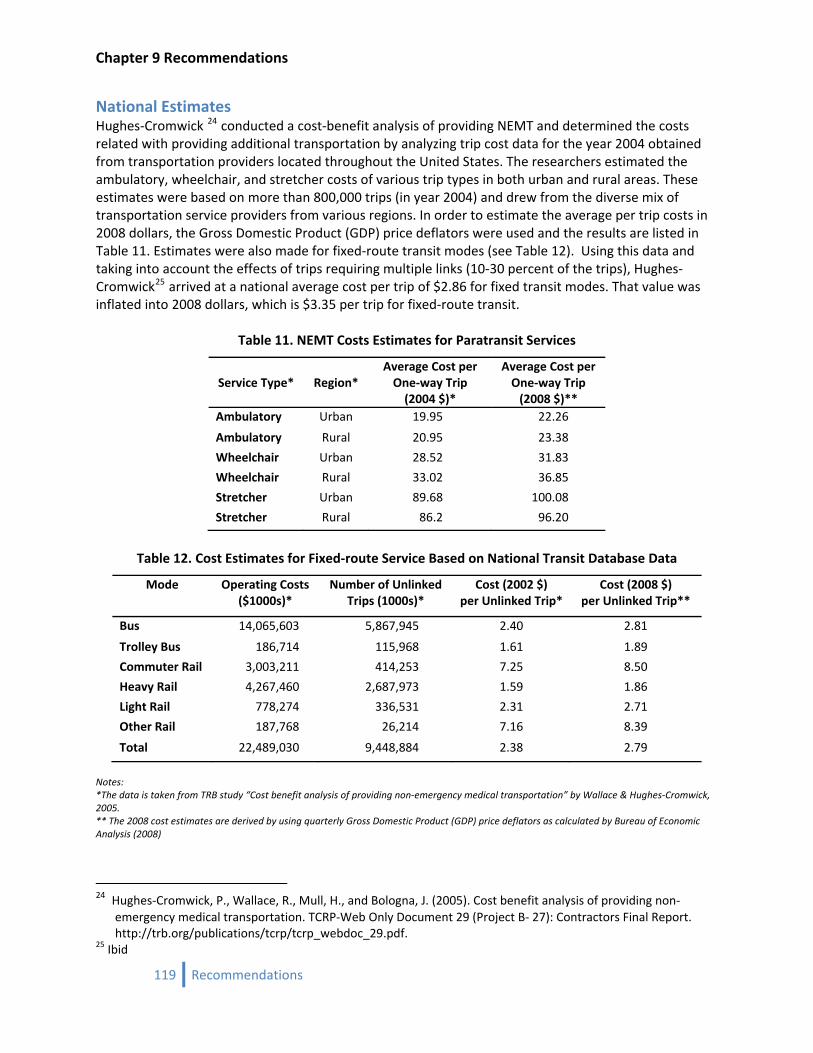
Chapter 9 Recommendations
119 Recommendations
National Estimates Hughes‐Cromwick 24 conducted a cost‐benefit analysis of providing NEMT and determined the costs related with providing additional transportation by analyzing trip cost data for the year 2004 obtained from transportation providers located throughout the United States. The researchers estimated the ambulatory, wheelchair, and stretcher costs of various trip types in both urban and rural areas. These estimates were based on more than 800,000 trips (in year 2004) and drew from the diverse mix of transportation service providers from various regions. In order to estimate the average per trip costs in 2008 dollars, the Gross Domestic Product (GDP) price deflators were used and the results are listed in Table 11. Estimates were also made for fixed‐route transit modes (see Table 12). Using this data and taking into account the effects of trips requiring multiple links (10‐30 percent of the trips), Hughes‐Cromwick25 arrived at a national average cost per trip of $2.86 for fixed transit modes. That value was inflated into 2008 dollars, which is $3.35 per trip for fixed‐route transit.
Table 11. NEMT Costs Estimates for Paratransit Services
Service Type* Region*
Average Cost per One‐way Trip (2004 $)*
Average Cost per One‐way Trip (2008 $)**
Ambulatory Urban 19.95 22.26
Ambulatory Rural 20.95 23.38
Wheelchair Urban 28.52 31.83
Wheelchair Rural 33.02 36.85
Stretcher Urban 89.68 100.08
Stretcher Rural 86.2 96.20
Table 12. Cost Estimates for Fixed‐route Service Based on National Transit Database Data
Mode Operating Costs ($1000s)*
Number of Unlinked Trips (1000s)*
Cost (2002 $) per Unlinked Trip*
Cost (2008 $) per Unlinked Trip**
Bus 14,065,603 5,867,945 2.40 2.81
Trolley Bus 186,714 115,968 1.61 1.89
Commuter Rail 3,003,211 414,253 7.25 8.50
Heavy Rail 4,267,460 2,687,973 1.59 1.86
Light Rail 778,274 336,531 2.31 2.71
Other Rail 187,768 26,214 7.16 8.39
Total 22,489,030 9,448,884 2.38 2.79
Notes: *The data is taken from TRB study “Cost benefit analysis of providing non‐emergency medical transportation” by Wallace & Hughes‐Cromwick, 2005. ** The 2008 cost estimates are derived by using quarterly Gross Domestic Product (GDP) price deflators as calculated by Bureau of Economic Analysis (2008)
24 Hughes‐Cromwick, P., Wallace, R., Mull, H., and Bologna, J. (2005). Cost benefit analysis of providing non‐
emergency medical transportation. TCRP‐Web Only Document 29 (Project B‐ 27): Contractors Final Report. http://trb.org/publications/tcrp/tcrp_webdoc_29.pdf.
25 Ibid
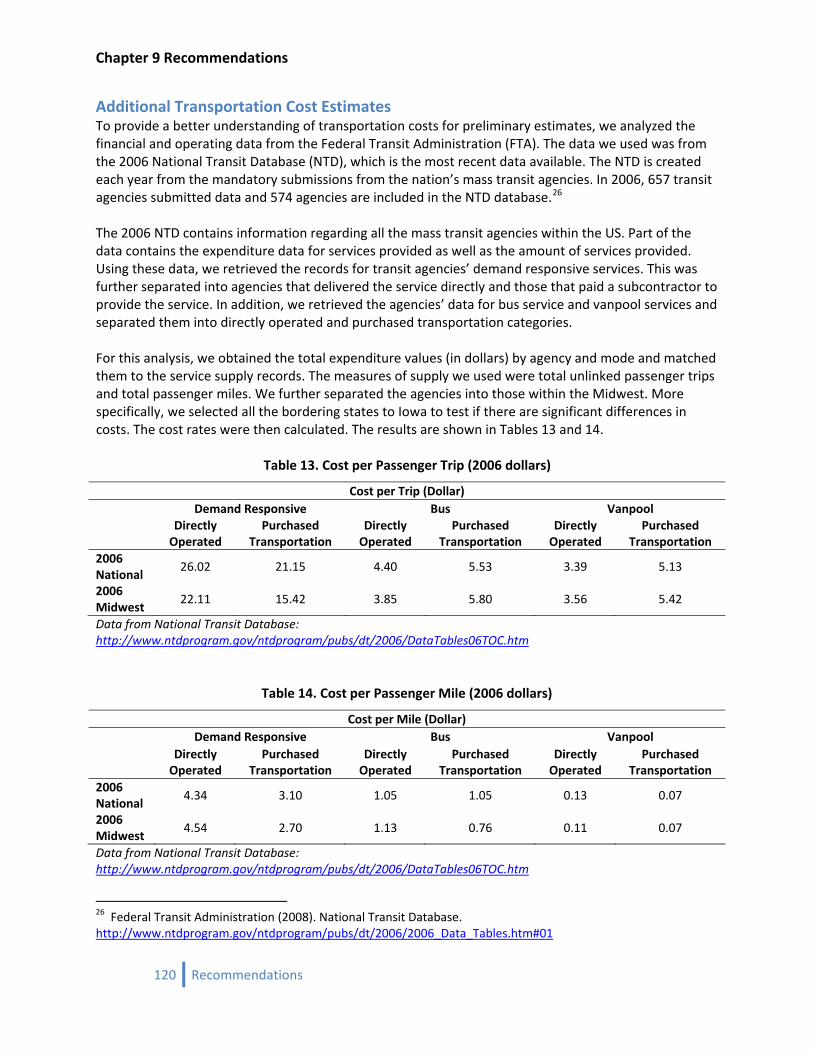
Chapter 9 Recommendations
120 Recommendations
Additional Transportation Cost Estimates To provide a better understanding of transportation costs for preliminary estimates, we analyzed the financial and operating data from the Federal Transit Administration (FTA). The data we used was from the 2006 National Transit Database (NTD), which is the most recent data available. The NTD is created each year from the mandatory submissions from the nation’s mass transit agencies. In 2006, 657 transit agencies submitted data and 574 agencies are included in the NTD database.26 The 2006 NTD contains information regarding all the mass transit agencies within the US. Part of the data contains the expenditure data for services provided as well as the amount of services provided. Using these data, we retrieved the records for transit agencies’ demand responsive services. This was further separated into agencies that delivered the service directly and those that paid a subcontractor to provide the service. In addition, we retrieved the agencies’ data for bus service and vanpool services and separated them into directly operated and purchased transportation categories. For this analysis, we obtained the total expenditure values (in dollars) by agency and mode and matched them to the service supply records. The measures of supply we used were total unlinked passenger trips and total passenger miles. We further separated the agencies into those within the Midwest. More specifically, we selected all the bordering states to Iowa to test if there are significant differences in costs. The cost rates were then calculated. The results are shown in Tables 13 and 14.
Table 13. Cost per Passenger Trip (2006 dollars)
Cost per Trip (Dollar) Demand Responsive Bus Vanpool
Directly Operated
Purchased Transportation
Directly Operated
Purchased Transportation
Directly Operated
Purchased Transportation
2006 National
26.02 21.15 4.40 5.53 3.39 5.13
2006 Midwest
22.11 15.42 3.85 5.80 3.56 5.42
Data from National Transit Database: http://www.ntdprogram.gov/ntdprogram/pubs/dt/2006/DataTables06TOC.htm
Table 14. Cost per Passenger Mile (2006 dollars)
Cost per Mile (Dollar)
Demand Responsive Bus Vanpool
Directly Operated
Purchased Transportation
Directly Operated
Purchased Transportation
Directly Operated
Purchased Transportation
2006 National
4.34 3.10 1.05 1.05 0.13 0.07
2006 Midwest
4.54 2.70 1.13 0.76 0.11 0.07
Data from National Transit Database: http://www.ntdprogram.gov/ntdprogram/pubs/dt/2006/DataTables06TOC.htm
26 Federal Transit Administration (2008). National Transit Database. http://www.ntdprogram.gov/ntdprogram/pubs/dt/2006/2006_Data_Tables.htm#01
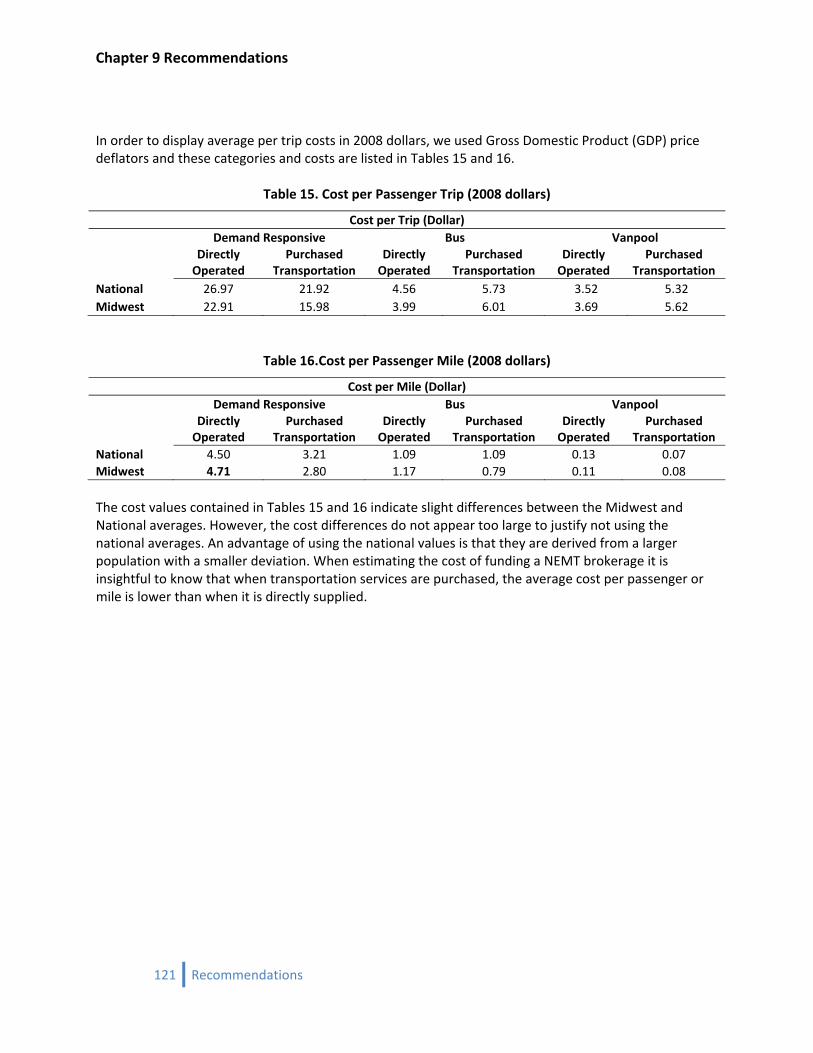
Chapter 9 Recommendations
In order to display average per trip costs in 2008 dollars, we used Gross Domestic Product (GDP) price deflators and these categories and costs are listed in Tables 15 and 16.
Table 15. Cost per Passenger Trip (2008 dollars)
Cost per Trip (Dollar)
Demand Responsive Bus Vanpool
Directly Operated
Purchased Transportation
Directly Operated
Purchased Transportation
Directly Operated
Purchased Transportation
National 26.97 21.92 4.56 5.73 3.52 5.32 Midwest 22.91 15.98 3.99 6.01 3.69 5.62
Table 16.Cost per Passenger Mile (2008 dollars)
Cost per Mile (Dollar)
Demand Responsive Bus Vanpool
Directly Operated
Purchased Transportation
Directly Operated
Purchased Transportation
Directly Operated
Purchased Transportation
National 4.50 3.21 1.09 1.09 0.13 0.07 Midwest 4.71 2.80 1.17 0.79 0.11 0.08 The cost values contained in Tables 15 and 16 indicate slight differences between the Midwest and National averages. However, the cost differences do not appear too large to justify not using the national averages. An advantage of using the national values is that they are derived from a larger population with a smaller deviation. When estimating the cost of funding a NEMT brokerage it is insightful to know that when transportation services are purchased, the average cost per passenger or mile is lower than when it is directly supplied.
121 Recommendations
Chapter 9 Recommendations
Conclusions The costs presented in this section are estimates and should be used with discretion. There may be several uncertainties and variations depending upon the geographic regions and type of service coordination. The nature of trips differs based on area, travel time and distance, and time of day (peak or nonpeak). These as well as other trip attributes may result in higher costs relative to the average costs presented above. In addition, the costs discussed above are average costs, not the marginal costs. Marginal costs can play a significant role in NEMT services and can differ significantly depending on the percentage utilization of available capacity. The incremental cost of a system which is under‐utilized is very low; on the other hand, the incremental cost of an additional trip for a system already running at near full capacity (or when trip distances are large such as in rural areas) may be extremely high. The administrative expertise also plays an important role in arriving at NEMT cost estimates. Establishing and maintaining internal controls is an important way of bringing down the overall transportation costs. An experienced centralized provider can ensure the appropriate level of service in the most efficient manner, and can eliminate the hassle of interacting with multiple transportation providers. This can eventually lead to much less transportation costs to the state and would safeguard state resources against loss and misuse. With the previously stated qualifications, the estimated costs are close to the reported costs of operating brokerages. For example, Washington reports their costs for ambulatory transit trips are about $26 per trip. Our estimates for demand responsive trips is virtually equivalent for direct providers and a little lower for those purchasing transportation. Therefore, unless specific transportation costs and trips taken by mode become available from the IME, the estimated costs presented in this section should guide cost forecasts.
122 Recommendations
Chapter 9 Recommendations
PR
art 3: ecommendations
123 Recommendations

Chapter 9 Recommendations
124 Recommendations
Chapter 9 Recommendations
Chapter 9 Recommendations for NEMT Brokerage in Iowa
125 Recommendations

Chapter 9 Recommendations
126 Recommendations

Chapter 9 Recommendations
This analysis was commissioned by the Iowa Departments of Transportation and Human Services to assist the Iowa Medicaid Enterprise in analyzing the feasibility and desirability of expanding its involvement in non‐emergency medical transportation, possibly using the new transportation brokerage provisions contained in the federal Deficit Reduction Act of 2005. The research that has been conducted and documented here has been reviewed with the interagency working group and has resulted in the following recommendations:
1. Increase support for non‐emergency medical transportation (NEMT) throughout Iowa
2. Create a transportation brokerage for NEMT through the new federal provisions under the 2005 Deficit Reduction Act allowing States to provide brokerages as a State Plan service, securing a higher federal matching rate without going through the waiver approval process
3. Establish a single state‐wide brokerage for NEMT
4. Create at least one new full‐time NEMT manager within IME to oversee the brokerage, monitor and enforce quality control assurances, arbitrate consumer and transportation provider grievances not resolved by the broker, and review NEMT operating costs
5. Because of a lack of historic information on transportation costs and the anticipation that this program will grow significantly, the Iowa NEMT brokerage should initially be established based on reimbursement of actual transportation costs, plus a fixed administrative fee for the broker
The working group also has two additional recommendations, which although somewhat outside of the original scope in the study, are considered critical to addressing many of the consumer concerns that came to light as a result of the consumer surveys and consumer input sessions conducted as part of this research effort.
6. Consider eliminating the state‐established policy to exclude “in‐town” NEMT
7. Consider equalizing the eligibility for NEMT across Medicaid State Plan services and waiver programs.
Each recommendation is discussed further below.
Increasing focus on NEMT Transportation from home to a medical provider is necessary to access most medical care. Thus, lack of transportation can prevent persons from accessing necessary treatment. This can have detrimental effects on a person's health and well‐being. This relative difficulty of accessing transportation is typically referred to as "travel burden."
127 Recommendations
Chapter 9 Recommendations
128 Recommendations
Hughes‐Cromwick &Wallace 27(2006) performed an analysis of the cost‐effectiveness of providing nonemergency medical transportation for twelve chronic and preventable conditions prevalent among the transportation‐disadvantaged population. They found that providing additional NEMT would result in savings in combined transportation and health care costs for four of these conditions (prenatal care, asthma, heart disease, and diabetes). In addition, they found that it would be cost‐effective in terms of improved quality of life for all twelve conditions. For the analysis, they valued one Quality Adjusted Life‐Year at $50,000.28 Both available research and the strong sentiments of stakeholders consulted for the project support increased emphasis on NEMT.
Establishing an NEMT Brokerage States have realized an average decrease in trip cost with an increase in rides provided. Key‐informant interviews of existing states with NEMT brokerages revealed that Arkansas, Georgia, Nevada, Virginia, and Washington have seen a decrease in cost per ride. The literature contains other examples and readers are directed to the summary of brokerages and transportation costs chapters. However, it must be emphasized that the total expenditure on NEMT has not been reduced in states with brokerages because ridership increased as the system became more effective. More Medicaid consumers use the NEMT program than before the brokerages began. Transitioning to a NEMT brokerage will reduce the workload of many Medicaid employees that now deal with transportation as one small part of their duties. For example, the income maintenance workers would no longer need to verify claims and case managers and service workers would only need to direct consumers to the brokerage. Those reductions in time spent on non‐medical services will be a positive, allowing the Medicaid workers to focus their time better on medical service‐related issues. At the same time, having consumers’ transportation questions addressed by brokerage staff, who have the chance to focus strictly on transportation issues, should assure greater accuracy and consistency on that topic. Overall, experience has shown cost per ride decreases and ridership increases. Many states have seen a drastic reduction in fraud and abuse of the NEMT program when administered directly by their Medicaid program. Increased competition between transportation providers has also influenced the decline in trip costs.
Going StateWide Going with a single, statewide broker maximizes the ability to coordinate trip requests with transportation providers in the most cost‐efficient manner. It can do this because the broker handles all trip requests with the ability to select the most appropriate transportation provider at the least cost. Another advantage of a single, statewide broker is related to its responsibility for arranging a ride from the consumer’s point of origin to destination. Because of the statewide scope, the broker is able to coordinate round‐trips across county and regional boundaries better than in a system involving multiple
27 Wallace, R., Hughes‐Cromwick, P., Mull, H., & Khasnabis, S. (2005). Access to health care and nonemergency medical transportation: Two missing links. Transportation Research Record (1924), 76‐84.
28 A measurement index designed to take into account the quality, as well as quantity, of survival benefits from treatment. A year of life adjusted for its quality or its value. A year in perfect health is considered equal to 1.0 QALY. The value of a year in ill health would be discounted. For example, a year bedridden might have a value equal to 0.5 QALY. (Online Medical Dictionary cancerweb.ncl.ac.uk/cgi‐bin/omd?quality+adjusted+life+year)
Chapter 9 Recommendations
regional brokers. It avoids the problems inherent in the regional structure that at times prevents easy crossing of jurisdictional boundaries. Consistent statewide service quality is also a benefit of a single broker. When one broker is responsible for implementing service, it is easier for the Medicaid program to check and enforce its requirement of equal access to quality services for all its members. A single broker also increases the service provided to the transportation providers with which it contracts. There would be one consistent contractual system that the providers would need to know. Unlike in the building trades where a contractor is required to know specifications that are particular to each jurisdiction, a uniform set of rules of one broker increases operational efficiency. Consistent requirements for vehicles and drivers across the state would increase the providers' ability to operate within the state. This would allow for positive administrative economies of scale to occur. Although state‐wide brokerages tend to be operated by for‐profit private entities, there is nothing inherently preventing a major not‐for‐profit corporation from successfully bidding to operate such a service.
Actual Transportation Costs plus Fixed Brokerage Fee The broker's profit depends on per‐trip costs, so under the reimbursement approach recommended here, the broker would have an incentive to reduce per‐trip costs but not to reduce the number of trips provided. It is critical to give a brokerage for the Iowa Medicaid Enterprise this incentive to achieve its goal of increased accessibility to its consumers. Another benefit is this fee structure protects brokers and transportation providers against changes in the amount of trips and changes in fuel costs. Other reimbursement schemes try to lock in prices, but are likely to find providers dropping out of the network when costs outside of their control escalate, as has been the recent case with fuel prices. This is important because existing Medicaid programs with brokerages indicate that the key to success of the NEMT program is a wide network of transportation providers. This fee structure also can lead to cost savings for Medicaid when operation costs decrease because the savings are passed back to Medicaid. A significant factor in recommending the actual cost plus fixed fee starting arrangement for an Iowa NEMT brokerage is the lack of previous history with NEMT in Iowa. Other arrangements, such as capitated rates, require very accurate projections of usage, which are possible in a mature system, but not where it will mostly be new service.
Equalizing Eligibility for NEMT Making all Medicaid members eligible for needed NEMT services, whether their trip is within a rural or an urbanized setting, would help tremendously to address consumer concerns over the Medicaid transportation issues. The fact that very few are sure of what the actual boundaries are for the urban exclusions creates confusion. While it is understood that the “local” or “urban” exclusion was established to limit costs, it seems hard to justify in terms of access. Trips to medical facilities within an urbanized area can often be several miles in length and there is no assurance that Medicaid members will have their own means of access any more than there is in rural settings. The critical need for transportation access in order to allow members to receive the benefit of medical services applies across the board. While the number of NEMT trips in urban areas may be higher than in rural areas
129 Recommendations
Chapter 9 Recommendations
because there are many more members in these areas, it is anticipated that the cost per trip will probably be lower, due to a lower average length. Beyond the exclusion of trips to medical services within the boundaries of urban communities is the larger issue of what kinds of trips are eligible for different Medicaid populations. Medicaid State Plan services are available to all Medicaid members in Iowa; through the State Plan, members are supposed to be ensured transportation to medical and pharmaceutical services. Additional transportation services are available to participants in some, but not all, of Iowa’s seven Home and Community Based Waivers. In these cases, transportation would be included in the individual’s service plan approved by the case manager. However, even when transportation is included as a service under a particular waiver, the differences in funding limits from one waiver to the next mean differences in access to transportation. As an example, participants in the Mental Retardation and Brain Injury Waivers can have transportation services to their place of work included in their service plans. Many Iowans with disabilities who are participating in Iowa’s MEPD program (Medicaid for Employed Persons with Disabilities), which protects access to health coverage for people entering or maintaining employment, are not entitled to Medicaid‐funded transportation to work. As this research has demonstrated, lack of transportation can constitute a significant barrier to full participation in community life.
Centralized Brokerage Oversight Function at IME Oversight of an NEMT brokerage is critical. States with existing brokers strongly recommend establishing at least one centralized position that would be responsible for administering the brokerage contract, monitoring adherence to the contract's performance standards, reviewing the broker's decisions in any disputed cases upon an appeal from a member or a transportation provider, as well as on a random basis, and serving as the primary liaison between various IME offices and the broker on a range of issues. Having these roles centralized helps to assure that issues are dealt with by someone who is aware of all aspects of the situation and also to assure consistency and continuity.
Acceptance of a NEMT Brokerage During the process of collecting information from existing Medicaid programs using NEMT brokerages, several information and input sessions were held with stakeholders. The Iowa Public Transit Association (IPTA) and the Iowa Transportation Coordination Council were kept up‐to‐date on findings and tentative recommendations. Along the way, sensitivity was maintained to the concerns expressed by those whose livelihood is the provision of transportation services as well as those who consume the services. Two such meetings were held in the late spring of 2008. On May 30, 2008 the brokerage concept and its pros and cons were presented to the Cedar Rapids‐based Peer Advocates Disability Support (PADS) group. The input of this group of individuals with disabilities, family members and advocates was sought because of their long experience with and history of advocacy regarding public transportation. The overall tenor of the meeting was positive. The members of PADS saw the creation of a NEMT brokerage as improving their access to transportation. They provided insight into the problems several of the members face when trying to get from one place to another using the current transportation system. They appeared to have a realistic sense of the benefits a brokerage could afford, as well as what it could not do. A summary of the meeting is included in Appendix 6. The second public input session was held on June 25 with the Iowa Public Transportation Association, one of many times this group was updated. The multiple options for a brokerage system were highlighted. IPTA members provided many comments and the benefit of their expertise in
130 Recommendations
Chapter 9 Recommendations
transportation service delivery has helped guide the recommendations in this report. Many members of IPTA were optimistic about the creation of a brokerage, although careful to inquire as to how it would affect their bottom line. One of the clear themes in the meeting was that a brokerage of any kind should not force them to change how they operate their systems. For example, they were not interested in a brokerage that would force them to change how they charge, whether it is by the mile or trip. Overall, we believe the public transit providers in attendance are cautiously optimistic, but definitely not diametrically opposed to a NEMT brokerage. A summary of the meeting is included in Appendix 6.
Conclusion In general, a NEMT brokerage will reduce the cost per trip while increasing consumers' access to eligible medical services. There are several models to rely on to help specify the contract with a brokerage firm and restructure Medicaid to include staff to oversee its operation. Based on the extensive study of NEMT brokerage systems throughout the nation, the recommendation can be made with confidence for the establishment of a single, statewide transportation brokerage, which does not exclude for‐profit firms, and which is retained under a trip fee plus administrative cost based contract.
131 Recommendations

Chapter 9 Recommendations
132 Recommendations

4 Recommendations
IowaMedicaidNon‐EmergencyMedicalTransportationSystemReviewandOptionsforImprovements
ThePublicPolicyCenterisaninterdisciplinaryresearchunitdedicatedtothescholarlyexaminationofsocialandeconomicpolicyalternatives.
TheUniversityofIowaPublicPolicyCenterIowaCity,IA52242,1‐800‐710‐8891.