Iowa Farmers and the Iowa Nutrient Reduction Strategy ... Farmers and the Iowa Nutrient Reduction...
20
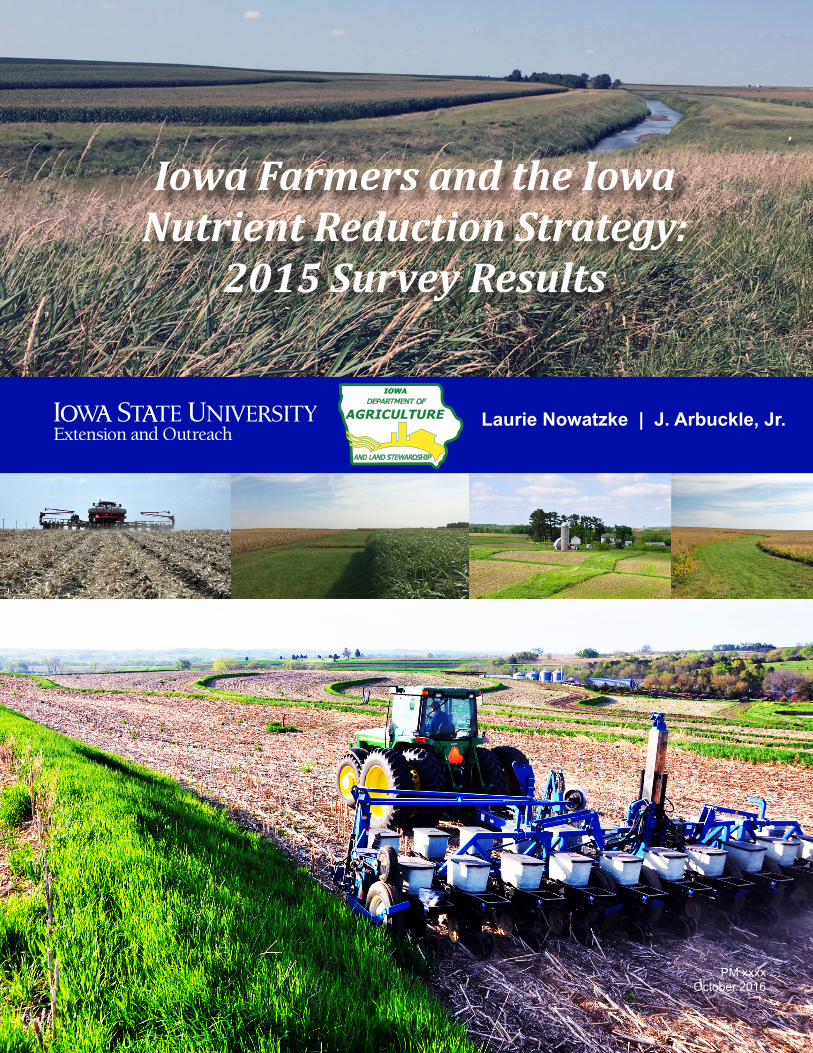
PM xxxx October 2016 Laurie Nowatzke | J. Arbuckle, Jr. IOWA AND LAND STEWARDSHIP AGRICULTURE DEPARTMENT OF Iowa Farmers and the Iowa Nutrient Reduction Strategy: 2015 Survey Results
Transcript of Iowa Farmers and the Iowa Nutrient Reduction Strategy ... Farmers and the Iowa Nutrient Reduction...
PM xxxx October 2016
Laurie Nowatzke | J. Arbuckle, Jr.IOWA
AND LAND STEWARDSHIP
AGRICULTURE
DEPARTMENT OF
Iowa Farmers and the Iowa Nutrient Reduction Strategy:
2015 Survey Results

Report design and format by Renea Miller, Department of Sociology, Iowa State University, Ames, Iowa. October, 2016.
Iowa Farmers and the Iowa Nutrient Reduction Strategy: 2015 Survey Results
This document may be cited as:
Laurie Nowatzke and J. Gordon Arbuckle Jr. 2016. Iowa Farmers and the Iowa Nutrient Reduction Strategy: 2015 Survey Results. PM xxxx. Department of Sociology, Iowa State University, Ames, IA. 16 pp.
Research funded by the Iowa Department of Agriculture and Land Stewardship, along with support from Iowa State University Extension and Outreach and State of Iowa funding provided to the Iowa State University College of Agriculture and Life Sciences.
… and justice for allThe U.S. Department of Agriculture (USDA) prohibits discrimination in all its programs and activities on the basis of race, color, national origin, age, disability, and where applicable, sex, marital status, familial status, parental status, religion, sexual orientation, genetic infor-mation, political beliefs, reprisal, or because all or part of an individual’s income is derived from any public assistance program. (Not all prohibited bases apply to all programs.) Persons with disabilities who require alternative means for communication of program informa-tion (Braille, large print, audiotape, etc.) should contact USDA’s TARGET Center at 202-720-2600 (voice and TDD). To file a complaint of discrimination, write to USDA, Director, Office of Civil Rights, 1400 Independence Avenue SW, Washington, DC 20250-9410, or call 800-795-3272 (voice) or 202-720-6382 (TDD). USDA is an equal opportunity provider and employer.Issued in furtherance of Cooperative Extension work, Acts of May 8 and June 30, 1914, in cooperation with the U.S. Department of Agriculture. Cathann A. Kress, director, Cooperative Extension Service, Iowa State University of Science and Technology, Ames, Iowa.

i
Table of Contents
Introduction .............................................................................................................................1
Survey methodology.................................................................................................................2
Survey Results ..........................................................................................................................3
Awareness of the Iowa Nutrient Reduction Strategy ..............................................................3
Information sources ................................................................................................................4
Awareness of watershed management activities ......................................................................4
Attitudes toward the Iowa Nutrient Reduction Strategy ........................................................5
Use of conservation practices ..................................................................................................7
Fertilizer management practices .........................................................................................7
Tillage and cover crops .......................................................................................................8
Structural practices .............................................................................................................8
Length of practice use ..............................................................................................................9
Fertilizer management practices .........................................................................................9
Tillage and cover crops ......................................................................................................9
Structural practices ...........................................................................................................10
Barriers to conservation ...................................................................................................11
Barriers to use of selected conservation practices among non-users .............................. 11
General barriers to water quality improvement in Iowa ..................................................12
Technical and financial assistance for conservation .............................................................14
Influence on nutrient management decisions ......................................................................14
Respondent Demographics ...................................................................................................14
Summary of Key Findings .....................................................................................................16
Awareness and attitudes ...................................................................................................16
Conservation practice use ................................................................................................16
Influential stakeholders ....................................................................................................16
Conclusions and next steps ..............................................................................................16

ii
List of Figures
Figure 1. The logic model guides measurement of Iowa Nutrient Reduction Strategy progress. ....................................................................................................1
Figure 2. Iowa’s HUC6 and HUC8 watersheds (a) and the HUC12 demonstration projects within priority HUC8 watersheds (b). .....................................................2
Figure 3. Farmer awareness of the Iowa Nutrient Reduction Strategy in 2015. ...................3
Figure 4. Sources from which respondents learned about the Iowa Nutrient Reduction Strategy. ................................................................................................4
Figure 5. Use of fertilizer management practices in 2014. ....................................................7
Figure 6. Use of tillage, cover crops, and perennial vegetation in 2014. ..............................8
Figure 7. Use of structural and drainage practices in 2014. .................................................9
Figure 8. Length of time that farmers had used selected practices. ....................................10
Figure 9. Length of time that farmers had used selected practices. ....................................10
Figure 10. Length of time that farmers had used selected practices. .................................... 11
List of Tables
Table 1. HUC6 and priority HUC8 watersheds within the HUC6 watersheds...................2
Table 2. Response rates associated with each HUC8 watershed that was surveyed in 2015. The bolded HUC8 watersheds are considered priority watersheds by the Iowa Nutrient Reduction Strategy.................................................................3
Table 3. Involvement in watershed management activities ...................................................5
Table 4. Farmer perspectives on topics related to the Iowa Nutrient Reduction Strategy ....6
Table 5. Barriers to implemenation of selected conservation practices among non-users..12
Table 6. Farmer perspectives on barriers to water quality improvement in Iowa .................13
Table 7. Percent of farmers that responded “Yes” to questions about the use of technical and financial assistance for conservation ............................................... 14
Table 8. Influence that different sources of information have on nutrient management decisions .................................................................................................................15

Iowa Farmers and the Iowa Nutrient Reduction Strategy: 2015 Survey Results—1
Iowa Farmers and the Iowa Nutrient Reduction Strategy: 2015 Survey Results
Introduction
In 2013, the state of Iowa released the Iowa Nutrient Reduction Strategy (NRS) (www.nutrientstrategy.iastate.edu). The NRS is a science and technology-based approach to guide actions that reduce the amount of nutrients delivered to Iowa waterways and the Gulf of Mexico. The NRS was developed through a collaboration between Iowa State University, the Iowa Department of Agriculture and Land Stewardship (IDALS), the Iowa Department of Natural Resources (IDNR), with support from the USDA Agricultural Research Service (ARS), and the USDA Natural Resources Conservation Service (NRCS). The strategy outlines opportunities and recommendations for voluntary efforts to reduce nutrients in surface water from both point sources, such as wastewater treatment plants and industrial facilities, and nonpoint sources, including farm fields and urban areas. The NRS is engaging diverse private and public stakeholders from many sectors of urban and rural society, with a primary focus on helping municipalities, industry, and agriculture to reduce flows of nutrients into waterways. This report focuses on the agricultural sector. The NRS goal for Iowa nonpoint sources, mainly agriculture is a 41 percent reduction in nitrogen loss and a 29 percent reduction in phosphorus loss.
Measurement of progress toward these goals is a central objective of the NRS. The measurement process is guided by a program logic model approach (figure 1), which outlines measurable indicators of change. The domains in which changes are tracked are: inputs such as funding; the human actors whose actions can impact nutrient management such as farmers and private and public sector organizations; land use, nutrient management practices, and edge-of-field practices for nutrient load reduction; and, of course, the load of nutrients in Iowa watersheds. NRS partners are tracking change in inputs, human dimensions, landscape, and water quality that move Iowa toward NRS goals.
This document reports the year-one results of survey project that is focused on measuring changes in the human domain, mainly Iowa farmers’ knowledge, attitudes, and behaviors related to reduction of nutrient losses. The project, which is funded by the Iowa Department of Agriculture and Land Stewardship (IDALS) and conducted by Iowa State University (ISU) College of Agriculture and Life Sciences, is a five-year effort to collect data that will help stakeholders to measure progress toward NRS objectives and to inform outreach and engagement strategies. The survey has three main objectives: measure farmer knowledge, attitudes, and behavior related to nutrient management and nutrient loss into waterways; identify barriers to
Figure 1. The logic model guides measurement of Iowa Nutrient Reduction Strategy progress.
MEASURABLE INDICATORS OF DESIRABLE CHANGE
• People• Funding• Agency resources• Private sector resources
• Land use changes• Practice adoption• Point source
implementation
• Partner organizations • Partner agribusinesses• Farmer knowledge
and attitude• Point source communities
and management knowl-edge and attitude
• Calculated load reduction• Measured loads in priority
watersheds• Organized watersheds
reported load changes• Measured loads at existing
monitoring stations
Nutrient Reduction Strategy Measure of Success Committee, Water Resource Coordinating Council

2—Iowa Farmers and the Iowa Nutrient Reduction Strategy: 2015 Survey Results
and facilitators of behavior change that reduces nutrient loss; and, measure change in these over time. The survey data will help to gauge progress toward NRS goals and help stakeholders to adjust and refine strategies for outreach and engagement activities that promote nutrient loss reduction on Iowa farms.
Survey methodology
The farmer survey project is being implemented over a five-year period through an annual rotating longitudinal survey that will cover six HUC6 watersheds containing HUC 8 watersheds that have been identified as “priority watersheds” by the Iowa Water Quality Inititative (WQI) (figure 2). Within each of these HUC6 watersheds, a priority HUC8
will be surveyed as the “treatment” watershed. This approach will allow comparison, within each of the HUC6 watersheds, between priority HUC8 watersheds where demonstration projects are being funded, and the rest of the HUC8 watersheds within those HUC 6 watershed that have not received a priority designation. The HUC6 watersheds and their priority HUC8 watersheds are listed in table 1.
The sample population is Iowa farmers who operated at least 150 acres of row crops in the year prior to the survey. A minimum acreage threshold was set because 1) nutrient reduction actions are most applicable to row crop farmers, and 2) operations that exceed 150 acres farm a majority of Iowa farmland. Samples for the survey
Figure 2. Iowa’s HUC6 and HUC8 watersheds (a) and the HUC12 demonstration projects within priority HUC8 watersheds (b).
102300
102400
071000
070802
070801
070400
Table 1. HUC6 and priority HUC8 watersheds within the HUC6 watershedsHUC6 Watershed Priority HUC8 Watershed(s)
Iowa ......................................................................... Middle Cedar
Missouri-Little Sioux .............................................. Floyd
Upper Mississippi-Maquoketa-Plum ...................... Turkey
Upper Mississippi-Skunk-Wapsi ............................ South SkunkSkunk
Missouri-Nishnabotna ............................................ West NishnabotnaEast Nishnabotna
Des Moines............................................................ BooneNorth Raccoon
a b

Iowa Farmers and the Iowa Nutrient Reduction Strategy: 2015 Survey Results—3
are purchased annually from Survey Sampling International. Iowa State University’s Center for Survey Statistics and Methodology (http://www.cssm.iastate.edu/) is conducting the annual mail survey and data entry process, and assisting with data analysis.
The first round of the survey, conducted in March and April of 2015, was mailed to farmers in the Iowa HUC6 watershed and the Missouri-Little Sioux HUC6 watershed. In the Iowa HUC6 watershed, the Middle Cedar HUC8 watershed was the the NRS priority watershed. In the Missouri-Little Sioux watershed, the Floyd HUC8 was the priority watershed. Response rates in four HUC8 watersheds that were surveyed in 2015 ranged from 42 to 51 percent (Table 2). Five hundred surveys were returned from the Middle Cedar HUC8, 440 from the Lower Iowa, 357 from the Big Papillion-Mosquito/Boyer, and 425 from the Floyd HUC8.
Survey Results
Awareness of the Iowa Nutrient Reduction Strategy
The first objective of the survey was to measure farmers’ awareness of the NRS. Prior to the first
question, respondents were provided with the following introductory information:
The Iowa Nutrient Reduction Strategy is a plan to reduce the amount of nitrogen and phosphorus that enters Iowa’s streams and rivers and eventually the Gulf of Mexico. It is designed to help reduce nutrients in surface water in a scientific, reasonable, voluntary, and cost‐effective manner. The strategy sets goals for both “point sources” (e.g., water treatment plants) and “nonpoint sources” (e.g., agriculture) of nutrients. The goal for Iowa agriculture is that nutrient losses into waterways will be reduced by 41% for nitrogen and 29% for phosphorus.
Immediately following that introductory text, respondents were posed the question, “Before reading the description above, how knowledgeable were you about the Iowa Nutrient Reduction Strategy?,” and asked to rate their knowledge on a five-point scale ranging from not at all knowledgeable to very knowledgeable. About six percent of respondents reported that they were very knowledgeable (figure 3), and 22 percent rated themselves as knowledgeable. The largest category, at 42 percent, was “somewhat knowledgeable,” while 23 percent and seven percent of farmers
Table 2. Response rates associated with each HUC8 watershed that was surveyed in 2015. The bolded HUC8 watersheds are considered priority watersheds by the Iowa Nutrient Reduction Strategy.
HUC6 HUC8 Number of Respondents Response RateIowa Lower Iowa 440 45%
Middle Cedar 500 51%
Missouri-Little Sioux Big Papillion-Mosquito/Boyer 357 42%
Floyd 425 48%
Total 1,746† 47%†Twenty-four respondents did not specify their watershed but were included in the analysis.
Figure 3. Farmer awareness of the Iowa Nutrient Reduction Strategy in 2015.
22.9%7.2% 41.8% 22.4% 5.7%
Not at all knowledgeableSlightly knowledgeableSomewhat knowledgeable
KnowledgeableVery knowledgeable

4—Iowa Farmers and the Iowa Nutrient Reduction Strategy: 2015 Survey Results
reported that they were slightly knowledgeable or not at all knowledgeable, respectively.
As this survey is conducted in selected watersheds in the coming years, this question will monitor change in farmers’ awareness of the NRS. As NRS-related extension and outreach efforts are increased, farmers’ knowledge is expected to increase. Additionally, data on awareness of the NRS will be compared to other questions in the survey (e.g., influence of different information sources) to better understand how increased knowledge may correlate with attitudes and behaviors related to soil and water quality and conservation.
Information sources
The next question sought to better understand the information channels through which farmers are learning about the NRS. Respondents were provided the introductory text, “Information about the Nutrient Reduction Strategy has been publicized through many sources. Please indicate whether or not you have learned about it from the sources listed below,” and asked to check any
of the sources that applied. The farm press had informed 81 percent of respondents (figure 4). This was followed by 61 percent informed by the Natural Resource Conservation Service (NRCS) or Soil and Water Conservation Districts (SWCD), and 60 percent by Iowa State University (ISU) Extension. The fewest respondents, at 28 percent, 19 percent, and 18 percent, had heard about the NRS from agricultural retailers, crop advisers, and seed companies, respectively. These results indicate that some information sources, particularly the farm press, had played a larger role in disseminating information about the NRS in the surveyed areas, while retailers and advisers had played a smaller role.
Awareness of watershed management activities
The NRS takes a watershed-based approach to prioritizing areas that require increased efforts in implementing nutrient reduction practices. Water quality improvement projects in Iowa and across the Corn Belt region have shown that farmers’ involvement and leadership in watershed projects can be crucial to their success. Thus, the survey
Figure 4. Sources from which respondents learned about the Iowa Nutrient Reduction Strategy.
17.5
18.6
28.4
40.8
47.3
50.6
52.1
59.7
60.5
81.0
Seed company rep.
Crop adviser or agronomist
Agricultural retailer
Other farmers
Government agency
The popular press
Commodity or farm organization
Iowa State University Extension
NRCS or SWCD
The farm press
Percent

Iowa Farmers and the Iowa Nutrient Reduction Strategy: 2015 Survey Results—5
sought to measure farmer awareness of and involvement in watershed management activities.
A series of four questions were posed about watershed management activities. Prior to the questions, the following text was provided for context and to ensure that all survey respondents had the same understanding of the concepts of “watershed” and “watershed management”:
A watershed is an area of land that drains into a common waterway or water body. Watersheds are often described as “nested” because smaller watersheds that drain into smaller waterways make up larger watersheds that drain into rivers and ultimately into the sea.
Watershed management refers to planning and action focused on maintaining clean water and general environmental quality within a watershed.
Twenty-six percent of farmers stated that there is an active watershed management group in their respective watersheds, and 24 percent indicated that they themselves were involved in organized watershed management activities. Thirty percent reported that other local farmers were involved in organized watershed management activities, and 11 percent reported that local non-farming residents were involved in such activities (table 3). About 80 percent indicated that at least some of the land they farm borders a creek, stream, river, or lake.
Also of interest for this research project were the negative and “Don’t Know” responses to the watershed management questions (table 3). Seventy-four percent of farmers reported either that there were no active watershed management
groups in their watershed (31 percent) or they were not aware of one (43 percent). Similar results were found for the questions about local farmers and non-farming residents. Overall, the responses indicate that most farmers in the surveyed watersheds were not aware of organized watershed management activities in their watersheds.
These figures suggest that, first, more outreach may be necessary in areas where watershed groups are active, and second, in other areas lack of awareness could indicate lack of watershed activity. The research team is currently constructing variables that measure the degree to which organized watershed management activities are present in surveyed watersheds to further examine this question. The responses to these questions will be monitored in future iterations of this survey to track farmer involvement in watershed-scale activities.
Attitudes toward the Iowa Nutrient Reduction Strategy
Another objective of the survey was to measure respondents’ attitudes toward the NRS and water quality issues. The survey respondents were asked to report their level of agreement or disagreement with a variety of statements related to the NRS. The statements, listed in Table 4, examine several general areas of farmers’ perspectives, including: awareness of and concern about water quality problems; support for action; opinions about of the efficacy of current nutrient management practices; and other topics such as concern about regulation.
The first category encompasses seven items that measured aspects of awareness and concern about agriculture’s impacts on water quality, and support for action (table 4). Selected items
Table 3. Involvement in watershed management activities
Yes NoDon’t Know
—Percent—Is there an active watershed management group in the watershed? ............... 26.1 30.9 43.1
Are local farmers involved in organized watershed management activities? ... 30.1 28.0 41.8
Are local non-farming residents involved in organized watershed management activities? .................................................................................... 10.7 32.4 56.9
Are you involved in organized watershed management activities? ................. 24.4 70.1 5.5
Does any of the land you farm border any creeks, streams, rivers, or lakes?.. 79.1 19.9 1.0

6—Iowa Farmers and the Iowa Nutrient Reduction Strategy: 2015 Survey Results
include: 83 percent of farmers agreed or strongly agreed with the statement, “I am concerned about agriculture’s impacts on Iowa’s water quality;” and 75 percent agreed with the statement, “I would like to improve practices on the land I farm to help meet the Nutrient Reduction Strategy’s goals.” Forty-six
percent indicated that they would be willing to have their farm operations’ effectiveness in minimizing nutrient loss evaluated. Overall, results for these items showed that most respondents were concerned about agriculture’s impacts on water quality and supportive of NRS goals.
Table 4. Farmer perspectives on topics related to the Iowa Nutrient Reduction Strategy Strongly
disagree Disagree Uncertain AgreeStrongly
agree
—Percent—Awareness, concern, and support for actionI am concerned about agriculture’s impacts on Iowa’s water quality ...................................................................................... 1.2 4.2 11.7 64.1 18.7
I would like to improve conservation practices on the land I farm to help meet the Nutrient Reduction Strategy’s goals ..... 1.3 2.2 21.3 59.9 15.3
Iowa farmers should do more to reduce nutrient and sediment run-off into waterways. ............................................................ 0.4 4.5 20.2 64.1 10.8
I am concerned about Iowa’s contribution to water quality problems (e.g., hypoxia) in the Gulf of Mexico. 1.4 6.4 32.2 54.4 5.7
Helping to meet the Nutrient Reduction Strategy’s goals is a high priority for me ................................................................... 0.9 9.3 39.3 45.2 5.3
Nutrients from Iowa farms contribute to water quality problems (e.g., hypoxia) in the Gulf of Mexico ........................ 1.8 10.2 39.7 41.0 7.2
I would be willing to have someone help me evaluate how my farm operation is doing in terms of keeping nutrients out of waterways................................................................................ 4.1 12.8 37.3 41.7 4.1
Self-assessment of nutrient managementThe nutrient management practices I use are sufficient to prevent loss of nutrients into waterways.................................. 0.4 3.1 39.2 48.9 8.4
I am already doing all that I can to reduce nutrient loss from my farm into waterways ........................................................... 0.8 15.2 38.2 36.8 9.1
I don’t know how well my farm operation is doing in terms of keeping nutrients out of waterways ......................................... 9.2 34.1 34.8 20.2 1.8
Other perspectivesI am concerned about potential water quality regulations targeting agriculture ................................................................. 0.5 1.6 8.8 53.9 35.2
If society wants inexpensive, abundant food, people have to be willing to deal with some impacts on water quality ............. 2.5 23.9 29.4 37.2 7.1
Fertilizer and ag chemical dealers should do more to help farmers address nutrient losses into waterways...................... 2.2 20.7 35.6 35.9 5.7
In general, landlords are willing to help farmers address nutrient loss from the farmland they rent ................................. 8.1 29.0 41.1 20.5 1.4

Iowa Farmers and the Iowa Nutrient Reduction Strategy: 2015 Survey Results—7
The second category of statements represents self-assessment of nutrient management effectiveness. Fifty-seven percent of farmers agreed that, “The nutrient management practices I use are sufficient to prevent loss of nutrients into waterways” (table 4). Similarly, 46 percent agreed that, “I am already doing all that I can to reduce nutrient loss from my farm into waterways.” These results point to a sense of satisfaction with current on-farm management related to nutrient management among a substantial proportion of surveyed farmers. Between 35 and 39 percent of farmers reported uncertainty associated with these statements.
The third category is comprised of items that measure other relevant perspectives associated with nutrient loss reduction. Eighty-nine percent of farmers agreed with the statement, “I am concerned about potential water quality regulations targeting agriculture,” and 44 percent agreed that, “If society wants inexpensive, abundant food, people have to be willing to deal with some impacts on water quality” (table 4). Forty-two percent agreed that, “Fertilizer and ag chemical dealers should do more to help farmers address nutrient losses into waterways.” Finally, just 22 percent agreed with the statement, “In general, landlords are willing to help farmers address nutrient loss from the farmland they rent,” compared to 37 percent who disagreed.
Use of conservation practices
Tracking shifts in farmers’ conservation behavior is a major survey objective. Following the question set measuring farmer perspectives regarding the NRS, the survey explored survey respondents’ use of three categories of conservation practices that are employed to manage nutrients and otherwise improve soil and water conservation outcomes on agricultural lands. The survey asked participants to report whether they had used any of 20 practices in their farm operation (owned or rented land) in 2014. Respondents’ use of practices fell into one of three categories: “Not used in 2014, no plans to use it,” “Not used in 2014, might use it in the future,” and “Used the practice in 2014.”
Fertilizer management practices
Seven of the practices are related to fertilizer management, of which five are specifically recommended by the NRS Science Assessment (figure 5). Of these, spring nitrogen (N) application was the most widely used, with 76 percent of farmers reporting that they employed this practice in 2014. Forty-four percent of farmers reported use of nitrogen stabilizers. Growing season nitrogen application (i.e., side-dress) was reported by 34 percent of farmers. Use of a maximum return to nitrogen (MRTN) calculator was reported by
Figure 5. Use of fertilizer management practices in 2014.
76
5544
36 3427 22
10
1122
1322 32
31
14
35 34
5244 41 48
Spring NApplication
Manure NStabilizer
Fall NApplication
GrowingSeason
N
MRTN VariableRate N
Not used in 2014,no plans to use it
Not used in 2014, might use it in the future
I used the practicein 2014
Perc
ent

8—Iowa Farmers and the Iowa Nutrient Reduction Strategy: 2015 Survey Results
27 percent of respondents, and 22 percent reported using variable rate nitrogen application methods. In addition, substantial proportions of farmers who reported that they did not use the practices in 2014 indicated that they might use them in the future: 22 percent for nitrogen stabilizers, 22 percent for growing season nitrogen application, 32 percent for MRTN, and 31 percent for variable rate nitrogen; these results signal potential openness to eventual adoption of these recommended practices.
Fall application of nitrogen, which is not generally a recommended practice, was reported by 36 percent of respondents (figure 5). Manure application, a practice that may reduce nutrient loss when employed appropriately but may contribute to losses in other cases, was reported by 55 percent of respondents.
Tillage and cover crops
Farmers were asked to indicate which types of tillage practices they had used in 2014. These practices included no-till (all years of rotation), intermittent no-till, conservation tillage, and strip till (figure 6). Fifty-two percent reported using no-till on at least some of their land, 50 percent used conservation tillage, 32 percent had employed intermittent no-till, and seven percent reported
use of strip-till methods. Among non-users of no-till, intermittent no-till, conservation tillage, and strip-till, 20 percent, 23 percent, 14 percent, and 18 percent, respectively, indicated that they might use the practice in the future. Cover crops, which have been promoted heavily by NRS partner organizations, were reported by 25 percent of respondents. A relatively high proportion of farmers—38 percent—indicated that they might use cover crops in the future.
Two practices that are uncommon, but exceptionally effective at reducing nutrient loss—cropland converted to perennial crops (e.g., hay, pasture, trees) and extended rotations (3 or more crops over a 3 to 5 year rotation)—were also included in the list. Nineteen percent of farmers indicated that in 2014 they farmed at least some cropland that had been converted to perennial crops, and 17 percent reported that they employed some kind of extended rotations in their farm operation (figure 6). Similar proportions—14 and 18 percent, respectively—suggested they might use them in the future.
Structural practices
Structural1 and drainage practices were also explored in the survey (figure 7). Tile drainage 1 Structural practices refer to conservation practices that generally require some alteration to the landscape, such as
Figure 6. Use of tillage, cover crops, and perennial vegetation in 2014.
52 5032
25 19 177
2014
23 38
14 18
18
2836
4537
68 6575
No-Till ConservationTill
IntermittentNo-Till
CoverCrops
Conversionto
Perennial
ExtendedRotations
StripTill
Not used in 2014,no plans to use it
Not used in 2014, might use it in the future
I used the practicein 2014
Perc
ent

Iowa Farmers and the Iowa Nutrient Reduction Strategy: 2015 Survey Results—9
is prevalent among farmers in the surveyed watersheds, with 75 percent reporting that some form of drainage was employed on their land in 2014. “Buffers along streams or field edges to filter nutrients and sediment from runoff” were used by 57 percent of farmers, and terraces were reported by 56 percent. “In-field buffer strips (e.g., contour) to filter nutrients and sediment,” ponds or sedimentation basins, and bioreactors were reported by 40, 21, and 0.4 percent, respectively.
Length of practice use
Because one of the objectives of the survey is to examine changes in conservation behavior over time, farmers who reported use of practices in 2014 were asked to indicate how long they had used the practice. Two response categories were used: “one to three years,” and “over three years.” The results of this question set are displayed in Figures 8-10 as percent of those respondents who indicated they used the practice in 2014. Respondents who did not use the practice in 2014 were excluded from the results shown in figures 8-10.
Fertilizer management practices
Figure 8 displays the length of time that farmers had used various fertilizer management practices. Of those who reported spring nitrogen application
building terraces or planting buffer strips.
in 2014, 90 percent had practiced it for more than three years and 10 percent had practiced it for one to three years. Fall nitrogen application had also been used for over three years by 90 percent of users, and for one to three years by 10 percent. Of those who had used manure, nitrogen stabilizer, and growing season application of N in 2014, 93, 83, and 80 percent had used these practices for more than three years. These practices had been adopted more recently by seven, 17, and 20 percent of farmers, respectively. Eighty-six percent had used MRTN for over three years, and 14 percent had used this practice for one to three years. Finally, variable rate nitrogen application had been used by 79 percent for over three years and by 21 percent for one to three years.
Tillage and cover crops
Respondents also indicated the length of time they had used various practices related to tillage, cover crops, and perennial cover. Of those who had used no-till in 2014, 89 percent had employed it for more than three years, and 11 percent for one to three years (figure 9). Conservation tillage, intermittent no-till, and strip tillage had been used for more than three years by 95, 84, and 84 percent. These practices had been used by five, 16, and 16 percent for one to three years. Cover crops had been used for over three years by 39 percent of those who had reported using them in 2014. Cover crops had
Figure 7. Use of structural and drainage practices in 2014.
75
57 5640
21
<1
12
167
17
10
15
1227
37 43
6985
Tile orDrainage
StreamBuffers
Terraces ContourStrips
Ponds &Basins
Bioreactor
Not used in 2014,no plans to use it
Not used in 2014, might use it in the future
I used the practicein 2014
Perc
ent

10—Iowa Farmers and the Iowa Nutrient Reduction Strategy: 2015 Survey Results
the highest rate of recent adoption, with 61 percent reporting that they had used cover crops for one to three years.
Structural practices
Finally, respondents reported the length of time that they had used various structural and drainage practices. Of the farmers in the surveyed watersheds
who reported that they had used tile or drainage on their land in 2014, 96 percent had used this practice for over three years, and four percent had used it for one to three years (figure 10). Stream buffers had been used by 98 percent for over three years, and by two percent for one to three years. Terraces and contour strips had been used for over three years by 98 and 97 percent of farmers, respectively. These practices had been used by two percent and three
Figure 8. Length of time that farmers had used selected practices.
90 9383
9080 86 79
10 717
1020 14 21
Spring NApplication
Manure NStabilizer
Fall NApplication
GrowingSeason N
MRTN VariableRate N
Over 3 Years
1-3 Years
Perc
ent
Figure 9. Length of time that farmers had used selected practices.
89 9584
39
89 9284
11 516
61
11 816
No-Till ConservationTill
IntermittentNo-Till
CoverCrops
Conversionto Perennial
ExtendedRotations
StripTill
Over 3 Years
1-3 Years
Perc
ent

Iowa Farmers and the Iowa Nutrient Reduction Strategy: 2015 Survey Results—11
percent of farmers for one to three years. Water and sediment control basins and ponds had been used by 97 percent for over three years; three percent had used these structures for one to three years. All of the bioreactors that were reported in 2014 had been in place for more than three years.
Barriers to conservation
Two question sets explored barriers to water quality improvement. First, farmers who did not use selected conservation practices were asked to indicate the barriers that prevented them from using them. Second, farmers reported their level of agreement with statements regarding various barriers to water quality improvement in Iowa.
Barriers to use of selected conservation practices among non-users
Following the question set about use of conservation practices, a follow-up question asked those respondents who had not used selected practices in 2014 about potential barriers to practice use. The questions were preceded by the text, “Some practices from the previous question are listed below. If you did not use a particular practice on your farm in 2014, please indicate the reasons why you did not use it.” Four potential barriers were provided: “risk to crop yield,” “cost too high
compared to benefits,” “don’t know enough about it,” and “not appropriate for the farm’s soil or terrain,” and respondents were prompted to select all of the reasons that applied to them in the case of each practice.
Risk to crop yield was selected as a barrier by relatively few farmers. The highest-rated practice under this category was no-till, with 34 percent of farmers reported that yield risk was a reason that they had not adopted the practice (table 5). Fifteen percent of farmers indicated that risk to crop yield was a barrier to use of spring nitrogen application, and 11 percent reported that yield risk posed a barrier to their use of growing season nitrogen application.
High costs relative to potential benefits appears to be a more substantial barrier to adoption of several practice that are highly recommended. Nearly half (48 percent) of farmers indicated that high costs relative to benefits was a barrier to adopting nitrogen stabilizers, and 32 percent reported the same for cover crops (table 5). Thirty percent of farmers indicated that high costs were a barrier to adopting variable rate nitrogen application.
Substantial numbers of farmers reported that lack of knowledge served as a barrier to adoption for a number a practices. Nearly 73 percent of farmers
Figure 10. Length of time that farmers had used selected practices.
96 98 98 97 97 100
4 2 2 3 3 <1
Tile orDrainage
StreamBuffers
Terraces ContourStrips
Ponds &Basins
Bioreactor
Over 3 Years
1-3 Years
Perc
ent

12—Iowa Farmers and the Iowa Nutrient Reduction Strategy: 2015 Survey Results
selected “Don’t know enough about it” as a barrier to adoption of MRTN (table 5). Sixty-two percent reported that lack of knowledge was a barrier to adoption of bioreactors, and 44 percent reported that that their lack of knowledge about cover crops was a barrier to their use of the practice.
Finally, some practices were reported as not being appropriate to the respondents’ soil or terrain. Forty-eight percent of farmers indicated that contour strips were not applicable to their operation (table 5). Stream buffers were reported as not being applicable by 44 percent of farmers. This barrier was reported by 41 percent of farmers for the adoption of strip tillage.
General barriers to water quality improve-ment in Iowa
A question set asked farmers to report their level of agreement with various statements regarding impediments to improving Iowa’s water quality. The question set was preceded by the text, “The following are a number of potential barriers to water quality improvement in Iowa. Please indicate your disagreement or agreement with the following statements about these potential barriers,” and farmers were provided a five-point scale from “strongly disagree” (1) to “strongly agree” (5). The statements covered five categories of barriers:
• Knowledge-related barriers
• Economic barriers
• Landlord-related barriers
• Farm management barriers
• Agronomic or structural barriers
Table 5. Barriers to implemenation of selected conservation practices among non-users
Risk to crop yield
Cost too high compared to benefits
Don’t know enough about it
Not appropriate for my farm’s soil or
terrain
—Percent Checked—Spring nitrogen application ..................... 15.3 16.0 7.5 34.5Nitrogen stabilizer (e.g., N-SERVE) ....... 1.0 47.5 30.0 14.6Growing season nitrogen application (i.e., side-dress) ......................................
11.0 24.8 16.2 33.8
Nitrogen rate based on Corn nitrogen (N) rate calculator (MRTN) .....................
4.9 9.2 72.7 8.8
Variable rate N application ...................... 4.6 30.2 39.3 17.5
No till (all years of rotation) ..................... 34.3 9.7 17.4 33.3Strip tillage .............................................. 5.4 18.4 30.1 40.9Cover crops ............................................ 8.0 32.2 43.9 15.4Extended rotations (3 or more crops over a 3-5 year rotation) .........................
9.0 29.1 26.1 30.1
Buffers along streams or field edges to filter nutrients and sediment from runoff .
4.7 22.5 23.6 43.8
In-field buffer strips (e.g., contour) to filter nutrients and sediment ..................
3.9 17.2 26.6 47.6
Bioreactor(s) ........................................... 1.3 14.6 62.3 22.6

Iowa Farmers and the Iowa Nutrient Reduction Strategy: 2015 Survey Results—13
Among the knowledge-related barriers to water quality improvement, “Farmers need help learning how to reduce nutrient loss more effectively” received the highest level of endorsement, with
65 percent of farmers indicating agreement (table 6). Thirty-six percent of farmers agreed that, “Many farmers don’t know how to further reduce nutrient losses from their farms.” Nearly half (48 percent)
Table 6. Farmer perspectives on barriers to water quality improvement in IowaStrongly Disagree Disagree Uncertain Agree
Strongly Agree
—Percent—
Knowledge-related barriersFarmers need help learning how to reduce nutrient loss more effectively ................................................ 1.7 7.1 26.8 57.9 6.6Many farmers don’t know how to further reduce nutrient losses from their farms ............................... 2.5 24.0 37.5 34.0 1.9Many farmers are not aware that nutrients from agriculture can impact water quality ........................ 12.5 47.9 20.1 17.7 1.8I don’t know how to further reduce nutrient losses from my farm ........................................................... 7.3 41.0 32.8 17.7 1.2
Economic barriersPressure to make profit margins makes it difficult to afford conservation practices ................................... 2.5 14.5 19.1 50.6 13.2There is not enough cost-share and other support available from government agencies ....................... 2.6 13.9 34.1 39.3 10.1Many farmers don’t have the economic resources to adopt sufficient conservation practices .................... 5.5 26.4 30.8 30.9 6.5I can’t afford to implement more conservation practices .................................................................. 4.0 30.0 34.9 26.8 4.4Many conservation practices have negative impacts on yields .................................................................. 5.6 37.1 35.0 20.0 2.3
Landlord-related barriersLandlords are unwilling to spend money on conservation ............................................................ 2.6 13.0 29.0 41.9 13.5Landlords don’t want to change the way things are done......................................................................... 2.6 15.0 35.1 36.6 10.9Farm management barriersFarmers who are poor stewards of the land cause most of the water quality problems .......................... 3.3 15.7 34.4 36.0 10.6Farmers who have more run-off and erosion problems are less likely to seek conservation assistance................................................................ 3.6 23.9 32.2 33.4 6.8Agronomic or structural barriersNutrient loss is difficult to avoid in corn-soybean production systems.................................................. 5.1 34.4 30.0 27.8 2.7Nutrient loss is difficult to avoid in tile-drained fields ........................................................................ 5.8 32.0 39.2 21.4 1.7

14—Iowa Farmers and the Iowa Nutrient Reduction Strategy: 2015 Survey Results
of farmers disagreed with the statement, “I don’t know how to further reduce nutrient losses from my farm,” And 60 percent disagreed that, “Many farmers are not aware that nutrients from agriculture can impact water quality.”
The results also provided insights into farmer perceptions regarding potential economic barriers. The statement, “Pressure to make profit margins makes it difficult to afford conservation practices,” received agreement from 64% of farmers (table 6). However, in response to the statement, “I can’t afford to implement more conservation practices,” there was generally even spread of perspectives, with 34 percent disagreeing, 35 percent reporting uncertainty, and 31 percent agreeing. So, while farmers tended to agree that pressure to make profit margins presents a challenge to water quality in general, there were widely varying perspectives on individual economic capacity to afford conservation practices.
Substantial proportions of farmers agreed with statements related to potential landlord-related barriers. Fifty-five percent agreed that “landlords are unwilling to spend money on conservation” (table 6). Similarly, 48 percent agreed that “landlords don’t want to change the way things are done,” and 35 percent were uncertain. These perspectives point to a potential need for improved communication and collaboration between farmers and their landlords concerning water quality improvements on Iowa farmland.
Technical and financial assistance for conservation
Respondents were also asked about their use of technical and financial assistance for conservation practices. Forty-four percent of the surveyed farmers
had received conservation technical assistance from a state or federal agency in the previous five years (table 7). Only 8 percent had received technical assistance from a non-governmental organization. Thirty-eight percent of respondents had received financial assistance in the form of cost-share. These responses will be explored in future analyses to examine the potential correlation between conservation assistance and farmers’ attitudes and behaviors related to water quality improvement in Iowa.
Influence on nutrient management decisions
Farmers can turn to many organizations, agencies, and individuals for information to help them make decisions about nutrient management. The survey provided a list of agricultural stakeholders and asked farmers to rate, “how much influence the following sources of information have on your decisions about nutrient management practices and strategies,” on a five-point scale from “no influence” (1) to “very strong influence” (5). In Table 8, these groups are listed from highest to lowest in average response. The groups that were reported as having the highest average influence among all farmers were NRCS, ISU Extension, and local agricultural retailers. IDALS was ranked as the next most influential source of information, followed by family members and landlords.
Respondent Demographics
The survey respondents were 97 percent male. They ranged from 23 to 96 years of age, with a mean age of 59 years. Thirty-eight percent reported a high school degree as their highest level of education, 28 percent reported some college, and 22 percent reported a Bachelor’s degree. The remaining 12
Table 7. Percent of farmers that responded “Yes” to questions about the use of technical and financial assistance for conservation
—Percent—In the last 5 years, have you received conservation technical assistance from a state or federal agency? ..................................................................................................... 43.8In the last 5 years, have you received conservation technical assistance from a non-governmental organization (e.g., Soybean Association, Pheasants Forever)? ........... 7.6In the last 5 years, have you received cost share to help you fund conservation practices? ........................................................................................................................... 38.0

Iowa Farmers and the Iowa Nutrient Reduction Strategy: 2015 Survey Results—15
percent reported having less than high school, some graduate school, a graduate degree, or an Associate’s degree.
Respondents reported an average of 800 acres of farmland. A mean of 761 acres was cropland (i.e., land in corn, soybeans, small grains, and/or fruit and vegetables), an average of 33 acres of pasture, and nine acres in the Conservation Reserve Program. On average, respondents reported 364 acres of owned cropland and 398 acres of rented cropland. In 2014, 37 percent of the surveyed farmers raised livestock for sale or for milk production.
Farmers were asked to select a category that best represented their gross farm sales for 2014. Twenty-nine percent reported gross sales of $100,000 to $249,000, and 23 percent reported $250,000 to $499,999. Sixteen percent reported that gross sales fell below $99,999, 18 percent fell between $500,000 and $999,999, and 14 percent exceeded $1 million.
Summary of Key Findings
Awareness and attitudes• Nearly all farmers reported at least some
knowledge of the NRS
• The farm press, conservation agencies, and ISU Extension were the most common source of information about the NRS
• Agricultural product and service providers were the least common source of NRS information
• Most farmers were unaware of organized watershed management activities in their watersheds
Table 8. Influence that different sources of information have on nutrient management decisions
No Influence
Slight Influence
Moderate Influence
Strong Influence
Very Strong
Influence
—Percent—NRCS or county Soil and Water Conservation District ................................................................ 17.9 21.5 31.6 23.1 5.9Iowa State University Extension (e.g., field days, workshops, publications, videos) ............. 19.1 21.7 35.8 20.1 3.3Local agricultural retailer (e.g., fertilizer, agricultural chemical dealer, coop) ................... 23.0 23.6 32.7 18.2 2.5Other farmers ................................................... 19.8 27.0 37.5 14.6 1.1Iowa Department of Agriculture and Land Stewardship ....................................................... 24.8 26.7 32.3 13.8 2.4Family members ............................................... 32.6 21.6 24.4 17.2 4.1Landlord/farm management firm ...................... 41.6 18.5 23.0 14.9 2.0Iowa Water Quality Initiative (WQI) .................. 37.1 25.6 25.1 10.3 1.8Independent/private crop adviser/agronomist .. 47.5 17.5 21.0 12.4 1.6Seed company................................................... 43.8 25.2 22.0 8.1 0.9Custom operator/applicator .............................. 51.6 21.8 18.0 7.4 1.2Conservation NGO (e.g., Pheasants Forever, etc.) .................................................... 57.2 23.8 13.6 4.5 0.9

16—Iowa Farmers and the Iowa Nutrient Reduction Strategy: 2015 Survey Results
• In general, Iowa farmers were aware of and concerned about agriculture’s impacts on water quality
• Most farmers were supportive of the NRS’s goals
• Nearly half of farmers would be willing to have their operations’ nutrient management effectiveness evaluated
• Almost all farmers were concerned about potential regulations
• Almost half of respondents indicated that agricultural product and service providers should help farmers to address nutrient loss
Conservation practice use• Adoption rates of numerous practices
recommended by the NRS are lower than optimal
• Among farmers who reported that they are using key practices (e.g., N stabilizers, cover crops), substantial proportions adopted the practices in the three years prior to the survey
• Lack of knowledge is a major barrier to adoption of many conservation practices, as is the perception that practices are not appropriate for respondents’ farm operations.
• Pressure to make profit margins and lack of economic resources (including cost-share) were cited as substantial barriers to conservation practice adoption
• Lack of landlord support was cited by many farmers as a major impediment to greater conservation practice adoption
Influential stakeholders• The USDA Natural Resources Conservation
Service and county Soil and Water Conservation Districts and Iowa State University Extension were reported to have the most influence on decisions about nutrient management practices and strategies
• Local agricultural retailers were the third most influential group, closely followed by “other farmers”
Conclusions and next steps
The results of this 2015 NRS survey are contributing to the development of more effective strategies to help farmers and other agricultural stakeholders to take appropriate actions to support NRS goals. Improved understanding of farmer knowledge about and attitudes toward different steps that they can take to reduce nutrient losses, as well as barriers to action, will inform strategies to facilitate more widespread implementation of key practices. In addition, survey results can help to track progress by measuring changes over time. As additional rounds of the survey are completed, comparisons will be made within watersheds over time and between NRS priority and other watersheds. These comparisons will serve as an important component of long-term evaluation of progress toward NRS water quality goals.