Iowa Direct Care Worker Wage and Benefit Report · Charles Bruner and Syed Noor Tirmizi, ... of...
55
Iowa Direct Care Worker Wage and Benefit Report September 2010 Prepared for the Iowa CareGivers Association By the Child & Family Policy Center
Transcript of Iowa Direct Care Worker Wage and Benefit Report · Charles Bruner and Syed Noor Tirmizi, ... of...
Iowa Direct Care Worker
Wage and Benefit
Report
September 2010
Prepared for the Iowa CareGivers Association By the Child & Family Policy Center
Acknowledgments
Iowa CareGivers Association
2010 Direct Care Worker Wage and Benefit Survey
A number of individuals and organizations contributed significant time in the development, distribution, data review, and analysis of the 2010 Direct Care Worker Wage and Benefit Survey. We extend our heartfelt appreciation to the following:
Heather Bombei, Iowa Department of Public Health Tameshia Bridges, PHI (formerly Paraprofessional Healthcare Institute)
Elia Cardenas, Iowans for Social and Economic Development Pam Elwood, Iowa Department of Inspections and Appeals
Rick Kozin, Polk County Health Department Bob Mann, Mayflower Community
Becky Miles-Polka, Within Reach Consulting Services LLC Marcia Nichols, AFSCME Iowa Council 61/AFL-CIO
Carol Regan, PHI (formerly Paraprofessional Healthcare Institute) Lori SchraderBachar, Iowa Department of Human Rights
Rachel Scott, Iowa Department of Human Rights Maribel Slinde, WesleyLife Home Care
Charlie Wishman, AFSCME Iowa Council 61/AFL-CIO
Iowa CareGivers Association 1211 Vine Street #1120
West Des Moines, Iowa 50265 www.iowacaregivers.org
Di Findley, Pam Biklen, Lydia Fankhauser, John Hale,
Lin Salasberry, Linda Simonton, and Georgeanna Spagnola
Child and Family Policy Center
505 5th Avenue, #404 Des Moines, Iowa 50309
www.cfpciowa.org
Charles Bruner and Syed Noor Tirmizi, with Andrew Berg and Karon Perlowski
If you have questions about the 2010 Direct Care Worker Wage and Benefit Survey, please call 515-223-2805 or Toll Free 888-710-2762.
The survey was made possible by the following: Mid-Iowa Health Foundation, Northwest Area Foundation, US Department of Health and Human Services Health Resources and Services Administration (HRSA) grant #D1DHP16330, AFSCME Iowa Council 61/AFL-CIO. The views expressed in written conference or other materials or publications and by speakers and moderators do not necessarily reflect the official policies of the US DHHS or the HRSA, nor does mention of trade names, commercial practices, or organizations imply endorsement by the US Government or donors.
Table of Contents
Foreword by Di Findley .................................................................................................. i
Introduction: Iowa Direct Care Worker Wage and Benefit Report ................................ 1
Part One: Summary of Findings and Policy Options ..................................................... 3
Part Two: Certified Nursing Assistants on the Direct Care Registry — A Comparison of Three Survey Years, 2001, 2004, and 2010 ............................................................... 7
Data: CNA Workers Randomly Sampled from Iowa Direct Care Worker Registry 10
Part Three: Direct Care Worker Survey Results from the Direct Care Registry, Public Health Agencies, and AFSCME ..................................................................................... 14
Data: Survey Groups and Total Respondents ........................................................... 17
Data: Not for Profit and For-Profit, Direct Care Workers and All Respondents ...... 25
Part Four: Direct Care Workers, Family Structure, Health Benefits, and Economic Well-Being ...................................................................................................................... 28
Data: Household Structure, All Respondents ............................................................ 32
Part Five: Direct Care Worker Knowledge of and Use of Public Benefits and Employment Searches Outside the Field ........................................................................ 37 Appendices: Appendix One: Methodology ......................................................................................... Appendix Two: Survey Questionnaire ...........................................................................
42 44
i
Foreword: Background and Context for the Study Findings
By Di Findley, Iowa CareGivers Association
Who will provide care or support for aging Iowans and Iowans with a disability when they can no longer care for themselves? What quality of care or support will be provided? The answer to these questions is this…No one knows. But we do know that access to health and long term care is not possible without a prepared health and long term care workforce. The “Care Gap”
We do know, however, that as a state—and as a nation—we are unprepared. The good news? Iowa is a leader in the nation on asking the questions, gathering data and making significant efforts to get prepared. Iowa has done a lot…but more – and a greater sense of urgency – is needed. Iowa has recognized and is dealing with THE “CARE GAP” – the stark difference between the future demand for direct care workers and the future supply. The aging of a massive baby boom generation at a time when the pool of potential workers is dwindling has even been referred to by some experts as a “tsunami of need.” As a result, three of the top ten jobs in this decade are in direct care. Over a million are needed in America and over 10,000 in Iowa. The Iowa Governor-appointed Direct Care Worker Task Force defines a direct care worker as an
individual who provides services, care, supervision, and emotional support to people with
chronic illnesses and disabilities. This definition does not include licensed nurses, case
managers, or social workers. Direct care workers are people known by various job titles – certified nurse assistants, medication aides, patient care technicians, home care and home health aides, direct support professionals, personal care attendants, and many others. They help people do what they can no longer do without assistance …. dressing, grooming, bathing, preparing meals, managing medications, rehabilitating, hydrating, monitoring conditions, ambulating, toileting, transporting, and prompting, as well as providing emotional support and encouragement when needed. Yet, because the jobs have historically featured low pay, poor benefits, lack of educational or advancement opportunities within the fields of direct care, and high incidence of worker injury and burn-out, the ability to recruit and retain quality staff is reaching crisis proportions.
Why Iowans Should Be Concerned
The presence of caring and qualified direct care workers directly impacts the quality of life of aging Iowans and Iowans with a disability; and the lives of their families. Shortages of workers hurt everyone and limit the amount and quality of care being provided. The amount and quality of direct care workers affect every Iowan, in one way or another, at one time or another.
ii
Why This Survey Is Important
The Iowa Direct Care Worker Wage and Benefit Survey Report provides valuable information about wages, benefits, and working conditions of direct care workers that will have to be addressed in order to ensure Iowa gets prepared and meets this workforce challenge. Decades of research have documented the fact that a major reason direct care workers leave the field is inadequate compensation. The responses contained within this report will help better inform the public, employers, workers, consumers, and policy makers about the realities of the work and the needs that exist. The findings will help to inform policy and practice decisions related to how Iowa can best respond to the needs of this workforce and ensure that Iowa will be able to meet the needs of its citizens.
1
Introduction: Iowa Direct Care Worker Wage and Benefit Report
The following is a wage and benefit report about Iowa’s direct care workers. It was produced by the Child and Family Policy Center for the Iowa CareGivers Association. The report is based upon a mail-in survey distributed to over 10,000 Iowa direct care workers in the state in 2010. In order to get to the broadest range of direct care workers possible, the survey was distributed through three different methodologies. Overall, there were 1,276 responses, for an overall response rate of 12.5%. Overall, respondents came from ninety-eight of Iowa’s ninety-nine counties, with only Monona County having no respondents. First, the survey was mailed to a random sample of the Certified Nursing Assistants (CNAs) on the Iowa Direct Care Worker Registry. Any nurse assistant who works in a long-term care facility (nursing facility, skilled nursing facility, or certified long-term care unit in a hospital) is required to be on the Registry. A mail survey to a random sample of those on this Registry was used in two earlier Iowa Direct Care Worker Wage and Benefit Reports (2001 and 2004), and the responses from this survey mailing are compared with the earlier reports on common questions across the surveys. Second, the survey was provided to the 132 Iowa Department of Public Health certified local agencies to distribute to their home care workers. This dissemination strategy was employed in order to get representation from direct care workers involved in providing home care, largely through county departments of public health. Third, the survey was distributed by the American Federation of State, County, and Municipal Employees (AFSCME) to the list of Consumer Directed Attendant Care (CDAC) home care workers provided it by the state, including its membership. This includes workers not on the Direct Care Worker Registry and not employed by public health agencies, including those working for private agencies providing home care or for those who are self-employed. Appendix One provides additional detail on the methodology used in the survey distribution. The survey findings are summarized in five parts. Part one summarizes the major findings from the entire survey. Part two examines the survey responses from the random sample of CNAs from the Direct Care Worker Registry in comparison to the two earlier Wage and Benefit Reports, to describe overall trends. Part three examines responses for the three different surveys, including survey responses to questions not asked in the earlier surveys. Part four examines responses by household type, whether married or single and with or without children under eighteen in the home, with particular emphasis upon health insurance coverage.

2
Part five examines responses related to participation in different public benefit systems other than health care that could contribute to worker economic security, and work job searches outside the direct care field. The appendix provides a more detailed description of the methodology involved in survey dissemination and a copy of the survey questionnaire.
3
Part One: Summary of Findings and Policy Options
Nationally and in Iowa, the number of workers in the direct care profession has grown dramatically. The demand for direct care workers will only continue to grow as the general population ages. Most states, including Iowa, currently face shortages in direct care workers. Further, the population of those most likely to become direct care workers (women between 25-54) is declining slightly, while those requiring care is continuing to grow. According to the Bureau of Labor Statistics (BLS), the two federal job classifications most aligned with the direct care workers surveyed were home health aides and nursing aides, orderlies, and attendants. While overall employment in Iowa grew only slightly (3.9%) between 2000 and 2009, BLS data show employment in these two classifications grew by 27.9%, with the more rapid growth in the home health aide area. Both the BLS data and comparisons of the three surveys of Certified Nursing Assistants (CNAs) on the Direct Care Worker Registry (in 2001, 2004 and 2010) show that direct care workers in Iowa are paid well below the average compensation for the overall Iowa workforce. Despite an increase in demand for their services and a shortage of qualified workers, their wage advances over the period from 2000 to 2010 have been modest. The survey data show a median hourly pay of approximately $11.50 in 2010 (equivalent to a full-time annual wage of $23,920), compared with a median hourly wage for all Iowa workers of $14.40. Between the 2004 and 2010 surveys, the median wage growth was $1.00. At the same time, while the survey data as well as the BLS data show earnings have increased modestly during this period, certain costs, particularly for health insurance coverage, have increased at a much greater level. Between 2000 and 2008, for instance, the overall costs of employer-sponsored individual and family coverage both doubled. Overall, 23% of respondents to the 2010 survey indicated they had no health insurance, nearly double the rate reported for Iowa adults on the American Community Survey (12.4% in 2008). Clearly, while direct care workers are providing health-related services to Iowans, they often do not have health coverage for themselves. For all respondents who indicated they had coverage through their main direct care employer in 2010, one-third indicated they had great concern over losing that coverage and 57% indicated that health coverage benefits had declined or costs to the employee had increased in the last two years. In short, the survey confirmed that not only are direct care workers among the lowest paid workers in Iowa, but they also are more likely than the population as a whole to be without health coverage. More detailed analysis, however, showed significant differences in relation to insurance coverage and general economic well-being among the three different survey groups (the three groups surveyed had different employers), the for-profit or not-for-profit status of their employers, and family structure. While there was limited variation in the actual wages that workers received, their tenure, overall household income, insurance coverage, and satisfaction with working conditions varied significantly.
4
Differences by Survey Groups. Respondents from public health entities (who primarily worked in county departments of health) were much more likely to be offered and to accept health insurance coverage through their main employer, with 61% receiving their coverage through the employer. Only 7% identified themselves as uninsured, and their employer was much more likely to pay the full share of the health insurance premium. These workers expressed lower levels of concern regarding working conditions – particularly around stress or mental health, getting requested or earned time off, having shifts change without notice, and not having enough staff to provide care. Their tenure in the direct care field was also longer, perhaps because of the provision of benefits and better working conditions. Respondents from the Iowa Direct Care Registry (who primarily worked in nursing homes, hospitals, or assisted living facilities) were less likely to be offered or accept health coverage from their employer, although 41% did receive coverage through their employer. At the same time, 23% identified themselves as uninsured. Nearly half (48%) expressed being very concerned about not having enough staff to provide care, with 31% expressing stress and mental health concerns. Concerns around inadequate staffing were four times higher for this group than the other two groups, and may reflect the shortage of direct care workers in the state. When respondents were further broken into those who worked for for-profit and not-for-profit entities, those working for not-for-profit entities had better hourly wages and health and other benefits than those working for for-profit entities. Only one in ten respondents from the CDAC list (who primarily work for other home care providers or on their own) indicated they could secure health coverage through their employer. They also had almost no access to any other benefits through their employment. They were by far the most likely to report being uninsured, at 38%. These workers’ concerns with their working conditions were somewhat lower than those for respondents from the Direct Care Registry. Clearly, while wages were very similar across the three groups, benefits and other aspects of the work were not. Differences by Family Structure. Different types of families have different income and health care needs. Survey respondents included single individuals, single parents with children, married couples with children, and married couples without children, generally in the same proportion to the Iowa population as a whole. Among these groups, single parents with children were most likely to be without health insurance for themselves (35%), although more than ninety percent were successful in getting coverage for their children, mostly through Medicaid and hawk-i. Single individuals were next most likely be without health insurance for themselves (26%). Married couples with no children were most likely to have coverage. Still, all groups had higher rates of uninsurance than for Iowa adults as a whole. Some married couples had an advantage in getting coverage through their spouse’s employer, but there also was a high rate of uninsurance among spouses. Altogether, there were multiple types of coverage that respondents secured, including Medicaid and Medicare. Particularly given the low household incomes for single parents with children, a
5
large share of direct care workers will be eligible for Medicaid, when it is expanded to 133% of poverty under federal law in 2014. A significant share of single individuals and married couples with children also are likely to become eligible. While very few children of direct care worker respondents are covered under their employer-sponsored plans, 95% do have coverage, with Medicaid and hawk-i playing very prominent roles. Among single parent families, 72% of all children are covered by these two public programs, and for married couples with children, 42% are covered. Clearly, the expansions of child health coverage and streamlining of enrollment provisions as a result of both state and federal law have contributed to this level of coverage. Direct care workers with children are particularly likely to be eligible for, use, and benefit from these programs. Participation in Other Public Programs and Job Searches. In addition to medical benefits, both the state and federal governments offer programs to help support low-wage workers, including the earned income tax credit (EITC), food stamps (now referred to as the supplemental nutrition assistance program (SNAP), child care subsidies, and home energy assistance, among others. From information provided by respondents about household size and income, 18% of respondents were at or below the federal poverty level and 49.9% were at or below 200% of the federal poverty level. Respondents expressed various degrees of knowledge about and participation in these programs, with the highest participation rates for the earned income tax credit (34%) for the federal program, food stamps (15%), and home energy assistance (15%). Eligibility for most of these programs is based upon household income and household size. Analysis suggests that most DCWs participate in the EITC when eligible, with less complete levels of participation in other public programs. Analysis suggests that, particularly as the state food stamp gross income eligibility limit is changed from 130% to 160% of poverty and the asset test eliminated, a much larger share of direct care workers will be eligible for SNAP benefits than currently participate in the program. Overall, however, these benefits do not lead to being economically secure and, in fact, 20% indicate they are seeking employment outside the field of direct care work, with pay and benefits being the most cited reasons for such searching. Policy Options. Many direct care workers work for employers who receive substantial public reimbursement through Medicaid or Medicare. While their employer may not be a public entity, there are policies that could impact working conditions, health benefits, and even compensation. While federal health reform requires that Medicaid be expanded to 133% of poverty in 2014, states are provided the option of increasing their coverage before then. Taking action to extend Medicaid coverage would definitely benefit a substantial number of direct care workers who either do not have coverage today or are foregoing other basic services in order to have coverage. While this would not provide affordable coverage for all direct care workers, it would address a significant number of direct care workers who are most in need. In addition, the state could increase its own eligibility levels for different programs, particularly the child care subsidy, and increase the size of the state Earned Income Tax Credit. There is a recognized role for government to play in supplementing low-wage employment, particularly in areas that meet public needs.
6
In addition, public policy also has some leverage in dealing with working conditions and compensation issues, as the state both regulates providers and provides reimbursement for services through Medicaid, which covers a very significant portion of the nursing home population, in particular. This includes monitoring staffing ratios and workloads, which were a particular source of concern among direct care workers in hospitals and nursing homes. When Iowa enacted comparable worth for state employees, the pay classification for resident treatment workers (staff who provide nursing assistant services in state hospitals and mental health institutes) was increased by five pay grades, from grade 14 to grade 19. As a result, state resident treatment workers, in addition to receiving state health insurance benefits, have starting wages of $14.10 per hour (equivalent to $29,328 per year), and opportunities for increases up to $20.60 per hour ($42,848). While comparable worth has not been extended to local governments or to the private sector, it is designed to better reflect the social value or worth of specific jobs. Experiences from comparable worth are that the turnover rate among resident treatment workers declined greatly after enactment of comparable worth, and the tenure, experiences, and skill levels of workers increased. Direct care workers provide a needed and important service for the individuals they serve and for society as a whole. A significant share of the cost of providing that care is born by government, through Medicare, Medicaid, and public health services. The survey results show that Iowa direct care workers are among the lowest-waged workers in Iowa, the least likely to have health coverage for themselves, and frequently under working conditions that they find to be hazardous. Ultimately, public policy can play a role in the compensation that is provided for this workforce, the health and other benefits they receive, and the working conditions under which they operate. Public policy, or the absence of it, directly affects direct care workers and their families, but it also affects those who rely upon their care and support.
7
Part Two: Certified Nursing Assistants on the Direct Care Registry – A Comparison of
Three Survey Years, 2001, 2004 and 2010
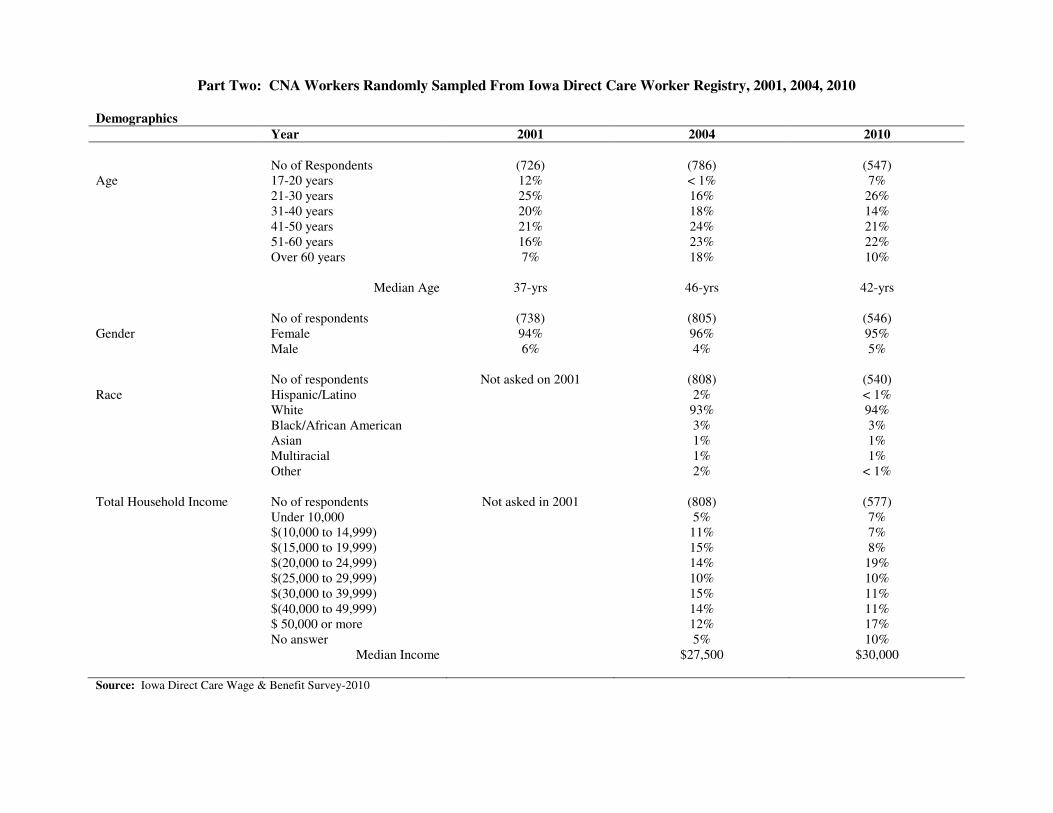
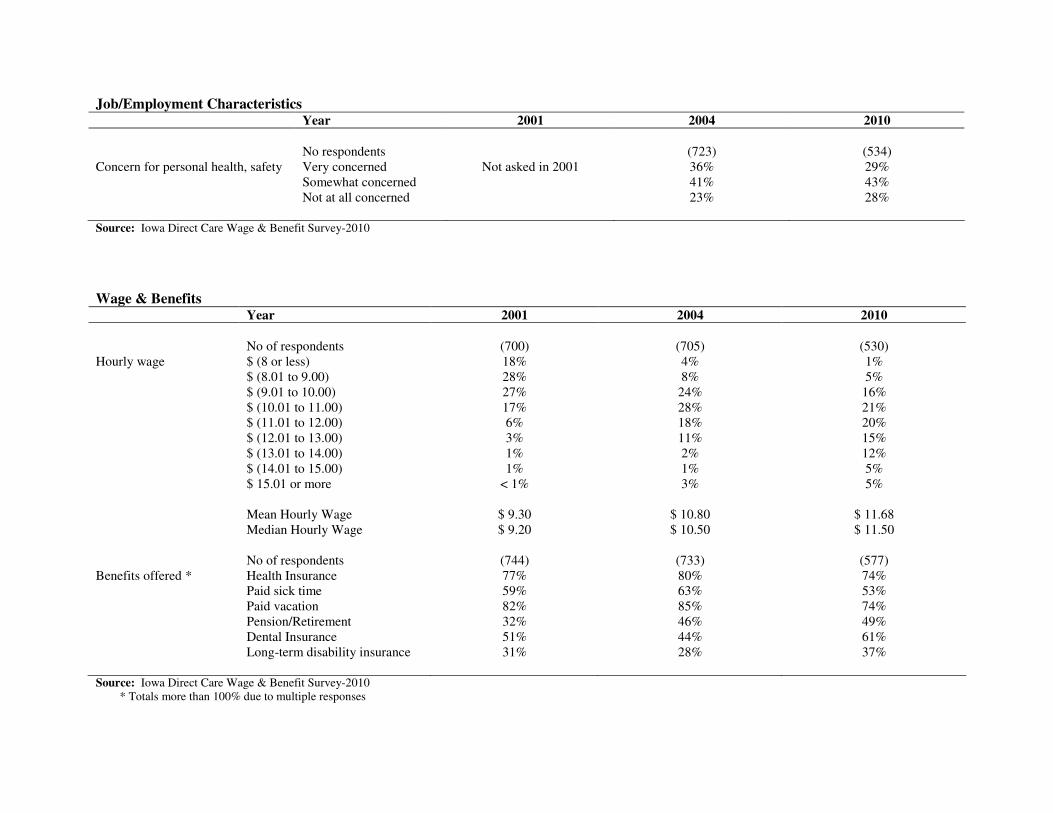
Like the 2001 and 2004 surveys, in 2010 a random sample of Certified Nursing Assistants (CNAs) on the Iowa Direct Care Worker Registry was mailed a survey. There were 577 responses received from 3,494 mailed, for a response rate of 16.5%. This was similar to the response rate for the 2004 survey (808 responses of 4,500 mailed, for a response rate of 19.0%). This Part of the report examines questions that are comparable to questions on the earlier surveys to identify trends related to CNAs on the Direct Care Worker Registry. Demographics. Respondents remain predominantly female (averaging 95% in all three survey years) and white, Non-Hispanic (93% in 2004 and 94% in 2010). While there was a significant increase in the mean age of respondents between 2001 and 2004, there was a reduction in the mean age in 2010. In 2010, there were more CNAs living in households with incomes above $50,000 (17% compared to 12%) than in 2004, but also more living in households with incomes below $25,000 (41% compared with 34%). Employment Characteristics. The difference in the age of respondents may be a result of the larger proportion of CNA respondents with fewer years of service in the field. In 2004, only 10% of the respondents had tenures in the direct care field of five or fewer years, while in 2010 36% had tenures of five or fewer years. The latter would not have been on the Iowa Direct Care Registry list in 2004. Part of the reason for this finding is the large increase in direct care workers over this period (see discussion, below). In 2004, 56% of respondents had tenures of eleven or more years in direct care, while in 2010 40% of respondents did. The latter figures still show that, for a significant share of respondents, direct care work truly constitutes a career or at least a substantial part of a career. In addition, over two-thirds of all respondents indicated they were full-time workers in their main CNA jobs, and almost ninety percent worked at only one CNA job. There was a significant shift in the site of this work in the sample from 2004 to 2010, however, to both assisted living and hospital care and away from nursing home care. This also represents the area where there has been dramatic growth in the direct care field workforce Job Characteristics, Wages and Benefits. Reported hourly wages of respondents rose more slowly between 2004 and 2010 than between 2001 and 2004, with mean hourly wages rising to $11.68 in 2010 and median hourly wages rising to $11.50. These remain substantially below the average for all Iowa workers, as reported by the Bureau of Labor Statistics (see discussion, below). The survey confirms the generally low pay for CNAs in Iowa. In terms of benefits offered, responses between 2010 and the earlier surveys showed a decline in reporting of certain employer-offered benefits (health insurance, paid sick time, and paid vacation), but an increase in others (pension/retirement, dental insurance, and long-term disability insurance). Respondents also reported somewhat fewer concerns for personal health and safety while on the job, although the rates remained high (29% stated they were very concerned in 2010, compared with 36% in 2004).
8
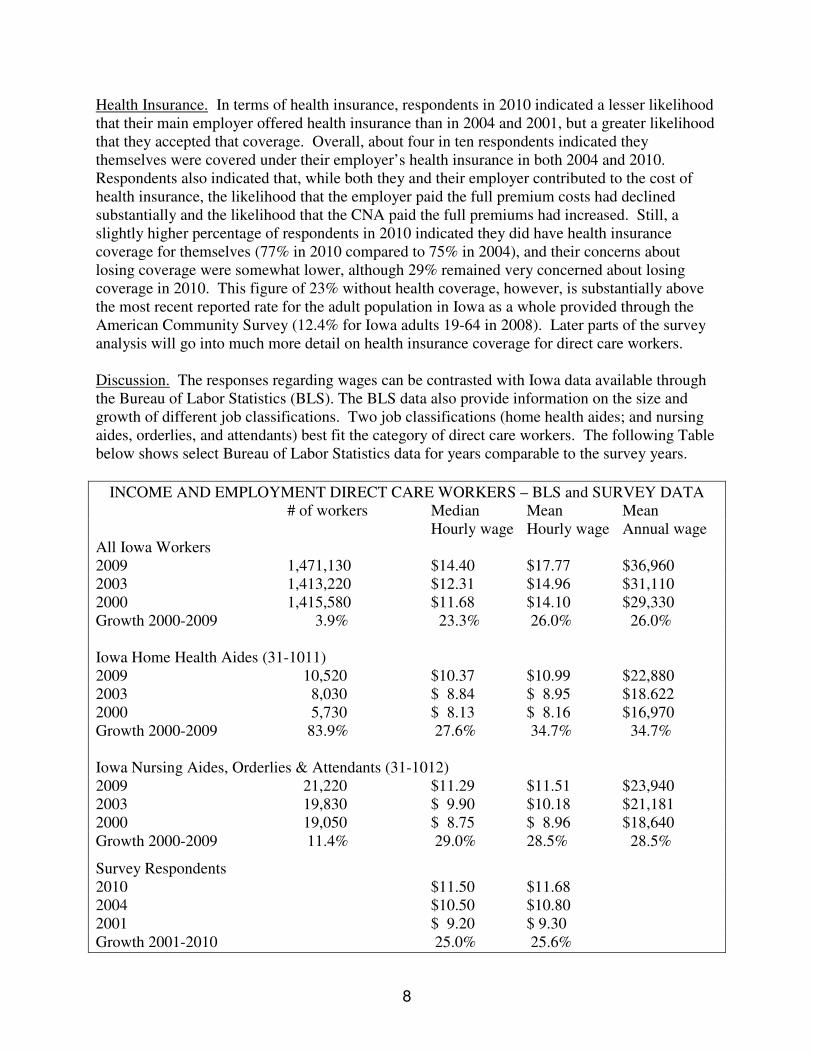
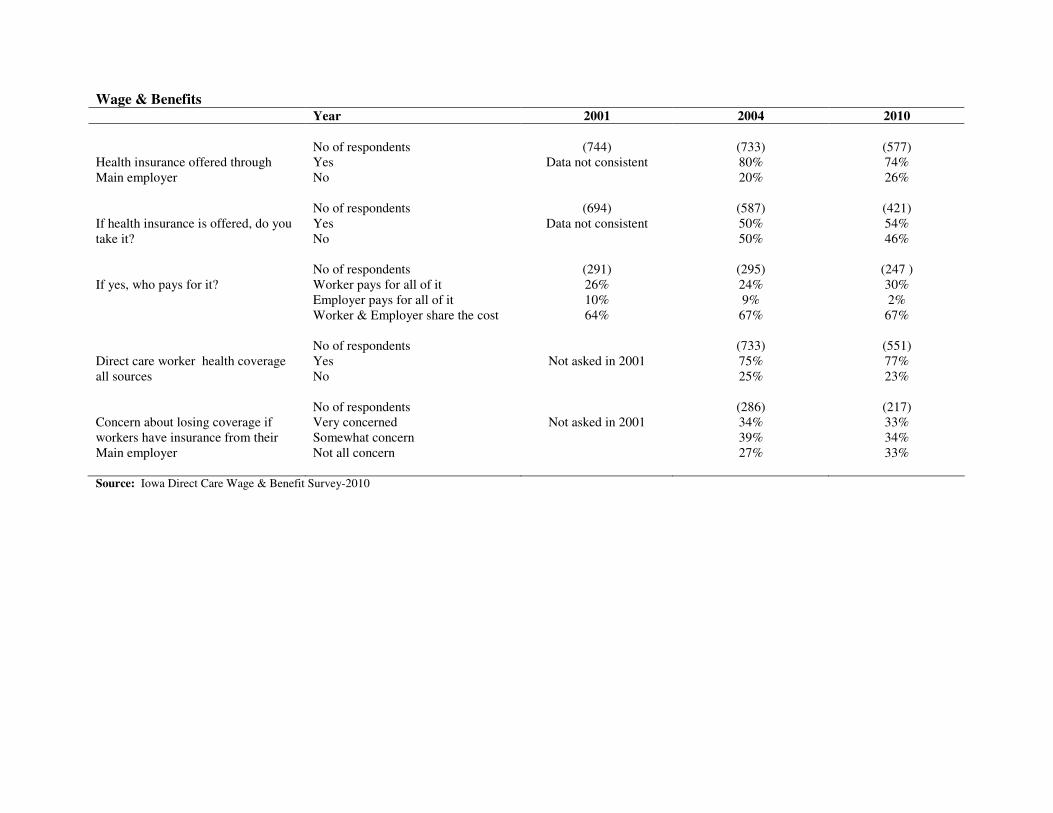
Health Insurance. In terms of health insurance, respondents in 2010 indicated a lesser likelihood that their main employer offered health insurance than in 2004 and 2001, but a greater likelihood that they accepted that coverage. Overall, about four in ten respondents indicated they themselves were covered under their employer’s health insurance in both 2004 and 2010. Respondents also indicated that, while both they and their employer contributed to the cost of health insurance, the likelihood that the employer paid the full premium costs had declined substantially and the likelihood that the CNA paid the full premiums had increased. Still, a slightly higher percentage of respondents in 2010 indicated they did have health insurance coverage for themselves (77% in 2010 compared to 75% in 2004), and their concerns about losing coverage were somewhat lower, although 29% remained very concerned about losing coverage in 2010. This figure of 23% without health coverage, however, is substantially above the most recent reported rate for the adult population in Iowa as a whole provided through the American Community Survey (12.4% for Iowa adults 19-64 in 2008). Later parts of the survey analysis will go into much more detail on health insurance coverage for direct care workers. Discussion. The responses regarding wages can be contrasted with Iowa data available through the Bureau of Labor Statistics (BLS). The BLS data also provide information on the size and growth of different job classifications. Two job classifications (home health aides; and nursing aides, orderlies, and attendants) best fit the category of direct care workers. The following Table below shows select Bureau of Labor Statistics data for years comparable to the survey years.
INCOME AND EMPLOYMENT DIRECT CARE WORKERS – BLS and SURVEY DATA # of workers Median Mean Mean Hourly wage Hourly wage Annual wage All Iowa Workers 2009 1,471,130 $14.40 $17.77 $36,960 2003 1,413,220 $12.31 $14.96 $31,110 2000 1,415,580 $11.68 $14.10 $29,330 Growth 2000-2009 3.9% 23.3% 26.0% 26.0% Iowa Home Health Aides (31-1011) 2009 10,520 $10.37 $10.99 $22,880 2003 8,030 $ 8.84 $ 8.95 $18.622 2000 5,730 $ 8.13 $ 8.16 $16,970 Growth 2000-2009 83.9% 27.6% 34.7% 34.7% Iowa Nursing Aides, Orderlies & Attendants (31-1012) 2009 21,220 $11.29 $11.51 $23,940 2003 19,830 $ 9.90 $10.18 $21,181 2000 19,050 $ 8.75 $ 8.96 $18,640 Growth 2000-2009 11.4% 29.0% 28.5% 28.5%
Survey Respondents 2010 $11.50 $11.68 2004 $10.50 $10.80 2001 $ 9.20 $ 9.30 Growth 2001-2010 25.0% 25.6%
9
As the Table shows, survey respondents’ mean and median hourly wages were very similar to those for nursing aides, orderlies, and attendants and slightly higher than home health aides, but very much below those for workers in the state as a whole. Despite the increase in demand for these positions (with an 83.9% growth in home health aides over the nine-year period and an 11.3% growth in nursing aides, orderlies, and attendants compared with an overall Iowa employee growth rate of 3.9%), there was only a very modest increase in wages relative to the workforce as a whole. These direct care positions remain among the lowest paid occupations in the Iowa economy. Takeaway messages. Certified Nursing Assistant (CNA) work represents a career for many workers, with long lengths of tenure. At the same time, the wages that workers receive are well below average wages in Iowa. Even at full-time employment for a single individual, wages are scarcely above 200% of the federal poverty level, the amount generally considered as minimal to provide for economic self-sufficiency. While most employers of survey respondents currently offer health benefits, at best employers contribute only a part to the cost of that coverage and health care may be a significant additional expense. There were only a few questions regarding health care on earlier surveys, so trend information on health coverage is not available on some important health coverage issues. Remaining parts of this report go into more detail about health insurance coverage for the 2010 respondents.
Part Two: CNA Workers Randomly Sampled From Iowa Direct Care Worker Registry, 2001, 2004, 2010
Demographics
Year 2001 2004 2010
No of Respondents (726) (786) (547) Age 17-20 years 12% < 1% 7% 21-30 years 25% 16% 26% 31-40 years 20% 18% 14% 41-50 years 21% 24% 21% 51-60 years 16% 23% 22% Over 60 years 7% 18% 10% Median Age 37-yrs 46-yrs 42-yrs No of respondents (738) (805) (546) Gender Female 94% 96% 95% Male 6% 4% 5% No of respondents Not asked on 2001 (808) (540) Race Hispanic/Latino 2% < 1% White 93% 94% Black/African American 3% 3% Asian 1% 1% Multiracial 1% 1% Other 2% < 1% Total Household Income No of respondents Not asked in 2001 (808) (577) Under 10,000 5% 7% $(10,000 to 14,999) 11% 7% $(15,000 to 19,999) 15% 8% $(20,000 to 24,999) 14% 19% $(25,000 to 29,999) 10% 10% $(30,000 to 39,999) 15% 11% $(40,000 to 49,999) 14% 11% $ 50,000 or more 12% 17% No answer 5% 10% Median Income $27,500 $30,000 Source: Iowa Direct Care Wage & Benefit Survey-2010

Job/Employment Characteristics
Year 2001 2004 2010
No of respondents (744) (733) (550) How long a direct care worker Less than a year 2% 0% 6% More than 1 year but < 3 years 20% 1% 12% 3-5 years 20% 9% 18% 6-10 years 20% 24% 23% 11-20 years 25% 37% 19% More than 20 years 14% 29% 21% Median Years of Work 8-yrs 11-yrs 8-yrs No of respondents (720) (727) (551) Site of Job Nursing home 74% 79% 44% Home care 7% 6% 4% Hospital 14% 6% 22% Assisted living 3% 3% 26% Adult day care center 0% 0% < 1% Hospice/Group Home 2% 6% 2% Job at a union facility No of respondents (729) (733) (540) Yes 8% 7% 5% No 91% 93% 95% No of respondents (723) (730) (549) Job Status Full-time 68% 68% 70% Part-time 23% 23% 24% On call 4% 5% 5% Other 4% 3% < 1% No of respondents (717) (727) (544) Number of direct care jobs 1 Job 89% 87% 86% 2 Jobs or more 11% 13% 14% Workers in Nursing Homes (Only) No of respondents (515) (567) (236) For Profit 44% 42% 50% Not for Profit 56% 58% 50% Source: Iowa Direct Care Wage & Benefit Survey-2010
Job/Employment Characteristics Year 2001 2004 2010
No respondents (723) (534) Concern for personal health, safety Very concerned Not asked in 2001 36% 29% Somewhat concerned 41% 43% Not at all concerned 23% 28% Source: Iowa Direct Care Wage & Benefit Survey-2010
Wage & Benefits Year 2001 2004 2010
No of respondents (700) (705) (530) Hourly wage $ (8 or less) 18% 4% 1% $ (8.01 to 9.00) 28% 8% 5% $ (9.01 to 10.00) 27% 24% 16% $ (10.01 to 11.00) 17% 28% 21% $ (11.01 to 12.00) 6% 18% 20% $ (12.01 to 13.00) 3% 11% 15% $ (13.01 to 14.00) 1% 2% 12% $ (14.01 to 15.00) 1% 1% 5% $ 15.01 or more < 1% 3% 5% Mean Hourly Wage $ 9.30 $ 10.80 $ 11.68 Median Hourly Wage $ 9.20 $ 10.50 $ 11.50 No of respondents (744) (733) (577) Benefits offered * Health Insurance 77% 80% 74% Paid sick time 59% 63% 53% Paid vacation 82% 85% 74% Pension/Retirement 32% 46% 49% Dental Insurance 51% 44% 61% Long-term disability insurance 31% 28% 37% Source: Iowa Direct Care Wage & Benefit Survey-2010
* Totals more than 100% due to multiple responses
Wage & Benefits Year 2001 2004 2010
No of respondents (744) (733) (577)
Yes Data not consistent 80% 74% Health insurance offered through Main employer No 20% 26% No of respondents (694) (587) (421)
Yes Data not consistent 50% 54% If health insurance is offered, do you take it? No 50% 46% No of respondents (291) (295) (247 ) If yes, who pays for it? Worker pays for all of it 26% 24% 30% Employer pays for all of it 10% 9% 2% Worker & Employer share the cost 64% 67% 67% No of respondents (733) (551)
Yes Not asked in 2001 75% 77% Direct care worker health coverage all sources No 25% 23% No of respondents (286) (217)
Very concerned Not asked in 2001 34% 33% Somewhat concern 39% 34%
Concern about losing coverage if workers have insurance from their Main employer Not all concern 27% 33% Source: Iowa Direct Care Wage & Benefit Survey-2010
14
Part Three: 2010 Direct Care Worker Survey Results from the Direct Care Registry,
Public Health Agencies, and Consumer Directed Care Attendant List
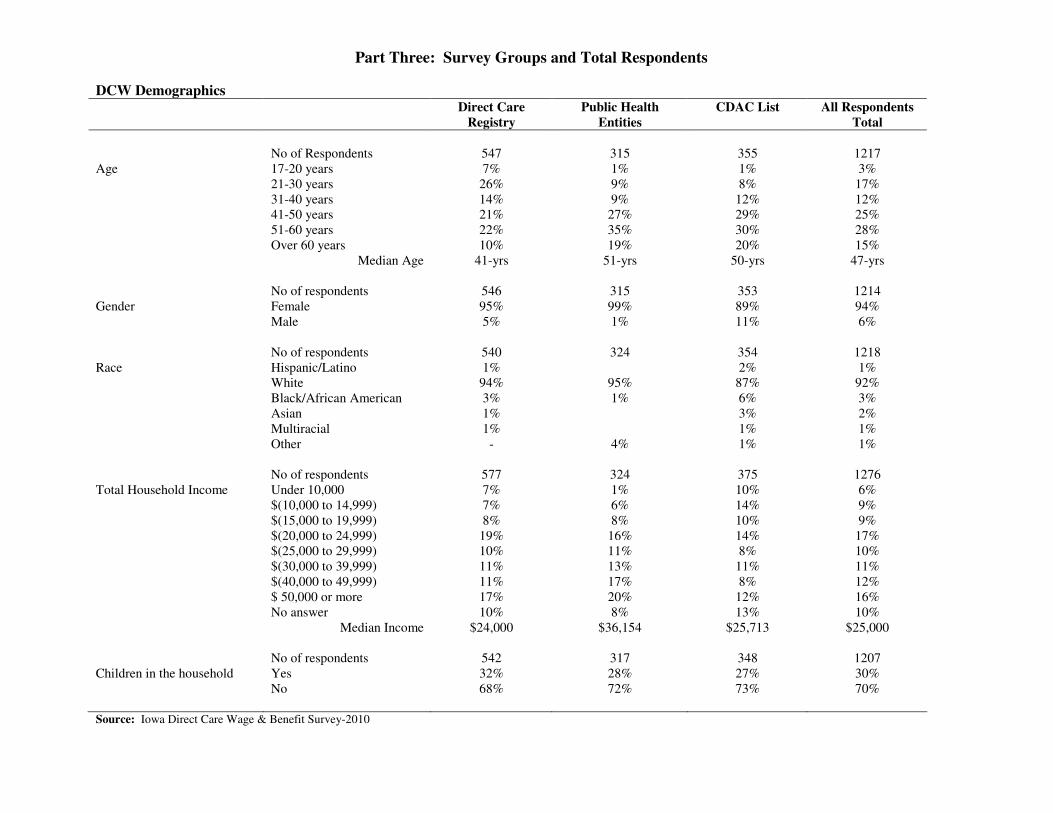
The 2010 Direct Care Worker survey was distributed through three different mechanisms in order to get as full a range of direct care worker respondents as possible. Like the 2001 and 2004 surveys, the 2010 survey was mailed to a random sample of Certified Nursing Assistants (CNAs) on the Iowa Direct Care Registry. Part Two compares the responses across these three years for questions that are comparable. Since CNAs are required to register if they are working in nursing facilities or skilled care units in hospitals, this sample primarily contains workers whose main job is in one of those facilities. In order to obtain information on direct care workers who provide home care, two other mechanisms were developed for survey distribution. First, the American Federation of State, County, and Municipal Employees (AFSCME), which represents organized direct care workers who provide home care, mailed the survey to the Consumer Directed Attendant Care (CDAC) list provided them by the Iowa Department of Human Services. Second, since public health agencies also provide a significant share of home care, the survey was provided to public health agencies to disseminate to their home care workers. These were given to employees rather than mailed, but the surveys from all three groups were mailed back directly to the Iowa CareGivers Association, and for the CDACs, to AFSCME. The survey questions were identical for the three groups, but were color coded so they could be reported separately, as well as together. This Part provides information on the full range of questions asked in the survey for all three groups, which had a particular emphasis upon health care coverage of the respondent, the respondent’s family, and the respondent’s view of working conditions of the respondent’s main direct care job. Commonalities Across the Groups. The three groups all shared several common characteristics – predominantly female, workers who are white, Non-Hispanic, workers with a median age above the statewide median and wages well below the state median household income. In particular, there was very small variation across the three groups in the mean or median hourly wage, from a low of $11.50 to a high of $11.73 Overall, 86% report wages between $9.01 and $13.99 per hour, with only 5% earning above the median wage level for workers in the state as a whole. For a workforce that has substantial tenure, the wage range is very flat and at a low level. These are reflective of other studies of direct care workers and of the Bureau of Labor Statistics information on similar personnel classifications. In addition, all three groups had respondents representing different family structures – single with no children, single with children, married with no children, and married with children. Since these different family structures have different health insurance needs, with different implications of employer coverage, Part Four examines these four groups separately. Differences Across the Three Respondent Groups. As intended, there are significant differences across the three groups, starting with their site of employment. While the respondents from the Iowa Direct Care Registry worked in a nursing home, assisted living, or hospital (92%), a large
15
majority of the respondents through public health survey distribution indicated their primary employment was in a county or public home care agency (72%). Almost all of the AFSCME respondents indicated they worked in home care (but not as part of any agency) or were self-employed (98%). Collectively, this provides a mix of direct care worker backgrounds that is likely to be much more reflective of the total population of direct care workers than any of the three groups would alone. Public Health Group. Respondents from the public health group tended to be older, have higher household incomes, be married, and have had long tenure in the direct care field. While their hourly pay was only slightly higher than that for direct care worker respondents from the Registry or CDAC groups, they received significantly more benefits from their employer and had lower overall concern with their personal health and safety. Far fewer indicated that they did not have any health coverage for themselves (7%) and their spouses (7%), when compared with the other groups (over 20% for themselves and their spouses), and far more received their health insurance through the main direct care employer (61% compared with 41% of Registry respondents and 3% for CDAC respondents). In almost 25% of the instances where public health respondents received health coverage through their employer, they reported their employer paid for all of it, compared with only 2% of the respondents from the Direct Care Registry. In terms of working conditions, they expressed less concern generally than the other two groups, particularly related to stress or mental health concerns, receiving requested or earned time off, and adequacy in the level of staffing. Since this is a group that largely is employed by county departments of health, direct care workers generally fall under the overall benefit systems those public systems offer, which usually include comprehensive health benefits with significant employer contributions. The longer tenure and older age of direct care workers also suggests the relative desirability of these direct care jobs. CDAC List. The CDAC respondents, while still predominantly female and white, had a greater proportion of males and respondents of color than the other groups. Total household income was also the lowest among this group, with a larger proportion of single adults. Job tenure was the shortest of the three groups, with a median tenure of around four years (compared with eight years for the Registry group and 12 years for the public health group). CDAC workers also were the most likely to primarily serve persons with disabilities, as opposed to older adults. CDAC respondents were least likely to work full-time and most likely to have additional jobs to support themselves. They were by far the least likely to be in positions where any benefits were offered. Only 9% of CDAC respondents indicated that their main employer offered health insurance, compared with 80% of public health respondents and 74% of Registry respondents. Likely as a consequence, they were most likely to have no health coverage for themselves (38%). When they did have coverage, they were far more likely to have it through Medicaid or Medicare (12% and 10%, respectively, compared with 3% and 3% for Registry respondents and 2% and 7% for public health respondents). Clearly, the CDAC respondents are those with the greatest overall economic need, because of low household incomes and lack of health benefits.
16
CNA Registry Group. In general, respondents from the registry group fell somewhere in between those for the public health and CDAC respondents, working for both for profit and not for profit hospitals, nursing homes, and assisted living facilities. They were most likely to be working full-time and therefore able to report they were paid for overtime. They also were most likely to be “very concerned” about not having enough staff to provide care (48%, compared to 14% of public health respondents and 11% of CDAC respondents), to experience stress or mental health issues on the job (31% compared to 16% of public health and 23% of CDAC respondents), and be concerned about injuries from lifting or transferring patients (35% compared to 23% of public health and 22% of CDAC respondents). Most respondents from the Registry Group were able to identify their employer as either a for profit or not for profit provider, and additional analysis was conducted to compare responses by these provider types. Respondents from nonprofit providers reported higher wages than from for profit providers ($11.80 median hour wage compared with $11.00), which was a larger variation than across the three groups. They also reported lower rates of uninsurance for themselves and their spouses (19% compared with 32% for themselves and 14% compared with 31% for their spouses). Overall, respondents from nonprofit providers were closer to public health respondents on insurance coverage and respondents from for profit providers were closer to CDAC respondents. Takeaway Messages. Direct care worker respondents from the three groups had very similar wages and earnings, with the biggest variation within the Registry Group versus nonprofit and for profit providers. There were much greater differences in both insurance coverage and views on working conditions. Respondents from the public health group were much more likely to receive health coverage through their employer, often at no cost to them, and had a lower rate of uninsurance (7%) than the Iowa working age population as a whole (12.4%). They also had fewer concerns about their working conditions. All other respondent groups had much higher rates of uninsurance, with percentages uninsured moving from respondents of nonprofit facilities (19%) to those from for profit facilities (32%) to the CDAC home care group (38%). For low wage workers like direct care staff, affordable health insurance coverage is a major employee need.
Part Three: Survey Groups and Total Respondents
DCW Demographics Direct Care
Registry
Public Health
Entities
CDAC List All Respondents
Total
No of Respondents 547 315 355 1217 Age 17-20 years 7% 1% 1% 3% 21-30 years 26% 9% 8% 17% 31-40 years 14% 9% 12% 12% 41-50 years 21% 27% 29% 25% 51-60 years 22% 35% 30% 28% Over 60 years 10% 19% 20% 15% Median Age 41-yrs 51-yrs 50-yrs 47-yrs No of respondents 546 315 353 1214 Gender Female 95% 99% 89% 94% Male 5% 1% 11% 6% No of respondents 540 324 354 1218 Race Hispanic/Latino 1% 2% 1% White 94% 95% 87% 92% Black/African American 3% 1% 6% 3% Asian 1% 3% 2% Multiracial 1% 1% 1% Other - 4% 1% 1% No of respondents 577 324 375 1276 Total Household Income Under 10,000 7% 1% 10% 6% $(10,000 to 14,999) 7% 6% 14% 9% $(15,000 to 19,999) 8% 8% 10% 9% $(20,000 to 24,999) 19% 16% 14% 17% $(25,000 to 29,999) 10% 11% 8% 10% $(30,000 to 39,999) 11% 13% 11% 11% $(40,000 to 49,999) 11% 17% 8% 12% $ 50,000 or more 17% 20% 12% 16% No answer 10% 8% 13% 10% Median Income $24,000 $36,154 $25,713 $25,000 No of respondents 542 317 348 1207 Children in the household Yes 32% 28% 27% 30% No 68% 72% 73% 70% Source: Iowa Direct Care Wage & Benefit Survey-2010
DCW Demographics Direct Care
Registry
Public Health
Entities
CDAC List All Respondents
Total
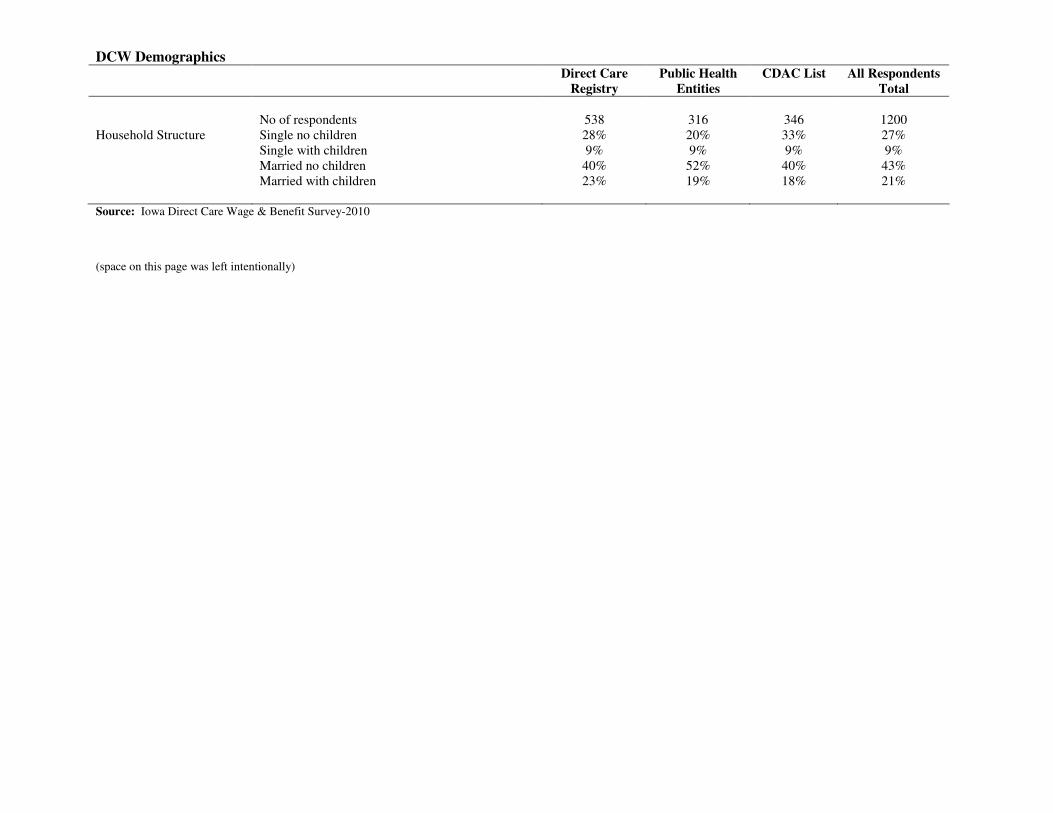
No of respondents 538 316 346 1200 Household Structure Single no children 28% 20% 33% 27% Single with children 9% 9% 9% 9% Married no children 40% 52% 40% 43% Married with children 23% 19% 18% 21% Source: Iowa Direct Care Wage & Benefit Survey-2010 (space on this page was left intentionally)
DCW Employment Characteristics Direct Care
Registry
Public Health
Entities
CDAC List All Respondents
Total
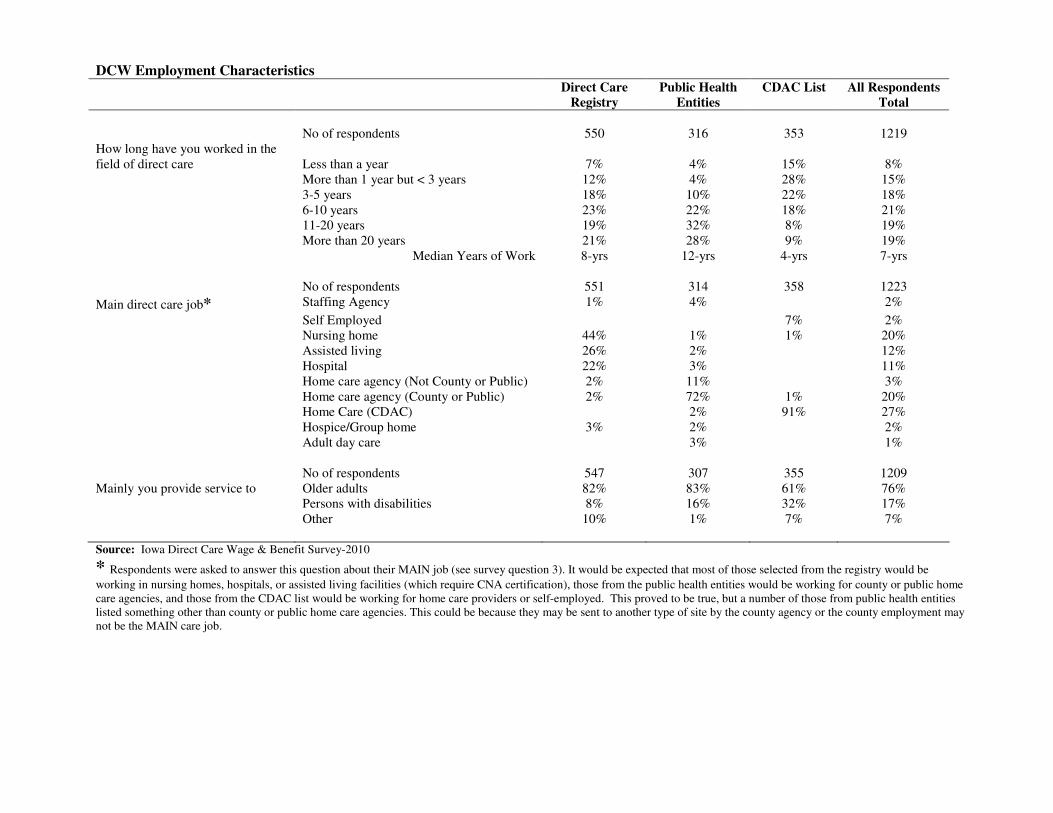
No of respondents 550 316 353 1219 How long have you worked in the field of direct care
Less than a year
7%
4%
15%
8%
More than 1 year but < 3 years 12% 4% 28% 15% 3-5 years 18% 10% 22% 18% 6-10 years 23% 22% 18% 21% 11-20 years 19% 32% 8% 19% More than 20 years 21% 28% 9% 19% Median Years of Work 8-yrs 12-yrs 4-yrs 7-yrs No of respondents 551 314 358 1223
Main direct care job* Staffing Agency 1% 4% 2%
Self Employed 7% 2% Nursing home 44% 1% 1% 20% Assisted living 26% 2% 12% Hospital 22% 3% 11% Home care agency (Not County or Public) 2% 11% 3% Home care agency (County or Public) 2% 72% 1% 20% Home Care (CDAC) 2% 91% 27% Hospice/Group home 3% 2% 2% Adult day care 3% 1% No of respondents 547 307 355 1209 Mainly you provide service to Older adults 82% 83% 61% 76% Persons with disabilities 8% 16% 32% 17% Other 10% 1% 7% 7% Source: Iowa Direct Care Wage & Benefit Survey-2010
* Respondents were asked to answer this question about their MAIN job (see survey question 3). It would be expected that most of those selected from the registry would be
working in nursing homes, hospitals, or assisted living facilities (which require CNA certification), those from the public health entities would be working for county or public home care agencies, and those from the CDAC list would be working for home care providers or self-employed. This proved to be true, but a number of those from public health entities listed something other than county or public home care agencies. This could be because they may be sent to another type of site by the county agency or the county employment may not be the MAIN care job.
DCW Employment Characteristics Direct Care
Registry
Public Health
Entities
CDAC List All Respondents
Total
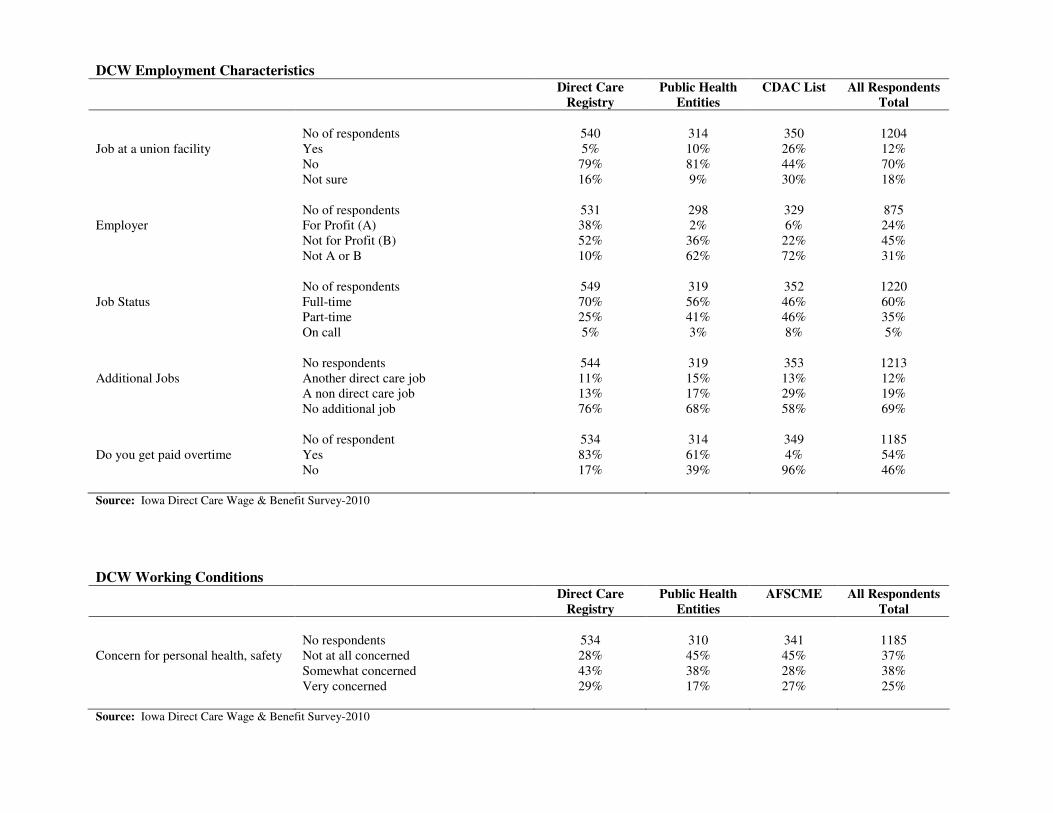
No of respondents 540 314 350 1204 Job at a union facility Yes 5% 10% 26% 12% No 79% 81% 44% 70% Not sure 16% 9% 30% 18% No of respondents 531 298 329 875 Employer For Profit (A) 38% 2% 6% 24% Not for Profit (B) 52% 36% 22% 45% Not A or B 10% 62% 72% 31% No of respondents 549 319 352 1220 Job Status Full-time 70% 56% 46% 60% Part-time 25% 41% 46% 35% On call 5% 3% 8% 5% No respondents 544 319 353 1213 Additional Jobs Another direct care job 11% 15% 13% 12% A non direct care job 13% 17% 29% 19% No additional job 76% 68% 58% 69% No of respondent 534 314 349 1185 Do you get paid overtime Yes 83% 61% 4% 54% No 17% 39% 96% 46% Source: Iowa Direct Care Wage & Benefit Survey-2010
DCW Working Conditions Direct Care
Registry
Public Health
Entities
AFSCME All Respondents
Total
No respondents 534 310 341 1185 Concern for personal health, safety Not at all concerned 28% 45% 45% 37% Somewhat concerned 43% 38% 28% 38% Very concerned 29% 17% 27% 25% Source: Iowa Direct Care Wage & Benefit Survey-2010
DCW Working Conditions Direct Care
Registry
Public Health
Entities
CDAC List All Respondents
Total
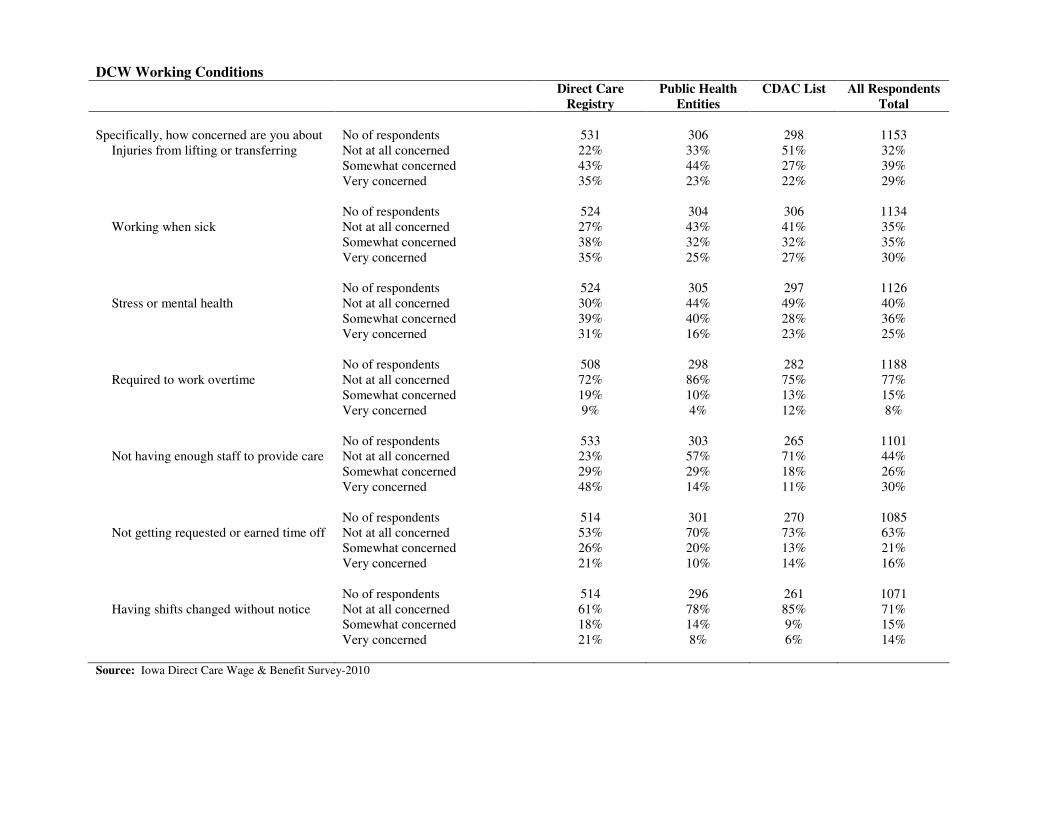
Specifically, how concerned are you about No of respondents 531 306 298 1153
Injuries from lifting or transferring Not at all concerned 22% 33% 51% 32% Somewhat concerned 43% 44% 27% 39% Very concerned 35% 23% 22% 29% No of respondents 524 304 306 1134 Working when sick Not at all concerned 27% 43% 41% 35% Somewhat concerned 38% 32% 32% 35% Very concerned 35% 25% 27% 30% No of respondents 524 305 297 1126 Stress or mental health Not at all concerned 30% 44% 49% 40% Somewhat concerned 39% 40% 28% 36% Very concerned 31% 16% 23% 25% No of respondents 508 298 282 1188 Required to work overtime Not at all concerned 72% 86% 75% 77% Somewhat concerned 19% 10% 13% 15% Very concerned 9% 4% 12% 8% No of respondents 533 303 265 1101 Not having enough staff to provide care Not at all concerned 23% 57% 71% 44% Somewhat concerned 29% 29% 18% 26% Very concerned 48% 14% 11% 30% No of respondents 514 301 270 1085 Not getting requested or earned time off Not at all concerned 53% 70% 73% 63% Somewhat concerned 26% 20% 13% 21% Very concerned 21% 10% 14% 16% No of respondents 514 296 261 1071 Having shifts changed without notice Not at all concerned 61% 78% 85% 71%
Somewhat concerned 18% 14% 9% 15% Very concerned 21% 8% 6% 14% Source: Iowa Direct Care Wage & Benefit Survey-2010
DCW Wages and Benefits Direct Care
Registry
Public Health
Entities
CDAC List All Respondents
Total
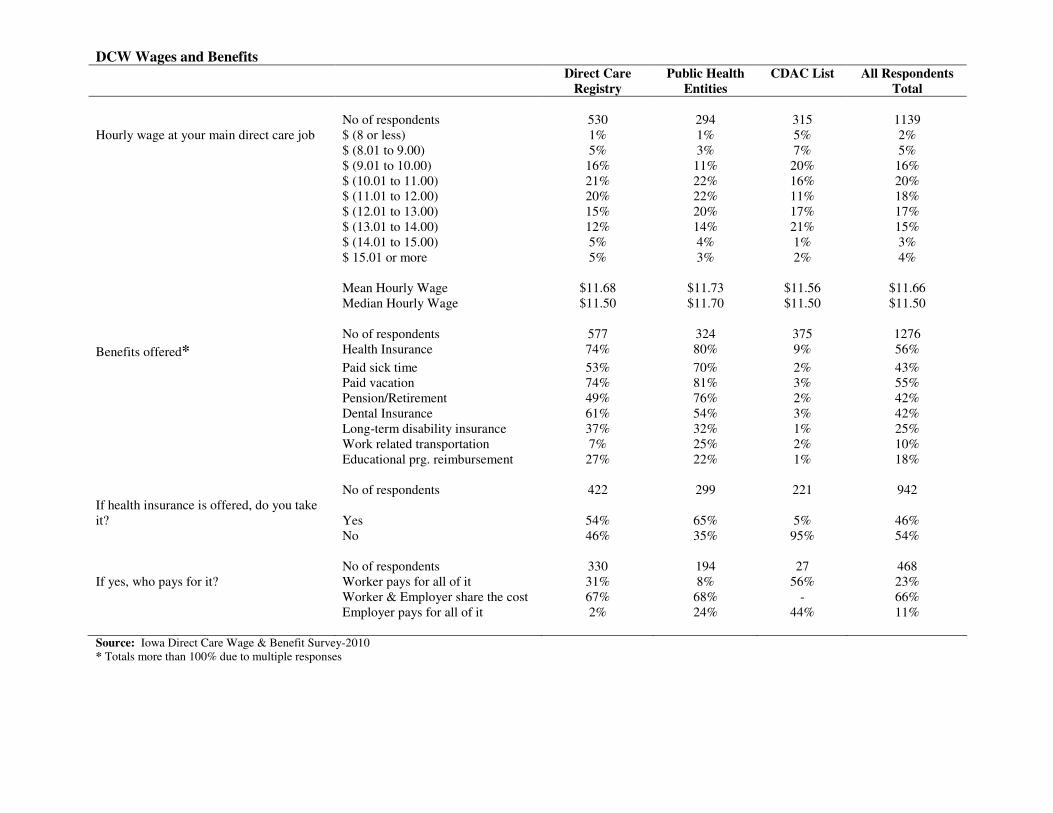
No of respondents 530 294 315 1139 Hourly wage at your main direct care job $ (8 or less) 1% 1% 5% 2% $ (8.01 to 9.00) 5% 3% 7% 5% $ (9.01 to 10.00) 16% 11% 20% 16% $ (10.01 to 11.00) 21% 22% 16% 20% $ (11.01 to 12.00) 20% 22% 11% 18% $ (12.01 to 13.00) 15% 20% 17% 17% $ (13.01 to 14.00) 12% 14% 21% 15% $ (14.01 to 15.00) 5% 4% 1% 3% $ 15.01 or more 5% 3% 2% 4% Mean Hourly Wage $11.68 $11.73 $11.56 $11.66 Median Hourly Wage $11.50 $11.70 $11.50 $11.50 No of respondents 577 324 375 1276
Benefits offered* Health Insurance 74% 80% 9% 56%
Paid sick time 53% 70% 2% 43% Paid vacation 74% 81% 3% 55% Pension/Retirement 49% 76% 2% 42% Dental Insurance 61% 54% 3% 42% Long-term disability insurance 37% 32% 1% 25% Work related transportation 7% 25% 2% 10% Educational prg. reimbursement 27% 22% 1% 18% No of respondents 422 299 221 942 If health insurance is offered, do you take it?
Yes
54%
65%
5%
46%
No 46% 35% 95% 54% No of respondents 330 194 27 468 If yes, who pays for it? Worker pays for all of it 31% 8% 56% 23% Worker & Employer share the cost 67% 68% - 66% Employer pays for all of it 2% 24% 44% 11% Source: Iowa Direct Care Wage & Benefit Survey-2010 * Totals more than 100% due to multiple responses
DCW Employer Benefits Direct Care
Registry
Public Health
Entities
CDAC
List
All Respondents
Total
If have insurance
from Main direct
care employer
How satisfied are you with:
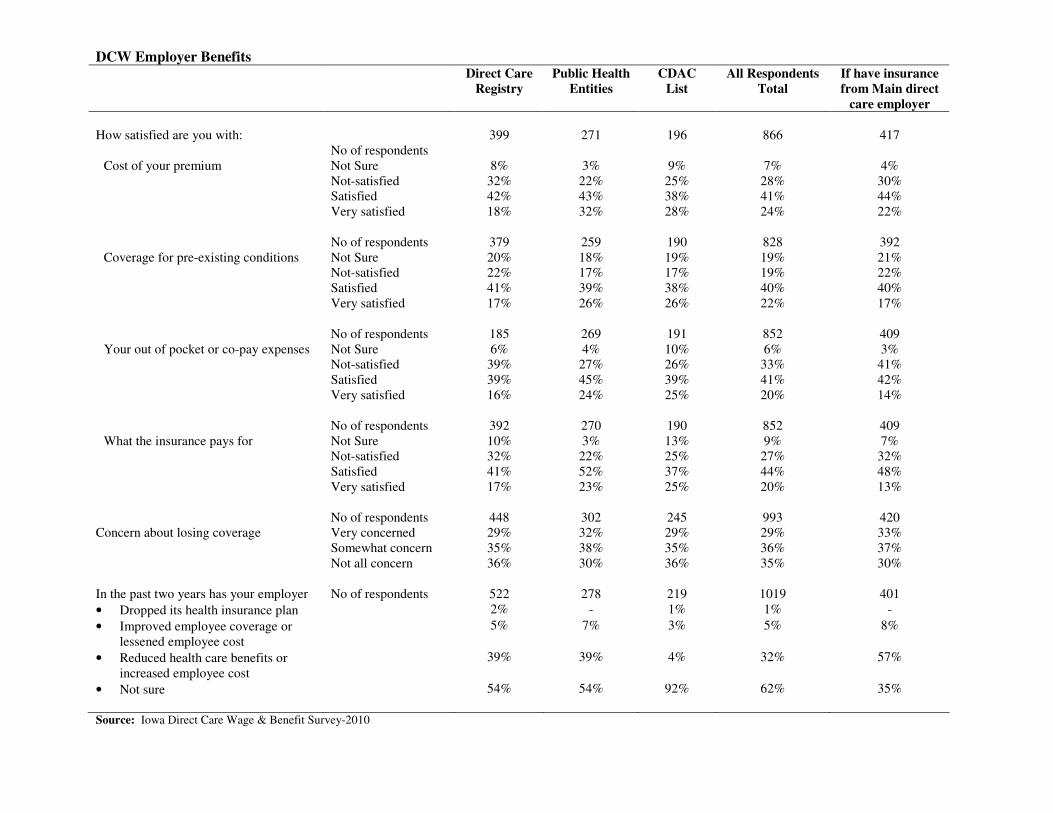
No of respondents 399 271 196 866 417
Cost of your premium Not Sure 8% 3% 9% 7% 4% Not-satisfied 32% 22% 25% 28% 30% Satisfied 42% 43% 38% 41% 44% Very satisfied 18% 32% 28% 24% 22% No of respondents 379 259 190 828 392 Coverage for pre-existing conditions Not Sure 20% 18% 19% 19% 21% Not-satisfied 22% 17% 17% 19% 22% Satisfied 41% 39% 38% 40% 40% Very satisfied 17% 26% 26% 22% 17% No of respondents 185 269 191 852 409 Your out of pocket or co-pay expenses Not Sure 6% 4% 10% 6% 3% Not-satisfied 39% 27% 26% 33% 41% Satisfied 39% 45% 39% 41% 42% Very satisfied 16% 24% 25% 20% 14% No of respondents 392 270 190 852 409 What the insurance pays for Not Sure 10% 3% 13% 9% 7%
Not-satisfied 32% 22% 25% 27% 32% Satisfied 41% 52% 37% 44% 48% Very satisfied 17% 23% 25% 20% 13% No of respondents 448 302 245 993 420 Concern about losing coverage Very concerned 29% 32% 29% 29% 33% Somewhat concern 35% 38% 35% 36% 37% Not all concern 36% 30% 36% 35% 30% In the past two years has your employer No of respondents 522 278 219 1019 401
• Dropped its health insurance plan 2% - 1% 1% -
• Improved employee coverage or lessened employee cost
5% 7% 3% 5% 8%
• Reduced health care benefits or increased employee cost
39% 39% 4% 32% 57%
• Not sure 54% 54% 92% 62% 35%
Source: Iowa Direct Care Wage & Benefit Survey-2010

DCW Health Coverage All Sources Direct Care
Registry
Public Health
Entities
CDAC List All Respondents
Total
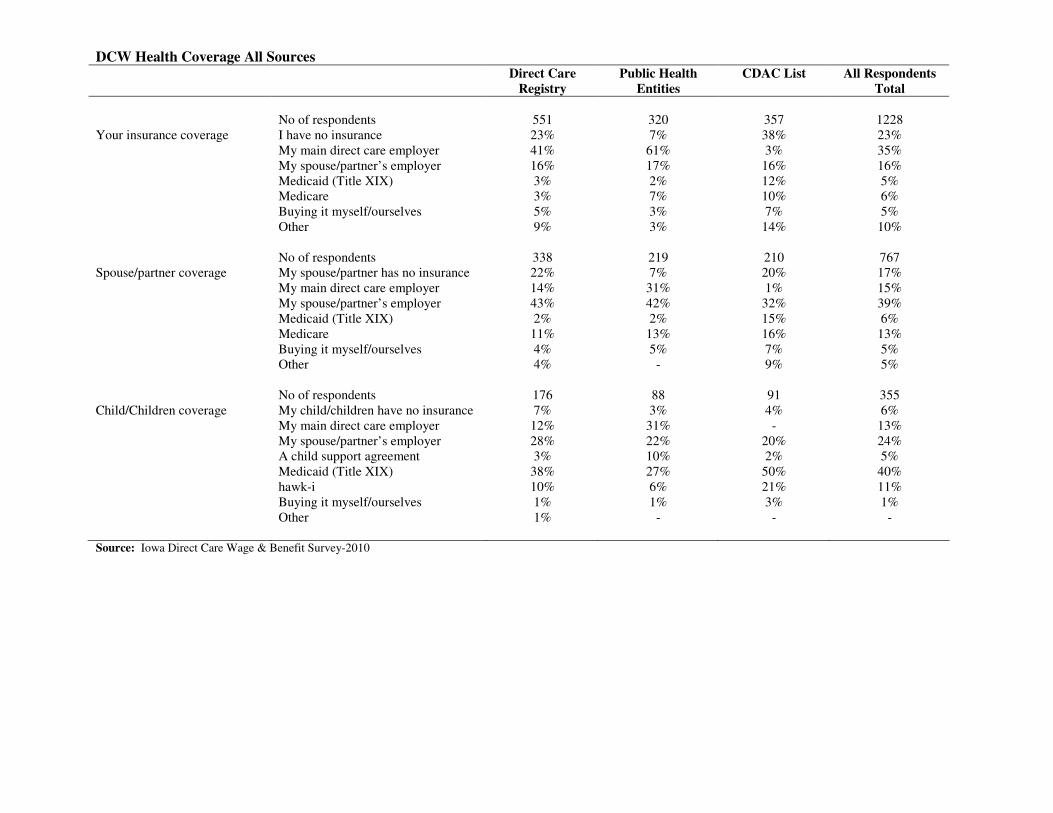
No of respondents 551 320 357 1228 Your insurance coverage I have no insurance 23% 7% 38% 23% My main direct care employer 41% 61% 3% 35% My spouse/partner’s employer 16% 17% 16% 16% Medicaid (Title XIX) 3% 2% 12% 5% Medicare 3% 7% 10% 6% Buying it myself/ourselves 5% 3% 7% 5% Other 9% 3% 14% 10% No of respondents 338 219 210 767 Spouse/partner coverage My spouse/partner has no insurance 22% 7% 20% 17% My main direct care employer 14% 31% 1% 15% My spouse/partner’s employer 43% 42% 32% 39% Medicaid (Title XIX) 2% 2% 15% 6% Medicare 11% 13% 16% 13% Buying it myself/ourselves 4% 5% 7% 5% Other 4% - 9% 5% No of respondents 176 88 91 355 Child/Children coverage My child/children have no insurance 7% 3% 4% 6% My main direct care employer 12% 31% - 13% My spouse/partner’s employer 28% 22% 20% 24% A child support agreement 3% 10% 2% 5% Medicaid (Title XIX) 38% 27% 50% 40% hawk-i 10% 6% 21% 11% Buying it myself/ourselves 1% 1% 3% 1% Other 1% - - - Source: Iowa Direct Care Wage & Benefit Survey-2010
Part Three: Direct Care Registry Respondents, by Employer Not for Profit or for Profit Status
Direct Care Registry Respondents Wages and Benefits – Direct Care Workers By Employer Not for Profit
Employer
For Profit
Employer
All Respondents
Total
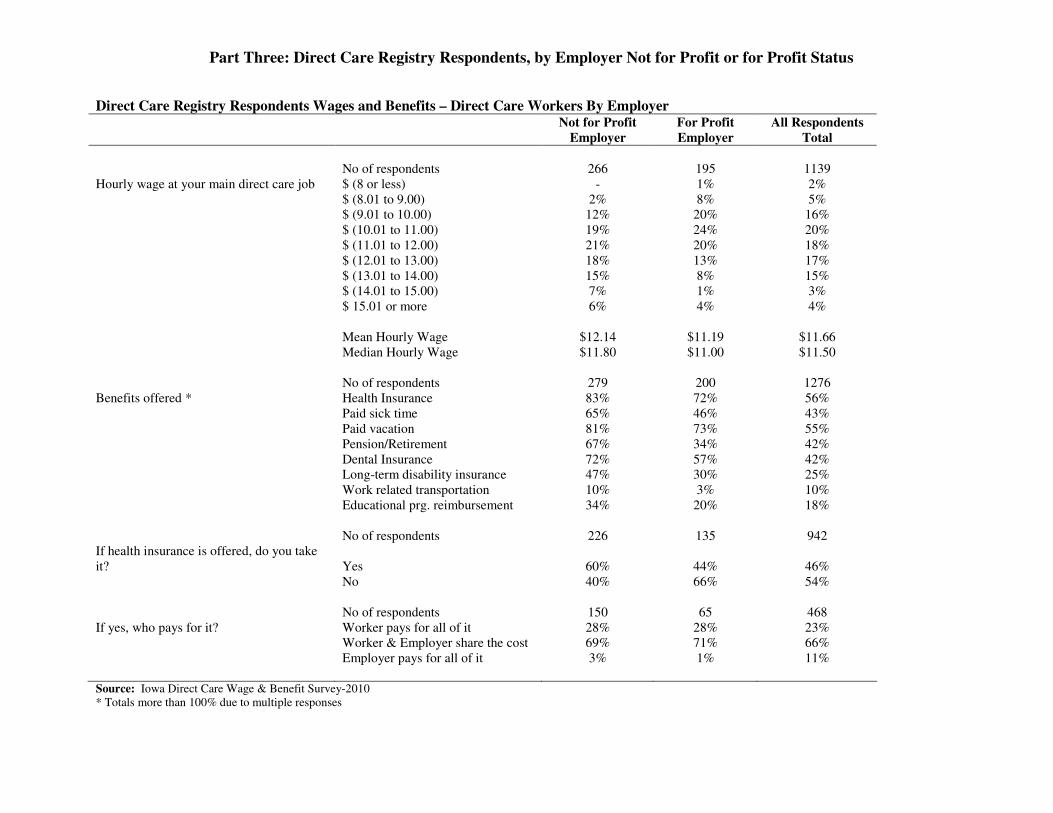
No of respondents 266 195 1139 Hourly wage at your main direct care job $ (8 or less) - 1% 2% $ (8.01 to 9.00) 2% 8% 5% $ (9.01 to 10.00) 12% 20% 16% $ (10.01 to 11.00) 19% 24% 20% $ (11.01 to 12.00) 21% 20% 18% $ (12.01 to 13.00) 18% 13% 17% $ (13.01 to 14.00) 15% 8% 15% $ (14.01 to 15.00) 7% 1% 3% $ 15.01 or more 6% 4% 4% Mean Hourly Wage $12.14 $11.19 $11.66 Median Hourly Wage $11.80 $11.00 $11.50 No of respondents 279 200 1276 Benefits offered * Health Insurance 83% 72% 56% Paid sick time 65% 46% 43% Paid vacation 81% 73% 55% Pension/Retirement 67% 34% 42% Dental Insurance 72% 57% 42% Long-term disability insurance 47% 30% 25% Work related transportation 10% 3% 10% Educational prg. reimbursement 34% 20% 18% No of respondents 226 135 942 If health insurance is offered, do you take it?
Yes
60%
44%
46%
No 40% 66% 54% No of respondents 150 65 468 If yes, who pays for it? Worker pays for all of it 28% 28% 23% Worker & Employer share the cost 69% 71% 66% Employer pays for all of it 3% 1% 11% Source: Iowa Direct Care Wage & Benefit Survey-2010 * Totals more than 100% due to multiple responses
Direct Care Registry Respondents Employer-benefits – Direct Care Workers By Employer Not for
Profit
Employer
For Profit
Employer
If have
insurance from
Main employer
Not for Profit
If have
insurance from
Main employer
For Profit
All
Respondents
Total
If have
insurance
from Main
employer
How satisfied are you with No of respondents 221 126 135 57 866 417
Cost of your premium Not Sure 8% 10% 7% 7% 4% Not-satisfied 35% 29% 38% 46% 28% 30% Satisfied 42% 39% 45% 40% 41% 44% Very satisfied 15% 22% 10% 14% 24% 22% No of respondents 208 122 126 55 828 392 Coverage for pre-existing conditions Not Sure 20% 18% 22% 16% 19% 21% Not-satisfied 24% 24% 27% 35% 19% 22% Satisfied 41% 36% 40% 38% 40% 40% Very satisfied 15% 22% 11% 11% 22% 17% No of respondents 216 125 132 56 852 409 Your out of pocket or co-pay expenses Not Sure 6% 9% 5% 2% 6% 3% Not-satisfied 43% 33% 49% 50% 33% 41% Satisfied 39% 37% 39% 39% 41% 42% Very satisfied 12% 21% 6% 9% 20% 14% No of respondents 217 125 132 55% 852 409 What the insurance pays for Not Sure 9% 13% 9% 11% 9% 7%
Not-satisfied 33% 30% 37% 47% 27% 32% Satisfied 44% 34% 47% 33% 44% 48% Very satisfied 14% 23% 7% 9% 20% 13% No of respondents 242 143 135 55% 993 420 Concern about losing coverage Very concerned 29% 28% 33% 31% 29% 33% Somewhat concern 35% 36% 29% 44% 36% 37% Not all concern 36% 36% 38% 25% 35% 30% In the past two years has your employer No of respondents 269 187 134 57 1019 401
• Dropped its health insurance plan 2% 2% 1% -
• Improved employee coverage or lessened employee cost
4%
4%
8%
5%
5%
8%
• Reduced health care benefits or increased employee cost
42%
37%
58%
67%
32%
57%
• Not sure 52% 57% 34% 28% 62% 35%
Source: Iowa Direct Care Wage & Benefit Survey-2010
Direct Care Registry Respondents Health Coverage All Sources – Direct Care Workers By Employer Not for Profit
Employer
For Profit
Employer
All Respondents
Total
No of respondents 279 200 1228 Your insurance coverage I have no insurance 19% 32% 23% My main direct care employer 49% 30% 35% My spouse/partner’s employer 14% 16% 16% Medicaid (Title XIX) 1% 4% 5% Medicare 2% 3% 6% Buying it myself/ourselves 6% 4% 5% Other 9% 11% 10% No of respondents 173 119 767 Spouse/partner coverage My spouse/partner has no insurance 14% 31% 17% My main direct care employer 21% 4% 15% My spouse/partner’s employer 46% 42% 39% Medicaid (Title XIX) 1% 3% 6% Medicare 9% 13% 13% Buying it myself/ourselves 4% 2% 5% Other 5% 5% 5% No of respondents 83 69 355 Child/Children coverage My child/children have no insurance 6% 9% 6% My main direct care employer 20% 3% 13% My spouse/partner’s employer 33% 23% 24% A child support agreement 4% 3% 5% Medicaid (Title XIX) 25% 51% 40% hawk-i 10% 10% 11% Buying it myself/ourselves 1% - 1% Other 1% 1% - Source: Iowa Direct Care Wage & Benefit Survey-2010
28
Part Four: Direct Care Workers, Family Structure,
Health Benefits, and Economic Well-Being
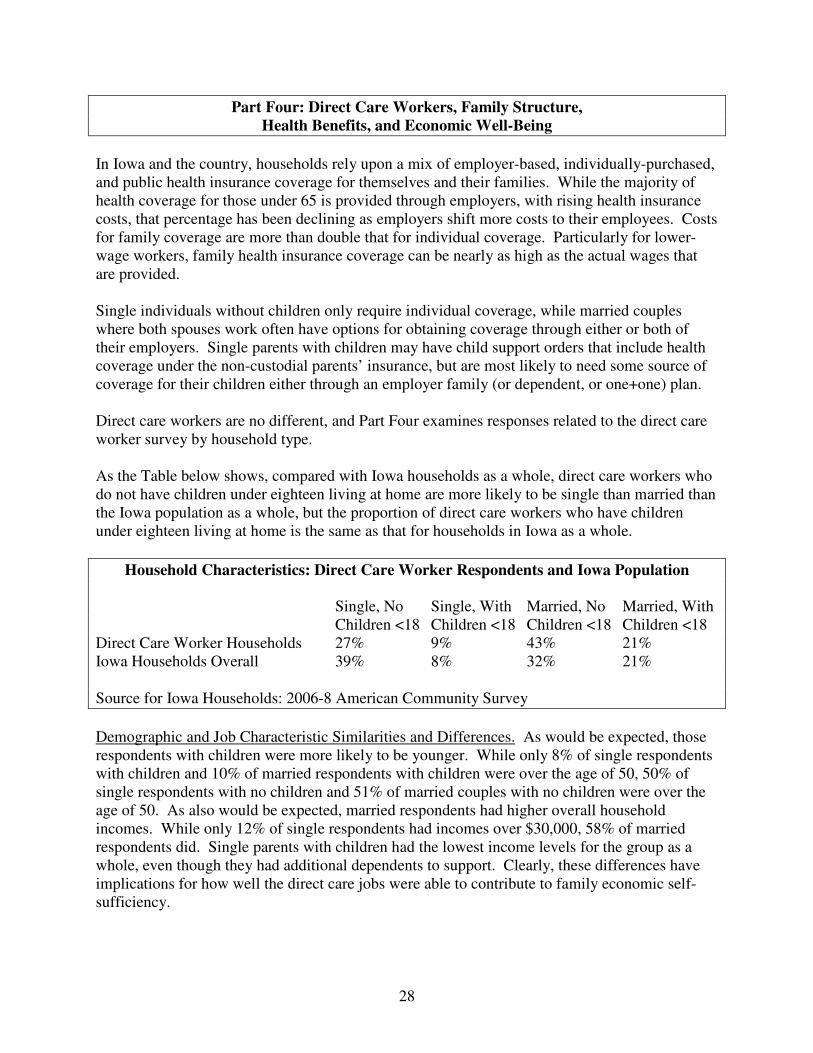
In Iowa and the country, households rely upon a mix of employer-based, individually-purchased, and public health insurance coverage for themselves and their families. While the majority of health coverage for those under 65 is provided through employers, with rising health insurance costs, that percentage has been declining as employers shift more costs to their employees. Costs for family coverage are more than double that for individual coverage. Particularly for lower-wage workers, family health insurance coverage can be nearly as high as the actual wages that are provided. Single individuals without children only require individual coverage, while married couples where both spouses work often have options for obtaining coverage through either or both of their employers. Single parents with children may have child support orders that include health coverage under the non-custodial parents’ insurance, but are most likely to need some source of coverage for their children either through an employer family (or dependent, or one+one) plan. Direct care workers are no different, and Part Four examines responses related to the direct care worker survey by household type. As the Table below shows, compared with Iowa households as a whole, direct care workers who do not have children under eighteen living at home are more likely to be single than married than the Iowa population as a whole, but the proportion of direct care workers who have children under eighteen living at home is the same as that for households in Iowa as a whole.
Household Characteristics: Direct Care Worker Respondents and Iowa Population Single, No Single, With Married, No Married, With Children <18 Children <18 Children <18 Children <18 Direct Care Worker Households 27% 9% 43% 21% Iowa Households Overall 39% 8% 32% 21% Source for Iowa Households: 2006-8 American Community Survey
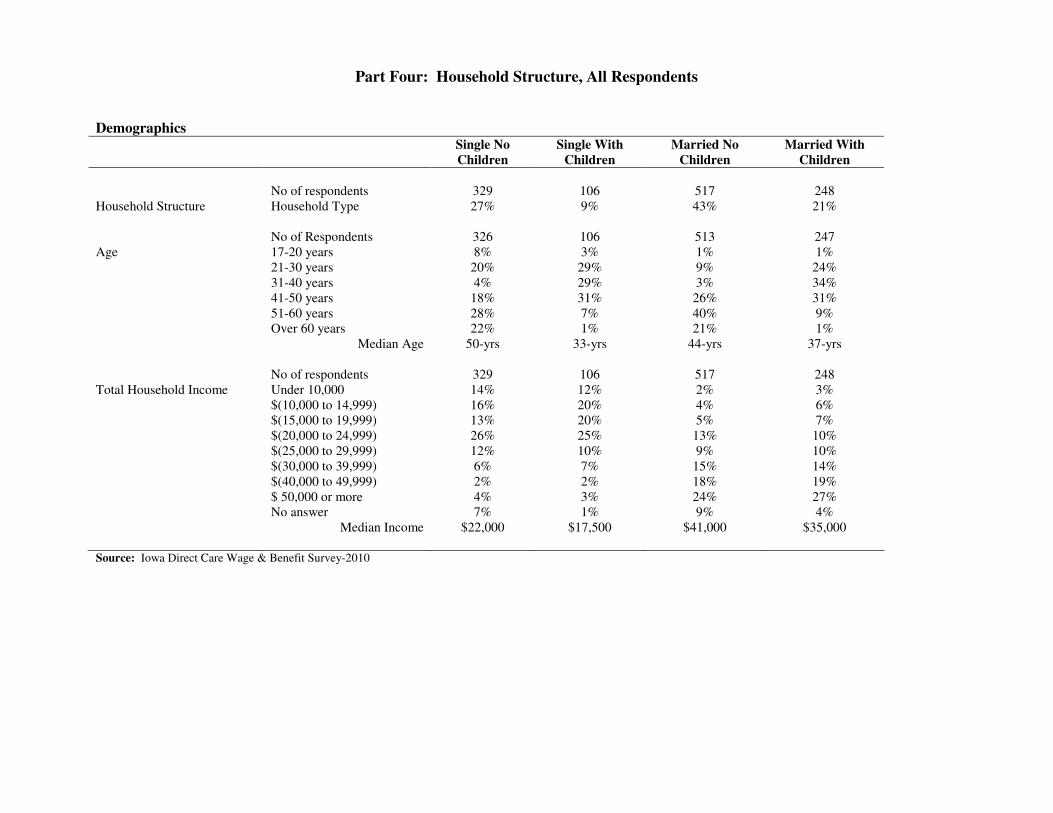
Demographic and Job Characteristic Similarities and Differences. As would be expected, those respondents with children were more likely to be younger. While only 8% of single respondents with children and 10% of married respondents with children were over the age of 50, 50% of single respondents with no children and 51% of married couples with no children were over the age of 50. As also would be expected, married respondents had higher overall household incomes. While only 12% of single respondents had incomes over $30,000, 58% of married respondents did. Single parents with children had the lowest income levels for the group as a whole, even though they had additional dependents to support. Clearly, these differences have implications for how well the direct care jobs were able to contribute to family economic self-sufficiency.
29
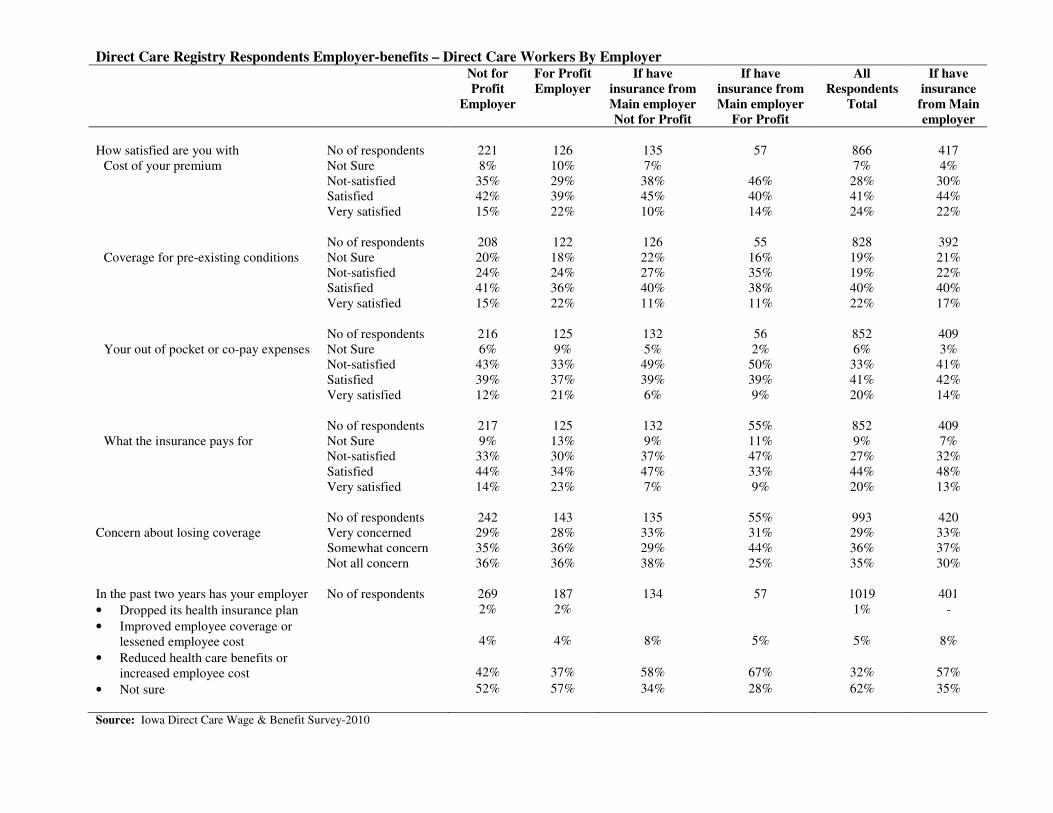
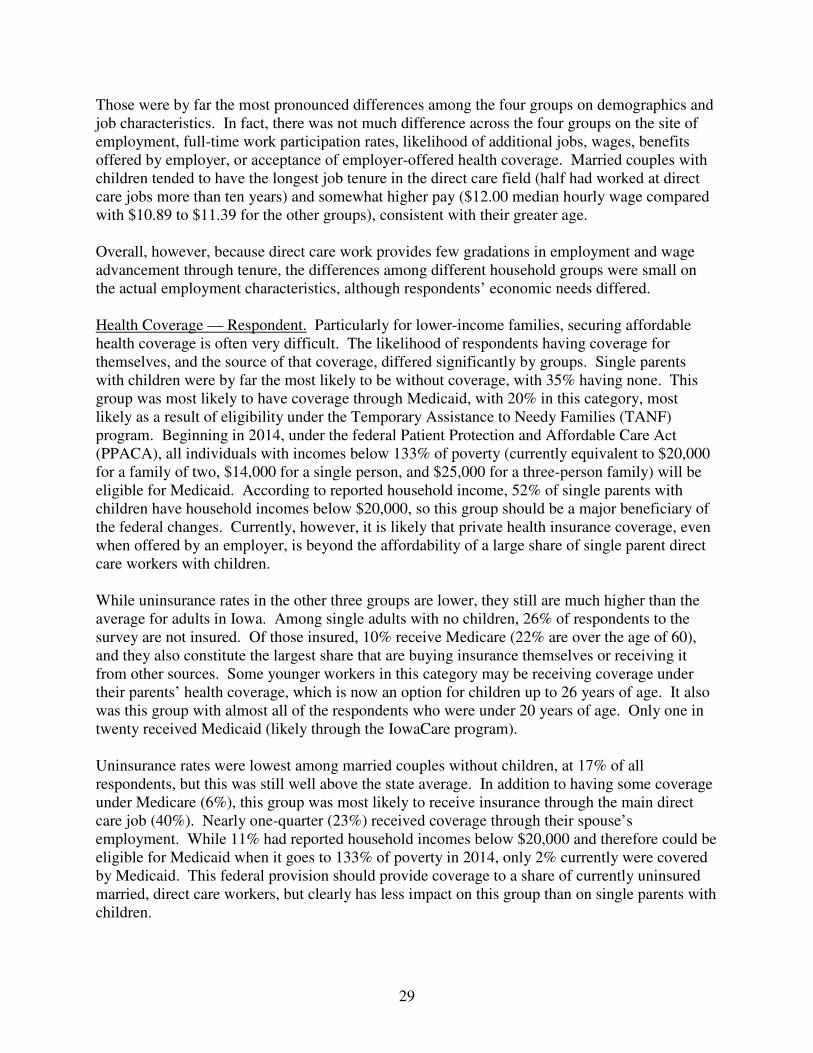
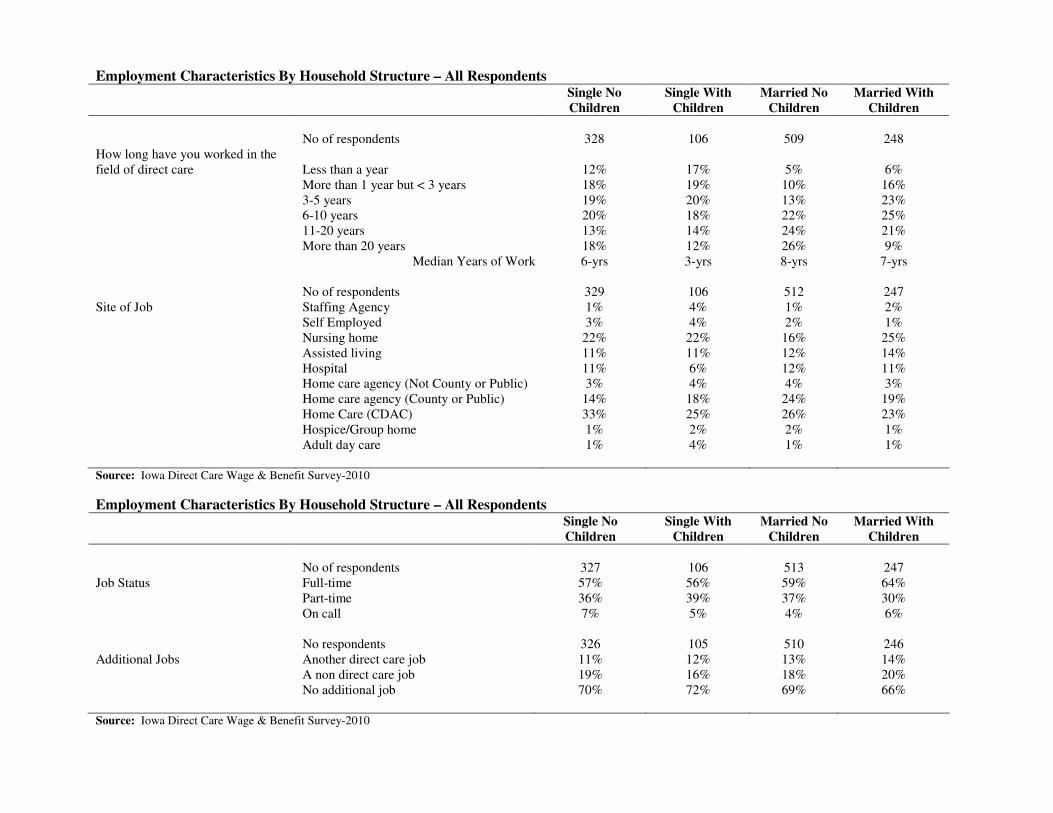
Those were by far the most pronounced differences among the four groups on demographics and job characteristics. In fact, there was not much difference across the four groups on the site of employment, full-time work participation rates, likelihood of additional jobs, wages, benefits offered by employer, or acceptance of employer-offered health coverage. Married couples with children tended to have the longest job tenure in the direct care field (half had worked at direct care jobs more than ten years) and somewhat higher pay ($12.00 median hourly wage compared with $10.89 to $11.39 for the other groups), consistent with their greater age. Overall, however, because direct care work provides few gradations in employment and wage advancement through tenure, the differences among different household groups were small on the actual employment characteristics, although respondents’ economic needs differed. Health Coverage — Respondent. Particularly for lower-income families, securing affordable health coverage is often very difficult. The likelihood of respondents having coverage for themselves, and the source of that coverage, differed significantly by groups. Single parents with children were by far the most likely to be without coverage, with 35% having none. This group was most likely to have coverage through Medicaid, with 20% in this category, most likely as a result of eligibility under the Temporary Assistance to Needy Families (TANF) program. Beginning in 2014, under the federal Patient Protection and Affordable Care Act (PPACA), all individuals with incomes below 133% of poverty (currently equivalent to $20,000 for a family of two, $14,000 for a single person, and $25,000 for a three-person family) will be eligible for Medicaid. According to reported household income, 52% of single parents with children have household incomes below $20,000, so this group should be a major beneficiary of the federal changes. Currently, however, it is likely that private health insurance coverage, even when offered by an employer, is beyond the affordability of a large share of single parent direct care workers with children. While uninsurance rates in the other three groups are lower, they still are much higher than the average for adults in Iowa. Among single adults with no children, 26% of respondents to the survey are not insured. Of those insured, 10% receive Medicare (22% are over the age of 60), and they also constitute the largest share that are buying insurance themselves or receiving it from other sources. Some younger workers in this category may be receiving coverage under their parents’ health coverage, which is now an option for children up to 26 years of age. It also was this group with almost all of the respondents who were under 20 years of age. Only one in twenty received Medicaid (likely through the IowaCare program). Uninsurance rates were lowest among married couples without children, at 17% of all respondents, but this was still well above the state average. In addition to having some coverage under Medicare (6%), this group was most likely to receive insurance through the main direct care job (40%). Nearly one-quarter (23%) received coverage through their spouse’s employment. While 11% had reported household incomes below $20,000 and therefore could be eligible for Medicaid when it goes to 133% of poverty in 2014, only 2% currently were covered by Medicaid. This federal provision should provide coverage to a share of currently uninsured married, direct care workers, but clearly has less impact on this group than on single parents with children.
30
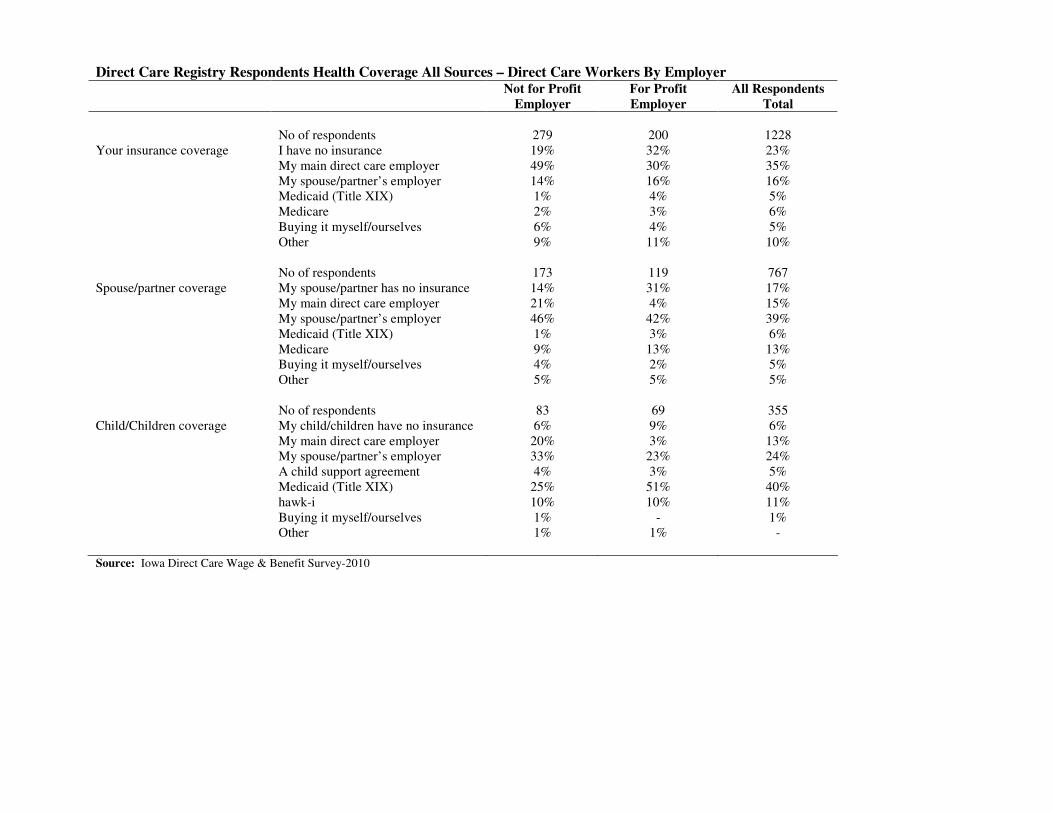
One in four married couples with children indicated they had no health insurance for themselves, substantially higher than for married couples with no children. As indicated earlier, they also tended to be younger, to have slightly lower wages from the direct care job, and to have more expenses (related to raising their children). Of these respondents, 8% listed Medicaid as their personal coverage, again likely through participation in TANF. Since there are at least three people in these households, the 133% threshold for Medicaid eligibility in 2014 corresponds to $25,000 household income today, with 26% of married couples with children reporting income at or below that level. They also are likely to benefit from the federal expansion of Medicaid in 2014. Across the four household groups, a minority of respondents were covered by their direct care employer’s coverage, although over 60% of Iowa adults are covered through employer-sponsored coverage in Iowa. Again, this likely is the result of the lower wages and household income that direct care workers experience, and therefore affordability of coverage is as much of a problem as is insurance being offered by direct care employers at all. Health coverage – spouse/partner. Both parents work in most married couple families, and those families often have the option to choose health coverage under either of the spouses’ employers. For both married couples with and without children, spouses’ were slightly less likely to be uninsured than the respondent and more likely to be covered by Medicare, particularly for those without children. While both occurred, it was more likely that the respondent was enrolled in the spouse’s health insurance coverage than the reverse. This would suggest that the direct care job was more likely to represent supplementary employment and income (with less generous benefits) than the main employment and income for families where both spouses worked. Again, however, the rate of uninsurance for spouses (18% overall) was well above the state average. Health coverage – children. The effect of public health coverage on insurance is by far the most pronounced for children. Single parents with children reported that 72% of their children were covered by Medicaid or hawk-i, nine times the rate of coverage under the direct care employer’s coverage. That percentage was 41% for married couples with children, still above the statewide average of 35% of all children covered by Medicaid or hawk-i. If children in married couple families were covered by employer health insurance, it was much more likely to be the spouse’s coverage (31% compared with 16%) than the direct care worker’s coverage, again suggesting that the spouse’s employment provided better health insurance coverage options. Compared with adults, the insurance rates were much higher for children, with respondents reporting that 95% of all children are covered. The high rate of coverage under Medicaid and hawk-i also suggests that these programs are well known by direct care workers and accessed for the care of their children, even when they cannot afford coverage for themselves. Takeaway messages. Low pay and household income make health care coverage, even when offered by employers, outside the affordability reach of a large share of direct care workers. Family circumstances play a significant role in affordability, with more than one in three single parents with children uninsured, but the rates of uninsurance are high for direct care workers, regardless of family structure. Current public programs (Medicaid and Medicare) provide limited coverage protection for some groups (the lowest income families with children and
31
individuals who are above 65), or these uninsurance rates would be even higher. The federal increase in Medicaid benefits to adults up to 133% of poverty should lower the uninsurance rate significantly among direct care workers, but it will not eliminate it. While a small percentage (5%) of children in direct care worker households is uninsured, public health insurance has played a very major role in providing children with coverage, even when parents cannot afford to provide coverage themselves. Over half of all children in direct care worker households have health insurance coverage either through Medicaid or hawk-i. Direct care workers make use of these public health insurance opportunities for their children, even when they cannot access them for themselves. State and federal policies over the last three years to expand coverage and streamline eligibility have resulted in an increase in children covered under Medicaid and hawk-i from 26% to 35% of all Iowa children. This expansion has greatly benefited direct care worker households with children.
Part Four: Household Structure, All Respondents
Demographics Single No
Children
Single With
Children
Married No
Children
Married With
Children
No of respondents 329 106 517 248 Household Structure Household Type 27% 9% 43% 21% No of Respondents 326 106 513 247 Age 17-20 years 8% 3% 1% 1% 21-30 years 20% 29% 9% 24% 31-40 years 4% 29% 3% 34% 41-50 years 18% 31% 26% 31% 51-60 years 28% 7% 40% 9% Over 60 years 22% 1% 21% 1% Median Age 50-yrs 33-yrs 44-yrs 37-yrs No of respondents 329 106 517 248 Total Household Income Under 10,000 14% 12% 2% 3% $(10,000 to 14,999) 16% 20% 4% 6% $(15,000 to 19,999) 13% 20% 5% 7% $(20,000 to 24,999) 26% 25% 13% 10% $(25,000 to 29,999) 12% 10% 9% 10% $(30,000 to 39,999) 6% 7% 15% 14% $(40,000 to 49,999) 2% 2% 18% 19% $ 50,000 or more 4% 3% 24% 27% No answer 7% 1% 9% 4% Median Income $22,000 $17,500 $41,000 $35,000 Source: Iowa Direct Care Wage & Benefit Survey-2010
Employment Characteristics By Household Structure – All Respondents Single No
Children
Single With
Children
Married No
Children
Married With
Children
No of respondents 328 106 509 248 How long have you worked in the field of direct care
Less than a year
12%
17%
5%
6%
More than 1 year but < 3 years 18% 19% 10% 16% 3-5 years 19% 20% 13% 23% 6-10 years 20% 18% 22% 25% 11-20 years 13% 14% 24% 21% More than 20 years 18% 12% 26% 9% Median Years of Work 6-yrs 3-yrs 8-yrs 7-yrs No of respondents 329 106 512 247 Site of Job Staffing Agency 1% 4% 1% 2% Self Employed 3% 4% 2% 1% Nursing home 22% 22% 16% 25% Assisted living 11% 11% 12% 14% Hospital 11% 6% 12% 11% Home care agency (Not County or Public) 3% 4% 4% 3% Home care agency (County or Public) 14% 18% 24% 19% Home Care (CDAC) 33% 25% 26% 23% Hospice/Group home 1% 2% 2% 1% Adult day care 1% 4% 1% 1% Source: Iowa Direct Care Wage & Benefit Survey-2010
Employment Characteristics By Household Structure – All Respondents Single No
Children
Single With
Children
Married No
Children
Married With
Children
No of respondents 327 106 513 247 Job Status Full-time 57% 56% 59% 64% Part-time 36% 39% 37% 30% On call 7% 5% 4% 6% No respondents 326 105 510 246 Additional Jobs Another direct care job 11% 12% 13% 14% A non direct care job 19% 16% 18% 20% No additional job 70% 72% 69% 66% Source: Iowa Direct Care Wage & Benefit Survey-2010
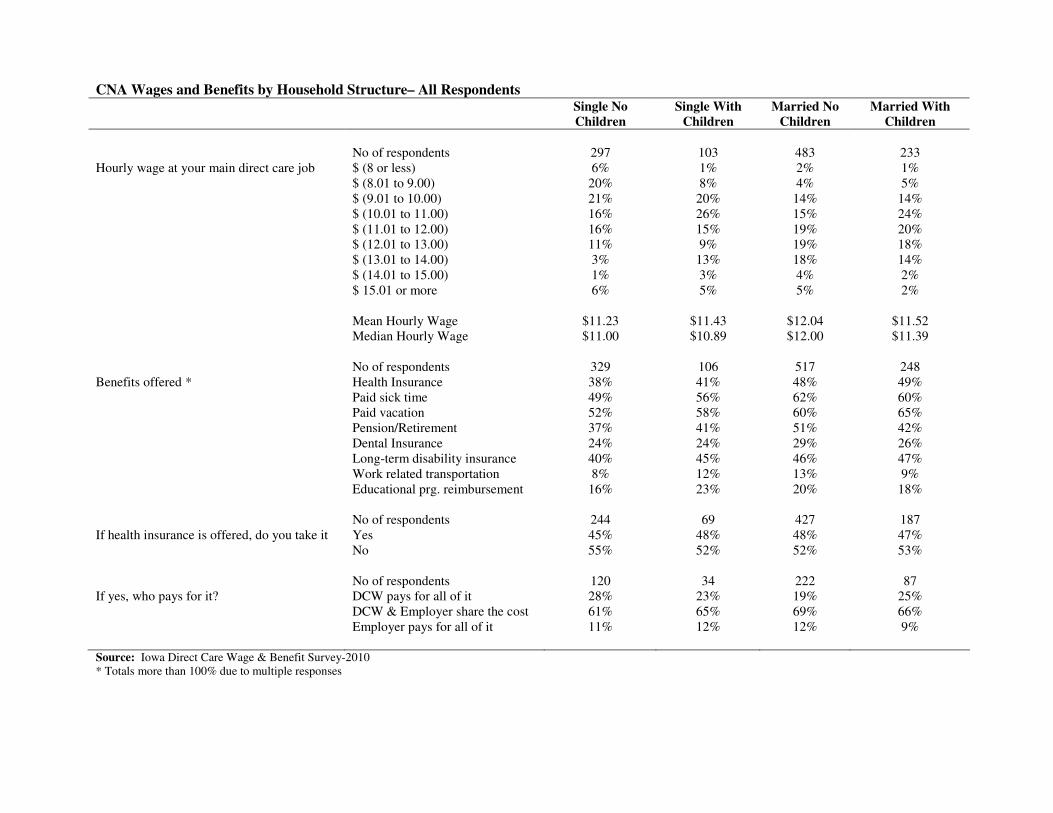
CNA Wages and Benefits by Household Structure– All Respondents Single No
Children
Single With
Children
Married No
Children
Married With
Children
No of respondents 297 103 483 233 Hourly wage at your main direct care job $ (8 or less) 6% 1% 2% 1% $ (8.01 to 9.00) 20% 8% 4% 5% $ (9.01 to 10.00) 21% 20% 14% 14% $ (10.01 to 11.00) 16% 26% 15% 24% $ (11.01 to 12.00) 16% 15% 19% 20% $ (12.01 to 13.00) 11% 9% 19% 18% $ (13.01 to 14.00) 3% 13% 18% 14% $ (14.01 to 15.00) 1% 3% 4% 2% $ 15.01 or more 6% 5% 5% 2% Mean Hourly Wage $11.23 $11.43 $12.04 $11.52 Median Hourly Wage $11.00 $10.89 $12.00 $11.39 No of respondents 329 106 517 248 Benefits offered * Health Insurance 38% 41% 48% 49% Paid sick time 49% 56% 62% 60% Paid vacation 52% 58% 60% 65% Pension/Retirement 37% 41% 51% 42% Dental Insurance 24% 24% 29% 26% Long-term disability insurance 40% 45% 46% 47% Work related transportation 8% 12% 13% 9% Educational prg. reimbursement 16% 23% 20% 18% No of respondents 244 69 427 187 If health insurance is offered, do you take it Yes 45% 48% 48% 47% No 55% 52% 52% 53% No of respondents 120 34 222 87 If yes, who pays for it? DCW pays for all of it 28% 23% 19% 25% DCW & Employer share the cost 61% 65% 69% 66% Employer pays for all of it 11% 12% 12% 9% Source: Iowa Direct Care Wage & Benefit Survey-2010 * Totals more than 100% due to multiple responses
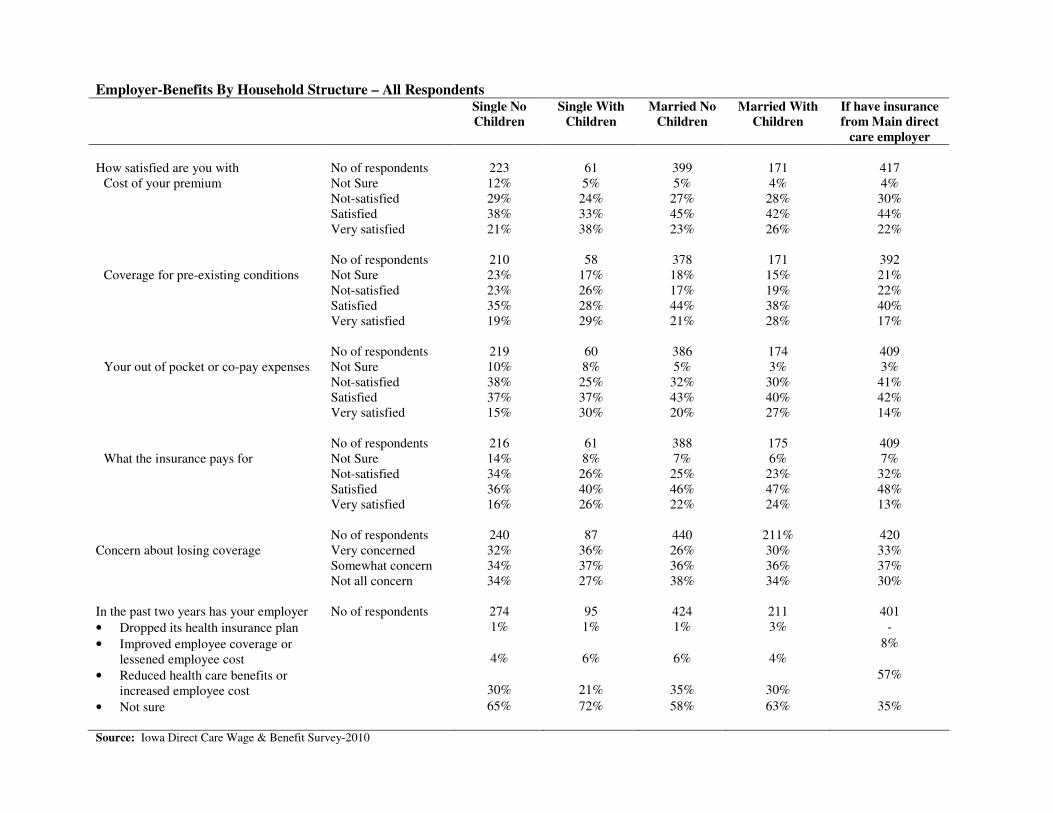
Employer-Benefits By Household Structure – All Respondents Single No
Children
Single With
Children
Married No
Children
Married With
Children
If have insurance
from Main direct
care employer
How satisfied are you with No of respondents 223 61 399 171 417
Cost of your premium Not Sure 12% 5% 5% 4% 4% Not-satisfied 29% 24% 27% 28% 30% Satisfied 38% 33% 45% 42% 44% Very satisfied 21% 38% 23% 26% 22% No of respondents 210 58 378 171 392 Coverage for pre-existing conditions Not Sure 23% 17% 18% 15% 21% Not-satisfied 23% 26% 17% 19% 22% Satisfied 35% 28% 44% 38% 40% Very satisfied 19% 29% 21% 28% 17% No of respondents 219 60 386 174 409 Your out of pocket or co-pay expenses Not Sure 10% 8% 5% 3% 3% Not-satisfied 38% 25% 32% 30% 41% Satisfied 37% 37% 43% 40% 42% Very satisfied 15% 30% 20% 27% 14% No of respondents 216 61 388 175 409 What the insurance pays for Not Sure 14% 8% 7% 6% 7%
Not-satisfied 34% 26% 25% 23% 32% Satisfied 36% 40% 46% 47% 48% Very satisfied 16% 26% 22% 24% 13% No of respondents 240 87 440 211% 420 Concern about losing coverage Very concerned 32% 36% 26% 30% 33% Somewhat concern 34% 37% 36% 36% 37% Not all concern 34% 27% 38% 34% 30% In the past two years has your employer No of respondents 274 95 424 211 401
• Dropped its health insurance plan 1% 1% 1% 3% -
• Improved employee coverage or lessened employee cost
4%
6%
6%
4%
8%
• Reduced health care benefits or increased employee cost
30%
21%
35%
30%
57%
• Not sure 65% 72% 58% 63% 35%
Source: Iowa Direct Care Wage & Benefit Survey-2010
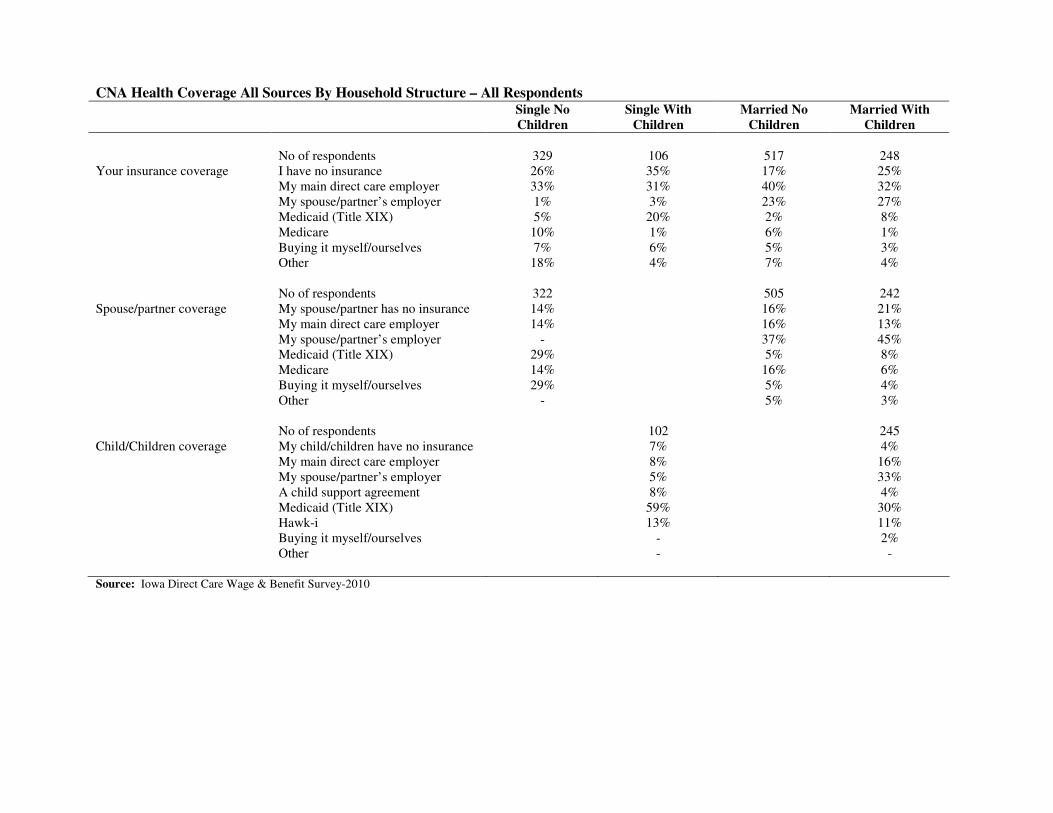
CNA Health Coverage All Sources By Household Structure – All Respondents Single No
Children
Single With
Children
Married No
Children
Married With
Children
No of respondents 329 106 517 248 Your insurance coverage I have no insurance 26% 35% 17% 25% My main direct care employer 33% 31% 40% 32% My spouse/partner’s employer 1% 3% 23% 27% Medicaid (Title XIX) 5% 20% 2% 8% Medicare 10% 1% 6% 1% Buying it myself/ourselves 7% 6% 5% 3% Other 18% 4% 7% 4% No of respondents 322 505 242 Spouse/partner coverage My spouse/partner has no insurance 14% 16% 21% My main direct care employer 14% 16% 13% My spouse/partner’s employer - 37% 45% Medicaid (Title XIX) 29% 5% 8% Medicare 14% 16% 6% Buying it myself/ourselves 29% 5% 4% Other - 5% 3% No of respondents 102 245 Child/Children coverage My child/children have no insurance 7% 4% My main direct care employer 8% 16% My spouse/partner’s employer 5% 33% A child support agreement 8% 4% Medicaid (Title XIX) 59% 30% Hawk-i 13% 11% Buying it myself/ourselves - 2% Other - - Source: Iowa Direct Care Wage & Benefit Survey-2010
37
Part Five: Direct Care Worker Knowledge and Use of Public Benefits and Employment
Searches Outside the Field
Because their wages are low, many direct care workers are eligible for a variety of public benefits. Part Four reported on the use of public health insurance benefits, under Medicaid, Medicare, and, for children only, hawk-i. DCW respondents reported relying upon Medicaid and hawk-i for the coverage of their children, even when they were unable to obtain coverage for themselves. Respondents also were asked about their knowledge and their use of other public programs designed to provide income supports to individuals and families. These included the Earned Income Tax Credit (EITC), food stamps, the child care subsidy program, other health services (the Iowa Care program, which is part of Medicaid but may not be recognized as such, and Community Health Centers), subsidized housing, and home energy assistance. They also were asked about use of voluntary tax preparation assistance and individual development accounts. These programs have different eligibility requirements, based upon income (often as a percentage of household poverty) and family characteristics (presence of children). Respondents provided information on household size, number of children under eighteen, and household annual income (within $5,000 increments from $10,000 to $30,000, and $10,000 increments to $50,000). From this, it was possible to provide a rough estimate of the number of respondents who, according to stated income, household size, and number of children, would be eligible for the different programs. Specifically, of those providing information about the household income, 18.2% reported income that would place their household at or below 100% of poverty, but 49.9% reported income that would place their household at or below 200% of poverty. Public opinion polls, as well as different economic analysis, generally show that it takes 175% to 225% of poverty to be economically able to meet basic needs without outside support (the differences depending on household characteristics and child care needs). The following are the eligibility criteria for each of these public programs, with very rough estimates of the number of direct care worker (DCW) respondents who might be eligible in parenthesis. While eligibility for the federal and state earned income credits are the same, the federal EITC is much more generous and provides after-tax refunds for most participants, while the state EITC generally only lowers income tax liability.
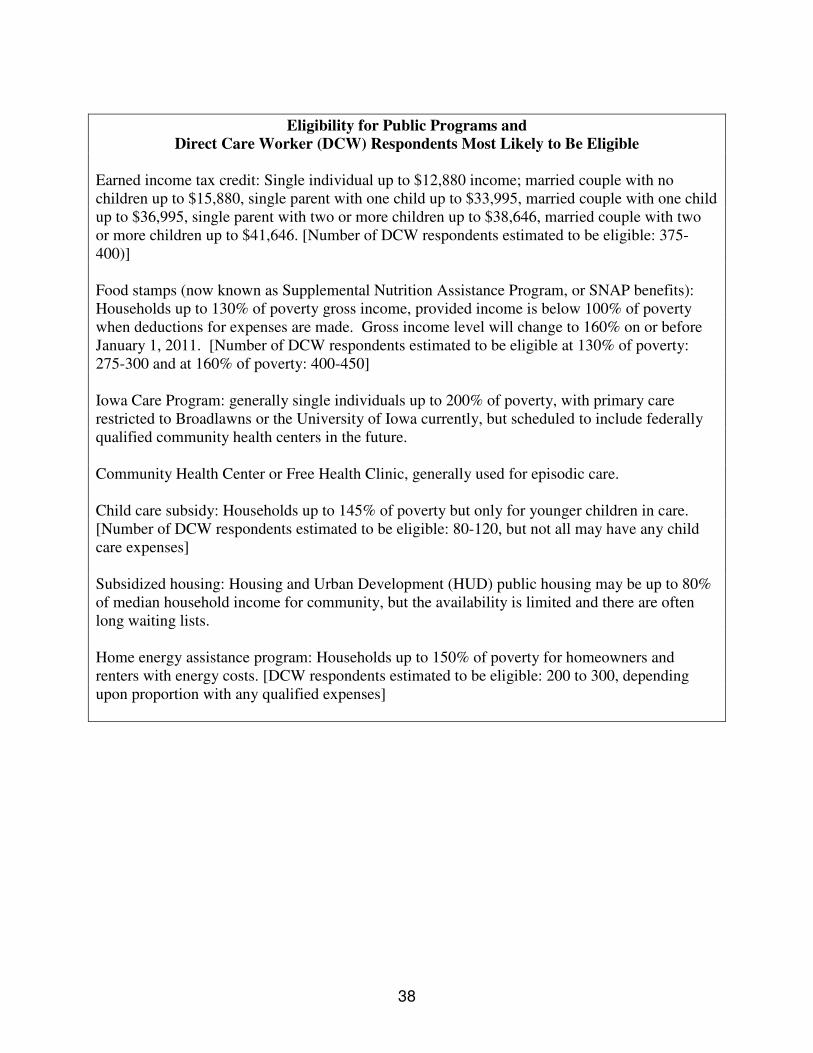
38
Eligibility for Public Programs and
Direct Care Worker (DCW) Respondents Most Likely to Be Eligible
Earned income tax credit: Single individual up to $12,880 income; married couple with no children up to $15,880, single parent with one child up to $33,995, married couple with one child up to $36,995, single parent with two or more children up to $38,646, married couple with two or more children up to $41,646. [Number of DCW respondents estimated to be eligible: 375-400)] Food stamps (now known as Supplemental Nutrition Assistance Program, or SNAP benefits): Households up to 130% of poverty gross income, provided income is below 100% of poverty when deductions for expenses are made. Gross income level will change to 160% on or before January 1, 2011. [Number of DCW respondents estimated to be eligible at 130% of poverty: 275-300 and at 160% of poverty: 400-450] Iowa Care Program: generally single individuals up to 200% of poverty, with primary care restricted to Broadlawns or the University of Iowa currently, but scheduled to include federally qualified community health centers in the future. Community Health Center or Free Health Clinic, generally used for episodic care. Child care subsidy: Households up to 145% of poverty but only for younger children in care. [Number of DCW respondents estimated to be eligible: 80-120, but not all may have any child care expenses] Subsidized housing: Housing and Urban Development (HUD) public housing may be up to 80% of median household income for community, but the availability is limited and there are often long waiting lists. Home energy assistance program: Households up to 150% of poverty for homeowners and renters with energy costs. [DCW respondents estimated to be eligible: 200 to 300, depending upon proportion with any qualified expenses]
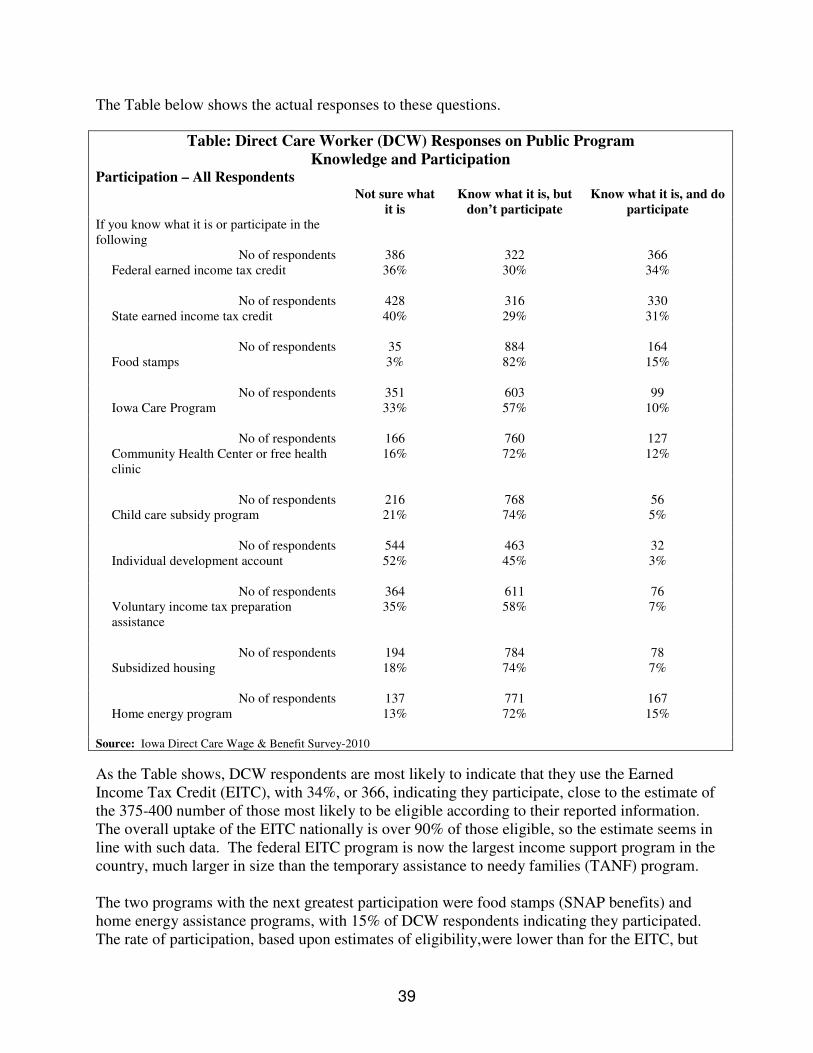
39
The Table below shows the actual responses to these questions.
Table: Direct Care Worker (DCW) Responses on Public Program
Knowledge and Participation
Participation – All Respondents
Not sure what
it is
Know what it is, but
don’t participate
Know what it is, and do
participate
If you know what it is or participate in the following
No of respondents 386 322 366 Federal earned income tax credit 36% 30% 34%
No of respondents 428 316 330
State earned income tax credit 40% 29% 31%
No of respondents 35 884 164 Food stamps 3% 82% 15%
No of respondents 351 603 99
Iowa Care Program 33% 57% 10%
No of respondents 166 760 127 Community Health Center or free health clinic
16% 72% 12%
No of respondents 216 768 56
Child care subsidy program 21% 74% 5%
No of respondents 544 463 32 Individual development account 52% 45% 3%
No of respondents 364 611 76
Voluntary income tax preparation assistance
35% 58% 7%
No of respondents 194 784 78
Subsidized housing 18% 74% 7%
No of respondents 137 771 167 Home energy program 13% 72% 15%
Source: Iowa Direct Care Wage & Benefit Survey-2010
As the Table shows, DCW respondents are most likely to indicate that they use the Earned Income Tax Credit (EITC), with 34%, or 366, indicating they participate, close to the estimate of the 375-400 number of those most likely to be eligible according to their reported information. The overall uptake of the EITC nationally is over 90% of those eligible, so the estimate seems in line with such data. The federal EITC program is now the largest income support program in the country, much larger in size than the temporary assistance to needy families (TANF) program. The two programs with the next greatest participation were food stamps (SNAP benefits) and home energy assistance programs, with 15% of DCW respondents indicating they participated. The rate of participation, based upon estimates of eligibility,were lower than for the EITC, but
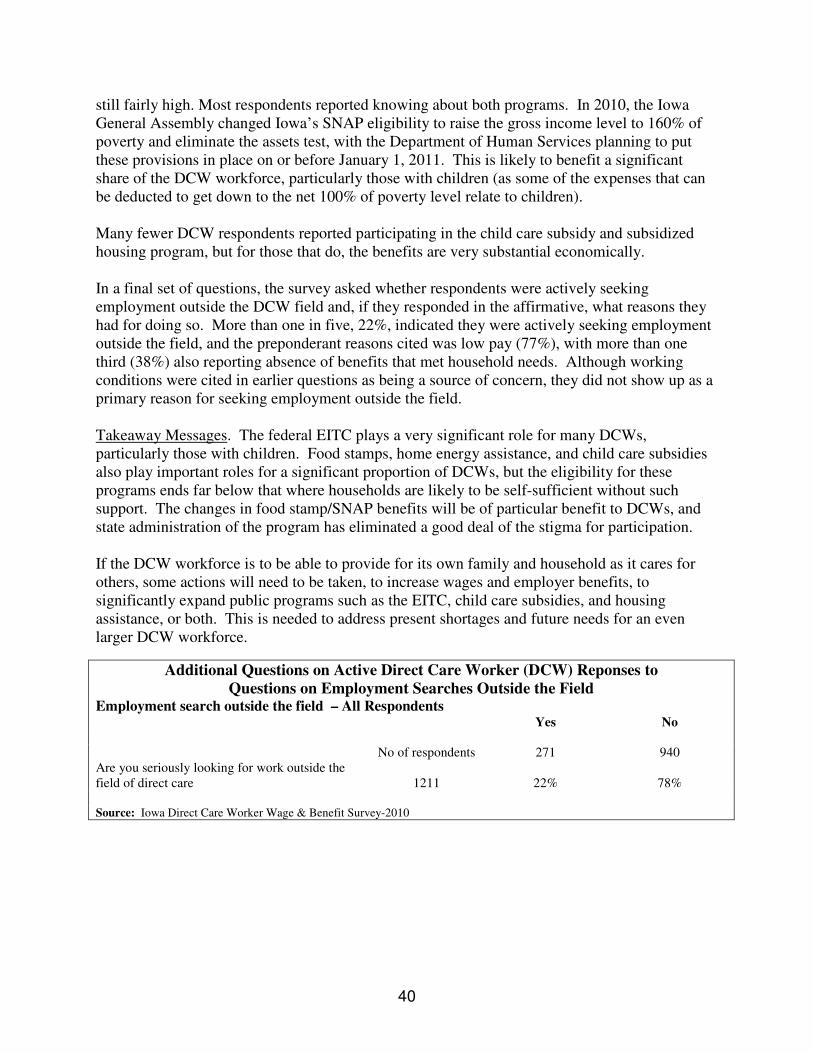
40
still fairly high. Most respondents reported knowing about both programs. In 2010, the Iowa General Assembly changed Iowa’s SNAP eligibility to raise the gross income level to 160% of poverty and eliminate the assets test, with the Department of Human Services planning to put these provisions in place on or before January 1, 2011. This is likely to benefit a significant share of the DCW workforce, particularly those with children (as some of the expenses that can be deducted to get down to the net 100% of poverty level relate to children). Many fewer DCW respondents reported participating in the child care subsidy and subsidized housing program, but for those that do, the benefits are very substantial economically. In a final set of questions, the survey asked whether respondents were actively seeking employment outside the DCW field and, if they responded in the affirmative, what reasons they had for doing so. More than one in five, 22%, indicated they were actively seeking employment outside the field, and the preponderant reasons cited was low pay (77%), with more than one third (38%) also reporting absence of benefits that met household needs. Although working conditions were cited in earlier questions as being a source of concern, they did not show up as a primary reason for seeking employment outside the field. Takeaway Messages. The federal EITC plays a very significant role for many DCWs, particularly those with children. Food stamps, home energy assistance, and child care subsidies also play important roles for a significant proportion of DCWs, but the eligibility for these programs ends far below that where households are likely to be self-sufficient without such support. The changes in food stamp/SNAP benefits will be of particular benefit to DCWs, and state administration of the program has eliminated a good deal of the stigma for participation.
If the DCW workforce is to be able to provide for its own family and household as it cares for others, some actions will need to be taken, to increase wages and employer benefits, to significantly expand public programs such as the EITC, child care subsidies, and housing assistance, or both. This is needed to address present shortages and future needs for an even larger DCW workforce.
Additional Questions on Active Direct Care Worker (DCW) Reponses to
Questions on Employment Searches Outside the Field
Employment search outside the field – All Respondents
Yes No
No of respondents 271 940 Are you seriously looking for work outside the field of direct care
1211
22%
78%
Source: Iowa Direct Care Worker Wage & Benefit Survey-2010
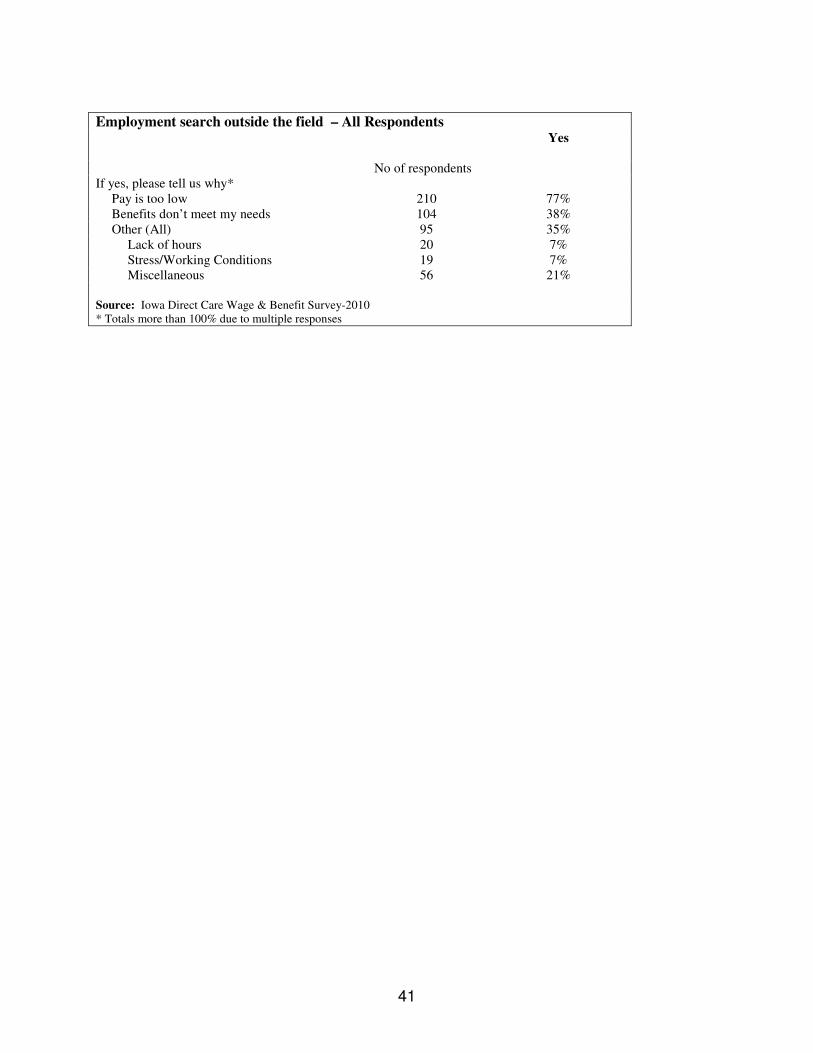
41
Employment search outside the field – All Respondents
Yes
No of respondents
If yes, please tell us why* Pay is too low 210 77% Benefits don’t meet my needs 104 38% Other (All) 95 35%
Lack of hours 20 7% Stress/Working Conditions 19 7% Miscellaneous 56 21%
Source: Iowa Direct Care Wage & Benefit Survey-2010 * Totals more than 100% due to multiple responses

42
Appendix One: Methodology for Survey Distribution
Mailed surveys of Iowa’s Direct Care Workers (DCWs) were conducted in 2001 and 2004. For the 2010 survey, the 2004 questionnaire was reviewed and updated. Where possible, key 2004 survey questions were not changed to be able to compare the 2010 survey with the 2004 and 2001 surveys.
There is no single registry or source of information about all Direct Care Workers, which required use of multiple strategies for distributing and interpreting the surveys. The only centralized source of contact information is the DCW Registry, and this Registry includes primarily, but not exclusively, DCWs who are Certified Nursing Assistants (CNAs). Most CNAs work in nursing facilities and other medical facilities, so those DCWs who work in home care are underrepresented. Both the 2001 and 2004 surveys drew a random samples from the Direct Care Worker Registry, however, which enabled comparisons of responses between 2001, 2004, and 2010. In an effort to obtain information from DCWs in as many settings as possible, the same survey was distributed using three mechanisms: 1. A random sample of CNAs on the DCW Registry, (plus an additional sample of 75 Hispanic
CNAs on the Iowans for Social and Economic Development (ISED) Barnabas program mailing list).
2. A sample of home care workers employed by Authorized Public Health Agencies. 3. All Consumer Directed Attendant Care (CDAC) Workers (also referred to as “providers”) are
listed with the Iowa Medicaid Enterprise (Iowa Department of Human Services). Through Executive Order 43, signed by Governor Tom Vilsack, the American Federation of State, County, and Municipal Employees (AFSCME) union was granted the authority to organize CDAC workers. AFSCME is provided that list of CDAC workers, some of whom are AFSCME members and others who are not.
All respondents were provided a postage-paid return envelope addressed to the Iowa CareGivers Association. The surveys were color-coded to identify each of the returned responses as part of one of the three samples. Each of the three methodologies is described in more detail below.
1. Iowa Direct Care Worker Registry Sample
Like the 2001 and 2004 surveys, a random sample of Certified Nursing Assistants (CNAs) on the Iowa Direct Care Worker Registry was mailed a survey. To encourage representation from Hispanic CNAs, 75 names from the Iowans for Social and Economic Development (ISED) were merged into the Registry mailing so that these individuals would not receive duplicate mailings. In total, 3,494 surveys were mailed and 577 were returned, for a response rate of 16.5%. This was similar to the response rate for the 2004 survey (808 responses of 4,500 mailed, for a response rate of 19.0%).

43
2. Public Health Agencies
There is no list of DCWs working in public health agencies, although public health agencies employ a good share of DCWs to provide home health care. The Iowa Department of Public Health (IDPH) expressed a willingness to facilitate the survey distribution to these public health entities. Packets of 25 surveys were mailed to all 132 IDPH-Authorized Agencies (3,300 surveys total). The packet included a request to distribute the surveys to the agency’s home health DCWs. Of the 3,300 surveys sent to the 132 IDPHs, 324 were returned, for a response rate of 10%. There are limitations to this method of survey distribution which should be considered in the interpretation of the results:
• The sample includes publicly funded home care entities only. It does not include private not-for-profit or for-profit entities.
• The survey was, of necessity, distributed by the employer rather than sent directly to the worker, so this should be kept in mind when interpreting the results.
• It cannot be known how the publicly funded entities actually distributed the surveys to their workers or from which publicly funded entities the responses were received. It is possible that many came from the same entity, with few or none from other entities.
3. Consumer Directed Attendant Care Workers (CDAC)
The survey was delivered to the American Federation of State, County and Municipal Employees (AFSCME) for mailing to its list of all CDAC home care providers registered with the state of Iowa as of March 2010. The list includes both AFSCME members and non-members. This mailing provides an additional source of home care workers who do not work for public health agencies, as well as information about home care workers who are self-employed. Surveys were mailed to all 3,443 names on the list, and 375 were returned, for a response rate of 11%. The methodology for distributing the surveys to the Public Health and CDAC samples, while not ideal, does provide responses from this part of the directed care workforce that was not available in previous surverys. The report provides separate analyses for each of the three surveys, but it also does combine the responses to provide an overall picture of respondents. This combination enabled some types of analyses (e.g. by household type) that otherwise could not be conducted. Methodology appendix prepared by: Di Findley, Linda Simonton, Charles Bruner, and Syed Noor Tirmizi
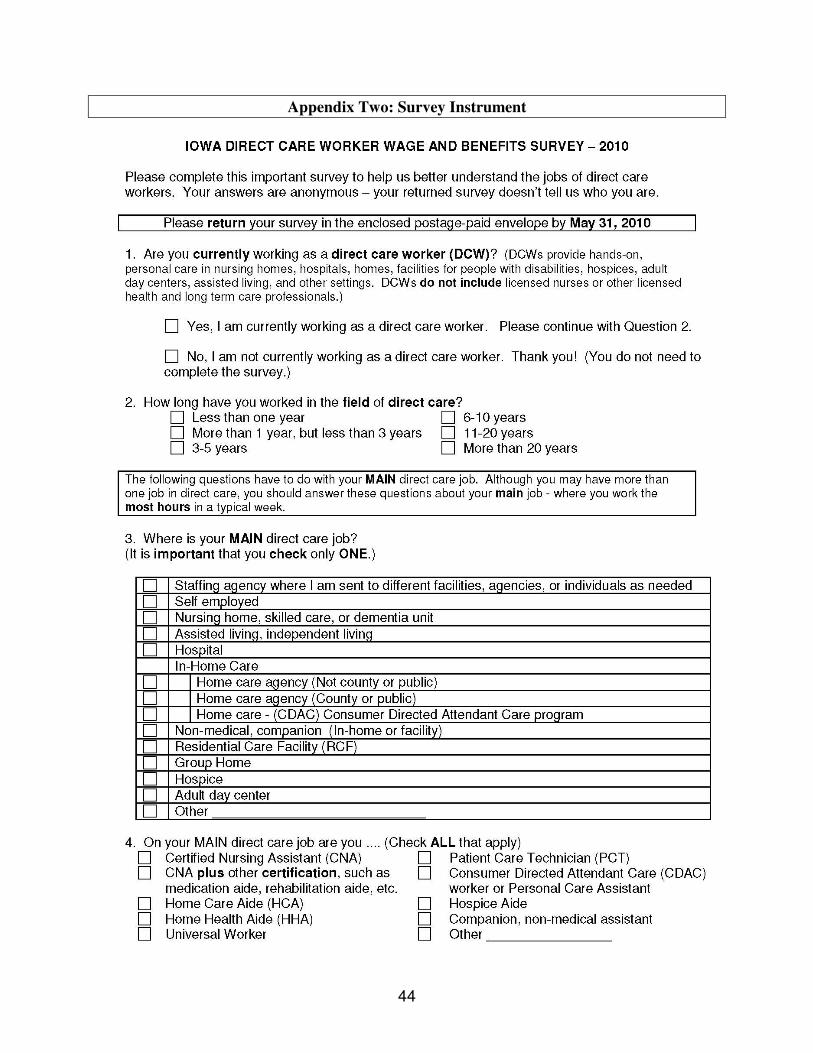
44
Appendix Two: Survey Instrument
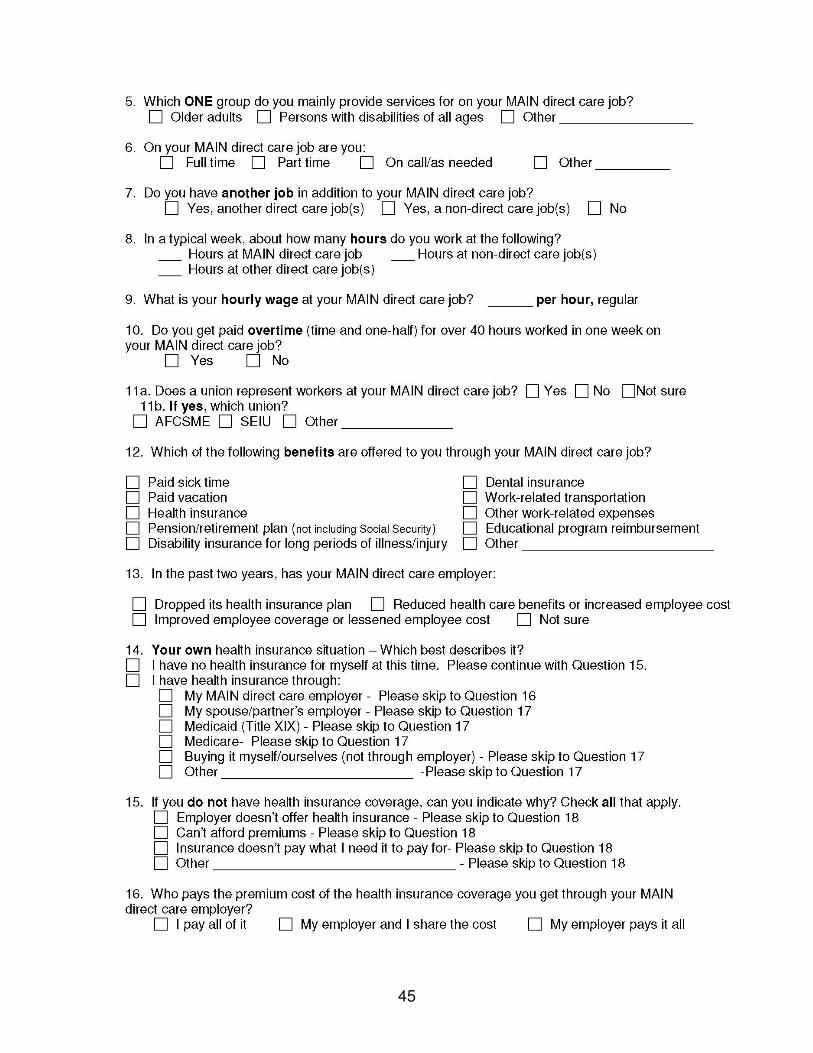
45
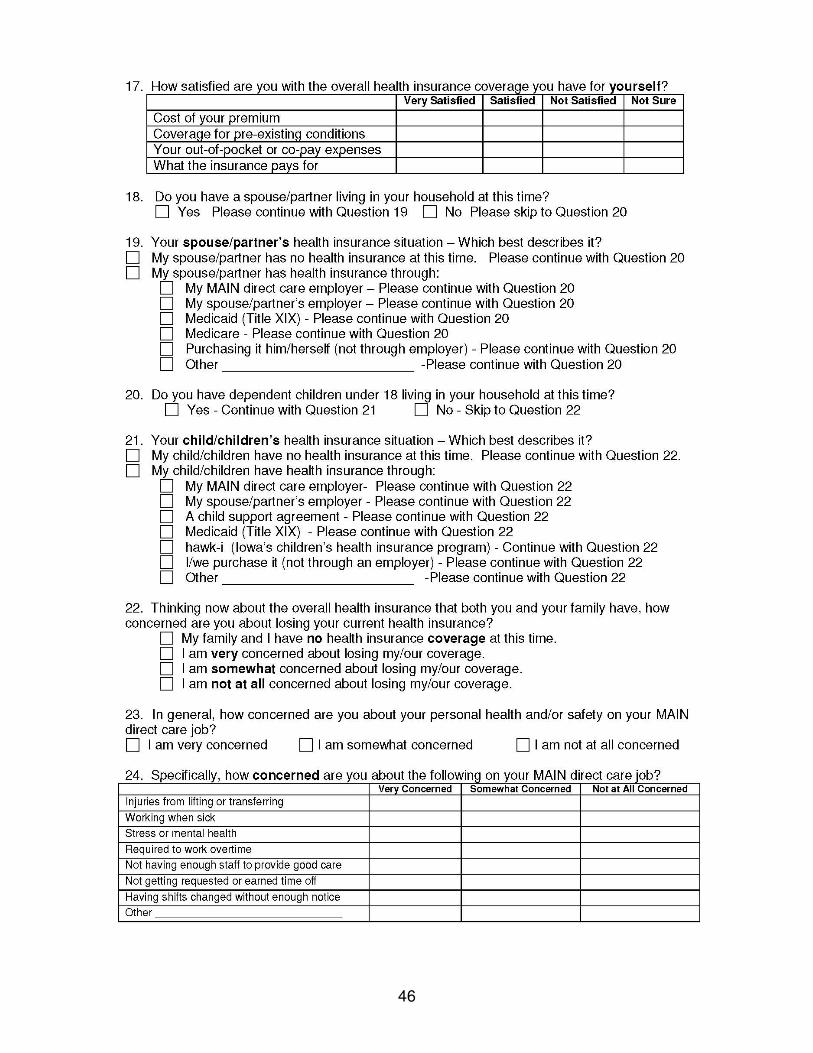
46
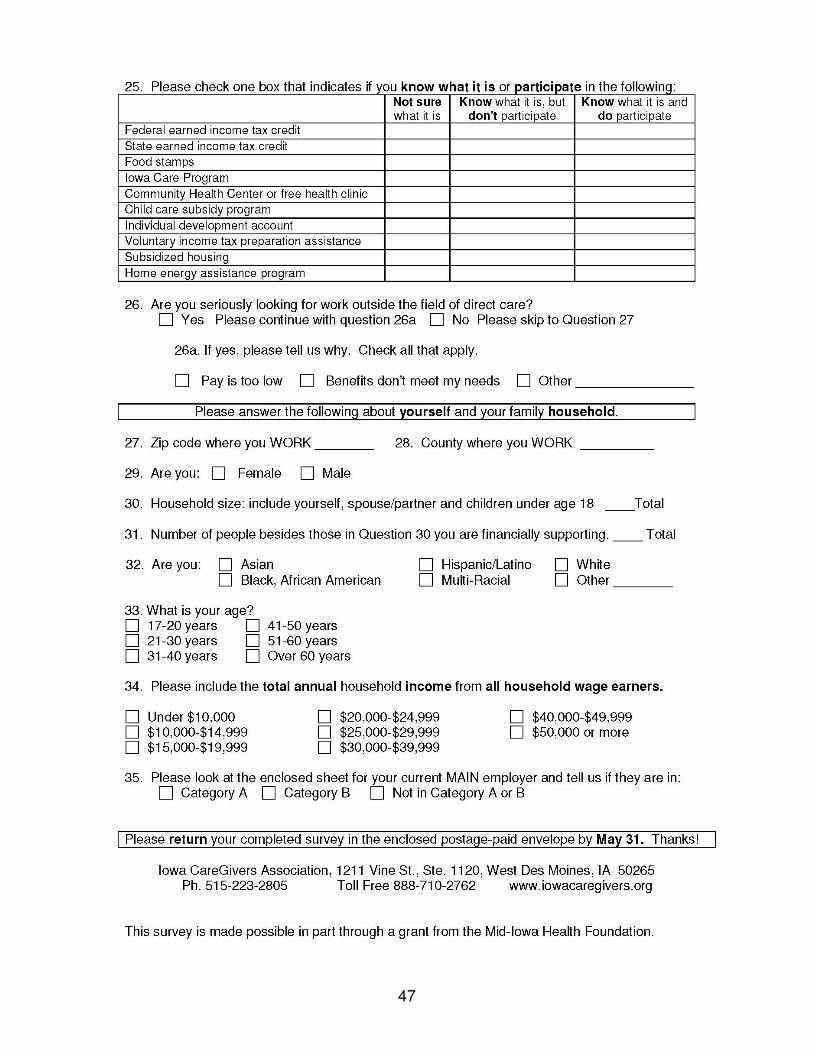
47


1211 Vine Street #1120 West Des Moines, Iowa 50265 www.iowacaregivers.org
505 5th Avenue, #404 Des Moines, Iowa 50309 www.cfpciowa.org