Iowa Department of Elder Affairs - Iowa Publications...
32
Iowa Department of Elder Affairs Iowa NAPIS (National Aging Program Information System) Activity Report (State Fiscal Year 2004) Iowa Department of Elder Affairs Clemens Building, 3 rd Floor 200 10 th Street Des Moines, IA 50309-3609 Phone: (515) 242-3333 Fax: (515) 242-3300 www.state.ia.us/elderaffairs (March 2005) Version 1: 3/03/2005
Transcript of Iowa Department of Elder Affairs - Iowa Publications...
Iowa Department of Elder Affairs
Iowa NAPIS (National Aging Program Information System)
Activity Report (State Fiscal Year 2004)
Iowa Department of Elder Affairs
Clemens Building, 3rd Floor 200 10th Street
Des Moines, IA 50309-3609 Phone: (515) 242-3333
Fax: (515) 242-3300 www.state.ia.us/elderaffairs
(March 2005)
Version 1: 3/03/2005
II
Table of Contents Introduction 1
NAPIS Data 2
State Fiscal Year 2004 Title III Services 3
State Fiscal Year 2004 Title III-E Family Care Giver Services 4
Unduplicated Client Count & Total Units by County 5
Service Delivery Map 6
Unduplicated Client Count and Total Units By Service and County 7
SLP Service Units SFY 2004 (Copied from the SLP SFY 2004 Activity Report)
26
AAA Taxonomy Number -- Service Definitions with Units of Service (Copied from the FISCAL YEAR 2005 AAA REPORTING MANUAL)
27
1
Introduction The Federal Administration on Aging requires performance reporting from State Units on Aging
regarding the delivery of specified services to clients. This reporting requirement is the foundation of
the Iowa National Aging Program Information System, or "Iowa NAPIS". The Iowa Department of
Elder Affairs (DEA) is the state agency responsible for Iowa NAPIS.
Iowa's 13 Area Agencies on Aging are responsible for tracking and reporting on services
provided to aging citizens of Iowa funded through Federal and State programs. After collecting
detailed information on the services provided, the recipients of the services, the providers of the
services, and the associated costs, DEA is responsible for filing an annual State Performance Report
(SPR) with the Administration of Aging.
This report shows the number of older Iowans and units of service by service category from
Title III funding of the Older Americans Act, the Administration on Aging (AoA) and limited state
general fund dollars. During SFY 2004 there were 68,929 unduplicated registered clients and
555,104 aggregate clients that received services and were entered into the NAPIS system.
DEA hopes that this document and the information contained within can be a useful tool for
making informed planning decisions. The information provided in this report is the result of hard work
and dedication from the Iowa Aging Network who work as a team with the Iowa Department of Elder
Affairs toward it’s mission: "To provide advocacy, educational, and prevention services to older
Iowans so they can find Iowa a healthy, safe, productive, and enjoyable place to live and work.
2
NAPIS Data
Iowa NAPIS data is reported to DEA from AAAs and this report represents information about consumers and services provided from July 1, 2003 through June 30, 2004. NAPIS data is dynamic and any corrections by the AAA at the local level after January 1, 2005 would not be reflected in this report. The following definitions will assist you in using this document: Clients: Elderly persons that receive services/benefits from programs offered through public funding (Federal, State, Local, etc.).
Services: A form of benefit received by the client; service can be recorded by individual clients or aggregate clients (tracks service delivery to a number of nonspecific clients); service tracking can included but not limited to: Title III services defined by Administration on Aging (AoA); Senior Living Trust Funding (SLP services); and Title III-E Caregiver services. Go to Page 20 for a list of service taxonomies and definitions. NOTE: This document reflects detailed information on services received through Title III, Title III-E Caregiver and limited State of Iowa dollars. A list of services received through Senior Living Trust Funding can be found on Page 25 of this document. For detailed information on Senior Living Trust Funding (SLP services) see the SLP SFY 2004 Activity Report.
Registered Service: Services that require a NAPIS client registration containing a "detailed" profile of client characteristics that include:
• Minority status, by individual minority group • Rural status • Age group • Live alone status • ADL/IADL status • Poverty status • Sex
DEA encourages client registration for all services but requires client registration for 9 of the 14 AOA core services that include:
• Personal Care • Case Management • Homemaker • Congregate Meals • Chore • Nutrition Counseling • Home Delivered Meals • Assisted Transportation • Day Care/Adult Day Health
and those services funded by Title III funds designated by DEA as a required registered service. Aggregate Service: Services that do not require a NAPIS client registration containing a "detailed" profile of client characteristics and are entered as an aggregate total of clients that received a service. Service Unit: Description of how the service is delivered and recorded into the NAPIS system (i.e. hour, contact, session).
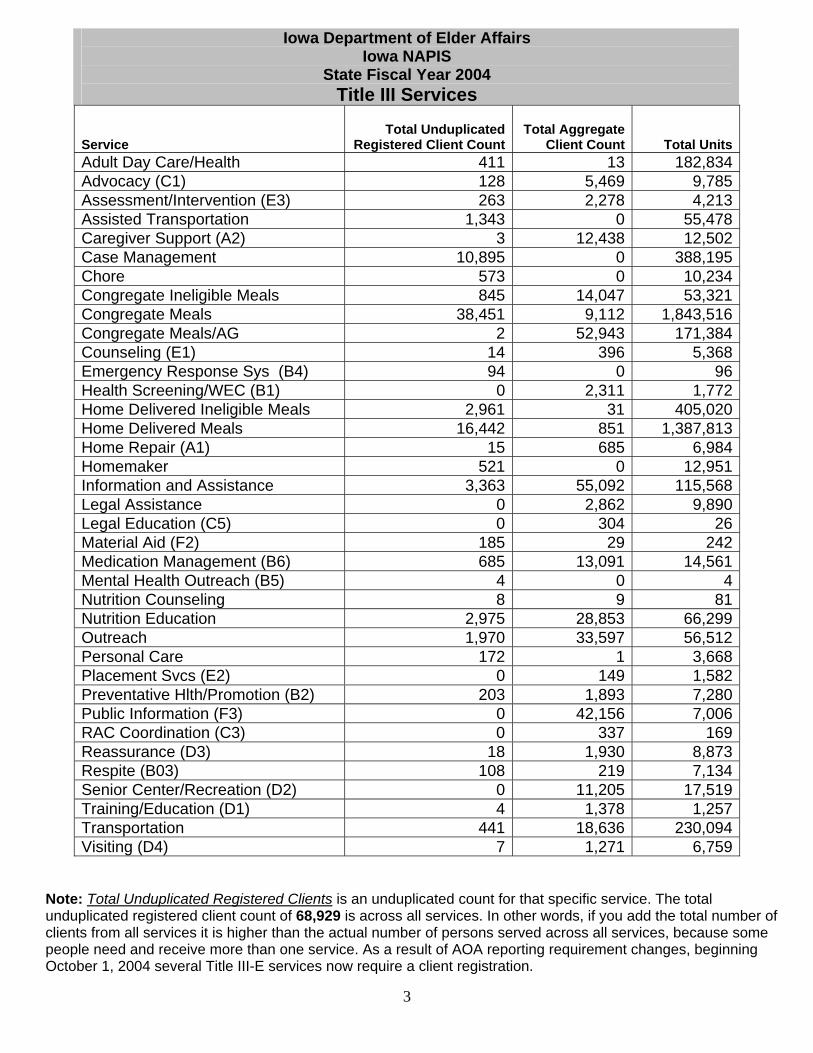
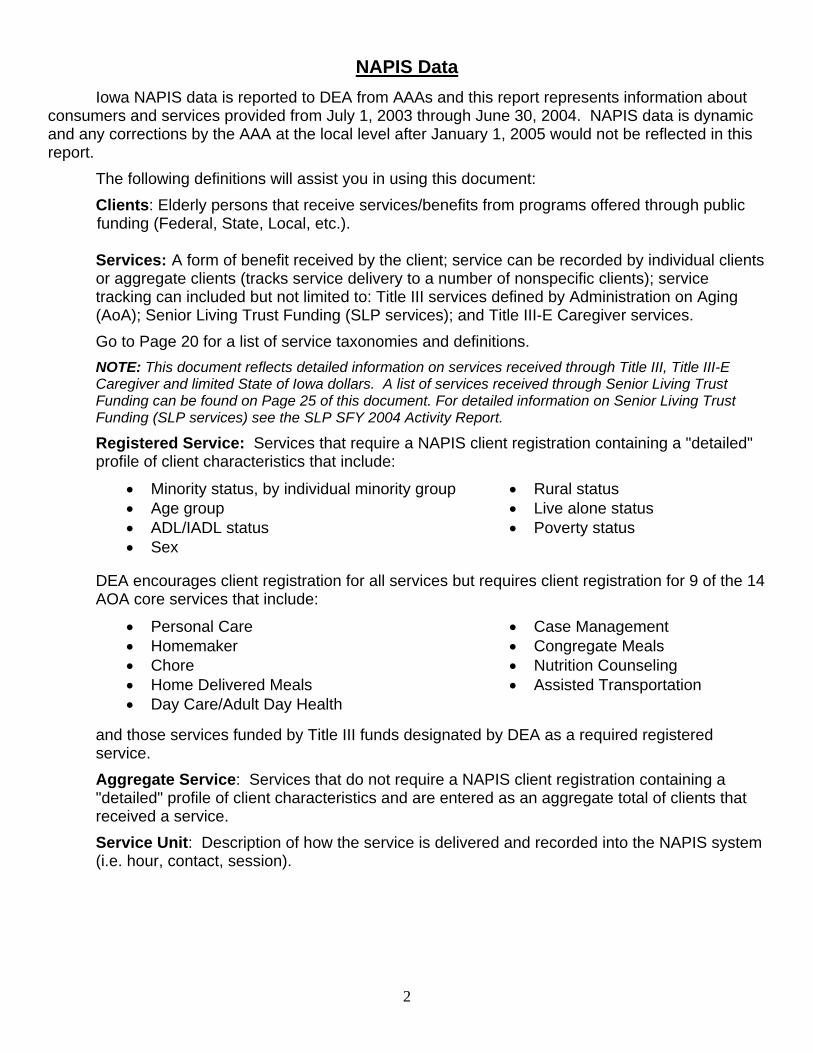
Note: Total Unduplicated Registered Clients is an unduplicated count for that specific service. The total unduplicated registered client count of 68,929 is across all services. In other words, if you add the total number of clients from all services it is higher than the actual number of persons served across all services, because some people need and receive more than one service. As a result of AOA reporting requirement changes, beginning October 1, 2004 several Title III-E services now require a client registration.
Iowa Department of Elder Affairs Iowa NAPIS
State Fiscal Year 2004 Title III Services
Service Total Unduplicated
Registered Client CountTotal Aggregate
Client Count Total UnitsAdult Day Care/Health 411 13 182,834Advocacy (C1) 128 5,469 9,785Assessment/Intervention (E3) 263 2,278 4,213Assisted Transportation 1,343 0 55,478Caregiver Support (A2) 3 12,438 12,502Case Management 10,895 0 388,195Chore 573 0 10,234Congregate Ineligible Meals 845 14,047 53,321Congregate Meals 38,451 9,112 1,843,516Congregate Meals/AG 2 52,943 171,384Counseling (E1) 14 396 5,368Emergency Response Sys (B4) 94 0 96Health Screening/WEC (B1) 0 2,311 1,772Home Delivered Ineligible Meals 2,961 31 405,020Home Delivered Meals 16,442 851 1,387,813Home Repair (A1) 15 685 6,984Homemaker 521 0 12,951Information and Assistance 3,363 55,092 115,568Legal Assistance 0 2,862 9,890Legal Education (C5) 0 304 26Material Aid (F2) 185 29 242Medication Management (B6) 685 13,091 14,561Mental Health Outreach (B5) 4 0 4Nutrition Counseling 8 9 81Nutrition Education 2,975 28,853 66,299Outreach 1,970 33,597 56,512Personal Care 172 1 3,668Placement Svcs (E2) 0 149 1,582Preventative Hlth/Promotion (B2) 203 1,893 7,280Public Information (F3) 0 42,156 7,006RAC Coordination (C3) 0 337 169Reassurance (D3) 18 1,930 8,873Respite (B03) 108 219 7,134Senior Center/Recreation (D2) 0 11,205 17,519Training/Education (D1) 4 1,378 1,257Transportation 441 18,636 230,094Visiting (D4) 7 1,271 6,759
3
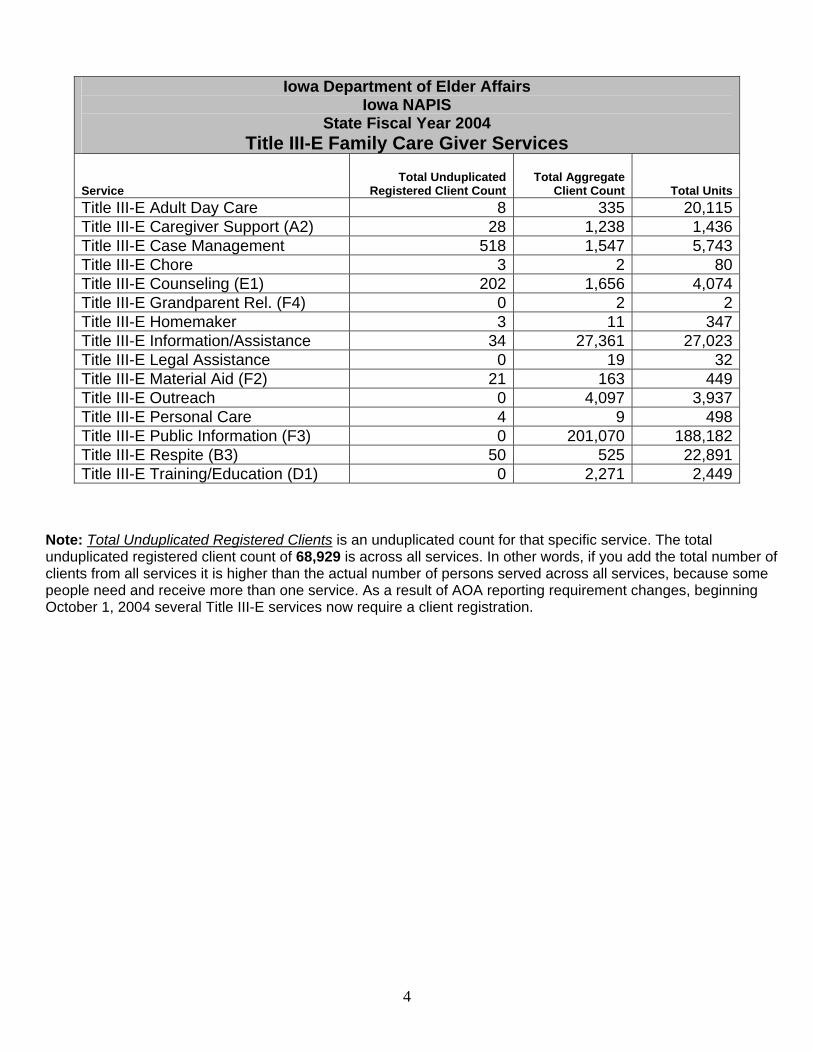
Iowa Department of Elder Affairs Iowa NAPIS
State Fiscal Year 2004 Title III-E Family Care Giver Services
Service Total Unduplicated
Registered Client CountTotal Aggregate
Client Count
Total UnitsTitle III-E Adult Day Care 8 335 20,115Title III-E Caregiver Support (A2) 28 1,238 1,436Title III-E Case Management 518 1,547 5,743Title III-E Chore 3 2 80Title III-E Counseling (E1) 202 1,656 4,074Title III-E Grandparent Rel. (F4) 0 2 2Title III-E Homemaker 3 11 347Title III-E Information/Assistance 34 27,361 27,023Title III-E Legal Assistance 0 19 32Title III-E Material Aid (F2) 21 163 449Title III-E Outreach 0 4,097 3,937Title III-E Personal Care 4 9 498Title III-E Public Information (F3) 0 201,070 188,182Title III-E Respite (B3) 50 525 22,891Title III-E Training/Education (D1) 0 2,271 2,449
Note: Total Unduplicated Registered Clients is an unduplicated count for that specific service. The total unduplicated registered client count of 68,929 is across all services. In other words, if you add the total number of clients from all services it is higher than the actual number of persons served across all services, because some people need and receive more than one service. As a result of AOA reporting requirement changes, beginning October 1, 2004 several Title III-E services now require a client registration.
4
5
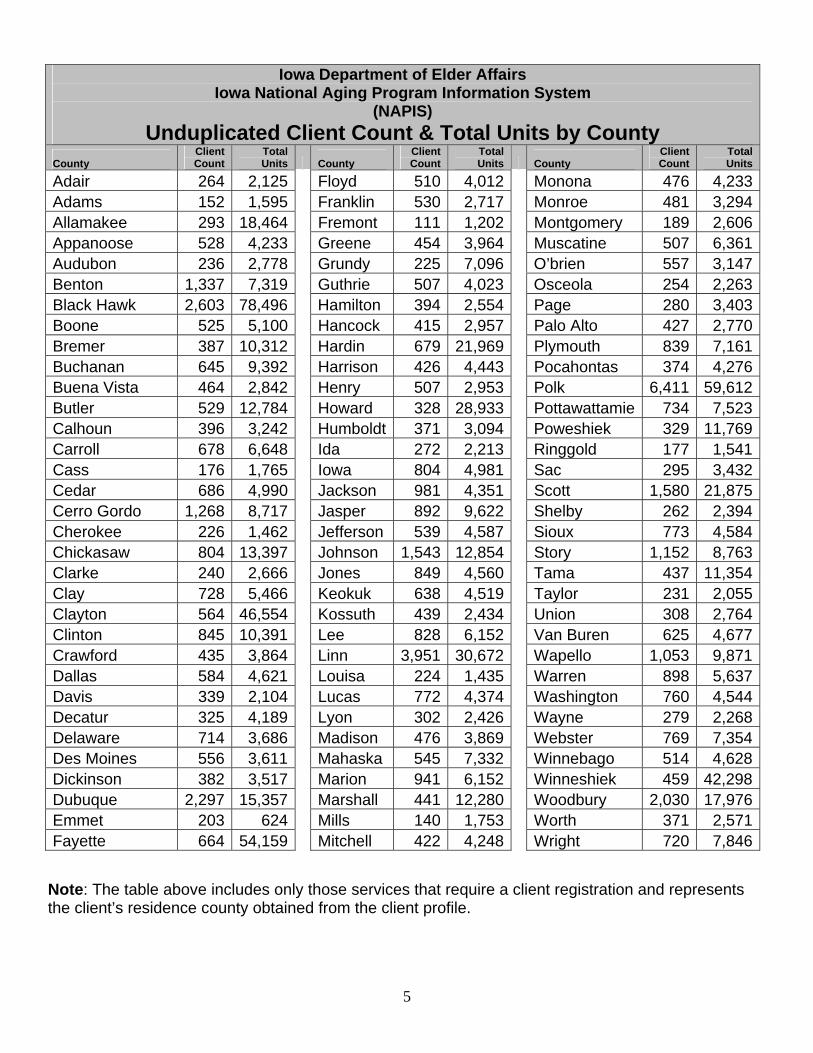
Iowa Department of Elder Affairs Iowa National Aging Program Information System
(NAPIS) Unduplicated Client Count & Total Units by County
County Client
Count Total Units County
Client Count
Total Units County
Client Count
Total Units
Adair 264 2,125 Floyd 510 4,012 Monona 476 4,233Adams 152 1,595 Franklin 530 2,717 Monroe 481 3,294Allamakee 293 18,464 Fremont 111 1,202 Montgomery 189 2,606Appanoose 528 4,233 Greene 454 3,964 Muscatine 507 6,361Audubon 236 2,778 Grundy 225 7,096 O’brien 557 3,147Benton 1,337 7,319 Guthrie 507 4,023 Osceola 254 2,263Black Hawk 2,603 78,496 Hamilton 394 2,554 Page 280 3,403Boone 525 5,100 Hancock 415 2,957 Palo Alto 427 2,770Bremer 387 10,312 Hardin 679 21,969 Plymouth 839 7,161Buchanan 645 9,392 Harrison 426 4,443 Pocahontas 374 4,276Buena Vista 464 2,842 Henry 507 2,953 Polk 6,411 59,612Butler 529 12,784 Howard 328 28,933 Pottawattamie 734 7,523Calhoun 396 3,242 Humboldt 371 3,094 Poweshiek 329 11,769Carroll 678 6,648 Ida 272 2,213 Ringgold 177 1,541Cass 176 1,765 Iowa 804 4,981 Sac 295 3,432Cedar 686 4,990 Jackson 981 4,351 Scott 1,580 21,875Cerro Gordo 1,268 8,717 Jasper 892 9,622 Shelby 262 2,394Cherokee 226 1,462 Jefferson 539 4,587 Sioux 773 4,584Chickasaw 804 13,397 Johnson 1,543 12,854 Story 1,152 8,763Clarke 240 2,666 Jones 849 4,560 Tama 437 11,354Clay 728 5,466 Keokuk 638 4,519 Taylor 231 2,055Clayton 564 46,554 Kossuth 439 2,434 Union 308 2,764Clinton 845 10,391 Lee 828 6,152 Van Buren 625 4,677Crawford 435 3,864 Linn 3,951 30,672 Wapello 1,053 9,871Dallas 584 4,621 Louisa 224 1,435 Warren 898 5,637Davis 339 2,104 Lucas 772 4,374 Washington 760 4,544Decatur 325 4,189 Lyon 302 2,426 Wayne 279 2,268Delaware 714 3,686 Madison 476 3,869 Webster 769 7,354Des Moines 556 3,611 Mahaska 545 7,332 Winnebago 514 4,628Dickinson 382 3,517 Marion 941 6,152 Winneshiek 459 42,298Dubuque 2,297 15,357 Marshall 441 12,280 Woodbury 2,030 17,976Emmet 203 624 Mills 140 1,753 Worth 371 2,571Fayette 664 54,159 Mitchell 422 4,248 Wright 720 7,846
Note: The table above includes only those services that require a client registration and represents the client’s residence county obtained from the client profile.
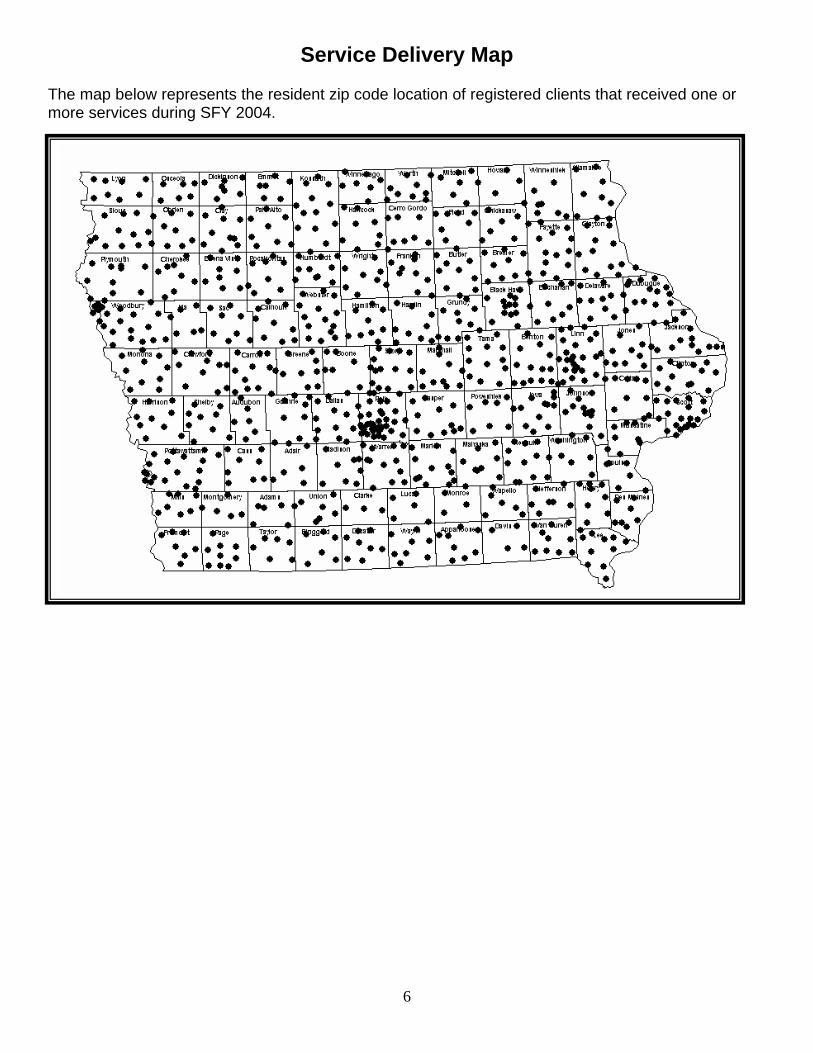
Service Delivery Map
The map below represents the resident zip code location of registered clients that received one or more services during SFY 2004.
6
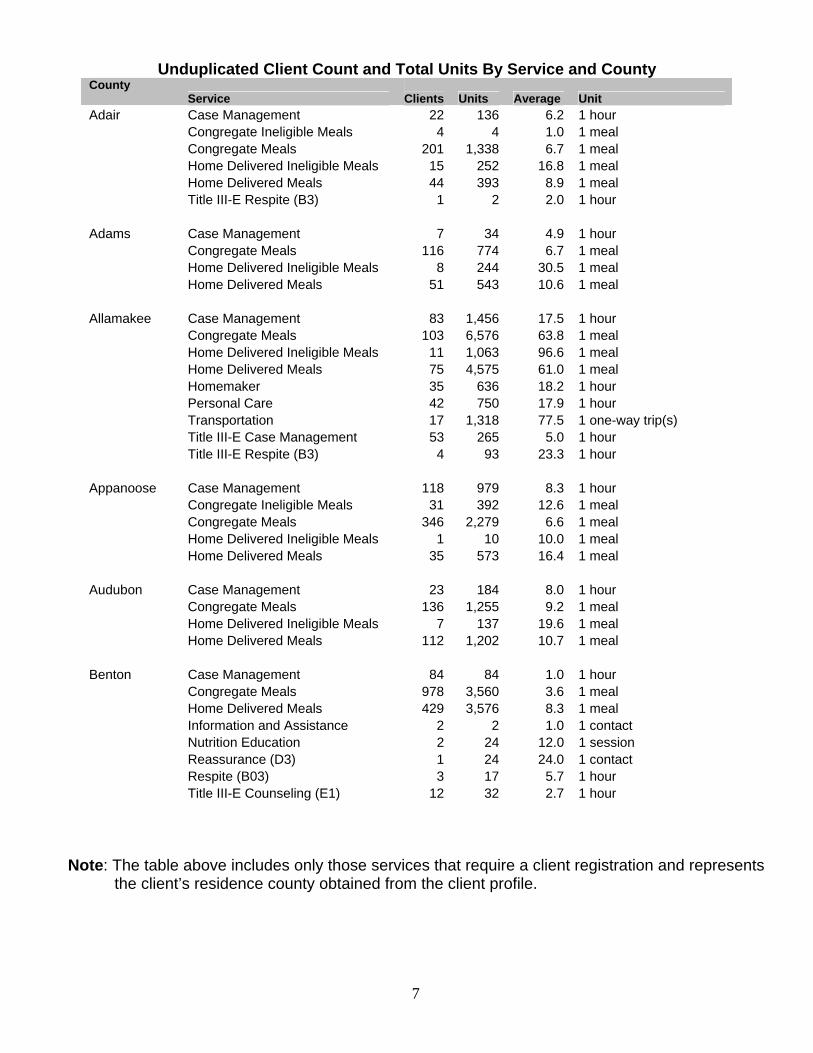
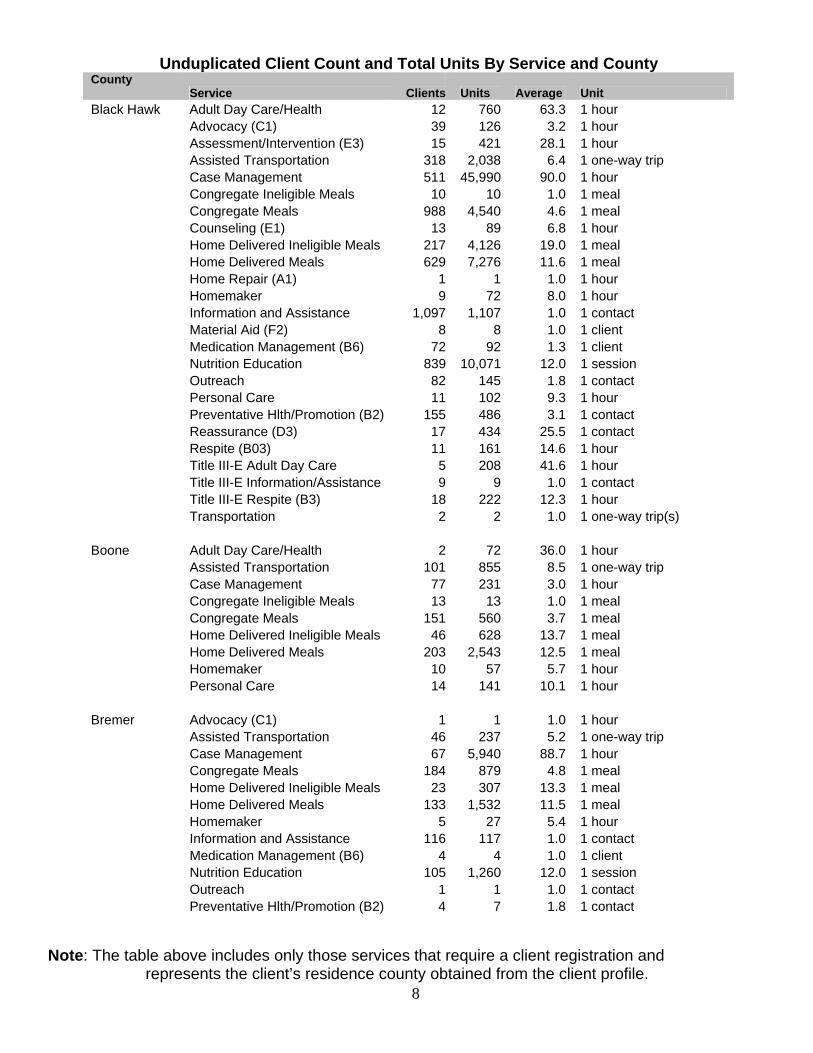
Unduplicated Client Count and Total Units By Service and County County
Service Clients Units Average Unit
Adair Case Management 22 136 6.2 1 hour Congregate Ineligible Meals 4 4 1.0 1 meal Congregate Meals 201 1,338 6.7 1 meal Home Delivered Ineligible Meals 15 252 16.8 1 meal Home Delivered Meals 44 393 8.9 1 meal Title III-E Respite (B3) 1 2 2.0 1 hour Adams Case Management 7 34 4.9 1 hour Congregate Meals 116 774 6.7 1 meal Home Delivered Ineligible Meals 8 244 30.5 1 meal Home Delivered Meals 51 543 10.6 1 meal Allamakee Case Management 83 1,456 17.5 1 hour Congregate Meals 103 6,576 63.8 1 meal Home Delivered Ineligible Meals 11 1,063 96.6 1 meal Home Delivered Meals 75 4,575 61.0 1 meal Homemaker 35 636 18.2 1 hour Personal Care 42 750 17.9 1 hour Transportation 17 1,318 77.5 1 one-way trip(s) Title III-E Case Management 53 265 5.0 1 hour Title III-E Respite (B3) 4 93 23.3 1 hour Appanoose Case Management 118 979 8.3 1 hour Congregate Ineligible Meals 31 392 12.6 1 meal Congregate Meals 346 2,279 6.6 1 meal Home Delivered Ineligible Meals 1 10 10.0 1 meal Home Delivered Meals 35 573 16.4 1 meal Audubon Case Management 23 184 8.0 1 hour Congregate Meals 136 1,255 9.2 1 meal Home Delivered Ineligible Meals 7 137 19.6 1 meal Home Delivered Meals 112 1,202 10.7 1 meal Benton Case Management 84 84 1.0 1 hour Congregate Meals 978 3,560 3.6 1 meal Home Delivered Meals 429 3,576 8.3 1 meal Information and Assistance 2 2 1.0 1 contact Nutrition Education 2 24 12.0 1 session Reassurance (D3) 1 24 24.0 1 contact Respite (B03) 3 17 5.7 1 hour Title III-E Counseling (E1) 12 32 2.7 1 hour
Note: The table above includes only those services that require a client registration and represents the client’s residence county obtained from the client profile.
7
Unduplicated Client Count and Total Units By Service and County County
Service Clients Units Average Unit
Black Hawk Adult Day Care/Health 12 760 63.3 1 hour Advocacy (C1) 39 126 3.2 1 hour Assessment/Intervention (E3) 15 421 28.1 1 hour Assisted Transportation 318 2,038 6.4 1 one-way trip Case Management 511 45,990 90.0 1 hour Congregate Ineligible Meals 10 10 1.0 1 meal Congregate Meals 988 4,540 4.6 1 meal Counseling (E1) 13 89 6.8 1 hour Home Delivered Ineligible Meals 217 4,126 19.0 1 meal Home Delivered Meals 629 7,276 11.6 1 meal Home Repair (A1) 1 1 1.0 1 hour Homemaker 9 72 8.0 1 hour Information and Assistance 1,097 1,107 1.0 1 contact Material Aid (F2) 8 8 1.0 1 client Medication Management (B6) 72 92 1.3 1 client Nutrition Education 839 10,071 12.0 1 session Outreach 82 145 1.8 1 contact Personal Care 11 102 9.3 1 hour Preventative Hlth/Promotion (B2) 155 486 3.1 1 contact Reassurance (D3) 17 434 25.5 1 contact Respite (B03) 11 161 14.6 1 hour Title III-E Adult Day Care 5 208 41.6 1 hour Title III-E Information/Assistance 9 9 1.0 1 contact Title III-E Respite (B3) 18 222 12.3 1 hour Transportation 2 2 1.0 1 one-way trip(s) Boone Adult Day Care/Health 2 72 36.0 1 hour Assisted Transportation 101 855 8.5 1 one-way trip Case Management 77 231 3.0 1 hour Congregate Ineligible Meals 13 13 1.0 1 meal Congregate Meals 151 560 3.7 1 meal Home Delivered Ineligible Meals 46 628 13.7 1 meal Home Delivered Meals 203 2,543 12.5 1 meal Homemaker 10 57 5.7 1 hour Personal Care 14 141 10.1 1 hour Bremer Advocacy (C1) 1 1 1.0 1 hour Assisted Transportation 46 237 5.2 1 one-way trip Case Management 67 5,940 88.7 1 hour Congregate Meals 184 879 4.8 1 meal Home Delivered Ineligible Meals 23 307 13.3 1 meal Home Delivered Meals 133 1,532 11.5 1 meal Homemaker 5 27 5.4 1 hour Information and Assistance 116 117 1.0 1 contact Medication Management (B6) 4 4 1.0 1 client Nutrition Education 105 1,260 12.0 1 session Outreach 1 1 1.0 1 contact Preventative Hlth/Promotion (B2) 4 7 1.8 1 contact
Note: The table above includes only those services that require a client registration and
8 represents the client’s residence county obtained from the client profile.
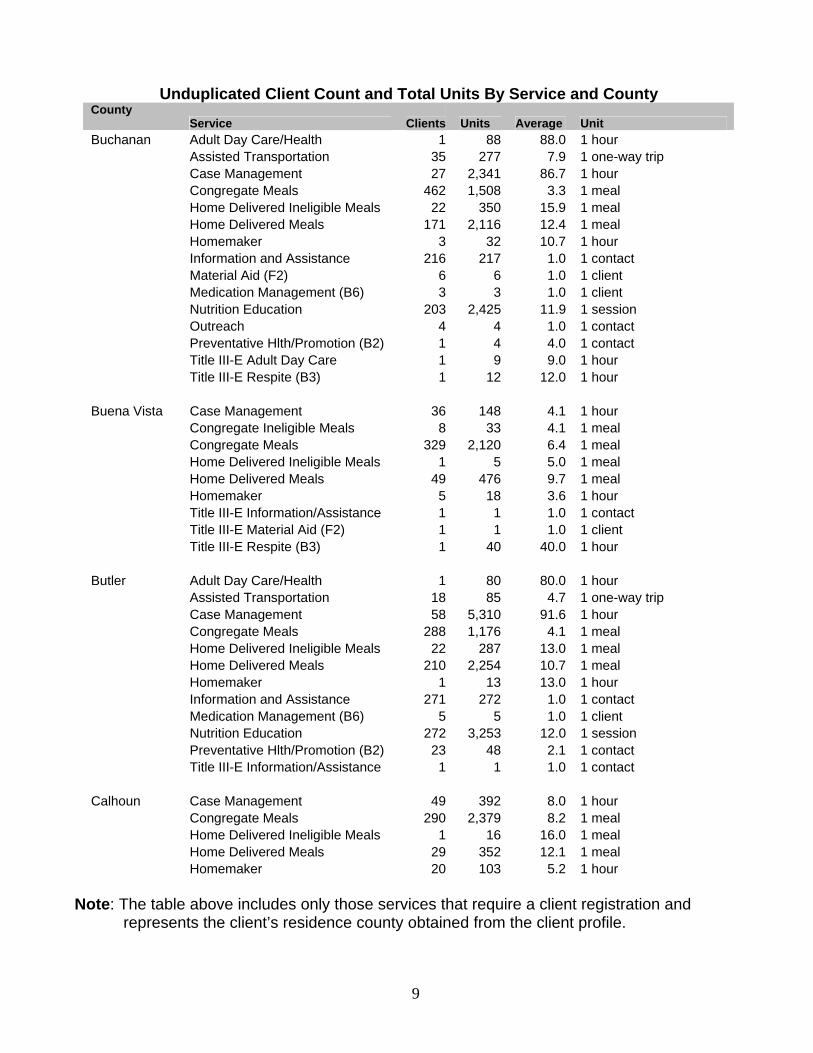
Buchanan Adult Day Care/Health 1 88 88.0 1 hour Assisted Transportation 35 277 7.9 1 one-way trip Case Management 27 2,341 86.7 1 hour Congregate Meals 462 1,508 3.3 1 meal Home Delivered Ineligible Meals 22 350 15.9 1 meal Home Delivered Meals 171 2,116 12.4 1 meal Homemaker 3 32 10.7 1 hour Information and Assistance 216 217 1.0 1 contact Material Aid (F2) 6 6 1.0 1 client Medication Management (B6) 3 3 1.0 1 client Nutrition Education 203 2,425 11.9 1 session Outreach 4 4 1.0 1 contact Preventative Hlth/Promotion (B2) 1 4 4.0 1 contact Title III-E Adult Day Care 1 9 9.0 1 hour Title III-E Respite (B3) 1 12 12.0 1 hour Buena Vista Case Management 36 148 4.1 1 hour Congregate Ineligible Meals 8 33 4.1 1 meal Congregate Meals 329 2,120 6.4 1 meal Home Delivered Ineligible Meals 1 5 5.0 1 meal Home Delivered Meals 49 476 9.7 1 meal Homemaker 5 18 3.6 1 hour Title III-E Information/Assistance 1 1 1.0 1 contact Title III-E Material Aid (F2) 1 1 1.0 1 client Title III-E Respite (B3) 1 40 40.0 1 hour Butler Adult Day Care/Health 1 80 80.0 1 hour Assisted Transportation 18 85 4.7 1 one-way trip Case Management 58 5,310 91.6 1 hour Congregate Meals 288 1,176 4.1 1 meal Home Delivered Ineligible Meals 22 287 13.0 1 meal Home Delivered Meals 210 2,254 10.7 1 meal Homemaker 1 13 13.0 1 hour Information and Assistance 271 272 1.0 1 contact Medication Management (B6) 5 5 1.0 1 client Nutrition Education 272 3,253 12.0 1 session Preventative Hlth/Promotion (B2) 23 48 2.1 1 contact Title III-E Information/Assistance 1 1 1.0 1 contact Calhoun Case Management 49 392 8.0 1 hour Congregate Meals 290 2,379 8.2 1 meal Home Delivered Ineligible Meals 1 16 16.0 1 meal Home Delivered Meals 29 352 12.1 1 meal Homemaker 20 103 5.2 1 hour
Unduplicated Client Count and Total Units By Service and County County
Service Clients Units Average Unit
Note: The table above includes only those services that require a client registration and represents the client’s residence county obtained from the client profile.
9
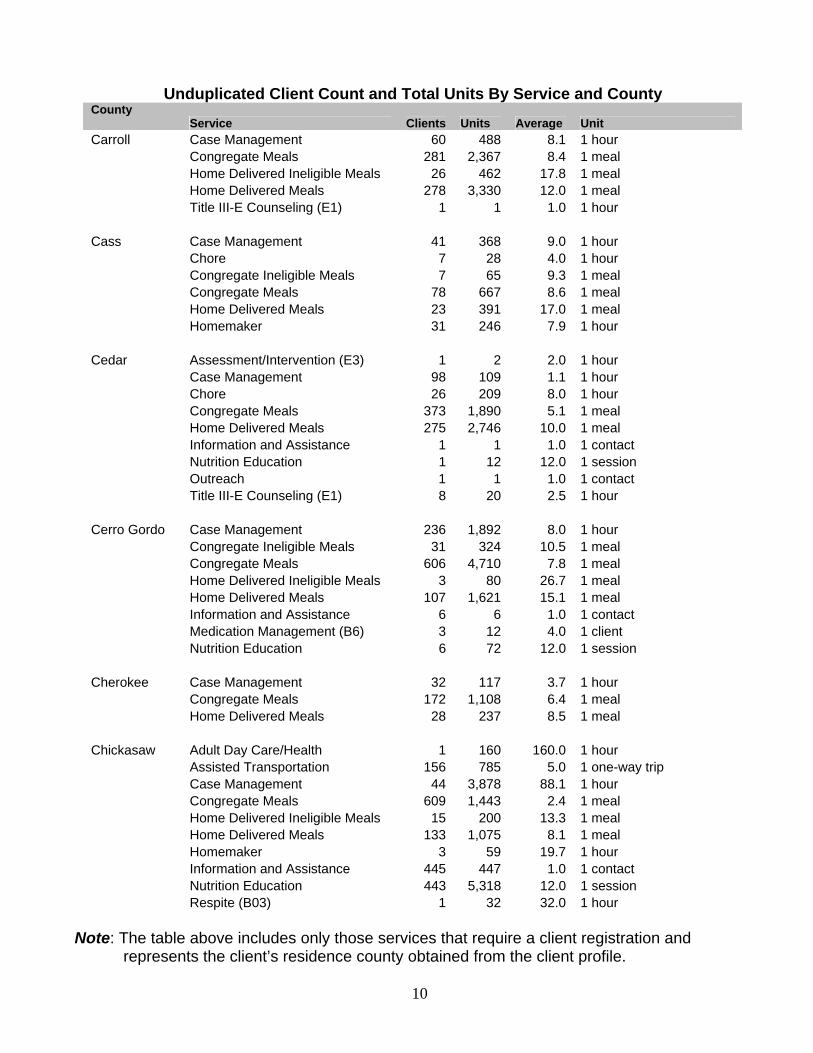
Unduplicated Client Count and Total Units By Service and County County
Service Clients Units Average Unit
Carroll Case Management 60 488 8.1 1 hour Congregate Meals 281 2,367 8.4 1 meal Home Delivered Ineligible Meals 26 462 17.8 1 meal Home Delivered Meals 278 3,330 12.0 1 meal Title III-E Counseling (E1) 1 1 1.0 1 hour Cass Case Management 41 368 9.0 1 hour Chore 7 28 4.0 1 hour Congregate Ineligible Meals 7 65 9.3 1 meal Congregate Meals 78 667 8.6 1 meal Home Delivered Meals 23 391 17.0 1 meal Homemaker 31 246 7.9 1 hour Cedar Assessment/Intervention (E3) 1 2 2.0 1 hour Case Management 98 109 1.1 1 hour Chore 26 209 8.0 1 hour Congregate Meals 373 1,890 5.1 1 meal Home Delivered Meals 275 2,746 10.0 1 meal Information and Assistance 1 1 1.0 1 contact Nutrition Education 1 12 12.0 1 session Outreach 1 1 1.0 1 contact Title III-E Counseling (E1) 8 20 2.5 1 hour Cerro Gordo Case Management 236 1,892 8.0 1 hour Congregate Ineligible Meals 31 324 10.5 1 meal Congregate Meals 606 4,710 7.8 1 meal Home Delivered Ineligible Meals 3 80 26.7 1 meal Home Delivered Meals 107 1,621 15.1 1 meal Information and Assistance 6 6 1.0 1 contact Medication Management (B6) 3 12 4.0 1 client Nutrition Education 6 72 12.0 1 session Cherokee Case Management 32 117 3.7 1 hour Congregate Meals 172 1,108 6.4 1 meal Home Delivered Meals 28 237 8.5 1 meal Chickasaw Adult Day Care/Health 1 160 160.0 1 hour Assisted Transportation 156 785 5.0 1 one-way trip Case Management 44 3,878 88.1 1 hour Congregate Meals 609 1,443 2.4 1 meal Home Delivered Ineligible Meals 15 200 13.3 1 meal Home Delivered Meals 133 1,075 8.1 1 meal Homemaker 3 59 19.7 1 hour Information and Assistance 445 447 1.0 1 contact Nutrition Education 443 5,318 12.0 1 session Respite (B03) 1 32 32.0 1 hour
Note: The table above includes only those services that require a client registration and represents the client’s residence county obtained from the client profile.
10
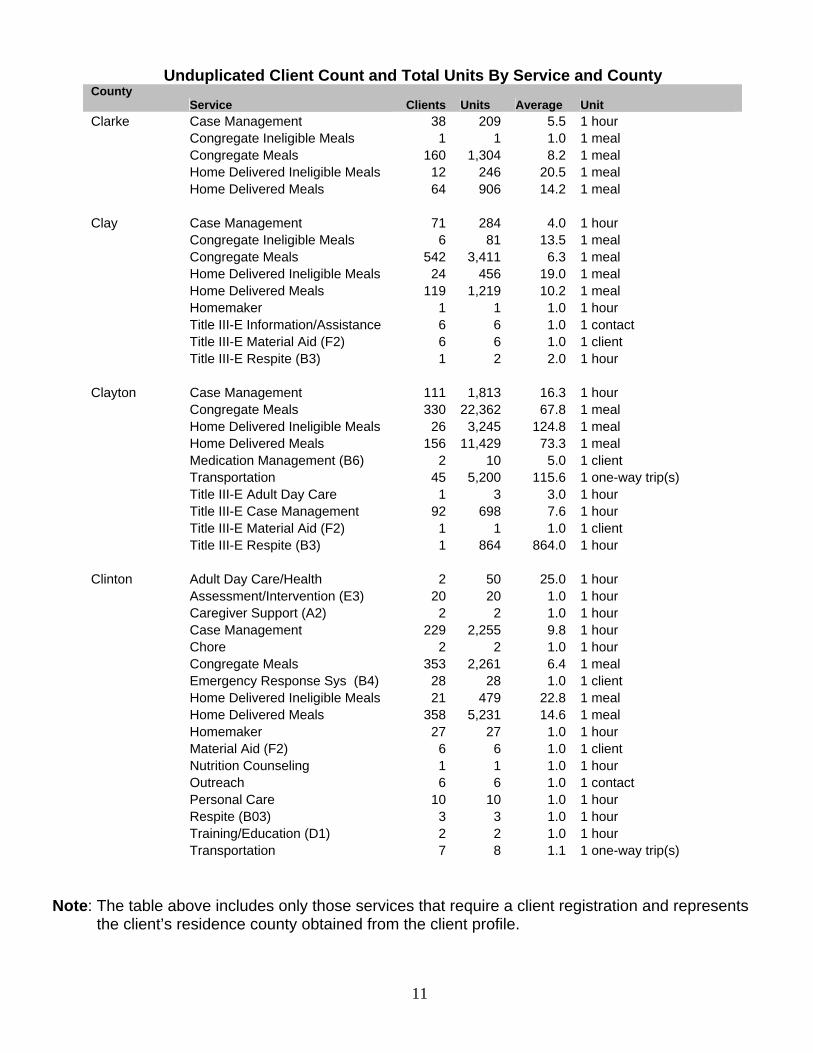
Unduplicated Client Count and Total Units By Service and County
County Service
Clients Units Average Unit
Clarke Case Management 38 209 5.5 1 hour Congregate Ineligible Meals 1 1 1.0 1 meal Congregate Meals 160 1,304 8.2 1 meal Home Delivered Ineligible Meals 12 246 20.5 1 meal Home Delivered Meals 64 906 14.2 1 meal Clay Case Management 71 284 4.0 1 hour Congregate Ineligible Meals 6 81 13.5 1 meal Congregate Meals 542 3,411 6.3 1 meal Home Delivered Ineligible Meals 24 456 19.0 1 meal Home Delivered Meals 119 1,219 10.2 1 meal Homemaker 1 1 1.0 1 hour Title III-E Information/Assistance 6 6 1.0 1 contact Title III-E Material Aid (F2) 6 6 1.0 1 client Title III-E Respite (B3) 1 2 2.0 1 hour Clayton Case Management 111 1,813 16.3 1 hour Congregate Meals 330 22,362 67.8 1 meal Home Delivered Ineligible Meals 26 3,245 124.8 1 meal Home Delivered Meals 156 11,429 73.3 1 meal Medication Management (B6) 2 10 5.0 1 client Transportation 45 5,200 115.6 1 one-way trip(s) Title III-E Adult Day Care 1 3 3.0 1 hour Title III-E Case Management 92 698 7.6 1 hour Title III-E Material Aid (F2) 1 1 1.0 1 client Title III-E Respite (B3) 1 864 864.0 1 hour Clinton Adult Day Care/Health 2 50 25.0 1 hour Assessment/Intervention (E3) 20 20 1.0 1 hour Caregiver Support (A2) 2 2 1.0 1 hour Case Management 229 2,255 9.8 1 hour Chore 2 2 1.0 1 hour Congregate Meals 353 2,261 6.4 1 meal Emergency Response Sys (B4) 28 28 1.0 1 client Home Delivered Ineligible Meals 21 479 22.8 1 meal Home Delivered Meals 358 5,231 14.6 1 meal Homemaker 27 27 1.0 1 hour Material Aid (F2) 6 6 1.0 1 client Nutrition Counseling 1 1 1.0 1 hour Outreach 6 6 1.0 1 contact Personal Care 10 10 1.0 1 hour Respite (B03) 3 3 1.0 1 hour Training/Education (D1) 2 2 1.0 1 hour Transportation 7 8 1.1 1 one-way trip(s)
Note: The table above includes only those services that require a client registration and represents the client’s residence county obtained from the client profile.
11
Unduplicated Client Count and Total Units By Service and County
County Service
Clients Units Average Unit
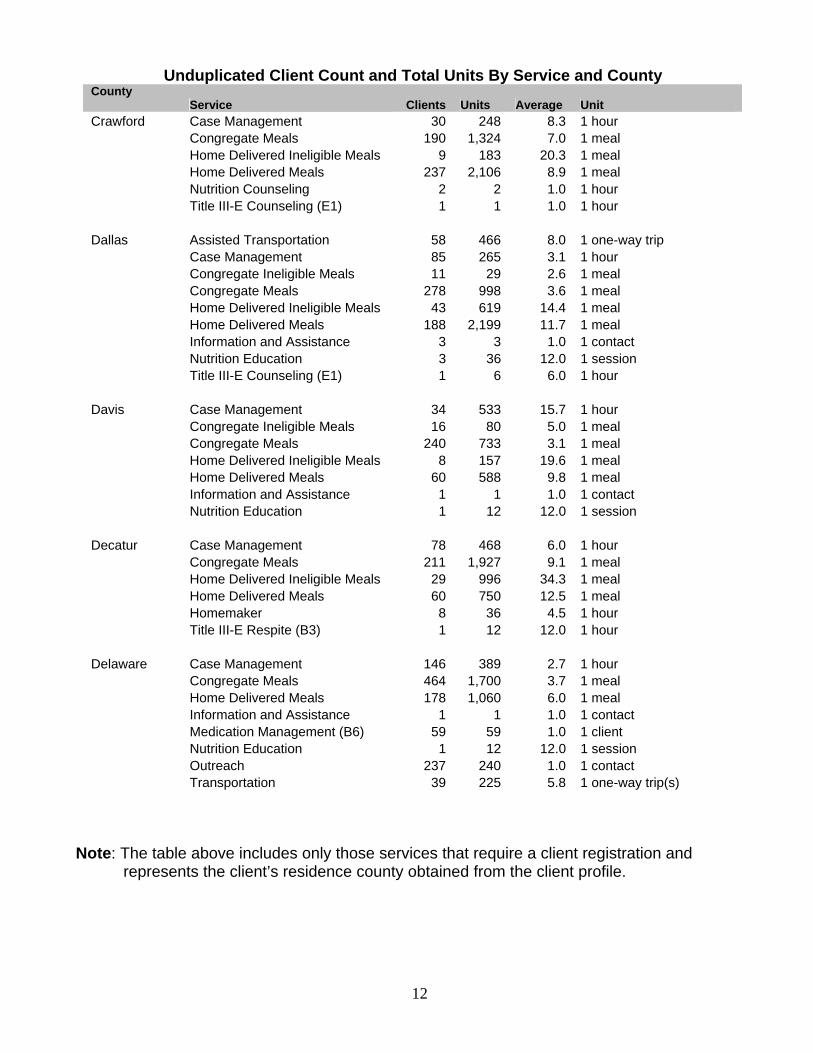
Crawford Case Management 30 248 8.3 1 hour Congregate Meals 190 1,324 7.0 1 meal Home Delivered Ineligible Meals 9 183 20.3 1 meal Home Delivered Meals 237 2,106 8.9 1 meal Nutrition Counseling 2 2 1.0 1 hour Title III-E Counseling (E1) 1 1 1.0 1 hour Dallas Assisted Transportation 58 466 8.0 1 one-way trip Case Management 85 265 3.1 1 hour Congregate Ineligible Meals 11 29 2.6 1 meal Congregate Meals 278 998 3.6 1 meal Home Delivered Ineligible Meals 43 619 14.4 1 meal Home Delivered Meals 188 2,199 11.7 1 meal Information and Assistance 3 3 1.0 1 contact Nutrition Education 3 36 12.0 1 session Title III-E Counseling (E1) 1 6 6.0 1 hour Davis Case Management 34 533 15.7 1 hour Congregate Ineligible Meals 16 80 5.0 1 meal Congregate Meals 240 733 3.1 1 meal Home Delivered Ineligible Meals 8 157 19.6 1 meal Home Delivered Meals 60 588 9.8 1 meal Information and Assistance 1 1 1.0 1 contact Nutrition Education 1 12 12.0 1 session Decatur Case Management 78 468 6.0 1 hour Congregate Meals 211 1,927 9.1 1 meal Home Delivered Ineligible Meals 29 996 34.3 1 meal Home Delivered Meals 60 750 12.5 1 meal Homemaker 8 36 4.5 1 hour Title III-E Respite (B3) 1 12 12.0 1 hour Delaware Case Management 146 389 2.7 1 hour Congregate Meals 464 1,700 3.7 1 meal Home Delivered Meals 178 1,060 6.0 1 meal Information and Assistance 1 1 1.0 1 contact Medication Management (B6) 59 59 1.0 1 client Nutrition Education 1 12 12.0 1 session Outreach 237 240 1.0 1 contact Transportation 39 225 5.8 1 one-way trip(s)
Note: The table above includes only those services that require a client registration and represents the client’s residence county obtained from the client profile.
12
Unduplicated Client Count and Total Units By Service and County
13
County Service
Clients Units Average Unit
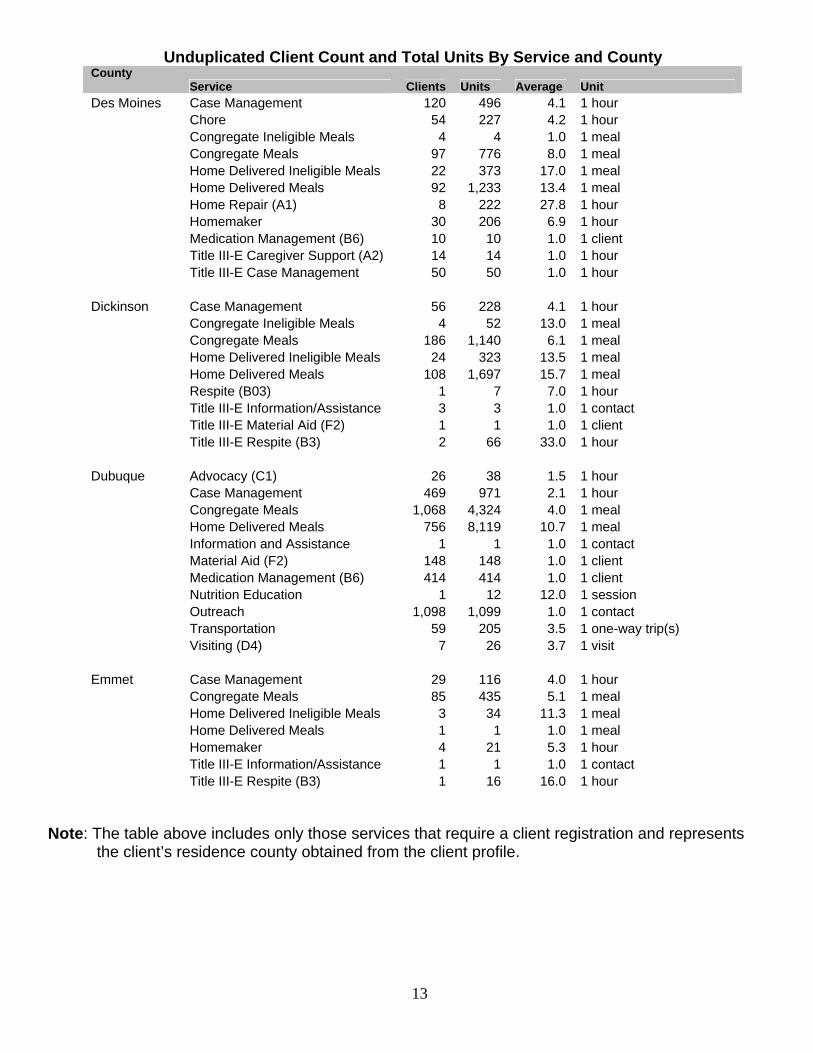
Des Moines Case Management 120 496 4.1 1 hour Chore 54 227 4.2 1 hour Congregate Ineligible Meals 4 4 1.0 1 meal Congregate Meals 97 776 8.0 1 meal Home Delivered Ineligible Meals 22 373 17.0 1 meal Home Delivered Meals 92 1,233 13.4 1 meal Home Repair (A1) 8 222 27.8 1 hour Homemaker 30 206 6.9 1 hour Medication Management (B6) 10 10 1.0 1 client Title III-E Caregiver Support (A2) 14 14 1.0 1 hour Title III-E Case Management 50 50 1.0 1 hour Dickinson Case Management 56 228 4.1 1 hour Congregate Ineligible Meals 4 52 13.0 1 meal Congregate Meals 186 1,140 6.1 1 meal Home Delivered Ineligible Meals 24 323 13.5 1 meal Home Delivered Meals 108 1,697 15.7 1 meal Respite (B03) 1 7 7.0 1 hour Title III-E Information/Assistance 3 3 1.0 1 contact Title III-E Material Aid (F2) 1 1 1.0 1 client Title III-E Respite (B3) 2 66 33.0 1 hour Dubuque Advocacy (C1) 26 38 1.5 1 hour Case Management 469 971 2.1 1 hour Congregate Meals 1,068 4,324 4.0 1 meal Home Delivered Meals 756 8,119 10.7 1 meal Information and Assistance 1 1 1.0 1 contact Material Aid (F2) 148 148 1.0 1 client Medication Management (B6) 414 414 1.0 1 client Nutrition Education 1 12 12.0 1 session Outreach 1,098 1,099 1.0 1 contact Transportation 59 205 3.5 1 one-way trip(s) Visiting (D4) 7 26 3.7 1 visit Emmet Case Management 29 116 4.0 1 hour Congregate Meals 85 435 5.1 1 meal Home Delivered Ineligible Meals 3 34 11.3 1 meal Home Delivered Meals 1 1 1.0 1 meal Homemaker 4 21 5.3 1 hour Title III-E Information/Assistance 1 1 1.0 1 contact Title III-E Respite (B3) 1 16 16.0 1 hour
Note: The table above includes only those services that require a client registration and represents the client’s residence county obtained from the client profile.
Unduplicated Client Count and Total Units By Service and County
County Service
Clients Units Average Unit
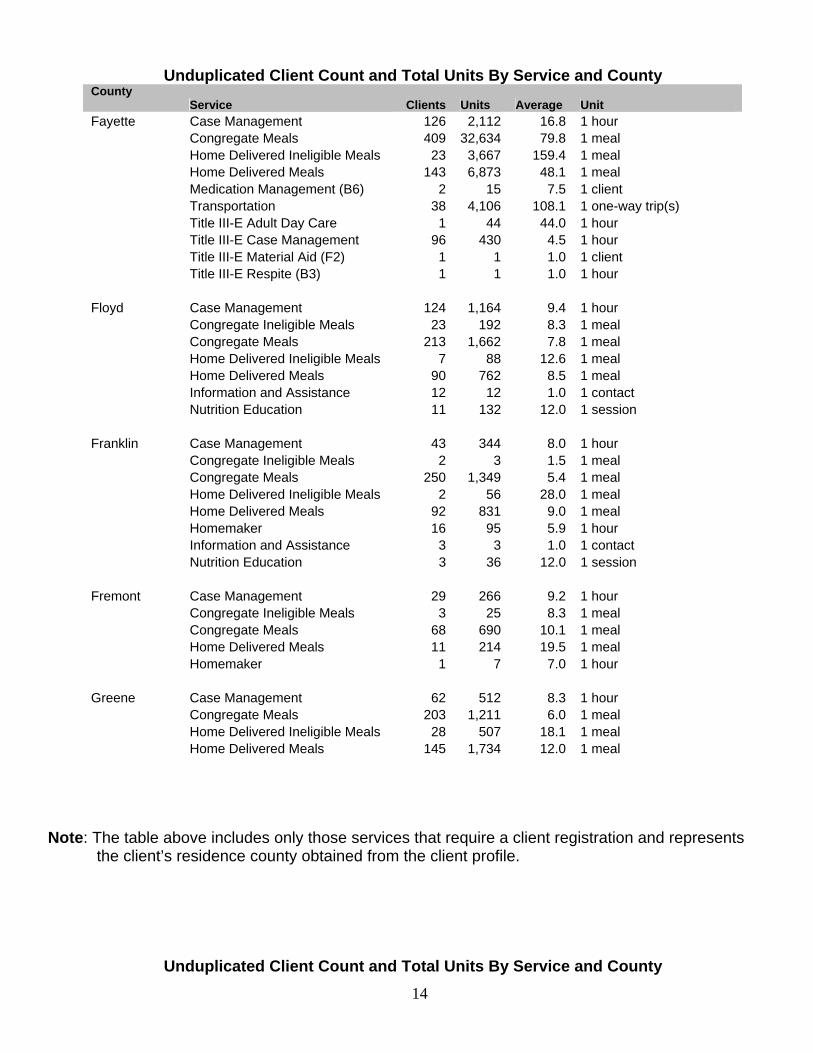
Fayette Case Management 126 2,112 16.8 1 hour Congregate Meals 409 32,634 79.8 1 meal Home Delivered Ineligible Meals 23 3,667 159.4 1 meal Home Delivered Meals 143 6,873 48.1 1 meal Medication Management (B6) 2 15 7.5 1 client Transportation 38 4,106 108.1 1 one-way trip(s) Title III-E Adult Day Care 1 44 44.0 1 hour Title III-E Case Management 96 430 4.5 1 hour Title III-E Material Aid (F2) 1 1 1.0 1 client Title III-E Respite (B3) 1 1 1.0 1 hour Floyd Case Management 124 1,164 9.4 1 hour Congregate Ineligible Meals 23 192 8.3 1 meal Congregate Meals 213 1,662 7.8 1 meal Home Delivered Ineligible Meals 7 88 12.6 1 meal Home Delivered Meals 90 762 8.5 1 meal Information and Assistance 12 12 1.0 1 contact Nutrition Education 11 132 12.0 1 session Franklin Case Management 43 344 8.0 1 hour Congregate Ineligible Meals 2 3 1.5 1 meal Congregate Meals 250 1,349 5.4 1 meal Home Delivered Ineligible Meals 2 56 28.0 1 meal Home Delivered Meals 92 831 9.0 1 meal Homemaker 16 95 5.9 1 hour Information and Assistance 3 3 1.0 1 contact Nutrition Education 3 36 12.0 1 session Fremont Case Management 29 266 9.2 1 hour Congregate Ineligible Meals 3 25 8.3 1 meal Congregate Meals 68 690 10.1 1 meal Home Delivered Meals 11 214 19.5 1 meal Homemaker 1 7 7.0 1 hour Greene Case Management 62 512 8.3 1 hour Congregate Meals 203 1,211 6.0 1 meal Home Delivered Ineligible Meals 28 507 18.1 1 meal Home Delivered Meals 145 1,734 12.0 1 meal
Note: The table above includes only those services that require a client registration and represents the client’s residence county obtained from the client profile.
Unduplicated Client Count and Total Units By Service and County
14
County Service
Clients Units Average Unit
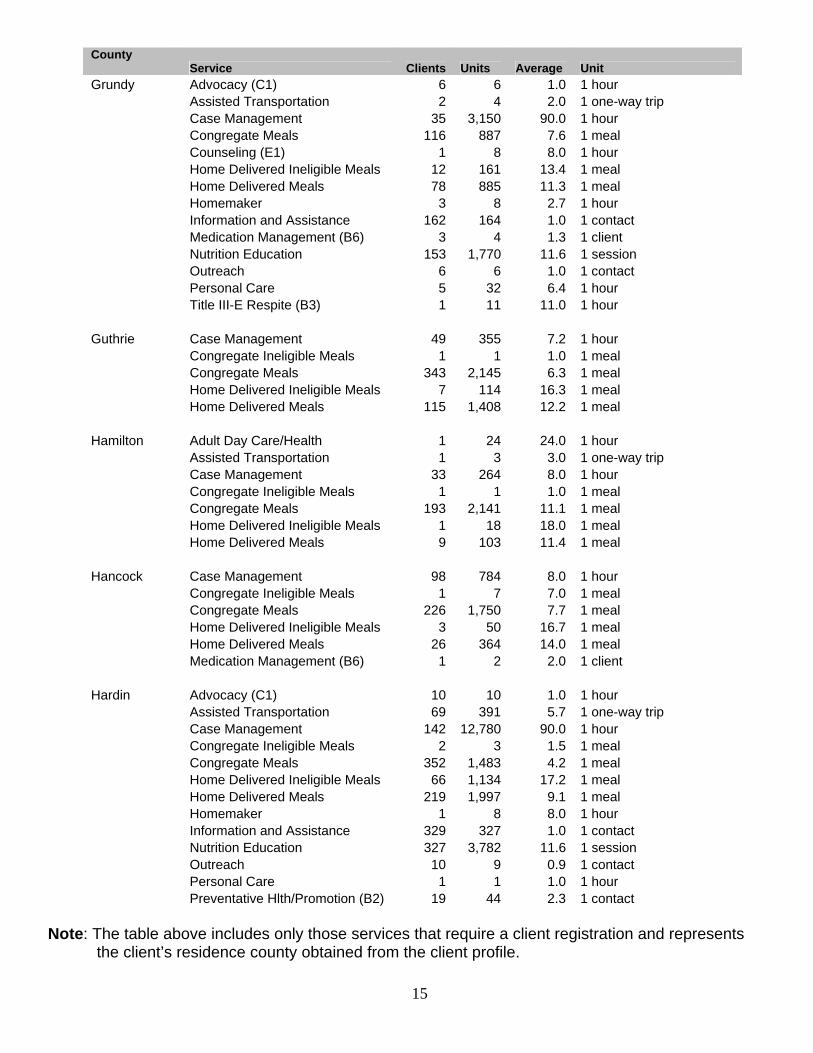
Grundy Advocacy (C1) 6 6 1.0 1 hour Assisted Transportation 2 4 2.0 1 one-way trip Case Management 35 3,150 90.0 1 hour Congregate Meals 116 887 7.6 1 meal Counseling (E1) 1 8 8.0 1 hour Home Delivered Ineligible Meals 12 161 13.4 1 meal Home Delivered Meals 78 885 11.3 1 meal Homemaker 3 8 2.7 1 hour Information and Assistance 162 164 1.0 1 contact Medication Management (B6) 3 4 1.3 1 client Nutrition Education 153 1,770 11.6 1 session Outreach 6 6 1.0 1 contact Personal Care 5 32 6.4 1 hour Title III-E Respite (B3) 1 11 11.0 1 hour Guthrie Case Management 49 355 7.2 1 hour Congregate Ineligible Meals 1 1 1.0 1 meal Congregate Meals 343 2,145 6.3 1 meal Home Delivered Ineligible Meals 7 114 16.3 1 meal Home Delivered Meals 115 1,408 12.2 1 meal Hamilton Adult Day Care/Health 1 24 24.0 1 hour Assisted Transportation 1 3 3.0 1 one-way trip Case Management 33 264 8.0 1 hour Congregate Ineligible Meals 1 1 1.0 1 meal Congregate Meals 193 2,141 11.1 1 meal Home Delivered Ineligible Meals 1 18 18.0 1 meal Home Delivered Meals 9 103 11.4 1 meal Hancock Case Management 98 784 8.0 1 hour Congregate Ineligible Meals 1 7 7.0 1 meal Congregate Meals 226 1,750 7.7 1 meal Home Delivered Ineligible Meals 3 50 16.7 1 meal Home Delivered Meals 26 364 14.0 1 meal Medication Management (B6) 1 2 2.0 1 client Hardin Advocacy (C1) 10 10 1.0 1 hour Assisted Transportation 69 391 5.7 1 one-way trip Case Management 142 12,780 90.0 1 hour Congregate Ineligible Meals 2 3 1.5 1 meal Congregate Meals 352 1,483 4.2 1 meal Home Delivered Ineligible Meals 66 1,134 17.2 1 meal Home Delivered Meals 219 1,997 9.1 1 meal Homemaker 1 8 8.0 1 hour Information and Assistance 329 327 1.0 1 contact Nutrition Education 327 3,782 11.6 1 session Outreach 10 9 0.9 1 contact Personal Care 1 1 1.0 1 hour Preventative Hlth/Promotion (B2) 19 44 2.3 1 contact
Note: The table above includes only those services that require a client registration and represents the client’s residence county obtained from the client profile.
15

Unduplicated Client Count and Total Units By Service and County County
Service Clients Units Average Unit
Harrison Case Management 95 936 9.9 1 hour Congregate Ineligible Meals 8 67 8.4 1 meal Congregate Meals 259 2,168 8.4 1 meal Home Delivered Meals 85 1,238 14.6 1 meal Title III-E Respite (B3) 2 34 17.0 1 hour Henry Case Management 37 155 4.2 1 hour Congregate Ineligible Meals 3 24 8.0 1 meal Congregate Meals 349 1,439 4.1 1 meal Home Delivered Ineligible Meals 9 117 13.0 1 meal Home Delivered Meals 113 1,150 10.2 1 meal Home Repair (A1) 2 45 22.5 1 hour Medication Management (B6) 1 1 1.0 1 client Title III-E Caregiver Support (A2) 5 5 1.0 1 hour Title III-E Case Management 17 17 1.0 1 hour Howard Case Management 66 962 14.6 1 hour Congregate Meals 199 15,996 80.4 1 meal Home Delivered Ineligible Meals 9 1,067 118.6 1 meal Home Delivered Meals 73 4,859 66.6 1 meal Medication Management (B6) 4 87 21.8 1 client Transportation 22 1,912 86.9 1 one-way trip(s) Title III-E Case Management 39 160 4.1 1 hour Title III-E Respite (B3) 1 1 1.0 1 hour Humboldt Case Management 55 440 8.0 1 hour Congregate Meals 143 924 6.5 1 meal Home Delivered Ineligible Meals 17 308 18.1 1 meal Home Delivered Meals 100 1,422 14.2 1 meal Ida Case Management 22 74 3.4 1 hour Chore 9 67 7.4 1 hour Congregate Meals 118 913 7.7 1 meal Home Delivered Ineligible Meals 3 56 18.7 1 meal Home Delivered Meals 91 1,069 11.7 1 meal Homemaker 5 34 6.8 1 hour Iowa Adult Day Care/Health 1 14 14.0 1 hour Assessment/Intervention (E3) 28 135 4.8 1 hour Case Management 103 104 1.0 1 hour Congregate Meals 590 2,526 4.3 1 meal Home Delivered Meals 163 2,188 13.4 1 meal Title III-E Counseling (E1) 7 14 2.0 1 hour
Note: The table above includes only those services that require a client registration and represents the client’s residence county obtained from the client profile.
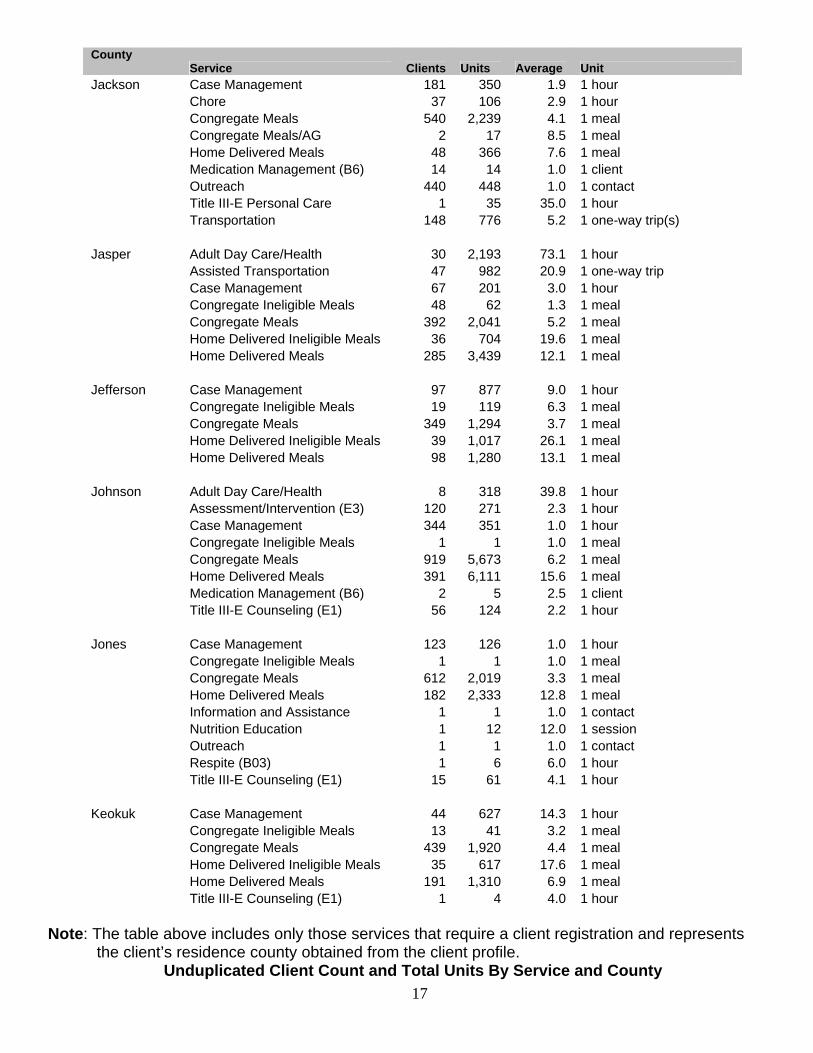
16Unduplicated Client Count and Total Units By Service and County
County Service
Clients Units Average Unit
Jackson Case Management 181 350 1.9 1 hour Chore 37 106 2.9 1 hour Congregate Meals 540 2,239 4.1 1 meal Congregate Meals/AG 2 17 8.5 1 meal Home Delivered Meals 48 366 7.6 1 meal Medication Management (B6) 14 14 1.0 1 client Outreach 440 448 1.0 1 contact Title III-E Personal Care 1 35 35.0 1 hour Transportation 148 776 5.2 1 one-way trip(s) Jasper Adult Day Care/Health 30 2,193 73.1 1 hour Assisted Transportation 47 982 20.9 1 one-way trip Case Management 67 201 3.0 1 hour Congregate Ineligible Meals 48 62 1.3 1 meal Congregate Meals 392 2,041 5.2 1 meal Home Delivered Ineligible Meals 36 704 19.6 1 meal Home Delivered Meals 285 3,439 12.1 1 meal Jefferson Case Management 97 877 9.0 1 hour Congregate Ineligible Meals 19 119 6.3 1 meal Congregate Meals 349 1,294 3.7 1 meal Home Delivered Ineligible Meals 39 1,017 26.1 1 meal Home Delivered Meals 98 1,280 13.1 1 meal Johnson Adult Day Care/Health 8 318 39.8 1 hour Assessment/Intervention (E3) 120 271 2.3 1 hour Case Management 344 351 1.0 1 hour Congregate Ineligible Meals 1 1 1.0 1 meal Congregate Meals 919 5,673 6.2 1 meal Home Delivered Meals 391 6,111 15.6 1 meal Medication Management (B6) 2 5 2.5 1 client Title III-E Counseling (E1) 56 124 2.2 1 hour Jones Case Management 123 126 1.0 1 hour Congregate Ineligible Meals 1 1 1.0 1 meal Congregate Meals 612 2,019 3.3 1 meal Home Delivered Meals 182 2,333 12.8 1 meal Information and Assistance 1 1 1.0 1 contact Nutrition Education 1 12 12.0 1 session Outreach 1 1 1.0 1 contact Respite (B03) 1 6 6.0 1 hour Title III-E Counseling (E1) 15 61 4.1 1 hour Keokuk Case Management 44 627 14.3 1 hour Congregate Ineligible Meals 13 41 3.2 1 meal Congregate Meals 439 1,920 4.4 1 meal Home Delivered Ineligible Meals 35 617 17.6 1 meal Home Delivered Meals 191 1,310 6.9 1 meal Title III-E Counseling (E1) 1 4 4.0 1 hour
Note: The table above includes only those services that require a client registration and represents the client’s residence county obtained from the client profile.
Unduplicated Client Count and Total Units By Service and County
17
County Service
Clients Units Average Unit
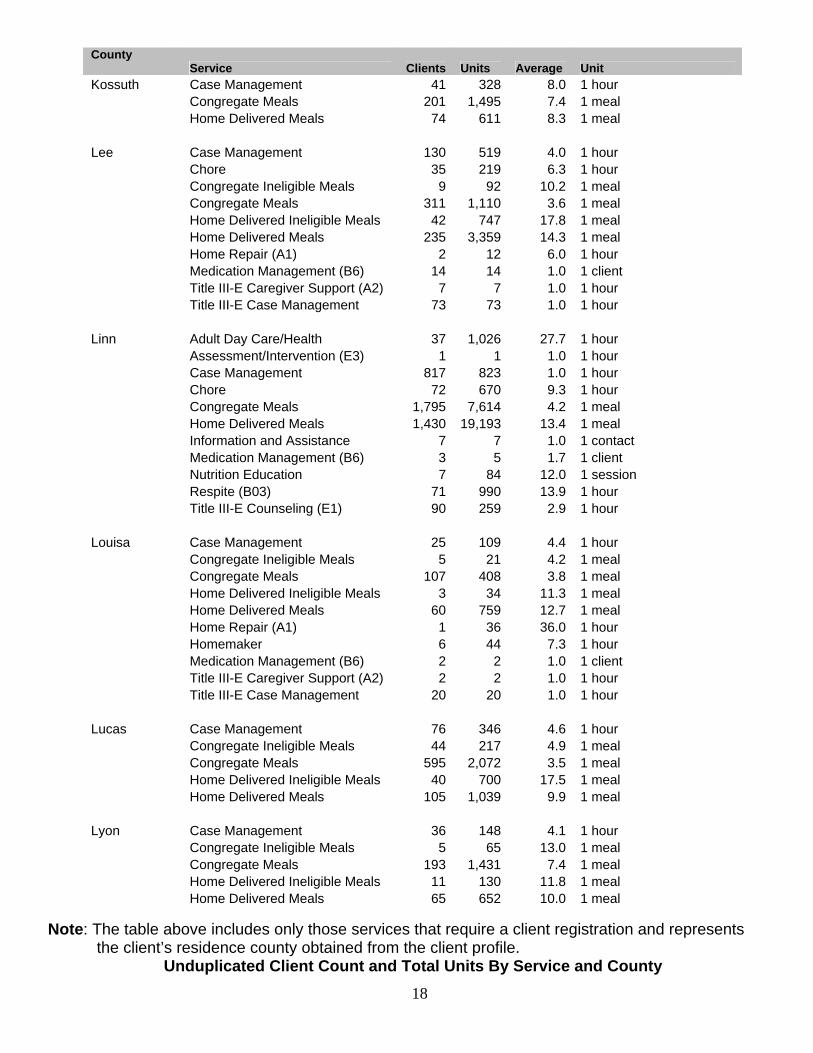
Kossuth Case Management 41 328 8.0 1 hour Congregate Meals 201 1,495 7.4 1 meal Home Delivered Meals 74 611 8.3 1 meal Lee Case Management 130 519 4.0 1 hour Chore 35 219 6.3 1 hour Congregate Ineligible Meals 9 92 10.2 1 meal Congregate Meals 311 1,110 3.6 1 meal Home Delivered Ineligible Meals 42 747 17.8 1 meal Home Delivered Meals 235 3,359 14.3 1 meal Home Repair (A1) 2 12 6.0 1 hour Medication Management (B6) 14 14 1.0 1 client Title III-E Caregiver Support (A2) 7 7 1.0 1 hour Title III-E Case Management 73 73 1.0 1 hour Linn Adult Day Care/Health 37 1,026 27.7 1 hour Assessment/Intervention (E3) 1 1 1.0 1 hour Case Management 817 823 1.0 1 hour Chore 72 670 9.3 1 hour Congregate Meals 1,795 7,614 4.2 1 meal Home Delivered Meals 1,430 19,193 13.4 1 meal Information and Assistance 7 7 1.0 1 contact Medication Management (B6) 3 5 1.7 1 client Nutrition Education 7 84 12.0 1 session Respite (B03) 71 990 13.9 1 hour Title III-E Counseling (E1) 90 259 2.9 1 hour Louisa Case Management 25 109 4.4 1 hour Congregate Ineligible Meals 5 21 4.2 1 meal Congregate Meals 107 408 3.8 1 meal Home Delivered Ineligible Meals 3 34 11.3 1 meal Home Delivered Meals 60 759 12.7 1 meal Home Repair (A1) 1 36 36.0 1 hour Homemaker 6 44 7.3 1 hour Medication Management (B6) 2 2 1.0 1 client Title III-E Caregiver Support (A2) 2 2 1.0 1 hour Title III-E Case Management 20 20 1.0 1 hour Lucas Case Management 76 346 4.6 1 hour Congregate Ineligible Meals 44 217 4.9 1 meal Congregate Meals 595 2,072 3.5 1 meal Home Delivered Ineligible Meals 40 700 17.5 1 meal Home Delivered Meals 105 1,039 9.9 1 meal Lyon Case Management 36 148 4.1 1 hour Congregate Ineligible Meals 5 65 13.0 1 meal Congregate Meals 193 1,431 7.4 1 meal Home Delivered Ineligible Meals 11 130 11.8 1 meal Home Delivered Meals 65 652 10.0 1 meal
Note: The table above includes only those services that require a client registration and represents the client’s residence county obtained from the client profile.
Unduplicated Client Count and Total Units By Service and County
18
County Service
Clients Units Average Unit
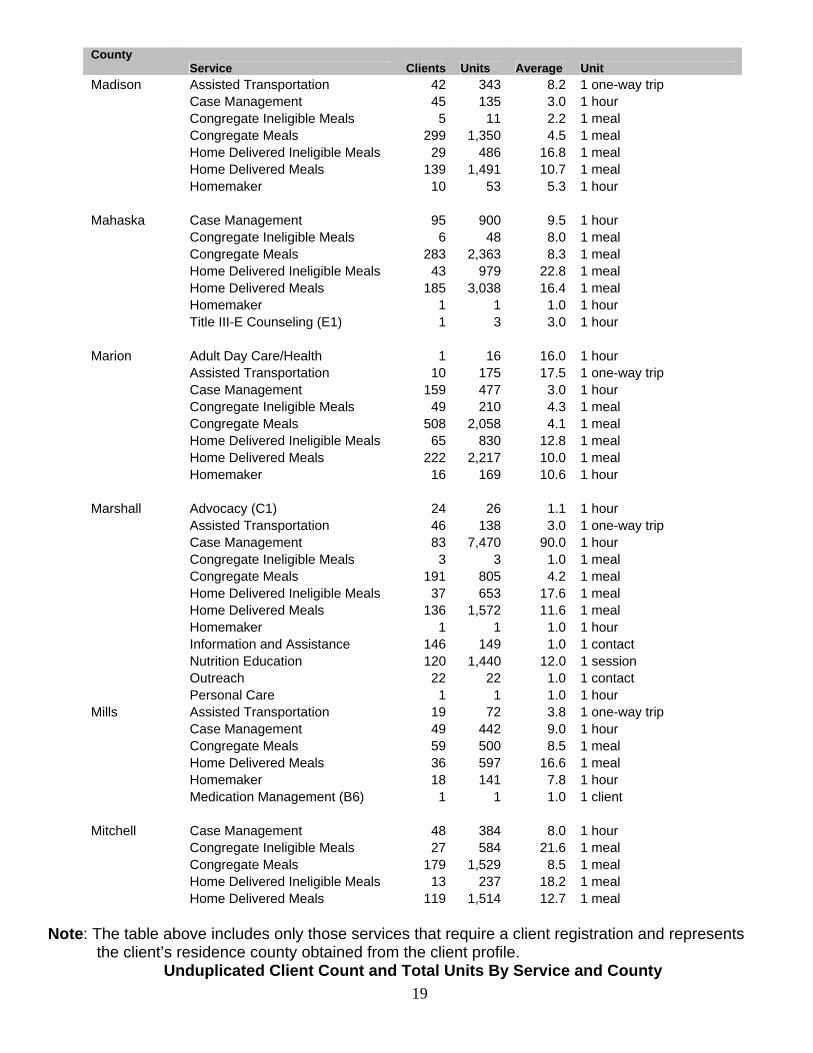
Madison Assisted Transportation 42 343 8.2 1 one-way trip Case Management 45 135 3.0 1 hour Congregate Ineligible Meals 5 11 2.2 1 meal Congregate Meals 299 1,350 4.5 1 meal Home Delivered Ineligible Meals 29 486 16.8 1 meal Home Delivered Meals 139 1,491 10.7 1 meal Homemaker 10 53 5.3 1 hour Mahaska Case Management 95 900 9.5 1 hour Congregate Ineligible Meals 6 48 8.0 1 meal Congregate Meals 283 2,363 8.3 1 meal Home Delivered Ineligible Meals 43 979 22.8 1 meal Home Delivered Meals 185 3,038 16.4 1 meal Homemaker 1 1 1.0 1 hour Title III-E Counseling (E1) 1 3 3.0 1 hour Marion Adult Day Care/Health 1 16 16.0 1 hour Assisted Transportation 10 175 17.5 1 one-way trip Case Management 159 477 3.0 1 hour Congregate Ineligible Meals 49 210 4.3 1 meal Congregate Meals 508 2,058 4.1 1 meal Home Delivered Ineligible Meals 65 830 12.8 1 meal Home Delivered Meals 222 2,217 10.0 1 meal Homemaker 16 169 10.6 1 hour Marshall Advocacy (C1) 24 26 1.1 1 hour Assisted Transportation 46 138 3.0 1 one-way trip Case Management 83 7,470 90.0 1 hour Congregate Ineligible Meals 3 3 1.0 1 meal Congregate Meals 191 805 4.2 1 meal Home Delivered Ineligible Meals 37 653 17.6 1 meal Home Delivered Meals 136 1,572 11.6 1 meal Homemaker 1 1 1.0 1 hour Information and Assistance 146 149 1.0 1 contact Nutrition Education 120 1,440 12.0 1 session Outreach 22 22 1.0 1 contact Personal Care 1 1 1.0 1 hour Mills Assisted Transportation 19 72 3.8 1 one-way trip Case Management 49 442 9.0 1 hour Congregate Meals 59 500 8.5 1 meal Home Delivered Meals 36 597 16.6 1 meal Homemaker 18 141 7.8 1 hour Medication Management (B6) 1 1 1.0 1 client Mitchell Case Management 48 384 8.0 1 hour Congregate Ineligible Meals 27 584 21.6 1 meal Congregate Meals 179 1,529 8.5 1 meal Home Delivered Ineligible Meals 13 237 18.2 1 meal Home Delivered Meals 119 1,514 12.7 1 meal
Note: The table above includes only those services that require a client registration and represents the client’s residence county obtained from the client profile.
Unduplicated Client Count and Total Units By Service and County
19
County Service
Clients Units Average Unit
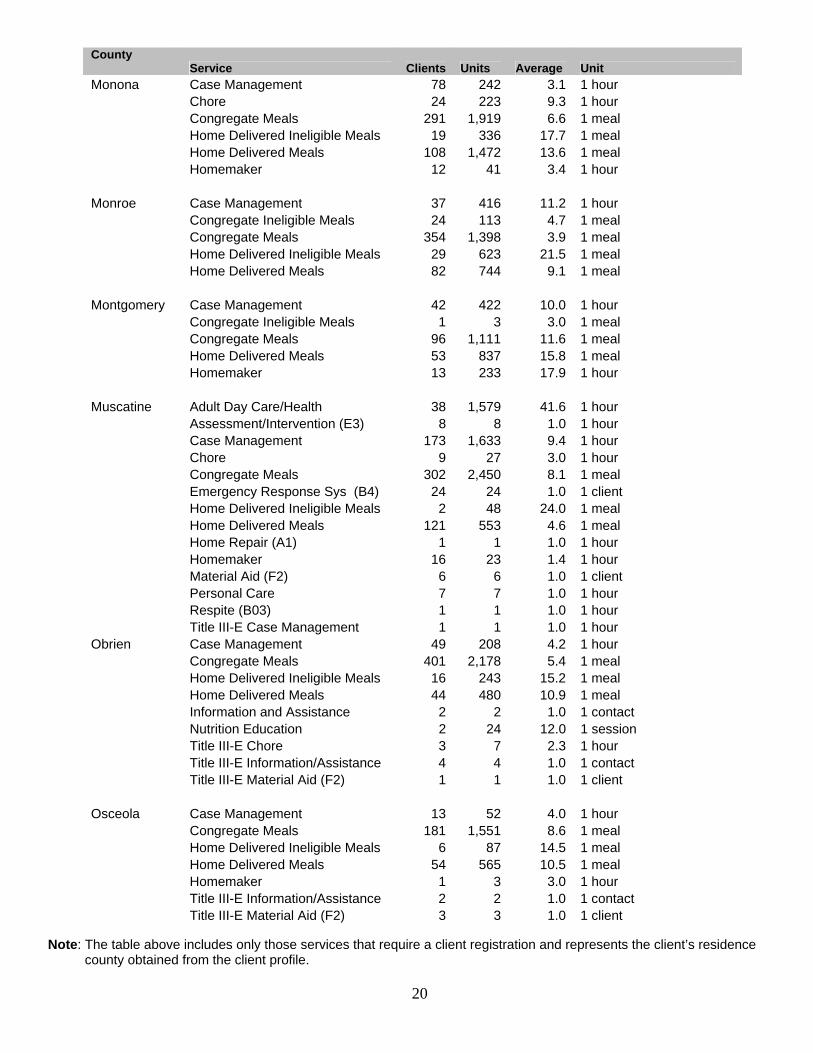
Monona Case Management 78 242 3.1 1 hour Chore 24 223 9.3 1 hour Congregate Meals 291 1,919 6.6 1 meal Home Delivered Ineligible Meals 19 336 17.7 1 meal Home Delivered Meals 108 1,472 13.6 1 meal Homemaker 12 41 3.4 1 hour Monroe Case Management 37 416 11.2 1 hour Congregate Ineligible Meals 24 113 4.7 1 meal Congregate Meals 354 1,398 3.9 1 meal Home Delivered Ineligible Meals 29 623 21.5 1 meal Home Delivered Meals 82 744 9.1 1 meal Montgomery Case Management 42 422 10.0 1 hour Congregate Ineligible Meals 1 3 3.0 1 meal Congregate Meals 96 1,111 11.6 1 meal Home Delivered Meals 53 837 15.8 1 meal Homemaker 13 233 17.9 1 hour Muscatine Adult Day Care/Health 38 1,579 41.6 1 hour Assessment/Intervention (E3) 8 8 1.0 1 hour Case Management 173 1,633 9.4 1 hour Chore 9 27 3.0 1 hour Congregate Meals 302 2,450 8.1 1 meal Emergency Response Sys (B4) 24 24 1.0 1 client Home Delivered Ineligible Meals 2 48 24.0 1 meal Home Delivered Meals 121 553 4.6 1 meal Home Repair (A1) 1 1 1.0 1 hour Homemaker 16 23 1.4 1 hour Material Aid (F2) 6 6 1.0 1 client Personal Care 7 7 1.0 1 hour Respite (B03) 1 1 1.0 1 hour Title III-E Case Management 1 1 1.0 1 hour Obrien Case Management 49 208 4.2 1 hour Congregate Meals 401 2,178 5.4 1 meal Home Delivered Ineligible Meals 16 243 15.2 1 meal Home Delivered Meals 44 480 10.9 1 meal Information and Assistance 2 2 1.0 1 contact Nutrition Education 2 24 12.0 1 session Title III-E Chore 3 7 2.3 1 hour Title III-E Information/Assistance 4 4 1.0 1 contact Title III-E Material Aid (F2) 1 1 1.0 1 client Osceola Case Management 13 52 4.0 1 hour Congregate Meals 181 1,551 8.6 1 meal Home Delivered Ineligible Meals 6 87 14.5 1 meal Home Delivered Meals 54 565 10.5 1 meal Homemaker 1 3 3.0 1 hour Title III-E Information/Assistance 2 2 1.0 1 contact Title III-E Material Aid (F2) 3 3 1.0 1 client
Note: The table above includes only those services that require a client registration and represents the client’s residence county obtained from the client profile.
20

Unduplicated Client Count and Total Units By Service and County County
Service Clients Units Average Unit
Page Case Management 97 844 8.7 1 hour Congregate Meals 103 1,029 10.0 1 meal Home Delivered Meals 82 1,374 16.8 1 meal Homemaker 15 156 10.4 1 hour Palo Alto Case Management 19 80 4.2 1 hour Congregate Ineligible Meals 5 16 3.2 1 meal Congregate Meals 273 1,588 5.8 1 meal Home Delivered Ineligible Meals 3 30 10.0 1 meal Home Delivered Meals 88 1,054 12.0 1 meal Title III-E Information/Assistance 1 1 1.0 1 contact Title III-E Material Aid (F2) 1 1 1.0 1 client Plymouth Assisted Transportation 1 8 8.0 1 one-way trip Case Management 82 264 3.2 1 hour Congregate Ineligible Meals 8 96 12.0 1 meal Congregate Meals 498 3,967 8.0 1 meal Home Delivered Ineligible Meals 32 487 15.2 1 meal Home Delivered Meals 212 2,169 10.2 1 meal Homemaker 16 105 6.6 1 hour Personal Care 8 65 8.1 1 hour Pocahontas Case Management 40 320 8.0 1 hour Congregate Meals 216 1,997 9.2 1 meal Home Delivered Ineligible Meals 18 275 15.3 1 meal Home Delivered Meals 111 1,684 15.2 1 meal Polk Adult Day Care/Health 115 8,309 72.3 1 hour Assisted Transportation 62 1,209 19.5 1 one-way trip Case Management 601 1,809 3.0 1 hour Chore 206 915 4.4 1 hour Congregate Ineligible Meals 154 646 4.2 1 meal Congregate Meals 3,274 16,917 5.2 1 meal Home Delivered Ineligible Meals 922 13,638 14.8 1 meal Home Delivered Meals 1,000 15,546 15.5 1 meal Homemaker 87 507 5.8 1 hour Personal Care 29 116 4.0 1 hour Pottawattamie Case Management 322 2,886 9.0 1 hour Chore 22 123 5.6 1 hour Congregate Ineligible Meals 7 55 7.9 1 meal Congregate Meals 283 2,195 7.8 1 meal Home Delivered Meals 128 2,219 17.3 1 meal Medication Management (B6) 45 45 1.0 1 client
Note: The table above includes only those services that require a client registration and represents the client’s residence county obtained from the client profile.
21
Unduplicated Client Count and Total Units By Service and County County
Service Clients Units Average Unit
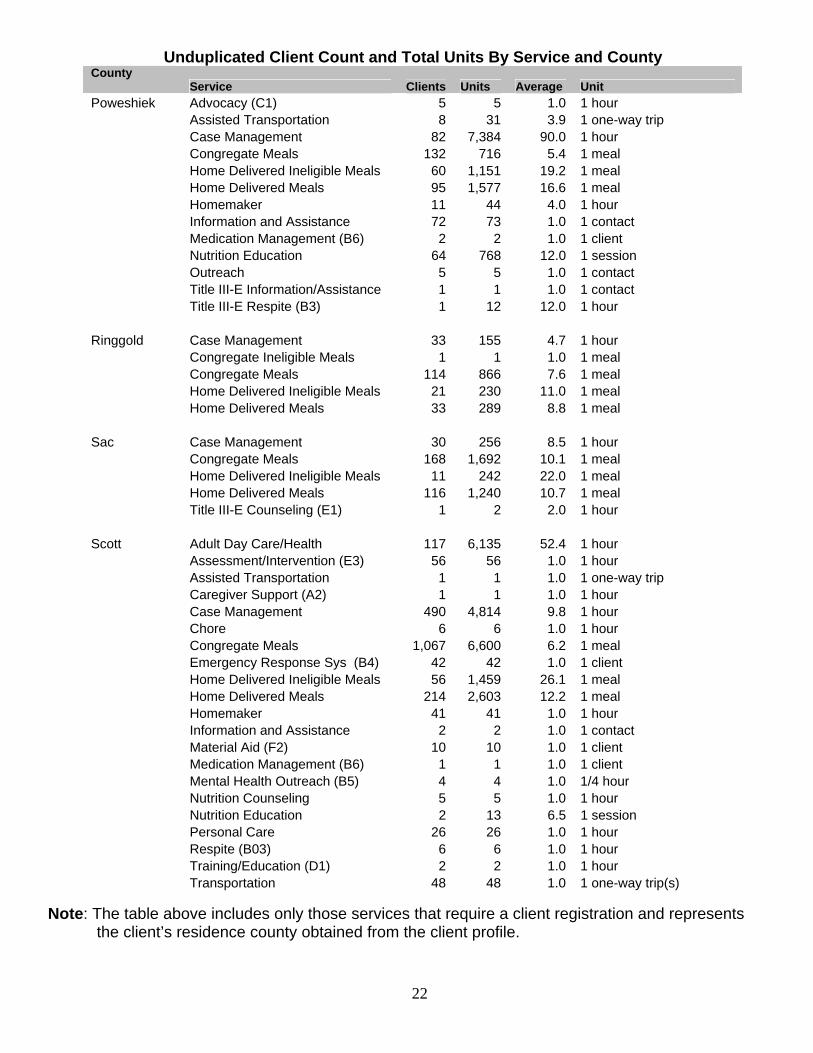
Poweshiek Advocacy (C1) 5 5 1.0 1 hour Assisted Transportation 8 31 3.9 1 one-way trip Case Management 82 7,384 90.0 1 hour Congregate Meals 132 716 5.4 1 meal Home Delivered Ineligible Meals 60 1,151 19.2 1 meal Home Delivered Meals 95 1,577 16.6 1 meal Homemaker 11 44 4.0 1 hour Information and Assistance 72 73 1.0 1 contact Medication Management (B6) 2 2 1.0 1 client Nutrition Education 64 768 12.0 1 session Outreach 5 5 1.0 1 contact Title III-E Information/Assistance 1 1 1.0 1 contact Title III-E Respite (B3) 1 12 12.0 1 hour Ringgold Case Management 33 155 4.7 1 hour Congregate Ineligible Meals 1 1 1.0 1 meal Congregate Meals 114 866 7.6 1 meal Home Delivered Ineligible Meals 21 230 11.0 1 meal Home Delivered Meals 33 289 8.8 1 meal Sac Case Management 30 256 8.5 1 hour Congregate Meals 168 1,692 10.1 1 meal Home Delivered Ineligible Meals 11 242 22.0 1 meal Home Delivered Meals 116 1,240 10.7 1 meal Title III-E Counseling (E1) 1 2 2.0 1 hour Scott Adult Day Care/Health 117 6,135 52.4 1 hour Assessment/Intervention (E3) 56 56 1.0 1 hour Assisted Transportation 1 1 1.0 1 one-way trip Caregiver Support (A2) 1 1 1.0 1 hour Case Management 490 4,814 9.8 1 hour Chore 6 6 1.0 1 hour Congregate Meals 1,067 6,600 6.2 1 meal Emergency Response Sys (B4) 42 42 1.0 1 client Home Delivered Ineligible Meals 56 1,459 26.1 1 meal Home Delivered Meals 214 2,603 12.2 1 meal Homemaker 41 41 1.0 1 hour Information and Assistance 2 2 1.0 1 contact Material Aid (F2) 10 10 1.0 1 client Medication Management (B6) 1 1 1.0 1 client Mental Health Outreach (B5) 4 4 1.0 1/4 hour Nutrition Counseling 5 5 1.0 1 hour Nutrition Education 2 13 6.5 1 session Personal Care 26 26 1.0 1 hour Respite (B03) 6 6 1.0 1 hour Training/Education (D1) 2 2 1.0 1 hour Transportation 48 48 1.0 1 one-way trip(s)
Note: The table above includes only those services that require a client registration and represents the client’s residence county obtained from the client profile.
22
Unduplicated Client Count and Total Units By Service and County County
Service Clients Units Average Unit
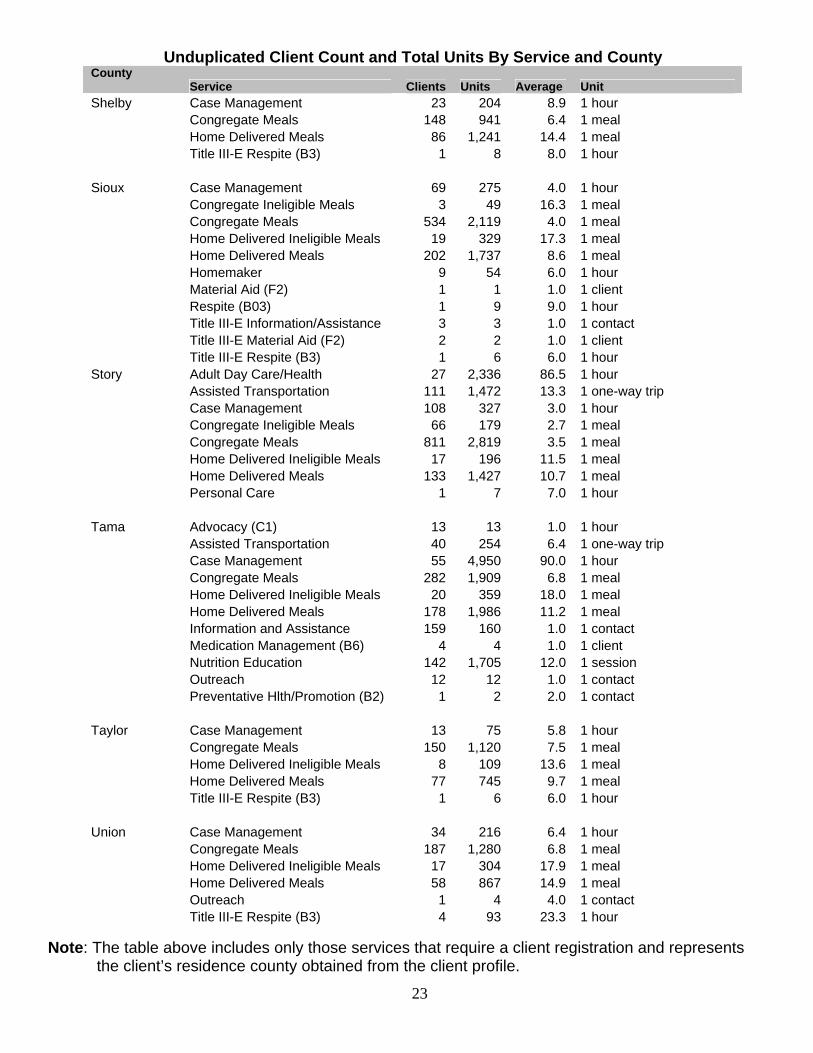
Shelby Case Management 23 204 8.9 1 hour Congregate Meals 148 941 6.4 1 meal Home Delivered Meals 86 1,241 14.4 1 meal Title III-E Respite (B3) 1 8 8.0 1 hour Sioux Case Management 69 275 4.0 1 hour Congregate Ineligible Meals 3 49 16.3 1 meal Congregate Meals 534 2,119 4.0 1 meal Home Delivered Ineligible Meals 19 329 17.3 1 meal Home Delivered Meals 202 1,737 8.6 1 meal Homemaker 9 54 6.0 1 hour Material Aid (F2) 1 1 1.0 1 client Respite (B03) 1 9 9.0 1 hour Title III-E Information/Assistance 3 3 1.0 1 contact Title III-E Material Aid (F2) 2 2 1.0 1 client Title III-E Respite (B3) 1 6 6.0 1 hour Story Adult Day Care/Health 27 2,336 86.5 1 hour Assisted Transportation 111 1,472 13.3 1 one-way trip Case Management 108 327 3.0 1 hour Congregate Ineligible Meals 66 179 2.7 1 meal Congregate Meals 811 2,819 3.5 1 meal Home Delivered Ineligible Meals 17 196 11.5 1 meal Home Delivered Meals 133 1,427 10.7 1 meal Personal Care 1 7 7.0 1 hour Tama Advocacy (C1) 13 13 1.0 1 hour Assisted Transportation 40 254 6.4 1 one-way trip Case Management 55 4,950 90.0 1 hour Congregate Meals 282 1,909 6.8 1 meal Home Delivered Ineligible Meals 20 359 18.0 1 meal Home Delivered Meals 178 1,986 11.2 1 meal Information and Assistance 159 160 1.0 1 contact Medication Management (B6) 4 4 1.0 1 client Nutrition Education 142 1,705 12.0 1 session Outreach 12 12 1.0 1 contact Preventative Hlth/Promotion (B2) 1 2 2.0 1 contact Taylor Case Management 13 75 5.8 1 hour Congregate Meals 150 1,120 7.5 1 meal Home Delivered Ineligible Meals 8 109 13.6 1 meal Home Delivered Meals 77 745 9.7 1 meal Title III-E Respite (B3) 1 6 6.0 1 hour Union Case Management 34 216 6.4 1 hour Congregate Meals 187 1,280 6.8 1 meal Home Delivered Ineligible Meals 17 304 17.9 1 meal Home Delivered Meals 58 867 14.9 1 meal Outreach 1 4 4.0 1 contact Title III-E Respite (B3) 4 93 23.3 1 hour
Note: The table above includes only those services that require a client registration and represents the client’s residence county obtained from the client profile.
23
24
Unduplicated Client Count and Total Units By Service and County County
Service Clients Units Average Unit
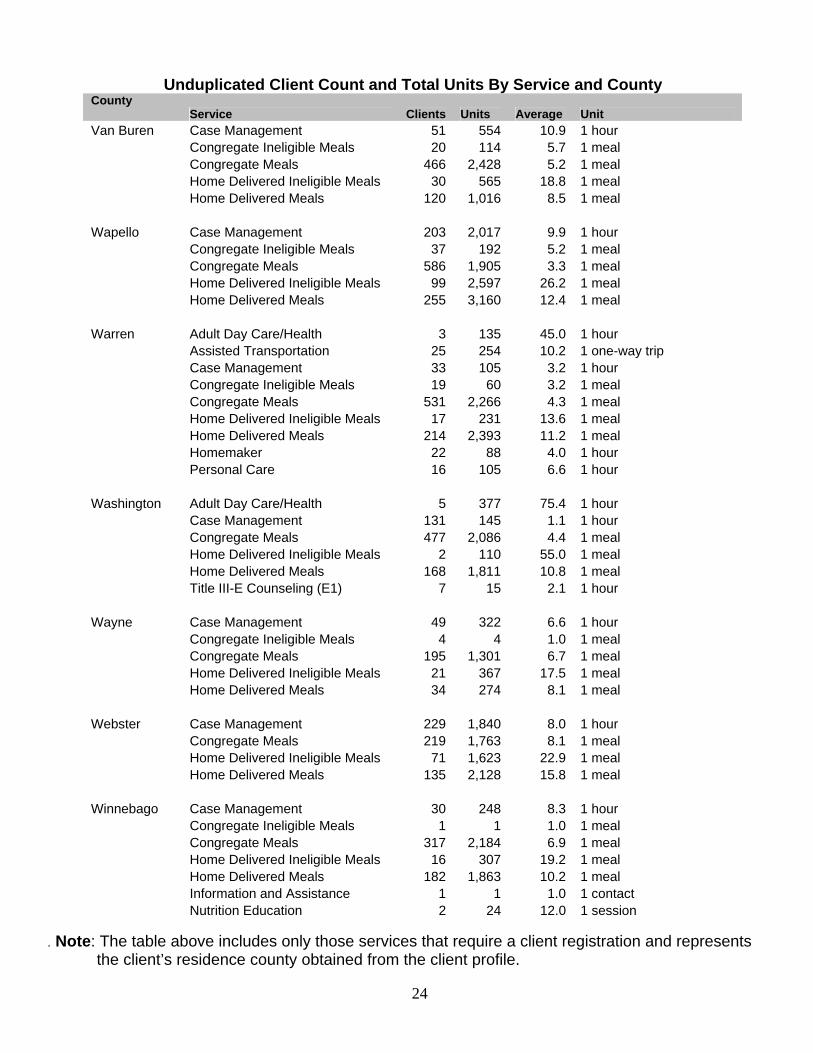
Case Management 51 554 10.9 1 hour Congregate Ineligible Meals 20 114 5.7 1 meal Congregate Meals 466 2,428 5.2 1 meal Home Delivered Ineligible Meals 30 565 18.8 1 meal Home Delivered Meals 120 1,016 8.5 1 meal Wapello Case Management 203 2,017 9.9 1 hour Congregate Ineligible Meals 37 192 5.2 1 meal Congregate Meals 586 1,905 3.3 1 meal Home Delivered Ineligible Meals 99 2,597 26.2 1 meal Home Delivered Meals 255 3,160 12.4 1 meal Warren Adult Day Care/Health 3 135 45.0 1 hour Assisted Transportation 25 254 10.2 1 one-way trip Case Management 33 105 3.2 1 hour Congregate Ineligible Meals 19 60 3.2 1 meal Congregate Meals 531 2,266 4.3 1 meal Home Delivered Ineligible Meals 17 231 13.6 1 meal Home Delivered Meals 214 2,393 11.2 1 meal Homemaker 22 88 4.0 1 hour Personal Care 16 105 6.6 1 hour Washington Adult Day Care/Health 5 377 75.4 1 hour Case Management 131 145 1.1 1 hour Congregate Meals 477 2,086 4.4 1 meal Home Delivered Ineligible Meals 2 110 55.0 1 meal Home Delivered Meals 168 1,811 10.8 1 meal Title III-E Counseling (E1) 7 15 2.1 1 hour Wayne Case Management 49 322 6.6 1 hour Congregate Ineligible Meals 4 4 1.0 1 meal Congregate Meals 195 1,301 6.7 1 meal Home Delivered Ineligible Meals 21 367 17.5 1 meal Home Delivered Meals 34 274 8.1 1 meal Webster Case Management 229 1,840 8.0 1 hour Congregate Meals 219 1,763 8.1 1 meal Home Delivered Ineligible Meals 71 1,623 22.9 1 meal Home Delivered Meals 135 2,128 15.8 1 meal Winnebago Case Management 30 248 8.3 1 hour Congregate Ineligible Meals 1 1 1.0 1 meal Congregate Meals 317 2,184 6.9 1 meal Home Delivered Ineligible Meals 16 307 19.2 1 meal Home Delivered Meals 182 1,863 10.2 1 meal Information and Assistance 1 1 1.0 1 contact Nutrition Education 2 24 12.0 1 session
. Note: The table above includes only those services that require a client registration and represents the client’s residence county obtained from the client profile.
Van Buren
25
Unduplicated Client Count and Total Units By Service and County
County Service
Clients Units Average Unit
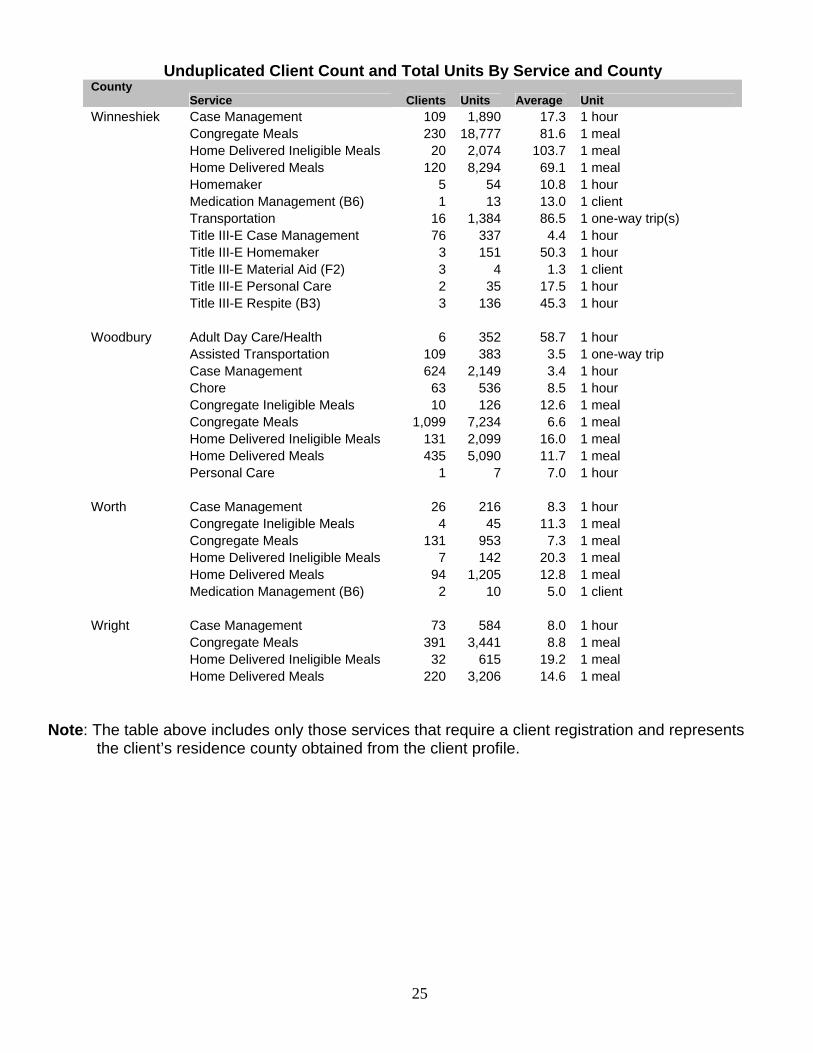
k Case Management 109 1,890 17.3 1 hour Congregate Meals 230 18,777 81.6 1 meal Home Delivered Ineligible Meals 20 2,074 103.7 1 meal Home Delivered Meals 120 8,294 69.1 1 meal Homemaker 5 54 10.8 1 hour Medication Management (B6) 1 13 13.0 1 client Transportation 16 1,384 86.5 1 one-way trip(s) Title III-E Case Management 76 337 4.4 1 hour Title III-E Homemaker 3 151 50.3 1 hour Title III-E Material Aid (F2) 3 4 1.3 1 client Title III-E Personal Care 2 35 17.5 1 hour Title III-E Respite (B3) 3 136 45.3 1 hour Woodbury Adult Day Care/Health 6 352 58.7 1 hour Assisted Transportation 109 383 3.5 1 one-way trip Case Management 624 2,149 3.4 1 hour Chore 63 536 8.5 1 hour Congregate Ineligible Meals 10 126 12.6 1 meal Congregate Meals 1,099 7,234 6.6 1 meal Home Delivered Ineligible Meals 131 2,099 16.0 1 meal Home Delivered Meals 435 5,090 11.7 1 meal Personal Care 1 7 7.0 1 hour Worth Case Management 26 216 8.3 1 hour Congregate Ineligible Meals 4 45 11.3 1 meal Congregate Meals 131 953 7.3 1 meal Home Delivered Ineligible Meals 7 142 20.3 1 meal Home Delivered Meals 94 1,205 12.8 1 meal Medication Management (B6) 2 10 5.0 1 client Wright Case Management 73 584 8.0 1 hour Congregate Meals 391 3,441 8.8 1 meal Home Delivered Ineligible Meals 32 615 19.2 1 meal Home Delivered Meals 220 3,206 14.6 1 meal
Note: The table above includes only those services that require a client registration and represents the client’s residence county obtained from the client profile.
Winneshie
26
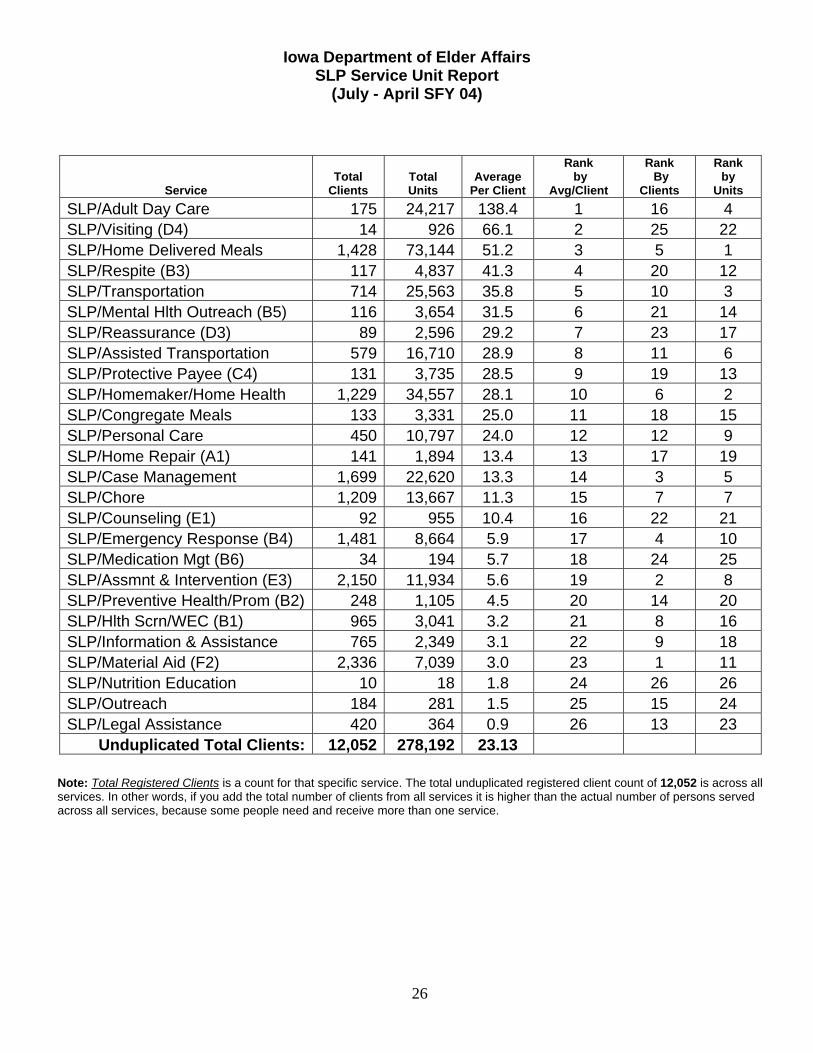
Iowa Department of Elder Affairs SLP Service Unit Report
(July - April SFY 04)
Service
Total
Clients Total Units
Average Per Client
Rank by
Avg/Client
Rank By
Clients
Rank by
Units SLP/Adult Day Care 175 24,217 138.4 1 16 4 SLP/Visiting (D4) 14 926 66.1 2 25 22 SLP/Home Delivered Meals 1,428 73,144 51.2 3 5 1 SLP/Respite (B3) 117 4,837 41.3 4 20 12 SLP/Transportation 714 25,563 35.8 5 10 3 SLP/Mental Hlth Outreach (B5) 116 3,654 31.5 6 21 14 SLP/Reassurance (D3) 89 2,596 29.2 7 23 17 SLP/Assisted Transportation 579 16,710 28.9 8 11 6 SLP/Protective Payee (C4) 131 3,735 28.5 9 19 13 SLP/Homemaker/Home Health 1,229 34,557 28.1 10 6 2 SLP/Congregate Meals 133 3,331 25.0 11 18 15 SLP/Personal Care 450 10,797 24.0 12 12 9 SLP/Home Repair (A1) 141 1,894 13.4 13 17 19 SLP/Case Management 1,699 22,620 13.3 14 3 5 SLP/Chore 1,209 13,667 11.3 15 7 7 SLP/Counseling (E1) 92 955 10.4 16 22 21 SLP/Emergency Response (B4) 1,481 8,664 5.9 17 4 10 SLP/Medication Mgt (B6) 34 194 5.7 18 24 25 SLP/Assmnt & Intervention (E3) 2,150 11,934 5.6 19 2 8 SLP/Preventive Health/Prom (B2) 248 1,105 4.5 20 14 20 SLP/Hlth Scrn/WEC (B1) 965 3,041 3.2 21 8 16 SLP/Information & Assistance 765 2,349 3.1 22 9 18 SLP/Material Aid (F2) 2,336 7,039 3.0 23 1 11 SLP/Nutrition Education 10 18 1.8 24 26 26 SLP/Outreach 184 281 1.5 25 15 24 SLP/Legal Assistance 420 364 0.9 26 13 23
Unduplicated Total Clients: 12,052 278,192 23.13
Note: Total Registered Clients is a count for that specific service. The total unduplicated registered client count of 12,052 is across all services. In other words, if you add the total number of clients from all services it is higher than the actual number of persons served across all services, because some people need and receive more than one service.
27
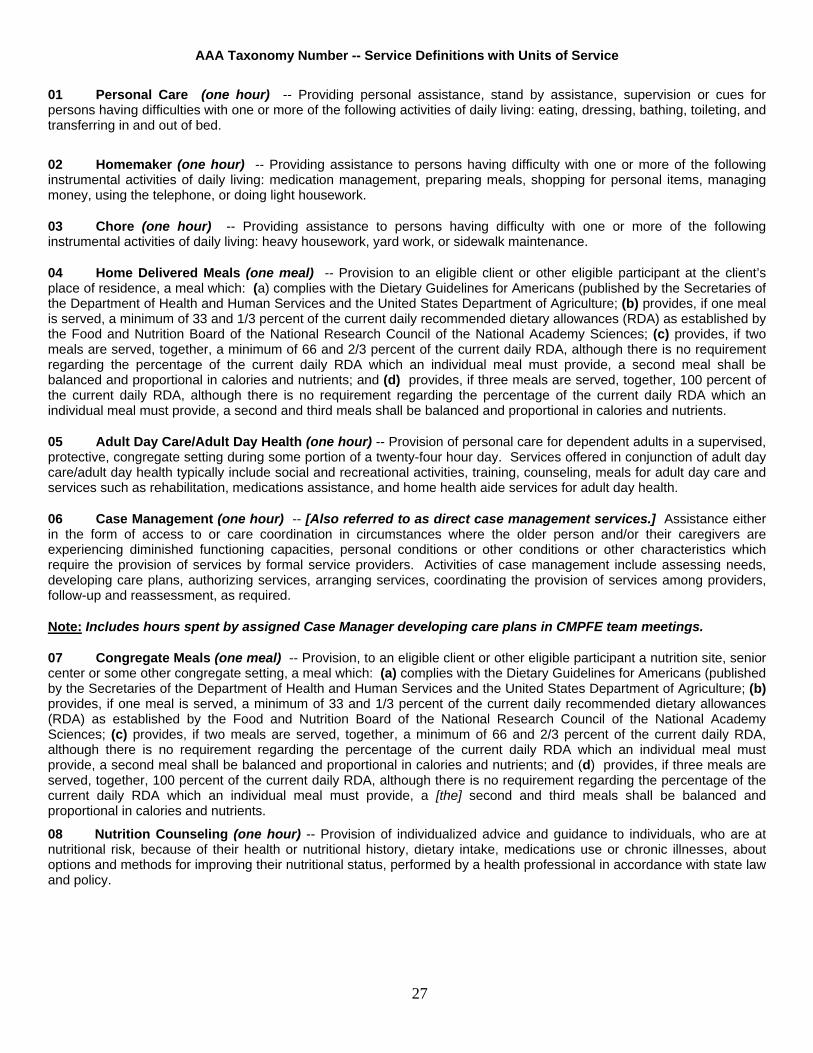
AAA Taxonomy Number -- Service Definitions with Units of Service
01 Personal Care (one hour) -- Providing personal assistance, stand by assistance, supervision or cues for persons having difficulties with one or more of the following activities of daily living: eating, dressing, bathing, toileting, and transferring in and out of bed.
02 Homemaker (one hour) -- Providing assistance to persons having difficulty with one or more of the following instrumental activities of daily living: medication management, preparing meals, shopping for personal items, managing money, using the telephone, or doing light housework.
03 Chore (one hour) -- Providing assistance to persons having difficulty with one or more of the following instrumental activities of daily living: heavy housework, yard work, or sidewalk maintenance.
04 Home Delivered Meals (one meal) -- Provision to an eligible client or other eligible participant at the client’s place of residence, a meal which: (a) complies with the Dietary Guidelines for Americans (published by the Secretaries of the Department of Health and Human Services and the United States Department of Agriculture; (b) provides, if one meal is served, a minimum of 33 and 1/3 percent of the current daily recommended dietary allowances (RDA) as established by the Food and Nutrition Board of the National Research Council of the National Academy Sciences; (c) provides, if two meals are served, together, a minimum of 66 and 2/3 percent of the current daily RDA, although there is no requirement regarding the percentage of the current daily RDA which an individual meal must provide, a second meal shall be balanced and proportional in calories and nutrients; and (d) provides, if three meals are served, together, 100 percent of the current daily RDA, although there is no requirement regarding the percentage of the current daily RDA which an individual meal must provide, a second and third meals shall be balanced and proportional in calories and nutrients.
05 Adult Day Care/Adult Day Health (one hour) -- Provision of personal care for dependent adults in a supervised, protective, congregate setting during some portion of a twenty-four hour day. Services offered in conjunction of adult day care/adult day health typically include social and recreational activities, training, counseling, meals for adult day care and services such as rehabilitation, medications assistance, and home health aide services for adult day health.
06 Case Management (one hour) -- [Also referred to as direct case management services.] Assistance either in the form of access to or care coordination in circumstances where the older person and/or their caregivers are experiencing diminished functioning capacities, personal conditions or other conditions or other characteristics which require the provision of services by formal service providers. Activities of case management include assessing needs, developing care plans, authorizing services, arranging services, coordinating the provision of services among providers, follow-up and reassessment, as required.
Note: Includes hours spent by assigned Case Manager developing care plans in CMPFE team meetings.
07 Congregate Meals (one meal) -- Provision, to an eligible client or other eligible participant a nutrition site, senior center or some other congregate setting, a meal which: (a) complies with the Dietary Guidelines for Americans (published by the Secretaries of the Department of Health and Human Services and the United States Department of Agriculture; (b) provides, if one meal is served, a minimum of 33 and 1/3 percent of the current daily recommended dietary allowances (RDA) as established by the Food and Nutrition Board of the National Research Council of the National Academy Sciences; (c) provides, if two meals are served, together, a minimum of 66 and 2/3 percent of the current daily RDA, although there is no requirement regarding the percentage of the current daily RDA which an individual meal must provide, a second meal shall be balanced and proportional in calories and nutrients; and (d) provides, if three meals are served, together, 100 percent of the current daily RDA, although there is no requirement regarding the percentage of the current daily RDA which an individual meal must provide, a [the] second and third meals shall be balanced and proportional in calories and nutrients.
08 Nutrition Counseling (one hour) -- Provision of individualized advice and guidance to individuals, who are at nutritional risk, because of their health or nutritional history, dietary intake, medications use or chronic illnesses, about options and methods for improving their nutritional status, performed by a health professional in accordance with state law and policy.
28
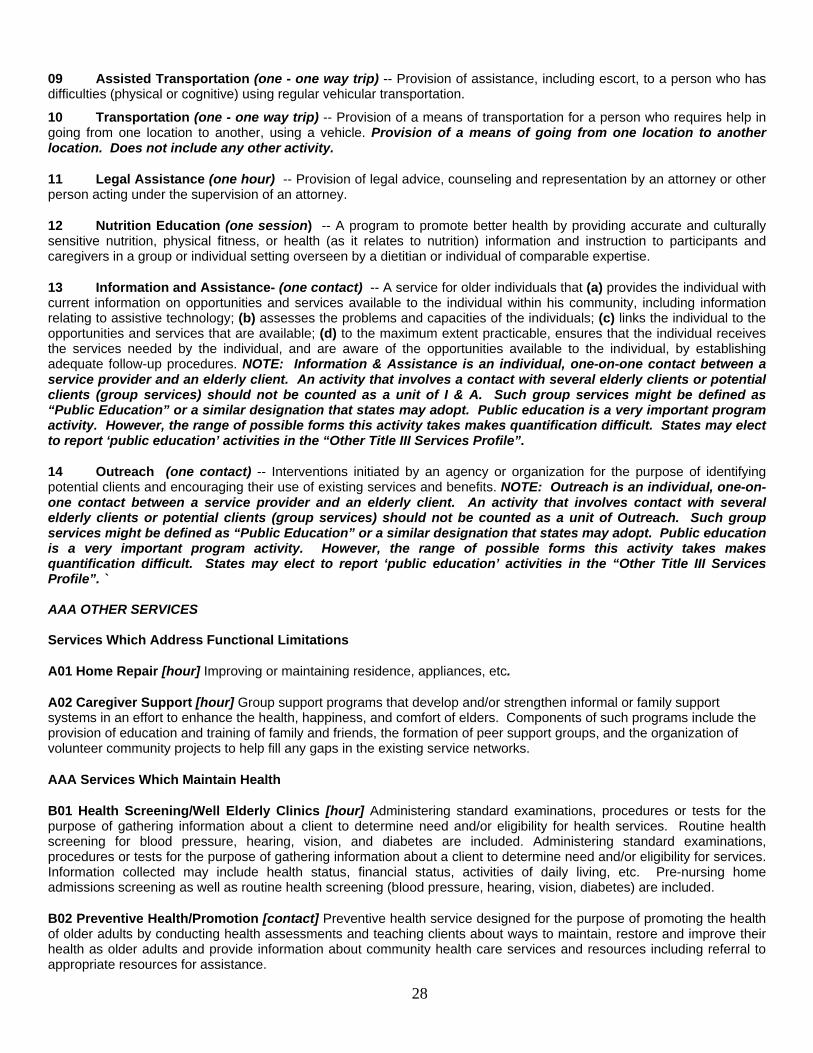
09 Assisted Transportation (one - one way trip) -- Provision of assistance, including escort, to a person who has difficulties (physical or cognitive) using regular vehicular transportation.
10 Transportation (one - one way trip) -- Provision of a means of transportation for a person who requires help in going from one location to another, using a vehicle. Provision of a means of going from one location to another location. Does not include any other activity.
11 Legal Assistance (one hour) -- Provision of legal advice, counseling and representation by an attorney or other person acting under the supervision of an attorney.
12 Nutrition Education (one session) -- A program to promote better health by providing accurate and culturally sensitive nutrition, physical fitness, or health (as it relates to nutrition) information and instruction to participants and caregivers in a group or individual setting overseen by a dietitian or individual of comparable expertise.
13 Information and Assistance- (one contact) -- A service for older individuals that (a) provides the individual with current information on opportunities and services available to the individual within his community, including information relating to assistive technology; (b) assesses the problems and capacities of the individuals; (c) links the individual to the opportunities and services that are available; (d) to the maximum extent practicable, ensures that the individual receives the services needed by the individual, and are aware of the opportunities available to the individual, by establishing adequate follow-up procedures. NOTE: Information & Assistance is an individual, one-on-one contact between a service provider and an elderly client. An activity that involves a contact with several elderly clients or potential clients (group services) should not be counted as a unit of I & A. Such group services might be defined as “Public Education” or a similar designation that states may adopt. Public education is a very important program activity. However, the range of possible forms this activity takes makes quantification difficult. States may elect to report ‘public education’ activities in the “Other Title III Services Profile”.
14 Outreach (one contact) -- Interventions initiated by an agency or organization for the purpose of identifying potential clients and encouraging their use of existing services and benefits. NOTE: Outreach is an individual, one-on-one contact between a service provider and an elderly client. An activity that involves contact with several elderly clients or potential clients (group services) should not be counted as a unit of Outreach. Such group services might be defined as “Public Education” or a similar designation that states may adopt. Public education is a very important program activity. However, the range of possible forms this activity takes makes quantification difficult. States may elect to report ‘public education’ activities in the “Other Title III Services Profile”. ` AAA OTHER SERVICES Services Which Address Functional Limitations
A01 Home Repair [hour] Improving or maintaining residence, appliances, etc.
A02 Caregiver Support [hour] Group support programs that develop and/or strengthen informal or family support systems in an effort to enhance the health, happiness, and comfort of elders. Components of such programs include the provision of education and training of family and friends, the formation of peer support groups, and the organization of volunteer community projects to help fill any gaps in the existing service networks.
AAA Services Which Maintain Health
B01 Health Screening/Well Elderly Clinics [hour] Administering standard examinations, procedures or tests for the purpose of gathering information about a client to determine need and/or eligibility for health services. Routine health screening for blood pressure, hearing, vision, and diabetes are included. Administering standard examinations, procedures or tests for the purpose of gathering information about a client to determine need and/or eligibility for services. Information collected may include health status, financial status, activities of daily living, etc. Pre-nursing home admissions screening as well as routine health screening (blood pressure, hearing, vision, diabetes) are included.
B02 Preventive Health/Promotion [contact] Preventive health service designed for the purpose of promoting the health of older adults by conducting health assessments and teaching clients about ways to maintain, restore and improve their health as older adults and provide information about community health care services and resources including referral to appropriate resources for assistance.
29
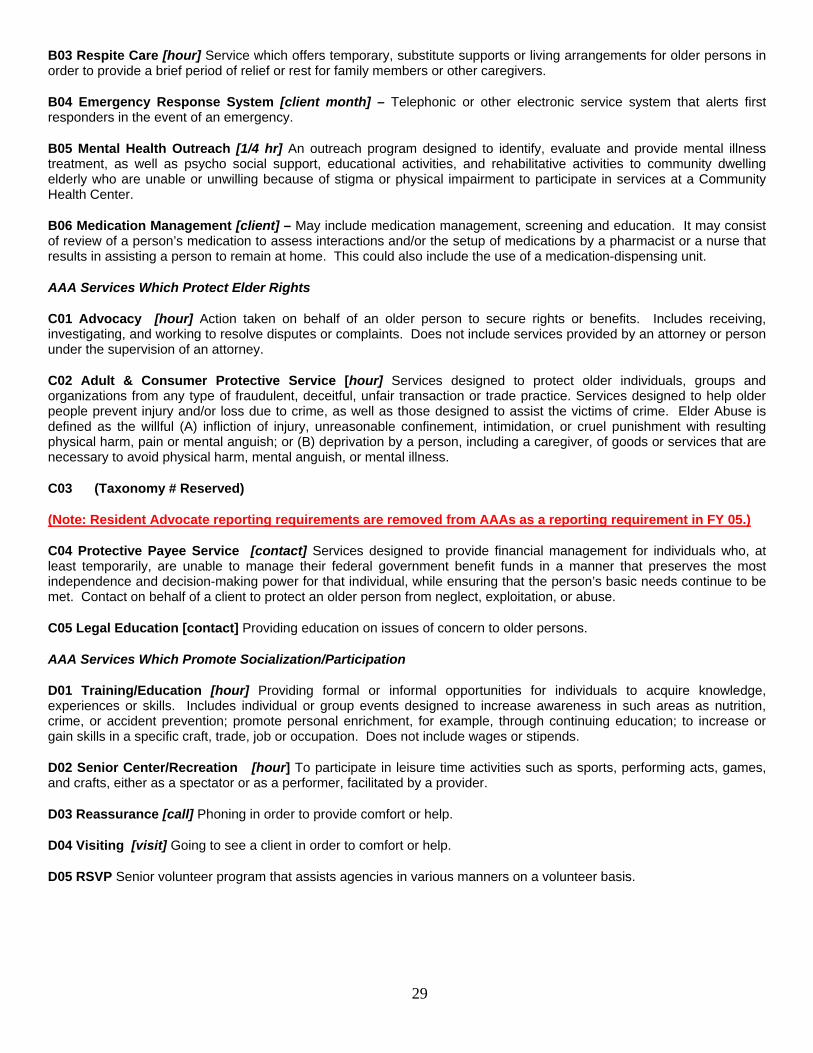
B03 Respite Care [hour] Service which offers temporary, substitute supports or living arrangements for older persons in order to provide a brief period of relief or rest for family members or other caregivers.
B04 Emergency Response System [client month] – Telephonic or other electronic service system that alerts first responders in the event of an emergency.
B05 Mental Health Outreach [1/4 hr] An outreach program designed to identify, evaluate and provide mental illness treatment, as well as psycho social support, educational activities, and rehabilitative activities to community dwelling elderly who are unable or unwilling because of stigma or physical impairment to participate in services at a Community Health Center.
B06 Medication Management [client] – May include medication management, screening and education. It may consist of review of a person’s medication to assess interactions and/or the setup of medications by a pharmacist or a nurse that results in assisting a person to remain at home. This could also include the use of a medication-dispensing unit.
AAA Services Which Protect Elder Rights
C01 Advocacy [hour] Action taken on behalf of an older person to secure rights or benefits. Includes receiving, investigating, and working to resolve disputes or complaints. Does not include services provided by an attorney or person under the supervision of an attorney.
C02 Adult & Consumer Protective Service [hour] Services designed to protect older individuals, groups and organizations from any type of fraudulent, deceitful, unfair transaction or trade practice. Services designed to help older people prevent injury and/or loss due to crime, as well as those designed to assist the victims of crime. Elder Abuse is defined as the willful (A) infliction of injury, unreasonable confinement, intimidation, or cruel punishment with resulting physical harm, pain or mental anguish; or (B) deprivation by a person, including a caregiver, of goods or services that are necessary to avoid physical harm, mental anguish, or mental illness.
C03 (Taxonomy # Reserved)
(Note: Resident Advocate reporting requirements are removed from AAAs as a reporting requirement in FY 05.)
C04 Protective Payee Service [contact] Services designed to provide financial management for individuals who, at least temporarily, are unable to manage their federal government benefit funds in a manner that preserves the most independence and decision-making power for that individual, while ensuring that the person’s basic needs continue to be met. Contact on behalf of a client to protect an older person from neglect, exploitation, or abuse.
C05 Legal Education [contact] Providing education on issues of concern to older persons.
AAA Services Which Promote Socialization/Participation
D01 Training/Education [hour] Providing formal or informal opportunities for individuals to acquire knowledge, experiences or skills. Includes individual or group events designed to increase awareness in such areas as nutrition, crime, or accident prevention; promote personal enrichment, for example, through continuing education; to increase or gain skills in a specific craft, trade, job or occupation. Does not include wages or stipends.
D02 Senior Center/Recreation [hour] To participate in leisure time activities such as sports, performing acts, games, and crafts, either as a spectator or as a performer, facilitated by a provider.
D03 Reassurance [call] Phoning in order to provide comfort or help.
D04 Visiting [visit] Going to see a client in order to comfort or help.
D05 RSVP Senior volunteer program that assists agencies in various manners on a volunteer basis.
30
AAA Services Which Assure Access and Coordination
E01 Counseling [hour] Uses the casework mode of relating to a client (via interview, discussion, or lending a sympathetic ear) to advise and enable the older person and family to resolve problems (concrete and emotional) or to relieve temporary stresses encountered. May be done on a one-to-one basis or on a group basis and may be conducted by paid, donated or volunteer staff.
E02 Placement Services [hour] Assisting a person or persons in obtaining a suitable place or situation such as employment, housing, institution, etc.
E03 Assessment/Intervention [hour] Uses the casework mode of relating to a client (via interview or discussion) to screen and assess the client’s and caregiver’s needs; provide information about, referral and assistance to meet identified needs, advocacy, counseling, a written plan of care and related case documentation; inter-agency case coordination; ongoing follow-up and reassessment; evaluation of outcomes of services; exit planning; and, placement assistance. Administration of a standardized tool and the use of other procedures to identify existing impairments, situations, and problems which are barriers to a resident’s ability to function and to identify strengths and specific needs.
AAA Services Which Support Other Purposes
F01 Employment [placement] Services include non-SIP (Senior Internship Program) older worker employment activities and expenditures. All SIP activities and resource expenditures would be reported under the related contract reporting requirements. Expenditures and activities above and beyond SIP resources should be included through IOWA NAPIS and financial
F02 Material Aid [client] Aid in the form of goods or services such as food, smoke detectors, eyeglasses, security devices, etc.
F03 Public Information [issues/sessions] Service whereby more than one client, a group, is informed and, or assisted in identifying services that may be available. A newsletter could be an example of Public Information [number of issues, not copies, distributed would be the service unit. In other words, the number of month’s newsletters were published]
F04 Grandparent/Relative Caregiver Support [client] Support of a grandparent or step-grandparent of a child, or a relative of a child by blood or marriage, who is 60 years of age or older and: (A) lives with the child; (B) is the primary caregiver of the child because the biological or adoptive parents are unable or unwilling to serve as the primary caregiver of the child; and (C) has a legal relationship to the child, as such legal custody or guardianship, or is raising the child informally. The term “child” means an individual who is not more than 18 years of age.