Ionizationand Enhanced Photochemistryof HNO Adsorbedonto Ice · 2013-05-05 3 Thermodynamics of HNO...
18
2013-05-05 1 Guillaume Marcotte, a,b Patrick Ayotte, a,b Stéphanie Pronovost, a Patrick Marchand, a Carine Laffon, b Philippe Parent b a-Département de chimie, Université de Sherbrooke, Sherbrooke, CANADA b-Laboratoire de Chimie Physique - Matière et Rayonnement, Université Pierre et Marie Curie (Paris 06) et CNRS (UMR 7614), FRANCE Ionization and Enhanced Photochemistry of HNO 3 Adsorbed onto Ice NO x photochemical fluxes at polar sunrise Wolff et al. and Dominé and Shepson have reported unusually high NO x photochemical fluxes upon polar sunrise after the dark winter. This has been explained by the photolysis of nitric acid (reservoir species of NO x ) that has been deposited onto the polar ice cap. 200 250 300 350 400 0 2 4 6 8 10 ε ε ε ε (M -1 /cm) ε ε ε ε x10 3 (M -1 /cm) wavelength (nm) 1 2 Irradiance (W/m 2 /nm) 0 5 10 Sea level Sunlight blackbody radiation Dominé and Shepson, Science 297, 1506 (2002). Wolff et al. Geophys. Res. Lett. 29, 5823 (2002) n → π* π→π*
Transcript of Ionizationand Enhanced Photochemistryof HNO Adsorbedonto Ice · 2013-05-05 3 Thermodynamics of HNO...
2013-05-05
1
Guillaume Marcotte,a,b
Patrick Ayotte,a,b
Stéphanie Pronovost,a
Patrick Marchand,a
Carine Laffon, b
Philippe Parentb
a-Département de chimie, Université de Sherbrooke, Sherbrooke, CANADAb-Laboratoire de Chimie Physique - Matière et Rayonnement,
Université Pierre et Marie Curie (Paris 06) et CNRS (UMR 7614), FRANCE
Ionization and Enhanced
Photochemistry of HNO3
Adsorbed onto Ice
NOx photochemical fluxes at polar sunrise� Wolff et al. and Dominé and Shepson have
reported unusually high NOx photochemical fluxes upon polar sunrise after the dark winter.
� This has been explained by the photolysis of nitric acid (reservoir species of NOx) that has been deposited onto the polar ice cap.
200 250 300 350 400
0
2
4
6
8
10
εε εε (
M-1/c
m)
εε εε x
10
3 (
M-1/c
m)
wavelength (nm)
1
2
Irra
dia
nce (
W/m
2/n
m)
0
5
10
Sea level
Sunlight blackbody radiation
Dominé and Shepson, Science 297, 1506 (2002).
Wolff et al. Geophys. Res. Lett. 29, 5823 (2002)
n → π*π→π*
2013-05-05
2
Polar boundary layer chemistryTable 1. Measured (or calculated) concentrations of gaseous species at
Alert at the end of April 2000, compared with values predicted by
models that include gas-phase chemistry only.
Species Value measured over snow Prediction by gas-phase chemistry
HCHO 200 pptv 70 pptv
CH3CHO 80 pptv 40 pptv
NOx 25 pptv 1 pptv
HONO 20 pptv 1 pptv
OH 0.03 pptv* 0.003 pptv
HO2 3.7 ppt* 0.9 ppt
O3 As low as 0.07 ppb 30-34 ppbv
Hg0 0.02 pptv 0.17 pptv
Dominé and Shepson, Science 297, 1506 (2002).
Nitrate photolysis within/onto ice
H NO3
H NO3
H NO3 H+ NO3-
Ionic
DissociationSticking
X
H NO3 H+ NO3-
+
+
Differences between absorbed and adsorbed nitric acid/nitrates could be:
Symmetry breaking (dipole forbidden transition)
Shifts in Absorption spectrum (better overlap with solar irradiance)
Caging effect (ΦΦΦΦ=0.1% at 270K)
pKa of adsorbed HNO3 (surface segregation)
NO2 O-+
NO2 O-+
hν
2013-05-05
3
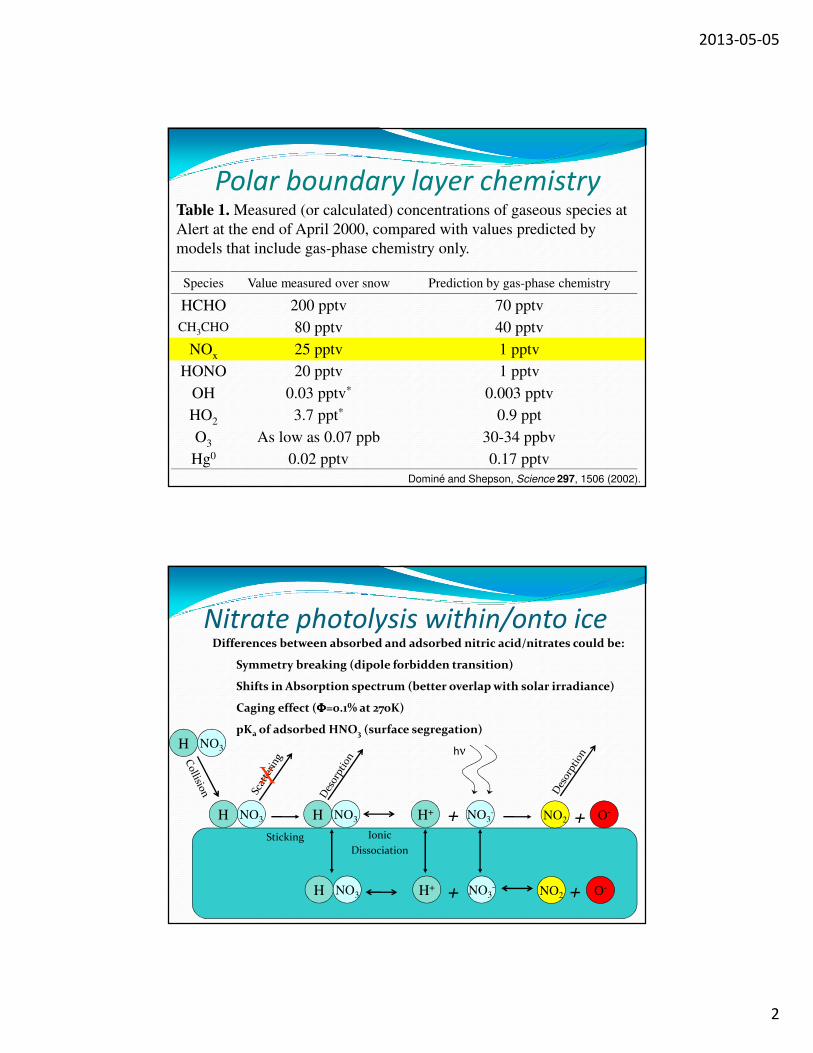
Thermodynamics of HNO3 dissociation
�High T favor recombination1,3,4
�Poor solvation (as on surfaces1,2,4,5 or clusters3) favor molecular nitric acid
HOW ABOUT HNO3 AT THE SURFACE OF ICE, OR OF THE QLL AT LOW TEMPERATURE?1.Wang, Bianco and Hynes, JPCA, 113 (2009) 12952.Ardura and Donaldson, PCCP, 11 (2009) 8573.Miller and Gerber, PCCP,10 (2008) 10914.Shamay, Buch, Parrinello and Richmond, JACS, 129 (2007) 129105.Bianco, Wang and Hynes, JPCA, 111 (2007) 11033
3 4 5-10
-8
-6
-4
-2
0
2
4
pK
a
1000/T (1/K)
HF
HNO3
HCl
HBr
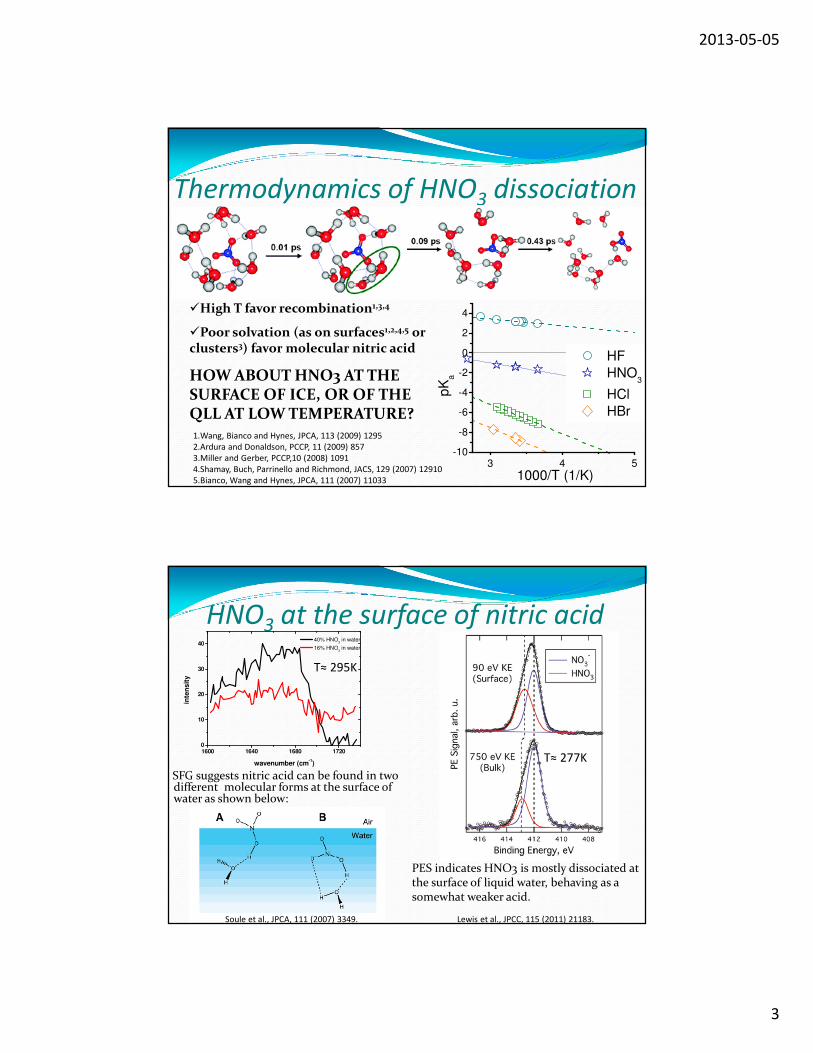
HNO3 at the surface of nitric acid
SFG suggests nitric acid can be found in two different molecular forms at the surface of water as shown below:
1600 1640 1680 17200
10
20
30
40
40% HNO3 in water
16% HNO3 in water
inte
ns
ity
wavenumber (cm-1)
PES indicates HNO3 is mostly dissociated at the surface of liquid water, behaving as a somewhat weaker acid.
T≈ 295K
Soule et al., JPCA, 111 (2007) 3349. Lewis et al., JPCC, 115 (2011) 21183.
T≈ 277K
2013-05-05
4
Outline
�Introduction and motivation
�RAIRS and NEXAFS of thin molecular solid films
�Adsorption, absorption and dissolution of HNO3
�Enhanced photolysis of surface-bound nitrates
�Summary and conclusions
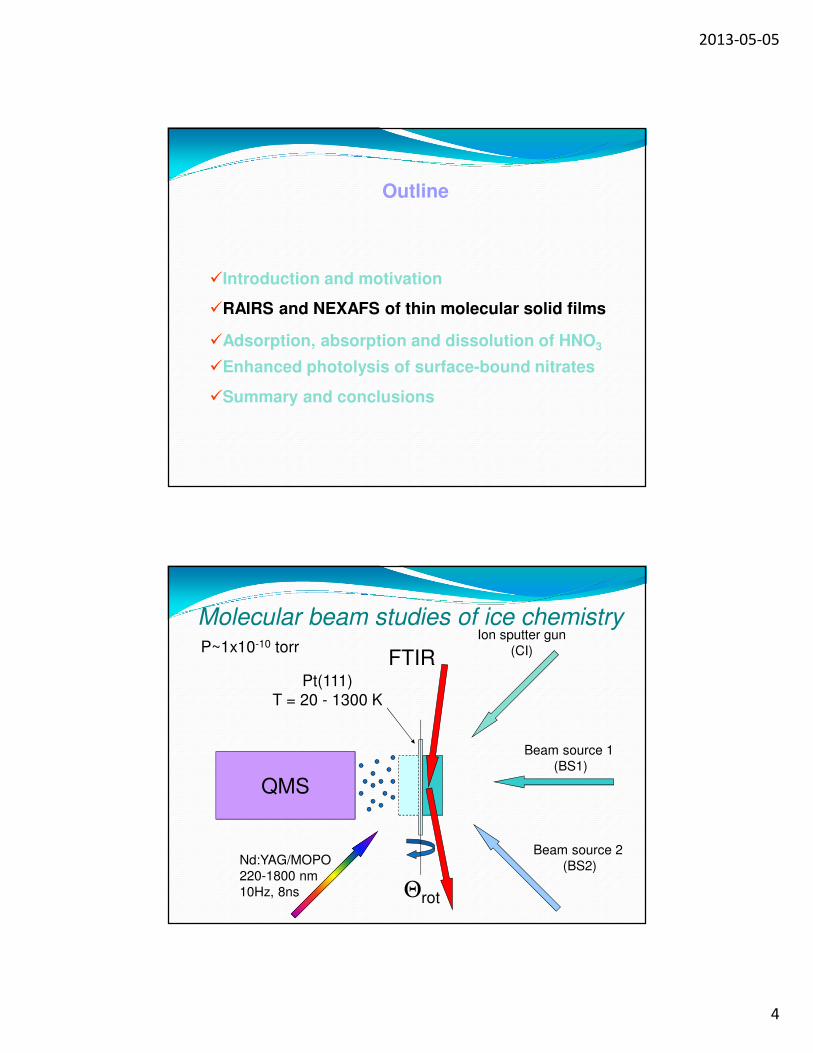
QMS
Beam source 1
(BS1)
FTIRPt(111)
T = 20 - 1300 K
Θrot
Beam source 2
(BS2)
Ion sputter gun
(CI)
Nd:YAG/MOPO
220-1800 nm
10Hz, 8ns
P~1x10⁻¹⁰ torr
Molecular beam studies of ice chemistry
2013-05-05
5
Pt(111)
nFilm(ω)+ikFilm(ω)
nPt(ω)+ikPt(ω)
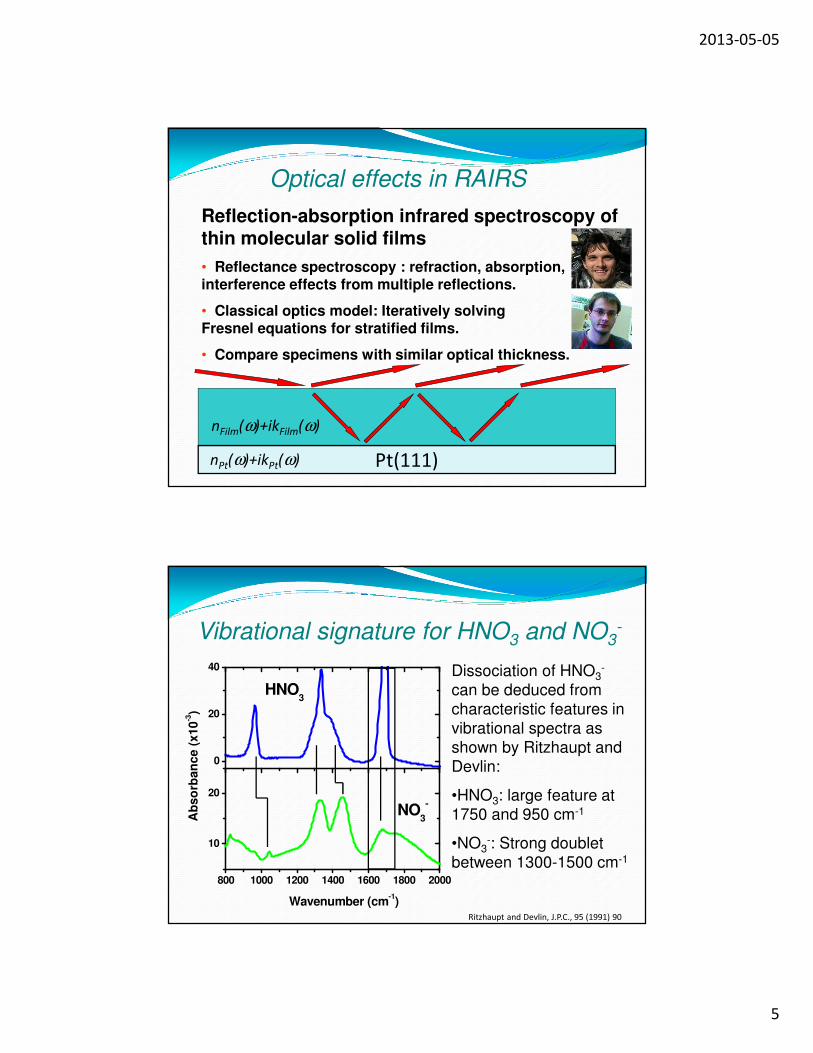
Reflection-absorption infrared spectroscopy of thin molecular solid films
• Reflectance spectroscopy : refraction, absorption, and interference effects from multiple reflections.
• Classical optics model: Iteratively solving Fresnel equations for stratified films.
• Compare specimens with similar optical thickness.
Optical effects in RAIRS
Vibrational signature for HNO3 and NO3-
Dissociation of HNO3-
can be deduced from
characteristic features in
vibrational spectra as
shown by Ritzhaupt and
Devlin:
•HNO3: large feature at
1750 and 950 cm-1
•NO3-: Strong doublet
between 1300-1500 cm-1
Ritzhaupt and Devlin, J.P.C., 95 (1991) 90
800 1000 1200 1400 1600 1800 2000
10
20
NO3
-
HNO3
Wavenumber (cm-1)
0
20
40
Ab
so
rba
nc
e (
x1
0-3)
2013-05-05
6
http://www.theochem.kth.se/research/xspectra/index.htmlhttp://www.e20.ph.tum.de/index.php?id=nexafs&type=98
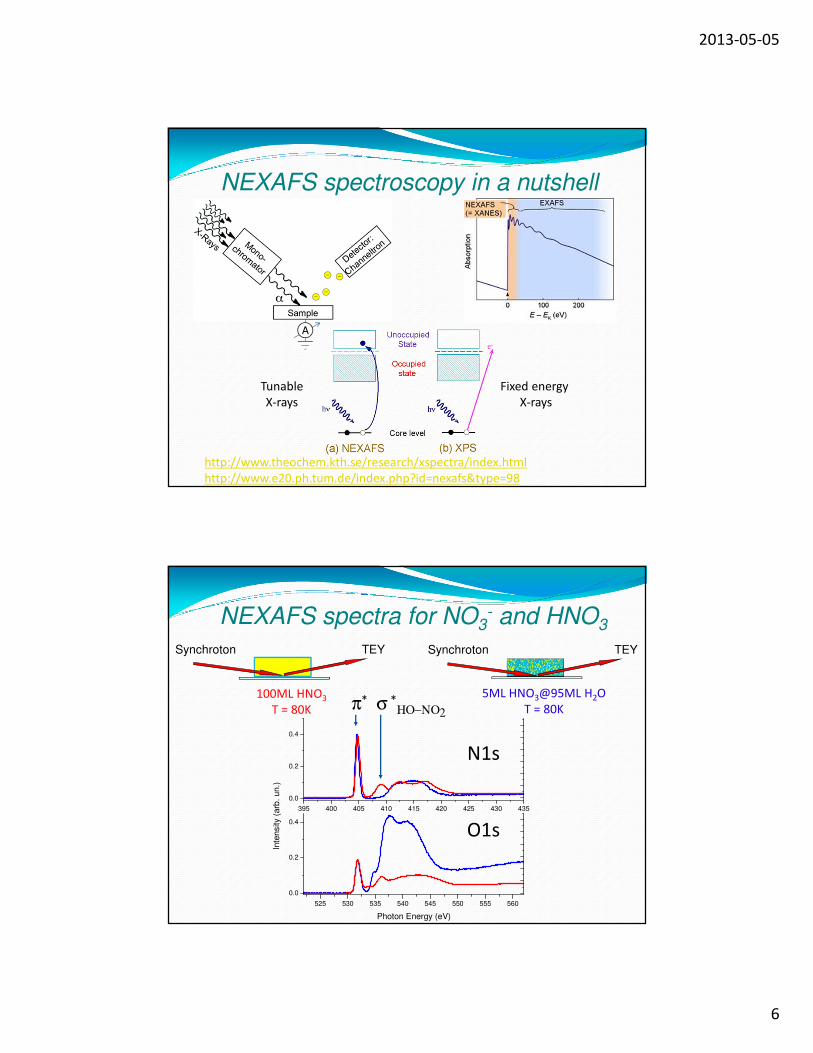
NEXAFS spectroscopy in a nutshell
Fixed energy X-rays
TunableX-rays
A
5ML HNO3@95ML H2OT = 80K
Synchroton TEY
100ML HNO3
T = 80K
Synchroton TEY
395 400 405 410 415 420 425 430 435
0.0
0.2
0.4
Inte
nsity (
arb
. un.)
525 530 535 540 545 550 555 560
0.0
0.2
0.4
Photon Energy (eV)
N1s
O1s
π* σ *ΗΟ−ΝΟ2
NEXAFS spectra for NO3- and HNO3
2013-05-05
7
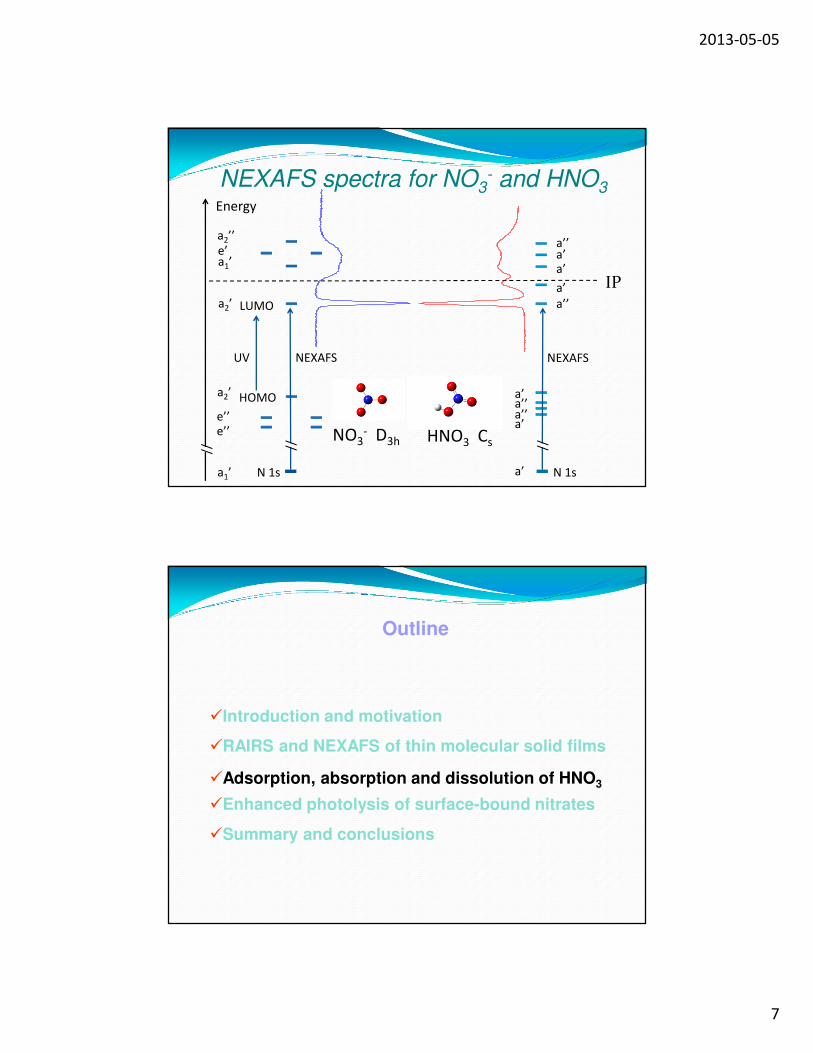
NO3- D3h
LUMO
HOMO
IP
a2’
a1’
HNO3 Cse’’e’’
a2’
a2’’e’
a’
a’
a’
a’a’
a’’
a’’
a’’a’’
//
N 1s N 1s
Energy
a1’ a’
NEXAFSUV
//
NEXAFS spectra for NO3- and HNO3
NEXAFS
//
Outline
�Introduction and motivation
�RAIRS and NEXAFS of thin molecular solid films
�Adsorption, absorption and dissolution of HNO3
�Enhanced photolysis of surface-bound nitrates
�Summary and conclusions
2013-05-05
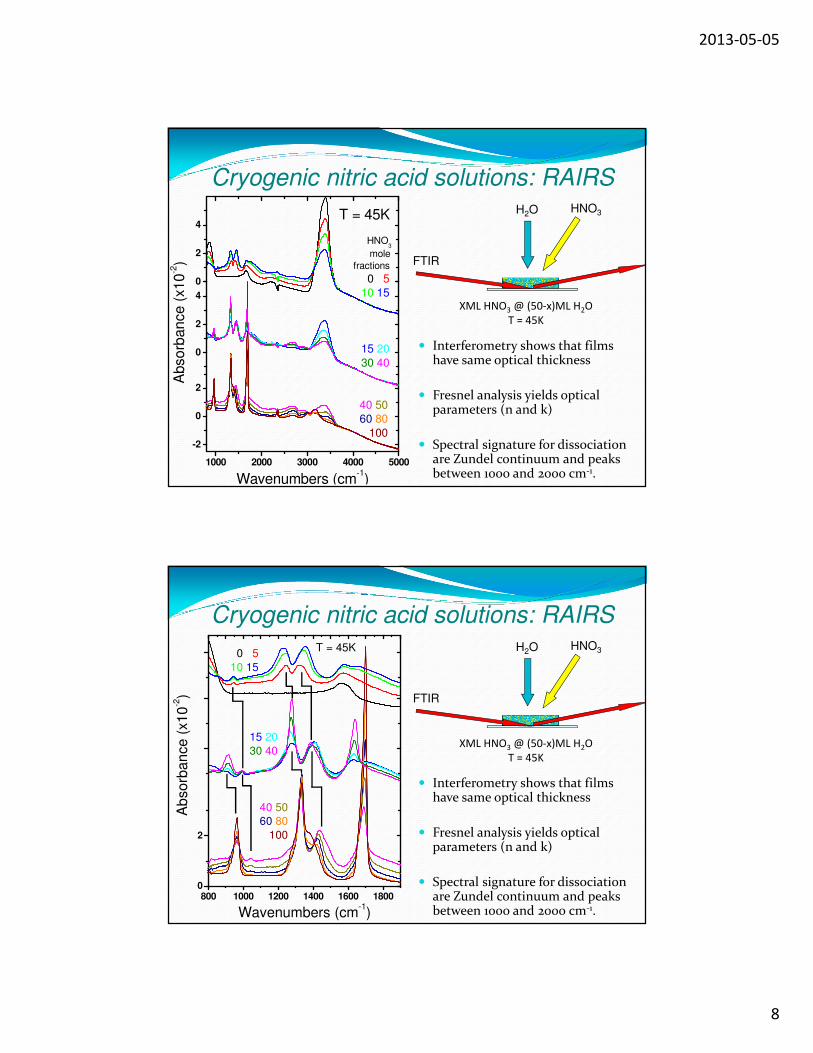
8
Cryogenic nitric acid solutions: RAIRS
� Interferometry shows that films have same optical thickness
� Fresnel analysis yields optical parameters (n and k)
� Spectral signature for dissociation are Zundel continuum and peaks between 1000 and 2000 cm-1.
FTIR
H2O HNO3
1000 2000 3000 4000 5000
-2
0
2
0 5
10 15
15 20
30 40
40 50
60 80
100
Wavenumbers (cm-1)
0
2
4
A
bso
rban
ce (
x1
0-2)
0
2
4
HNO3
mole
fractions
T = 45K
XML HNO3 @ (50-x)ML H2OT = 45K
800 1000 1200 1400 1600 18000
2
40 50
60 80
100
Marchand and Ayotte - Figure 2
0 5
10 15
Wavenumbers (cm-1)
15 20
30 40
Ab
sorb
an
ce (
x1
0-2)
T = 45K
� Interferometry shows that films have same optical thickness
� Fresnel analysis yields optical parameters (n and k)
� Spectral signature for dissociation are Zundel continuum and peaks between 1000 and 2000 cm-1.
H2O
FTIR
HNO3
XML HNO3 @ (50-x)ML H2OT = 45K
Cryogenic nitric acid solutions: RAIRS
2013-05-05
9
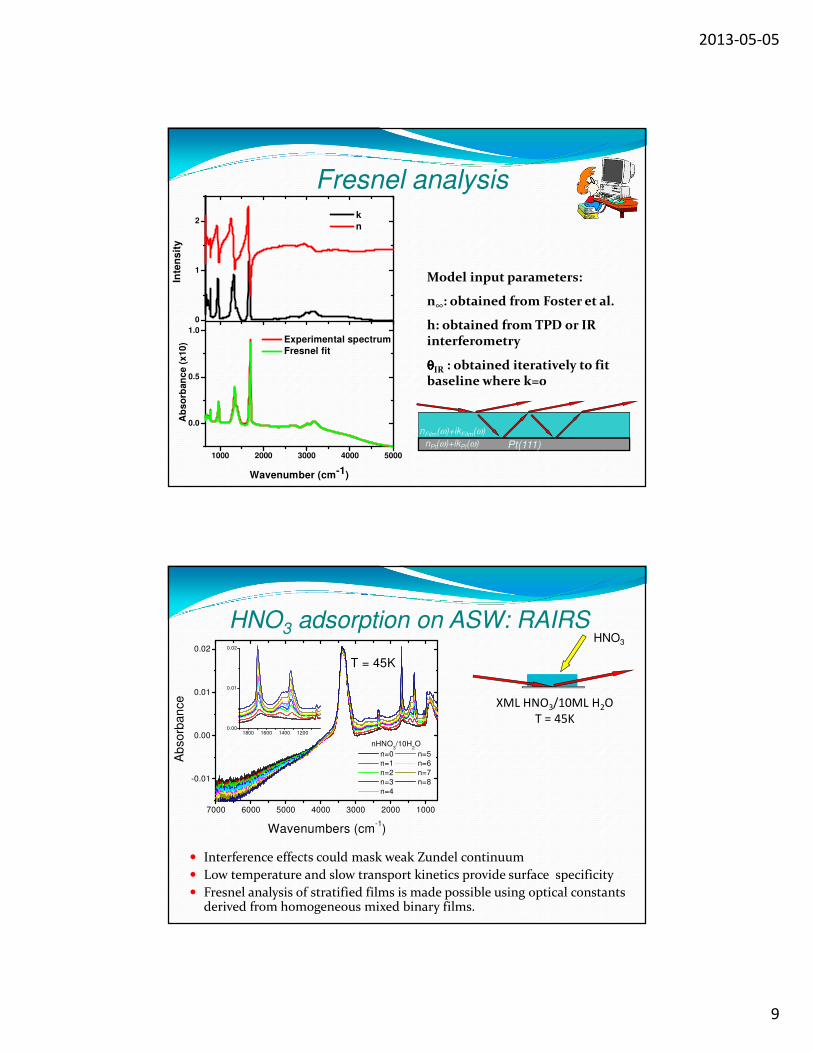
1000 2000 3000 4000 5000
0.0
0.5
1.0
0
1
2
Experimental spectrum
Fresnel fit
Ab
so
rban
ce (
x10
)
Wavenumber (cm-1)
Inte
ns
ity
k
n
Fresnel analysis
Model input parameters:
n∞: obtained from Foster et al.
h: obtained from TPD or IR interferometry
θθθθIR : obtained iteratively to fit baseline where k=0
Pt(111)
nFilm(ω)+ikFilm(ω)
nPt(ω)+ikPt(ω)
7000 6000 5000 4000 3000 2000 1000
-0.01
0.00
0.01
0.02
T = 45K
Ab
sorb
an
ce
Wavenumbers (cm-1)
nHNO3/10H
2O
n=0 n=5
n=1 n=6
n=2 n=7
n=3 n=8
n=4
1800 1600 1400 12000.00
0.01
0.02
HNO3 adsorption on ASW: RAIRS
� Interference effects could mask weak Zundel continuum
� Low temperature and slow transport kinetics provide surface specificity
� Fresnel analysis of stratified films is made possible using optical constants derived from homogeneous mixed binary films.
HNO3
XML HNO3/10ML H2OT = 45K
2013-05-05
10
Experimental result Fresnel Model
1000 2000 3000 4000
0.0
0.5
1.0
1.5
2.0
ASW
1ML HNO3
2ML HNO3
3ML HNO3
4ML HNO3
5ML HNO3
Ab
so
rban
cex
100
Wavenumber (cm-1)
T=45K
Ab
so
rba
nce
x1
00
W aven u m ber (cm-1
)
10 00 2 00 0 3 000 400 0
0 .0
0 .5
1 .0
1 .5
2 .0
A
bs
orb
an
ce
x1
00
W aven u m ber (cm-1
)100 0 20 00 30 00 4 00 0
0.0
0 .5
1 .0
1 .5
2 .0
Then
Difference spectra: Experimental vs model
45K 80K
1st monolayer 20% 20%
2nd monolayer 50% 30%
3rd monolayer 80% 50%
4th monolayer 100% 80%
5th monolayer 100% 100%
1200 1600 2000
0
1
Wavenumber (cm-1
)
0
1
0
1
2
0
1
2
A
bs
orb
an
ce
x10
3
fourth monolayer
third monolayer
second monolayer
first monolayer
- =T=45K
2013-05-05
11
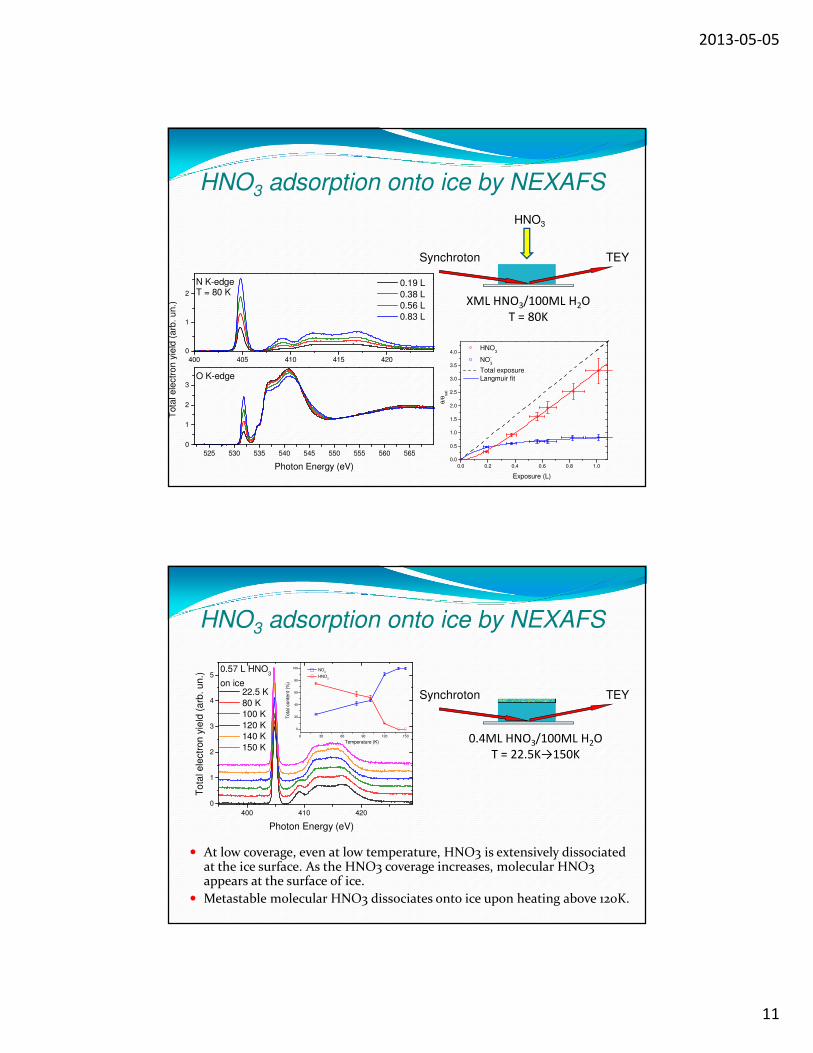
XML HNO3/100ML H2OT = 80K
Synchroton TEY
HNO3 adsorption onto ice by NEXAFS
HNO3
0.0 0.2 0.4 0.6 0.8 1.0
0.0
0.5
1.0
1.5
2.0
2.5
3.0
3.5
4.0
Exposure (L)
HNO3
NO-
3
Total exposure
Langmuir fit
θ/θ
sat
400 405 410 415 420
0
1
2
0.19 L
0.38 L
0.56 L
0.83 L
525 530 535 540 545 550 555 560 565
0
1
2
3
O K-edge
Tota
l e
lectr
on y
ield
(a
rb.
un.)
Photon Energy (eV)
N K-edgeT = 80 K
� At low coverage, even at low temperature, HNO3 is extensively dissociated at the ice surface. As the HNO3 coverage increases, molecular HNO3 appears at the surface of ice.
� Metastable molecular HNO3 dissociates onto ice upon heating above 120K.
HNO3 adsorption onto ice by NEXAFS
0.4ML HNO3/100ML H2OT = 22.5K→150K
Synchroton TEY
400 410 420
0
1
2
3
4
5
To
tal e
lectr
on
yie
ld (
arb
. u
n.)
Photon Energy (eV)
22.5 K
80 K
100 K
120 K
140 K
150 K
0.57 L HNO3
on ice
0 30 60 90 120 150
0
20
40
60
80
100 NO
-
3
HNO3
To
tal co
nte
nt
(%)
Temperature (K)
2013-05-05
12
Outline
�Introduction and motivation
�RAIRS and NEXAFS of thin molecular solid films
�Adsorption, absorption and dissolution of HNO3
�Enhanced photolysis of surface-bound nitrates
�Summary and conclusions
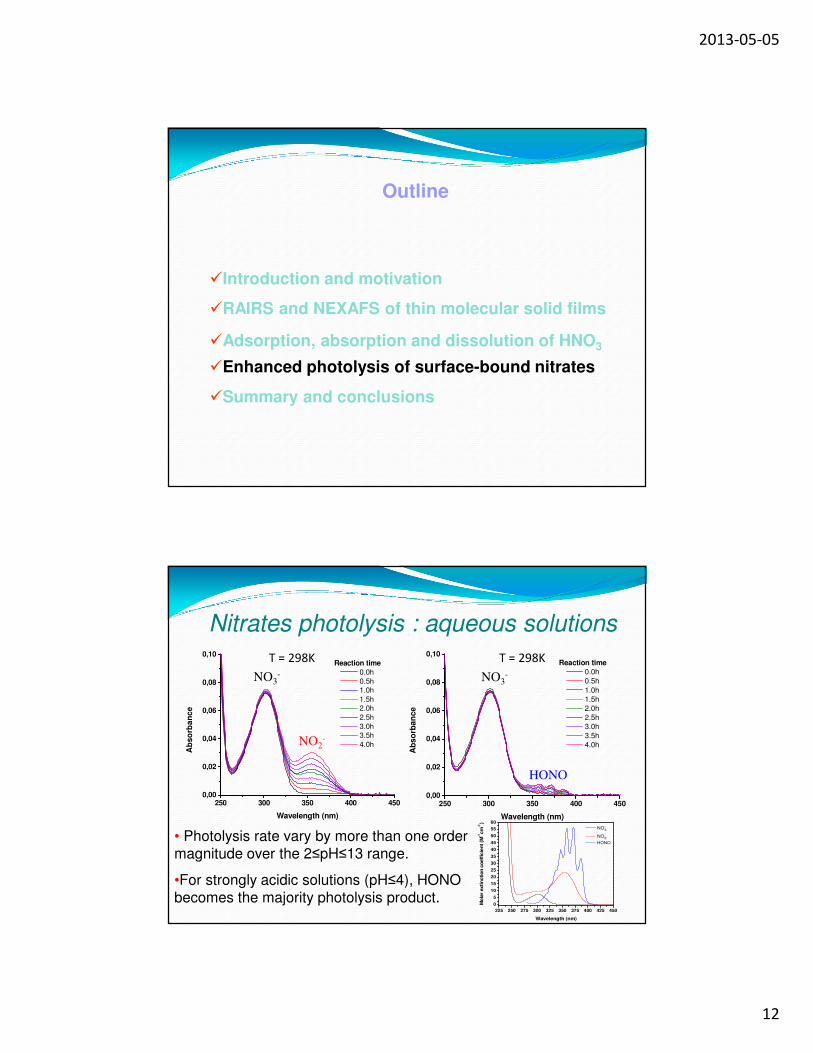
• Photolysis rate vary by more than one order magnitude over the 2≤pH≤13 range.
•For strongly acidic solutions (pH≤4), HONO becomes the majority photolysis product.
Nitrates photolysis : aqueous solutions
225 250 275 300 325 350 375 400 425 450
0
5
10
15
20
25
30
35
40
45
50
55
60
NO-3
NO-2
HONO
Wavelength (nm)
Mo
lar
extinction c
oeff
icie
nt (M
-1cm
-1)
250 300 350 400 4500,00
0,02
0,04
0,06
0,08
0,10
Reaction time
0.0h
0.5h
1.0h
1.5h
2.0h
2.5h
3.0h
3.5h
4.0h
Ab
so
rba
nc
e
Wavelength (nm)
250 300 350 400 4500,00
0,02
0,04
0,06
0,08
0,10Reaction time
0.0h
0.5h
1.0h
1.5h
2.0h
2.5h
3.0h
3.5h
4.0h
Ab
so
rba
nc
e
Wavelength (nm)
NO3-
NO2-
NO3-
HONO
T = 298K T = 298K
2013-05-05
13
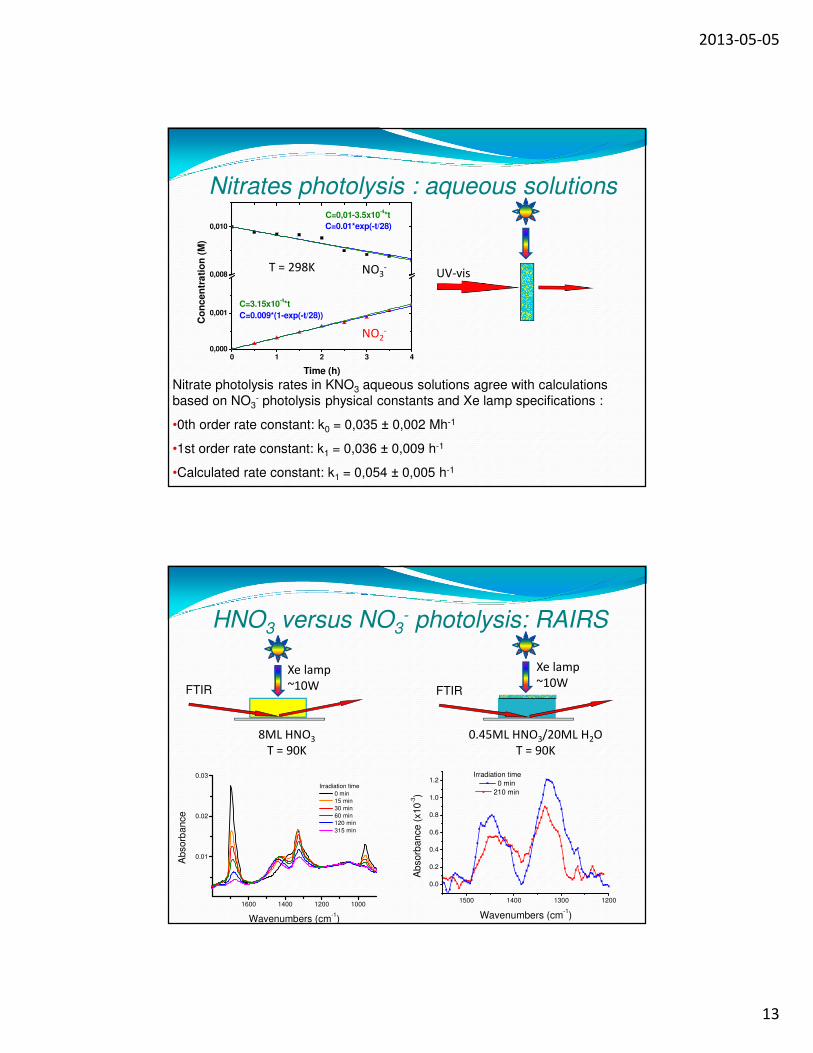
Nitrate photolysis rates in KNO3 aqueous solutions agree with calculations
based on NO3- photolysis physical constants and Xe lamp specifications :
•0th order rate constant: k0 = 0,035 ± 0,002 Mh-1
•1st order rate constant: k1 = 0,036 ± 0,009 h-1
•Calculated rate constant: k1 = 0,054 ± 0,005 h-1
Nitrates photolysis : aqueous solutions
0 1 2 3 40,000
0,001
0,008
0,010
C=0.009*(1-exp(-t/28))
C=3.15x10⁻⁴*t
Co
nc
en
tra
tio
n (
M)
Time (h)
C=0,01-3.5x10⁻⁴*t
C=0.01*exp(-t/28)
UV-visT = 298K NO3-
NO2-
0.45ML HNO3/20ML H2OT = 90K
FTIR
Xe lamp ~10W
HNO3 versus NO3- photolysis: RAIRS
8ML HNO3
T = 90K
Xe lamp ~10WFTIR
1600 1400 1200 1000
0.01
0.02
0.03
Absorb
ance
Wavenumbers (cm-1)
Irradiation time
0 min
15 min
30 min
60 min
120 min
315 min
1500 1400 1300 1200
0.0
0.2
0.4
0.6
0.8
1.0
1.2
Ab
sorb
an
ce (
x10
-3)
Wavenumbers (cm-1)
Irradiation time
0 min
210 min
2013-05-05
14
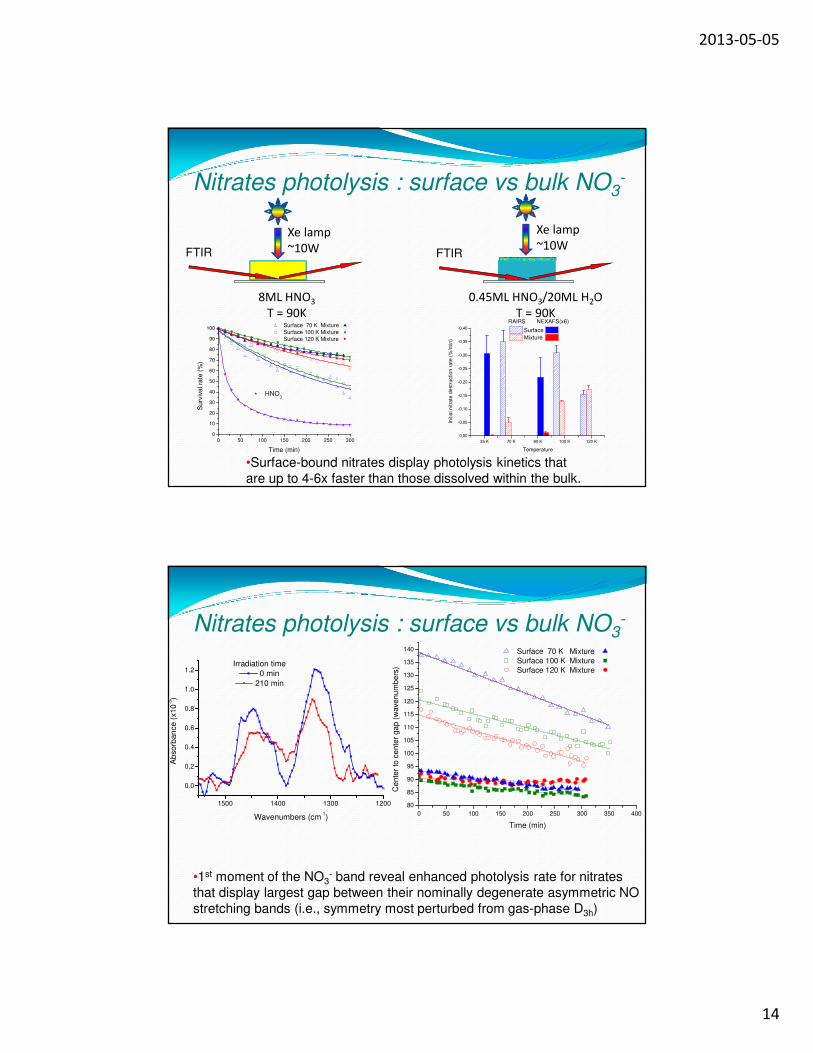
•Surface-bound nitrates display photolysis kinetics that
are up to 4-6x faster than those dissolved within the bulk.
Nitrates photolysis : surface vs bulk NO3-
0 50 100 150 200 250 3000
10
20
30
40
50
60
70
80
90
100
Su
rviv
al ra
te (
%)
Time (min)
Surface 70 K Mixture
Surface 100 K Mixture
Surface 120 K Mixture
HNO3
35 K 70 K 90 K 100 K 120 K
0,00
-0,05
-0,10
-0,15
-0,20
-0,25
-0,30
-0,35
-0,40
Initia
l nitra
te d
estr
uction r
ate
(%
/min
)
RAIRS NEXAFS(x6)
Surface
Mixture
Temperature
0.45ML HNO3/20ML H2OT = 90K
FTIR
Xe lamp ~10W
8ML HNO3
T = 90K
Xe lamp ~10WFTIR
Nitrates photolysis : surface vs bulk NO3-
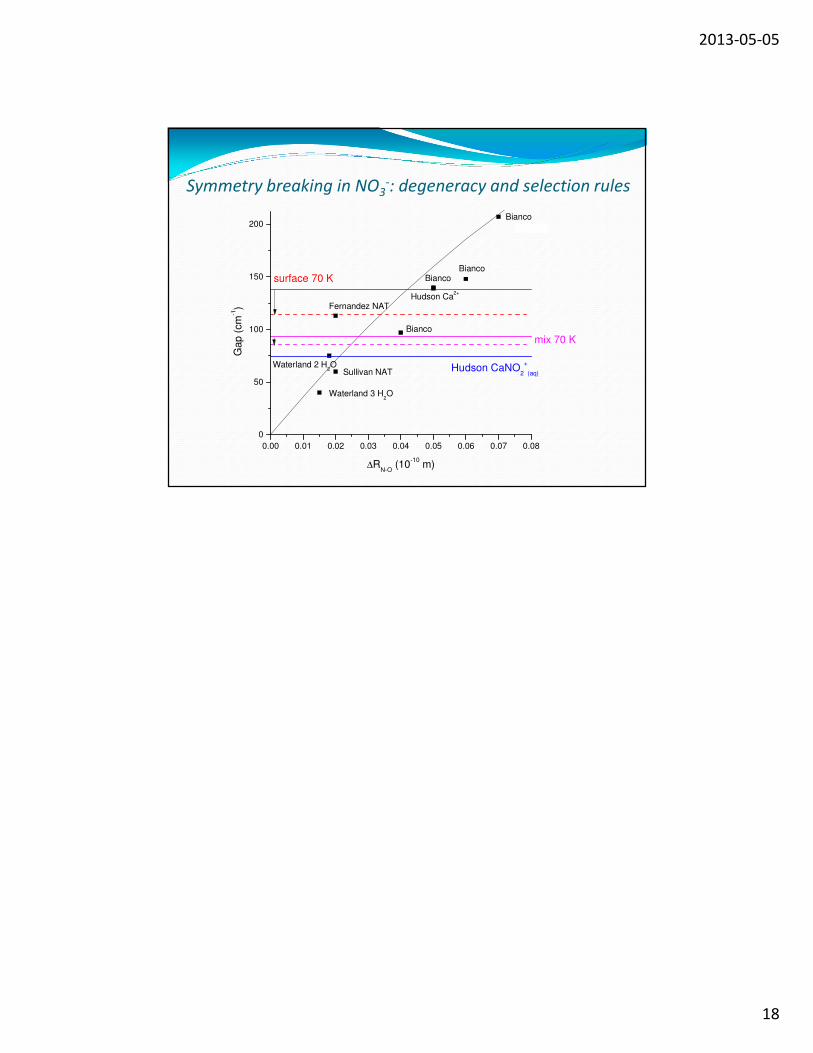
•1st moment of the NO3- band reveal enhanced photolysis rate for nitrates
that display largest gap between their nominally degenerate asymmetric NO
stretching bands (i.e., symmetry most perturbed from gas-phase D3h)
1500 1400 1300 1200
0.0
0.2
0.4
0.6
0.8
1.0
1.2
Ab
sorb
an
ce
(x1
0-3)
Wavenumbers (cm-1)
Irradiation time
0 min
210 min
0 50 100 150 200 250 300 350 400
80
85
90
95
100
105
110
115
120
125
130
135
140
Ce
nte
r to
ce
nte
r g
ap
(w
ave
nu
mb
ers
)
Time (min)
Surface 70 K Mixture
Surface 100 K Mixture
Surface 120 K Mixture
2013-05-05
15
Symmetry breaking in NO3-: vibrational spectroscopy
395 400 405 410 415 420 425 430
0
1
2
3
4
5
6
7
Inte
nsity (
arb
. un.)
Photon Energy (eV)
Pure HNO3
30 min UV
60 min UV
90 min UV
120 min UV
150 min UV
180 min UV
210 min UV
240 min UV
270 min UV
Nitric acid N K edge NEXAFS vs photolisis time
40ML HNO3
T = 20K
Xe lamp ~10W
HNO3 and NO3- photolysis by NEXAFS
Synchrotron TEY
400 405 410 415 420 425 430
0
1
2
3
4
16% HNO3 @ ASW N K egde versus photolysis time
inte
nsity (
arb
.un
.)
Photon Energy (eV)
Irradiation time
0 min
30 min
60 min
90 min
120 min
150 min
180 min
210 min
240 min
15ML HNO3@100 ML H2OT = 90K
Xe lamp ~10W
Synchrotron TEY
2013-05-05
16
400 405 410 415 420 425 430
0.0
0.5
1.0
1.5
0.15L HNO3/ASW N K edge versus photolysis time
inte
nsity (
arb
.un.)
Energy (eV)
Irradiation time
0 min
30 min
60 min
90 min
120 min
150 min
180 min
210 min
240 min
270 min
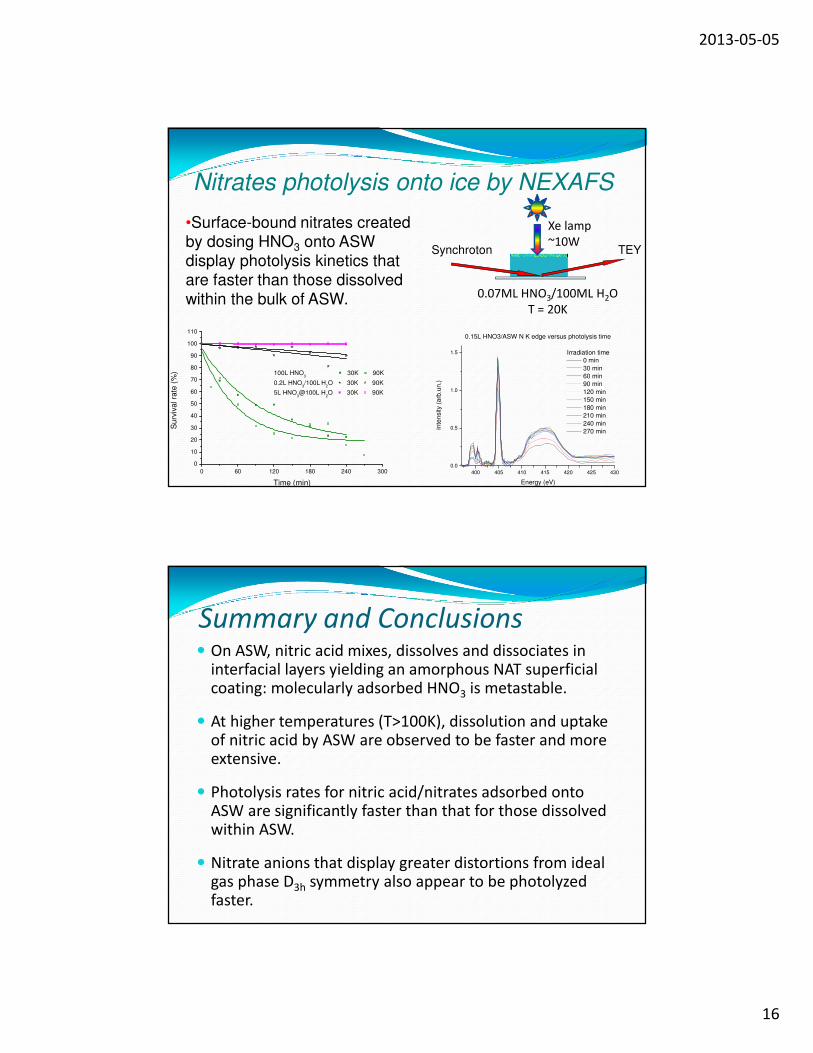
Nitrates photolysis onto ice by NEXAFS
0.07ML HNO3/100ML H2OT = 20K
Synchroton TEY
Xe lamp ~10W
0 60 120 180 240 300
0
10
20
30
40
50
60
70
80
90
100
110
100L HNO3 30K 90K
0.2L HNO3/100L H
2O 30K 90K
5L HNO3@100L H
2O 30K 90K
Surv
ival ra
te (
%)
Time (min)
•Surface-bound nitrates created
by dosing HNO3 onto ASW
display photolysis kinetics that
are faster than those dissolved
within the bulk of ASW.
Summary and Conclusions� On ASW, nitric acid mixes, dissolves and dissociates in
interfacial layers yielding an amorphous NAT superficial coating: molecularly adsorbed HNO3 is metastable.
� At higher temperatures (T>100K), dissolution and uptake of nitric acid by ASW are observed to be faster and more extensive.
� Photolysis rates for nitric acid/nitrates adsorbed onto ASW are significantly faster than that for those dissolved within ASW.
� Nitrate anions that display greater distortions from ideal gas phase D3h symmetry also appear to be photolyzedfaster.
2013-05-05
17
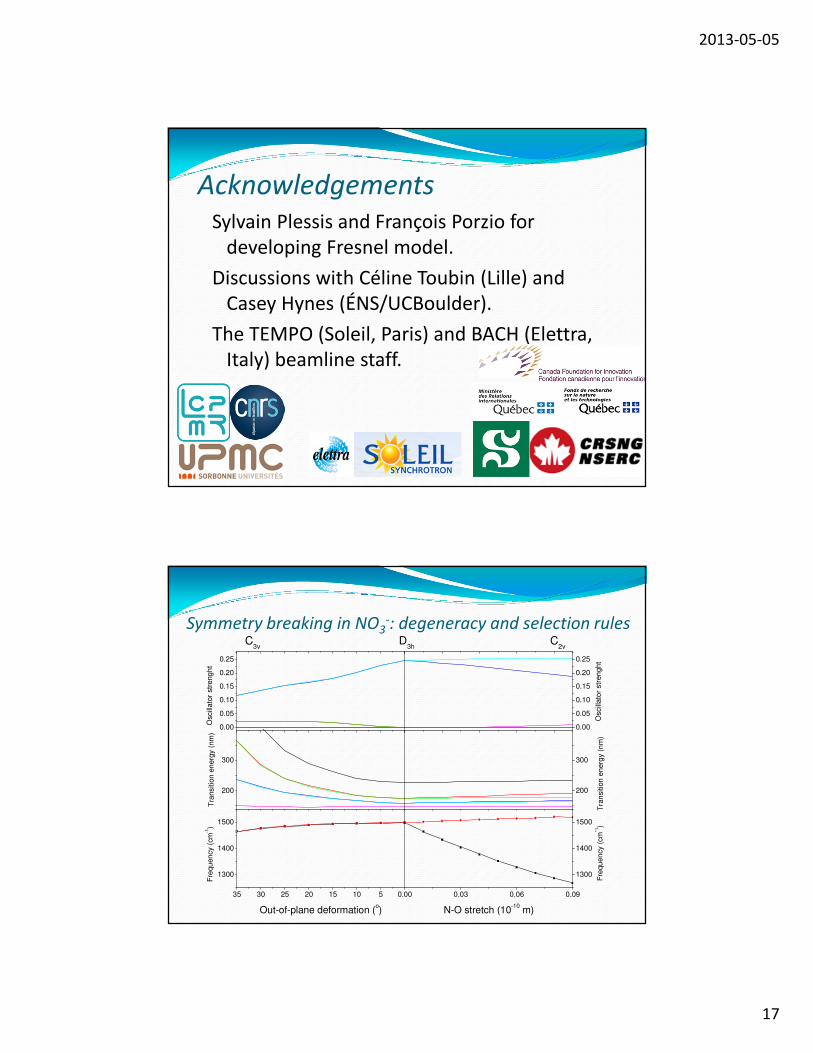
Acknowledgements
Sylvain Plessis and François Porzio for developing Fresnel model.
Discussions with Céline Toubin (Lille) and Casey Hynes (ÉNS/UCBoulder).
The TEMPO (Soleil, Paris) and BACH (Elettra, Italy) beamline staff.
0.00
0.05
0.10
0.15
0.20
0.25
Oscill
ato
r str
en
gh
t
Oscill
ato
r str
eng
ht
0.00
0.05
0.10
0.15
0.20
0.25
200
300
200
300
Tra
nsitio
n e
nerg
y (
nm
)
Tra
nsitio
n e
nerg
y (
nm
)
35 30 25 20 15 10 5
1300
1400
1500
Fre
qu
en
cy (
cm
-1)
Out-of-plane deformation (o)
C3v
D3h
C2v
0.00 0.03 0.06 0.09
1300
1400
1500
Fre
qu
en
cy (
cm
*1)
N-O stretch (10-10
m)
Symmetry breaking in NO3-: degeneracy and selection rules
2013-05-05
18
0.00 0.01 0.02 0.03 0.04 0.05 0.06 0.07 0.08
0
50
100
150
200
Bianco
Bianco
Bianco
Bianco
Gap
(cm
-1)
∆RN-O
(10-10
m)
surface 70 K
mix 70 K
Hudson CaNO2
+
(aq)
Waterland 3 H2O
Waterland 2 H2O
Sullivan NAT
Fernandez NAT
Bianco
Hudson Ca2+
Symmetry breaking in NO3-: degeneracy and selection rules


![Policy Evaluation: Malaysia · industry will participate in the content industry. onsumers will support the Malaysian industry.) [1,3,4/1,2,4,5] Necessity of building a strong ecosystem,](https://static.fdocuments.net/doc/165x107/5f20cc5e68eaae14d43fc907/policy-evaluation-malaysia-industry-will-participate-in-the-content-industry-onsumers.jpg)