
Ionic Polymer-Metal Composites as Residual Stress and Humidity Sensors for PEM Fuel Cells
15
Ionic Polymer-Metal Composites as Residual Stress and Humidity Sensors for PEM Fuel Cells Christopher P. Horvath, Jacob Davidson, Kahlil Detrich, Nakhiah C. Goulbourne August 20, 2008
-
Upload
christopher-p-horvath -
Category
Documents
-
view
218 -
download
3
description
• Background/Motivation: an in-situ sensor device to provide a useful diagnostic for Proton Exchange Membrane (PEM) Fuel Cells
Transcript of Ionic Polymer-Metal Composites as Residual Stress and Humidity Sensors for PEM Fuel Cells

Ionic Polymer-Metal Composites as Residual Stress and Humidity Sensors for PEM Fuel Cells
Christopher P. Horvath, Jacob Davidson, Kahlil Detrich, Nakhiah C. Goulbourne
August 20, 2008
August 20, 2008 Horvath 1
ABSTRACT
In this work research has been done into the feasibility of using Ionic Polymer-Metal
Composites (IPMC) as sensors for residual stress and humidity within Proton Exchange Membrane
(PEM) Fuel Cells. Many methods are currently available for Fuel Cell diagnostics, but each have
their own limitations, and as of yet, there is nothing regarding the residual stresses within the
PEM. The residual stress within the PEM is a suspected cause of failure in fuel cells induced by
the changing humidity and water production as a result of varying performance. IPMCs are an
emerging class of smart materials that can be used for actuation and sensing purposes. As water
and Nafion® based smart materials, IPMCs have the potential to serve as sensors within the fuel
cell. As a residual stress sensor it would provide another useful diagnostic within fuel cells, and
would ideally be for in-situ use. As a humidity sensor it would replace larger apparatuses and
potentially be more cost effective.
To investigate the possibility of using the IPMC as a sensor, several tests were performed.
Tests were carried out using an apparatus that holds the IPMC in tension as it dries from a
hydrated level to a dry state, while measuring the output voltage and the induced stress from
drying. A drying test was performed while applying an input voltage sine function whilst reading
the output voltage. It was found that the amplitude of the output voltage shared a linear
relationship with the induced residual stress. This was the most significant finding since it
showed that with further research, the IPMC shows great promise as a residual stress sensor. A
test without the use of an input voltage showed no simple relation of the output voltage with the
induced residual stress during drying. The tensile properties of the IPMC were also tested using
the setup to move a given distance, thus providing an input deformation. This deformation
caused an output voltage response at the given point of stress. This shows the IPMC in a different
form of sensing than is typical of standard IPMC methods.

August 20, 2008 Horvath 2
1. INTRODUCTION
Within a fuel cell there are several causes and modes of failure in a general respect, as
well as within the proton exchange membrane specifically. The proton exchange membrane is
very often made from Nafion®, a perfluorosulfonate ion conducting polymer which is permeable
to hydrogen protons, but not electrons. Degradation of the membrane is caused by several
conditions, including chemical reactions and mechanical stresses resulting from humidity
changes following variations in power output. In this work Ionic Polymer-Metal Composites
(IPMCs) were examined as possible sensors to determine the condition of a fuel cell membrane.
IPMCs are electroded ion-conducting polymers which can be used for purposes of both actuation
and sensing. It was hypothesized that the properties of the IPMC would allow it to be used in-situ
as a residual stress and humidity sensor for fuel cells, providing another beneficial diagnostic
method. The objective here was to prove the feasibility of using an IPMC as a sensor within a fuel
cell to indicate residual stresses in the membrane as well as humidity level. Background material
is first presented including current fuel cell diagnostics, residual stress measurement techniques,
and IPMC properties and capabilities, followed by experimental results and discussion.
There are currently several methods which have been developed to characterize the
performance of the fuel cell membrane and of the fuel cell itself. However, these current
methods all come with their own disadvantages and their use has not become widespread. A
method developed by General Motors measures both pressure drop and cell resistance to
determine the hydration of the membrane. It was found that when the pressure drop was greater
than expected in the flows of hydrogen and oxygen on their respective sides, then a flooding
condition existed in the fuel cell. Additionally, a correlation of high frequency fuel cell electrical
resistance indicates drying of the membrane [1]. These methods are capable of detecting
problems early for which can then be compensated to prevent early failure. On the downside,
these have significant size and require power input.
A review in the International Journal of Hydrogen Energy [2] has listed and discussed
several recent methods for measuring the health of the fuel cell using electrochemical, physical,
and chemical techniques. Each technology has its own set of advantages and disadvantages. A
polarization curve graphs voltage and current output of the fuel cell while the load in the circuit
is varied. This provides data indicating the performance of the fuel cell itself or the stack as a
whole, but lacks the ability to identify problems more specifically about individual parts within
August 20, 2008 Horvath 3
the fuel cell. Assorted methods exist to further determine the causes of polarization losses, such
as current interrupt and various electrochemical impedance spectroscopy methods [2].
The second part of the review in the International Journal of Hydrogen Energy further
references and discusses methods such as creating a transparent fuel cell for optical diagnosis,
temperature mapping with infrared cameras and micro thermocouples, and current mapping
techniques [3]. Temperature mapping better demonstrates the inefficient areas that produce more
heat, while current density mapping shows the uniformity of the area under reactions which is
important for achieving optimal fuel cell performance. While these techniques and methods
provide means to improving fuel cells in their production, they are not in-situ methods and are
not particularly geared towards use in monitoring the health of the fuel cell in final applications.
These are also more for the fuel cell as a whole, rather than the membrane specifically.
Residual stress is a suspected cause of failure in fuel cell membranes. The residual stress
here is a result of the humidity cycling which causes contraction and expansion of the
membrane. When the membrane wants to shrink or grow, it is restricted by the electrodes and
other parts of the fuel cell. This causes internal stresses in the membrane, resulting in
compression in certain places and tension in others. There are currently numerous methods for
calculating and measuring residual stress in different types of materials. One type of
measurement requires the removal of material through procedures like hole drilling, layer
removal, and the contour method, the last of which can provide a mapping of residual stresses.
Non-invasive procedures typically have limited reach, but can still provide insight without
destroying the material. Such methods include X-ray diffraction, neutron diffraction, and relating
stress to certain known properties of the material. Another method of mapping involves magnetic
testing, but the results are often difficult to correlate to stresses [4]. Other methods also exist for
measuring stress in thin films, such as buckling, rotating, and calculations from measurement of
curvature [5]. To measure residual stress in thin films, micromachining techniques such as
buckling and rotating are used.
In this work IPMCs, an emerging class of smart materials, were approached for use as a
residual stress sensor. IPMCs are made with a central layer of ion conducting polymer, which is
most commonly Nafion®. The polymer is coated on the top and bottom with metal, usually a
noble metal such as platinum or gold. These IPMCs can be used as both actuators and sensors.
As an actuator, a voltage is applied through the thickness of an IPMC in a clamped-free
configuration, causing the free end to displace as the free ions inside the IPMC migrate towards
August 20, 2008 Horvath 4
the cathode. As a sensor, a deformation is applied to the end of the IPMC, causing ion migration
and creating a difference in potential across the faces of the IPMC. This voltage signal can be
correlated to mechanical deformation or to other quantities involved. Farinholt and Leo indicated
that for the purpose of charge sensing, better sensitivity results from a wider sample with shorter
free length [6]. However, when the output is voltage a longer free length has been shown to
provide greater sensitivity [7]. Even though IPMCs have great potential for sensors, research in
this area has been focused mainly on actuation. Kim et al [7] discuss a few applications for
sensors within dynamic sensing, quasi-static sensing, pressure sensing, velocity sensing, and
chemical and electrochemical sensing.
The purpose of this research was to combine these separate areas to make a residual stress
sensor for the proton exchange membrane of fuel cells. The idea is that if the IPMC is clamped at
both ends as it dries, then as it attempts to shrink residual stresses would be induced.
Theoretically, this induced stress would act as an input deformation to produce a voltage output
from the IPMC sensor. While current methods exist for anticipating failure in the membrane, this
method could produce a cheaper, more durable, simpler alternative for diagnostics. It was also
realized that the IPMC could function as a humidity sensor as well, which would significantly
reduce the size of current humidity sensing techniques, and potentially lower power
requirements for sensing input.
Since the IPMC is water and Nafion® based like the Proton Exchange Membrane (PEM), it
has unique advantages over other sensor options which make it suitable for use in the fuel cell.
Since a fuel cell produces water, it necessitates a sensor that can work in water. In fact, since the
IPMC is water based it can sense changes in water production and humidity. Additionally, since
they are both made of Nafion®, it may be possible to electrode certain areas of the PEM into
IPMC sensors. However, if it turns out that the IPMCs interfere with normal operation of the fuel
cell, it could instead be mounted elsewhere within the fuel cell chamber. Furthermore, IPMCs
can be made in any size, which suggests less space, allowing for fit in areas that might otherwise
not be useful.
August 20, 2008 Horvath 5
2. METHODS
IPMCs were created by the Direct Assembly Process, an optimized method of making
IPMCs as developed by Akle et al [8, 9]. After the full-size samples were finished, they were cut
into sample sizes of approximately 30 mm by 3 mm and put to soak in deionized water.
Measurements of length and width were then taken with a Mitutoyo Absolute Digimatic
micrometer, CD-6”CSX, as well as five thickness measurements along its length which were
averaged together (measurements of samples appear in Appendix, Table 1). The electrodes were
scraped off of the outer edges to avoid unintentional shorting during testing. In the second batch
of samples, the same procedure was followed, but measurements of weight were also taken.
Various tests were done with the same basic setup. In a vertical orientation the IPMC
sample was held tightly between two clamps. The top clamp was connected to the force
transducer, Transducer Techniques 1000 g capacity, while the bottom clamp was attached to a
linear stage by Newmark Systems Inc, NLS4 Series. The electrodes were attached to the top
clamp using copper tape on either side of the clamp, which in turn attached to either face of the
IPMC to measure voltage across its thickness. It was necessary to use an op-amp since the output
values of the IPMC were on the order of mVs, and thus too small to accurately read values into
the computer. This output was then read into LabView through a DAQ, NI SCB-68. The op-amp
circuit used was modeled after the design for a short circuit current measurement found in an
IPMC review paper [7]. It was modified slightly, with another resistor placed at the front of the
circuit to make it a differential amplifier, since one face of the IPMC was connected to ground.
The op-amp used was an OP 177, with resistors one and two being 2.2 MΩ, and 26.6 KΩ
respectively, shown in Fig. 1(a). This resulted in a voltage gain of about 83, which was later used
to find the real values of the voltages output by the IPMC. The signal from the force transducer
was calibrated by using known masses, and attaining a conversion factor. Then, stress was
calculated as force divided by the IPMC cross sectional area.
When the sample was not being used it was stored in deionized water to remain
hydrated. To begin a test, the sample was taken out of water and patted between pieces of filter
paper to remove excess water from the surface. It was then placed in the clamp with the output
leads connecting to the faces of the IPMC. Next, the leads were connected to the circuit to check
for good electrical contact and ensure no shorting. Afterwards, the clamp was attached to the
force transducer and the bottom of the IPMC was secured with the bottom clamps. Lastly, wires
were attached to the IPMC copper tape leads using alligator clips to read the output voltage and

August 20, 2008 Horvath 6
the data started recording after the sample was out of water for two and a half minutes. This was
the basic test procedure; changes to this procedure are noted in each case as applicable.
The first batch of samples was used to test for tensile sensing. Samples were used to find a
voltage response when pulled in tension, at equal intervals up to a strain of about 15%, and
stress up to 8 MPa. In order to create a simple tension test the linear stage was used to apply
deformation. The associated program allowed the user to choose speeds, distances, and time as
input variables. The stage was programmed to move to a given length, hold for three seconds,
return to the original length for three seconds, and then move to a further distance and repeat.
The second test used the same setup as the simple tension test. Instead of applying a
deformation, however, the voltage of the IPMC was just measured as the sample dried. The
induced residual stress and voltage output were recorded by the computer in LabView. For the
first set of runs data was recorded for about ten minutes. In order to improve the results, the
second runs used additional procedures: shorting the faces before the run to release any build up
of ions, dipping the sample in deionized water an additional four times before placing it in the
setup to ensure full hydration at the start, and collecting data for thirty to forty minutes. The time
was increased to ensure that all relevant drying data was measured. The time for a sample to dry
out completely was found by allowing a sample to dry and weighing it every half hour for several
hours. It was found that after thirty minutes there was no further significant weight loss.
(a) (b)
Input from IPMC
Figure 1(a): Differential Op-Amplifier Circuit Figure 1(b): Experimental Setup
August 20, 2008 Horvath 7
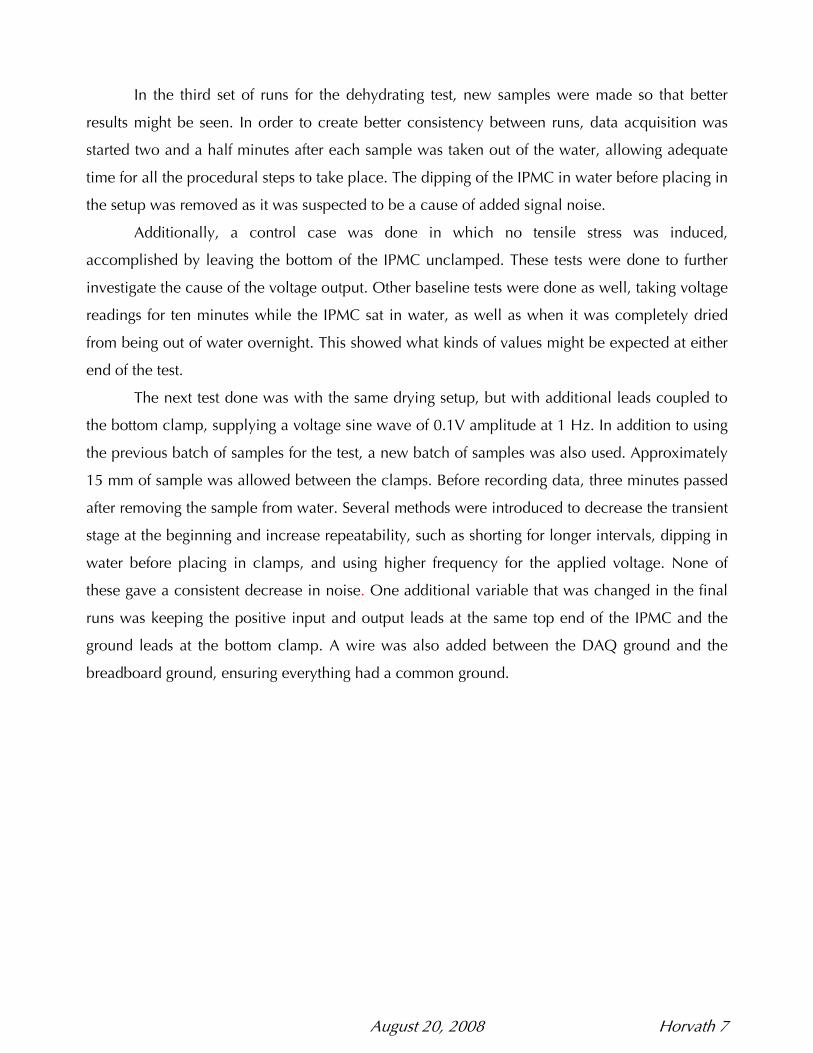
In the third set of runs for the dehydrating test, new samples were made so that better
results might be seen. In order to create better consistency between runs, data acquisition was
started two and a half minutes after each sample was taken out of the water, allowing adequate
time for all the procedural steps to take place. The dipping of the IPMC in water before placing in
the setup was removed as it was suspected to be a cause of added signal noise.
Additionally, a control case was done in which no tensile stress was induced,
accomplished by leaving the bottom of the IPMC unclamped. These tests were done to further
investigate the cause of the voltage output. Other baseline tests were done as well, taking voltage
readings for ten minutes while the IPMC sat in water, as well as when it was completely dried
from being out of water overnight. This showed what kinds of values might be expected at either
end of the test.
The next test done was with the same drying setup, but with additional leads coupled to
the bottom clamp, supplying a voltage sine wave of 0.1V amplitude at 1 Hz. In addition to using
the previous batch of samples for the test, a new batch of samples was also used. Approximately
15 mm of sample was allowed between the clamps. Before recording data, three minutes passed
after removing the sample from water. Several methods were introduced to decrease the transient
stage at the beginning and increase repeatability, such as shorting for longer intervals, dipping in
water before placing in clamps, and using higher frequency for the applied voltage. None of
these gave a consistent decrease in noise. One additional variable that was changed in the final
runs was keeping the positive input and output leads at the same top end of the IPMC and the
ground leads at the bottom clamp. A wire was also added between the DAQ ground and the
breadboard ground, ensuring everything had a common ground.

August 20, 2008 Horvath 8
3. RESULTS
Using a driving voltage for the IPMC produced results that were fairly clear. The output
voltage was also in the form of a sine wave, with decaying amplitude over time (Figure 2).
Several runs showed that the beginning often consisted of noise while the sine wave moved to
center itself on zero (Figure 7(a) in the Appendix shows a voltage output graph). In each run,
once the output was centered at zero, there was a fairly linear relationship between the stress and
the voltage amplitude. The last modification with the positive leads at the same end of the IPMC
proved to have the best results. Generally, this method showed an improvement of lengthened
linear section, but the transient stage at the beginning still occurred in various runs. The transient
stage appeared different, with much larger amplitude than when the leads were at opposite ends.
Additional runs appear in the Appendix; Figures 7 and 8 have positive leads at opposite ends,
and Figures 9 and 10 have positive leads at same end. Another difference seen with the last
modification was that certain values of amplitude were more consistent with their relation to
stress value than the runs before them. However, the transient stage and the voltage to stress
relation still have room for improvement. The lack of great consistency was most likely due to the
conditions in which they were tested, which included drying in air and required the removal and
handling of the sample between runs of the experiment.
Simply measuring and recording the output voltage of the IPMC while it dried in air
without an input voltage did not provide a good correlation to stress. While the stress curves
were fairly consistent between runs, the voltage output was erratic and unpredictable. One thing
to conclude was that the output voltage at the original or hydrated level was on the order of 10
mV, while the measurement at the end was near to 0 mV when dry (Figure 3).
Figure 2(a): Stress & Amplitude vs. Time Graph for Drying With Input Voltage, positive leads at
same end (Sample 7 Run 1)
Figure 2(b): Stress vs. Amplitude Graph for Drying With Input Voltage, positive leads at same end
(Sample 7 Run 1)
August 20, 2008 Horvath 9
1
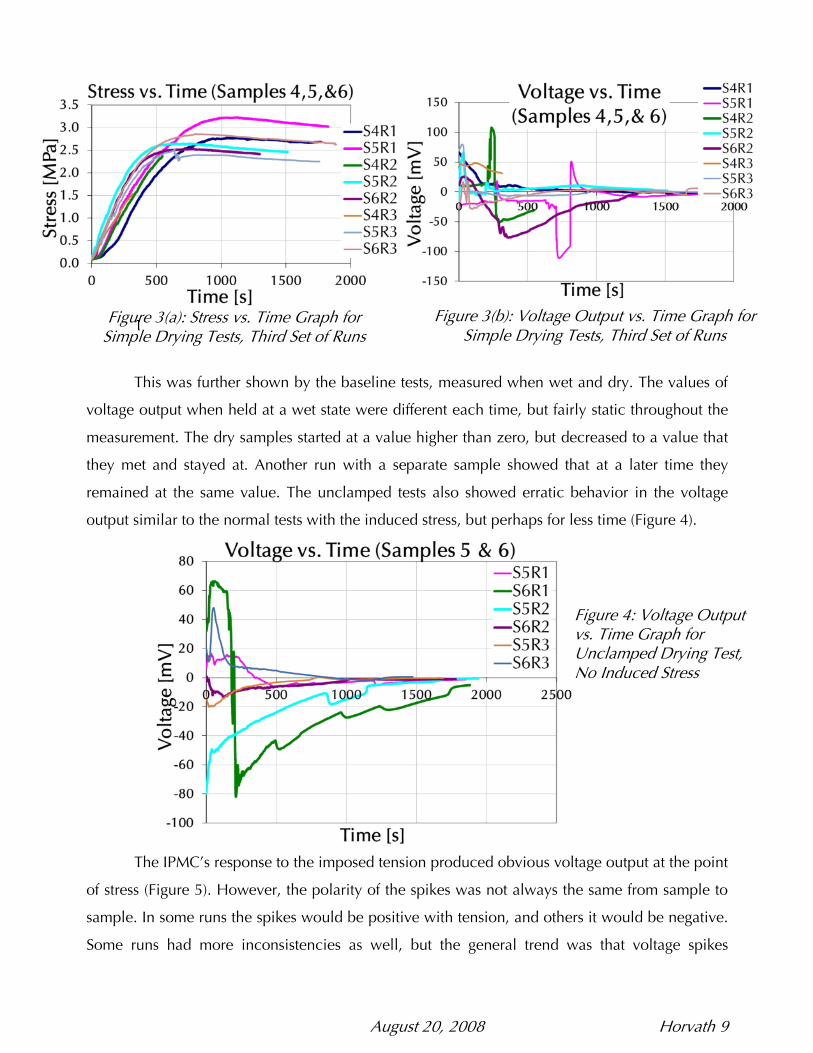
This was further shown by the baseline tests, measured when wet and dry. The values of
voltage output when held at a wet state were different each time, but fairly static throughout the
measurement. The dry samples started at a value higher than zero, but decreased to a value that
they met and stayed at. Another run with a separate sample showed that at a later time they
remained at the same value. The unclamped tests also showed erratic behavior in the voltage
output similar to the normal tests with the induced stress, but perhaps for less time (Figure 4).
The IPMC’s response to the imposed tension produced obvious voltage output at the point
of stress (Figure 5). However, the polarity of the spikes was not always the same from sample to
sample. In some runs the spikes would be positive with tension, and others it would be negative.
Some runs had more inconsistencies as well, but the general trend was that voltage spikes
Figure 3(a): Stress vs. Time Graph for Simple Drying Tests, Third Set of Runs
Figure 3(b): Voltage Output vs. Time Graph for Simple Drying Tests, Third Set of Runs
Figure 4: Voltage Output vs. Time Graph for Unclamped Drying Test, No Induced Stress

August 20, 2008 Horvath 10
resulted from the imposed tensile stress (see Appendix for additional runs). Since this sensing
mechanism appeared to be different from typical IPMC sensing which involves bending
configuration, additional samples are being made to test the sensing theory and these will be
examined in the future.
Figure 5: Voltage and Stress vs. Time Graph
for IPMC Tension Test (Sample 3 Run 4)
August 20, 2008 Horvath 11
4. DISCUSSION AND CONCLUSIONS
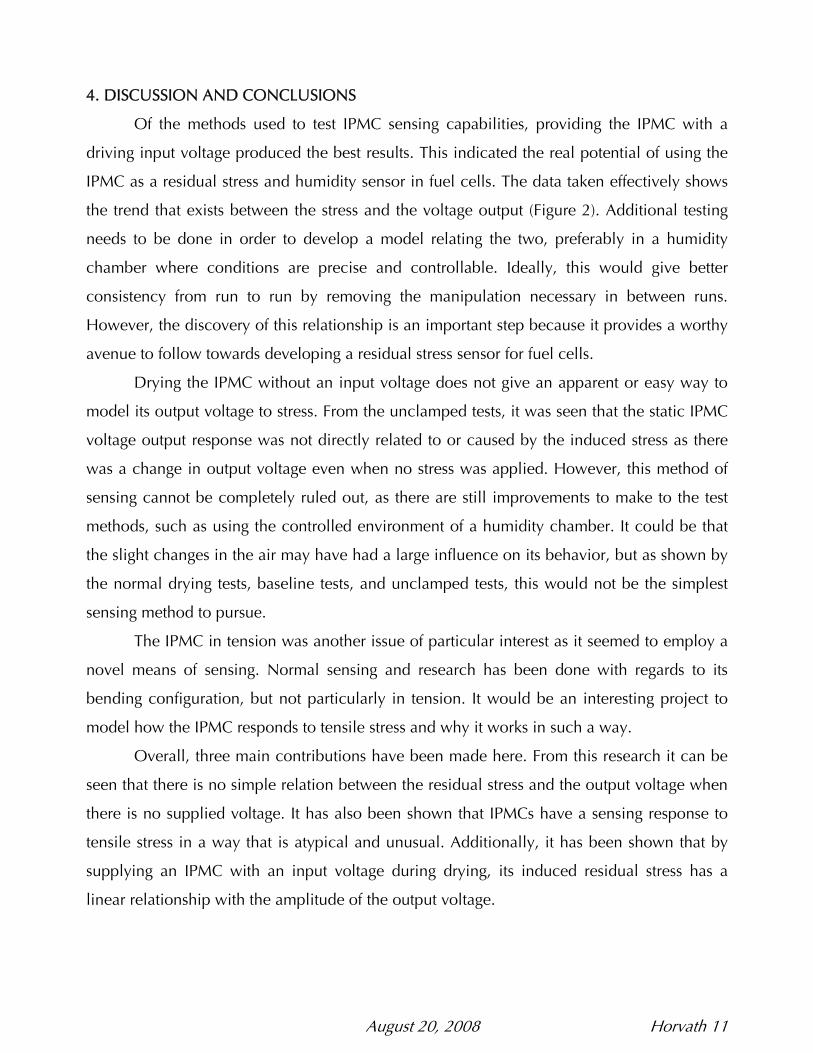
Of the methods used to test IPMC sensing capabilities, providing the IPMC with a
driving input voltage produced the best results. This indicated the real potential of using the
IPMC as a residual stress and humidity sensor in fuel cells. The data taken effectively shows
the trend that exists between the stress and the voltage output (Figure 2). Additional testing
needs to be done in order to develop a model relating the two, preferably in a humidity
chamber where conditions are precise and controllable. Ideally, this would give better
consistency from run to run by removing the manipulation necessary in between runs.
However, the discovery of this relationship is an important step because it provides a worthy
avenue to follow towards developing a residual stress sensor for fuel cells.
Drying the IPMC without an input voltage does not give an apparent or easy way to
model its output voltage to stress. From the unclamped tests, it was seen that the static IPMC
voltage output response was not directly related to or caused by the induced stress as there
was a change in output voltage even when no stress was applied. However, this method of
sensing cannot be completely ruled out, as there are still improvements to make to the test
methods, such as using the controlled environment of a humidity chamber. It could be that
the slight changes in the air may have had a large influence on its behavior, but as shown by
the normal drying tests, baseline tests, and unclamped tests, this would not be the simplest
sensing method to pursue.
The IPMC in tension was another issue of particular interest as it seemed to employ a
novel means of sensing. Normal sensing and research has been done with regards to its
bending configuration, but not particularly in tension. It would be an interesting project to
model how the IPMC responds to tensile stress and why it works in such a way.
Overall, three main contributions have been made here. From this research it can be
seen that there is no simple relation between the residual stress and the output voltage when
there is no supplied voltage. It has also been shown that IPMCs have a sensing response to
tensile stress in a way that is atypical and unusual. Additionally, it has been shown that by
supplying an IPMC with an input voltage during drying, its induced residual stress has a
linear relationship with the amplitude of the output voltage.

August 20, 2008 Horvath 12
5. APPENDIX
Sample Length [mm]
Width [mm]
Thickness [mm]
Weight [g]
1 28.09 3.59 0.191
2 27.57 2.67 0.195
3 26.93 2.88 0.19175
Second Batch
4 33.16 3.53 0.2016 0.0407
5 32.97 2.39 0.212 0.0302
6 32.6 2.94 0.21 0.0337
Third Batch
7 32.45 2.86 0.2078 0.3024
8 32.70 2.78 0.205 0.032
9 32.54 2.81 0.218 0.0326
10 32.58 3.12 0.202 0.0366
(a) (b)
Figure 7(a): Voltage output vs. Time Graph for Drying With Input Voltage, positive leads at
opposite ends (Sample 4 Run 1)
Figure 7(b): Stress and Amplitude vs. Time Graph for Drying With Input Voltage, positive leads at
opposite ends (Sample 4 Run 1)
Figure 6(a): IPMC Tensile Test, Sample 3 Run 7 Figure 6(b): IPMC Tensile Test, Sample 3 Run 5
Table 1: Measurements for IPMC samples used
August 20, 2008 Horvath 13
Figure 9(a): Stress & Amplitude vs. Time Graph for Drying With Input Voltage, positive leads at
same end (Sample 8 Run 2)
Figure 8(a): Stress & Amplitude vs. Time Graph for Drying With Input Voltage, positive leads at
opposite ends (Sample 4 Run 2)
Figure 10(a): Stress & Amplitude vs. Time Graph for Drying With Input Voltage, positive leads at
same end (Sample 8 Run 1)
Figure 10(b): Stress vs. Amplitude Graph for Drying With Input Voltage, positive leads at
same end (Sample 8 Run 1)
Figure 9(b): Stress vs. Amplitude Graph for Drying With Input Voltage, positive leads at
same end (Sample 8 Run 2)
Figure 8(b): Stress vs. Amplitude Graph for Drying With Input Voltage, positive leads at opposite ends
(Sample 4 Run 2)

August 20, 2008 Horvath 14
6. REFERENCES
1. Barbir, F.; Gorgun, H.; Wang, X., Relationship between pressure drop and cell resistance
as a diagnostic tool for PEM fuel cells. Journal of Power Sources 2005, 141, (1), 96-101.
2. Wu, J.; Yuan, X. Z.; Wang, H.; Blanco, M.; Martin, J. J.; Zhang, J., Diagnostic tools in PEM
fuel cell research: Part I Electrochemical techniques. International Journal of Hydrogen
Energy 2008, 33, (6), 1735-1746.
3. Wu, J.; Zi Yuan, X.; Wang, H.; Blanco, M.; Martin, J. J.; Zhang, J., Diagnostic tools in PEM
fuel cell research: Part II: Physical/chemical methods. International Journal of Hydrogen
Energy 2008, 33, (6), 1747-1757.
4. Withers, P. J.; Turski, M.; Edwards, L.; Bouchard, P. J.; Buttle, D. J., Recent advances in
residual stress measurement. International Journal of Pressure Vessels and Piping 2008,
85, (3), 118-127.
5. He, Q.; Luo, Z. X.; Chen, X. Y., Comparison of residual stress measurement in thin films
using surface micromachining method. Thin Solid Films 2008, 516, (16), 5318-5323.
6. Kevin, M. F.; Donald, J. L. Electromechanical modeling of charge sensing in ionic
polymers. Smart Structures and Materials 2003: Active Materials: Behavior and
Mechanics. 2003; Dimitris, C. L., Ed. SPIE: 2003; pp 13-24.
7. Kim, K. J.; Paquette, J.; Donald, J. L.; Farinholt, K. M., Ionic Polymer-Metal Composites for
Sensory Applications, a review chapter. In Encyclopedia of Sensors, Grimes, C. A.;
Dickey, E. C.; Pishko, M. V., Eds. American Scientific Publishers: 2006; Vol. 5, pp 97-
116.
8. B. Akle et al., "Direct assembly process: a novel fabrication technique for large strain
ionic polymer transducers," Journal of Materials Science, vol. 42, 2007, pp. 7031-7041.
9. B.J. Akle, "Characterization and Modeling of the Ionomer-Conductor Interface in Ionic
Polymer Transducers," (PhD dissertation, Virginia Polytechnic Institute and State
University, 2005).
10. Cover Page Image Credits
PEM Fuel Cell: <http://www.fueleconomy.gov/feg/fcv_pem.shtml>
IPMC Actuation <http://ieeexplore.ieee.org/iel5/6/28951/1303370/1303370f3.html>