Ion Mobility Analysis of Molecular Dynamics
26
Ion Mobility Analysis of Molecular Dynamics Thomas Wyttenbach, 1 Nicholas A. Pierson, 2 David E. Clemmer, 2 and Michael T. Bowers 1 1 Department of Chemistry and Biochemistry, University of California, Santa Barbara, California 93106; email: [email protected] 2 Department of Chemistry, Indiana University, Bloomington, Indiana 47405; email: [email protected] Annu. Rev. Phys. Chem. 2014. 65:175–96 First published online as a Review in Advance on December 9, 2013 The Annual Review of Physical Chemistry is online at physchem.annualreviews.org This article’s doi: 10.1146/annurev-physchem-040513-103644 Copyright c 2014 by Annual Reviews. All rights reserved Keywords biomolecule, conformation, solution structure, gas-phase structure, IMS-IMS Abstract The combination of mass spectrometry and ion mobility spectrometry (IMS) employing a temperature-variable drift cell or a drift tube divided into sec- tions to make IMS-IMS experiments possible allows information to be ob- tained about the molecular dynamics of polyatomic ions in the absence of a solvent. The experiments allow the investigation of structural changes of both activated and native ion populations on a timescale of 1–100 ms. Five different systems representing small and large, polar and nonpolar molecules, as well as noncovalent assemblies, are discussed in detail: a dinucleotide, a sodiated polyethylene glycol chain, the peptide bradykinin, the protein ubi- quitin, and two types of peptide oligomers. Barriers to conformational inter- conversion can be obtained in favorable cases. In other cases, solution-like native structures can be observed, but care must be taken in the experimental protocols. The power of theoretical modeling is demonstrated. 175 Annu. Rev. Phys. Chem. 2014.65:175-196. Downloaded from www.annualreviews.org by ALI: Academic Libraries of Indiana on 04/07/14. For personal use only.
Transcript of Ion Mobility Analysis of Molecular Dynamics
PC65CH09-Wyttenbach ARI 5 March 2014 17:59
Ion Mobility Analysisof Molecular DynamicsThomas Wyttenbach,1 Nicholas A. Pierson,2
David E. Clemmer,2 and Michael T. Bowers1
1Department of Chemistry and Biochemistry, University of California, Santa Barbara,California 93106; email: [email protected] of Chemistry, Indiana University, Bloomington, Indiana 47405;email: [email protected]
Annu. Rev. Phys. Chem. 2014. 65:175–96
First published online as a Review in Advance onDecember 9, 2013
The Annual Review of Physical Chemistry is online atphyschem.annualreviews.org
This article’s doi:10.1146/annurev-physchem-040513-103644
Copyright c© 2014 by Annual Reviews.All rights reserved
Keywords
biomolecule, conformation, solution structure, gas-phase structure,IMS-IMS
Abstract
The combination of mass spectrometry and ion mobility spectrometry (IMS)employing a temperature-variable drift cell or a drift tube divided into sec-tions to make IMS-IMS experiments possible allows information to be ob-tained about the molecular dynamics of polyatomic ions in the absence ofa solvent. The experiments allow the investigation of structural changes ofboth activated and native ion populations on a timescale of 1–100 ms. Fivedifferent systems representing small and large, polar and nonpolar molecules,as well as noncovalent assemblies, are discussed in detail: a dinucleotide, asodiated polyethylene glycol chain, the peptide bradykinin, the protein ubi-quitin, and two types of peptide oligomers. Barriers to conformational inter-conversion can be obtained in favorable cases. In other cases, solution-likenative structures can be observed, but care must be taken in the experimentalprotocols. The power of theoretical modeling is demonstrated.
175
Ann
u. R
ev. P
hys.
Che
m. 2
014.
65:1
75-1
96. D
ownl
oade
d fr
om w
ww
.ann
ualr
evie
ws.
org
by A
LI:
Aca
dem
ic L
ibra
ries
of
Indi
ana
on 0
4/07
/14.
For
per
sona
l use
onl
y.
PC65CH09-Wyttenbach ARI 5 March 2014 17:59
Ion funnel: radiofrequency device toguide and focus ionsthrough a narrowopening in thepresence of abackground gas
Electrosprayionization (ESI):method used in massspectrometry to formdesolvated analyte ionsfrom a dilute solution
Ion mobility:quantity defined by theion drift velocity in agiven uniform electricfield in an ion mobilityspectrometryexperiment
Ion mobilityspectrometry (IMS):separation methodemploying an electricfield to disperse ions inthe gas phase based ontheir collision crosssection in a buffer gas
INTRODUCTION
In recent years, mass spectrometry (MS) has evolved as an extremely powerful analytical tool. Manyfactors are responsible for this development, including the intrinsically high sensitivity and speedof MS analysis, technological advances in ion formation and ion handling (e.g., radio frequency de-vices such as ion funnels), and progress in data analysis and the manipulation of vast amounts of data.The field of biochemistry is clearly one of the great beneficiaries of modern MS. It is possible todayto directly inject minute amounts of a dilute solution of a biological sample into the source of a massspectrometer and quantitatively characterize the composition of the solution within seconds (1).
Whereas today’s MS methods predominantly probe the primary structure of a biopolymer,the great success of MS raises the question whether MS-based technology can also be used tocharacterize secondary, tertiary, and quaternary structures of proteins, thereby making it a fastand sensitive complementary method to nuclear magnetic resonance (NMR) and X-ray crystallog-raphy. Because one of the most widespread ionization methods used today in MS is electrosprayionization (ESI), in which samples to be analyzed originate in solution and analytes are gentlydesolvated only milliseconds before MS analysis (2), the solution-like folding of a protein has thepotential to survive the transition into the mass spectrometer. However, the folding of a proteinwill eventually change in the absence of a solvent. Therefore, a relevant question is, What is themolecular dynamics (MD) occurring on the timescale of a typical MS analysis?
Here we review how ion mobility spectrometry (IMS) can be used to address the question of thestructural evolution of a molecule inside the mass spectrometer. IMS characterizes the shape ofan ion (3, 4) in the gas phase, and dynamic effects can be seen as a change of shape as a function oftime or temperature. Important experimental setups in this context are temperature-controllableIMS drift tubes (5, 6) and drift tubes with multiple segments and gates to allow for IMS-IMSexperiments (7). Readers are referred to the sidebar, Methods and Instrumentation, for additionalinformation and the literature for IMS fundamentals (8) and IMS-MS theory, instrumentation,and applications (6, 9).
SMALL MOLECULES
The conformation of a large molecule (e.g., a protein) is held together by large intramolecularforces. These forces are the result of a highly optimized system of countless hydrogen bonds, salt
METHODS AND INSTRUMENTATION
The work reviewed here was carried out on a series of custom-built mass spectrometers, each equipped with anIMS drift tube. Ions are formed by standard ionization methods (ESI or MALDI) and subsequently analyzed bymass and ion mobility in helium. Mass analysis can occur before or after IMS analysis. IMS requires a narrow ionpulse entering the drift tube. A gated ion funnel is frequently used as an ion storage device to convert a continuousion beam into pulses, often with little ion loss. Ions travel through the IMS drift tube under the influence of auniform electric field in the presence of several torr of helium. The helium-ion collision frequency is >108 s−1,and collisions are essentially thermal: The ion kinetic energy gained due to the presence of the electric drift fieldis ≤1% of the thermal collision energy. Experimental measurement of the drift time allows evaluation of the ionmobility and collision cross section. Special instrumental features required to investigate ion dynamics in the gasphase include a temperature-variable drift cell or a drift tube divided into sections to allow IMS-IMS experiments,with the possibility of ion selection based on cross section in the first IMS section followed by optional ion activationand structural analysis in the second IMS section.
176 Wyttenbach et al.
Ann
u. R
ev. P
hys.
Che
m. 2
014.
65:1
75-1
96. D
ownl
oade
d fr
om w
ww
.ann
ualr
evie
ws.
org
by A
LI:
Aca
dem
ic L
ibra
ries
of
Indi
ana
on 0
4/07
/14.
For
per
sona
l use
onl
y.
PC65CH09-Wyttenbach ARI 5 March 2014 17:59
Molecular dynamics(MD) simulation:theoretical methodemploying empiricalforce fields to explorethe structure anddynamics of molecularmodels
Matrix-assisted laserdesorption/ionization (MALDI):laser desorptionmethod used in massspectrometry to formgas-phase ions from asolid analyteembedded in a matrix
Arrival timedistribution (ATD):temporal distributionof ions arriving at thedetector; iondispersion occursbecause of randomdiffusion and ionpopulations withdifferent cross sections
bridges, attractions between polar groups, and other interactions. In a small molecule, conversely,not only is the number of intramolecular interactions much smaller, but also the existing inter-actions are often not optimal. The limited number of degrees of freedom in a small moleculegenerally does not allow a high level of optimization of the geometry (e.g., alignment of hydrogenbonds) in intramolecular interactions. Therefore, we expect that the relatively weak noncovalentinteractions result in relatively low barriers for interconversion, even between two substantiallydifferent conformations. A consequence of low barriers is rapid kinetics and thus highly dynamicsystems even at (or below) room temperature. Therefore, small molecules seem to be ideal candi-dates to observe dynamic effects in the gas phase.
However, the small number of degrees of freedom in small molecules and steric constraintsalso limits the number of possible conformations. Hence, many small molecules populate just oneconformation and are not interesting in terms of dynamics. Moreover, even if more than oneconformation is populated, the relative arrangement of the atoms in the molecule may vary onlyslightly from one conformation to the other, limiting dynamic effects and detection by IMS.
Based on previous work (10, 11), we find that dinucleotides have the right mix of properties:They are small and rigid enough to assume only a small number of notably different conformations,but at the same time they are large enough to exhibit a substantial change in molecular shape fromone type of conformation to another. MD simulations indicate (10, 11) that structures can begrouped into a family of open quasi-linear structures in which the nucleobases do not interactwith each other and a family of folded structures with interacting nucleobases (π-stacking orhydrogen bond).
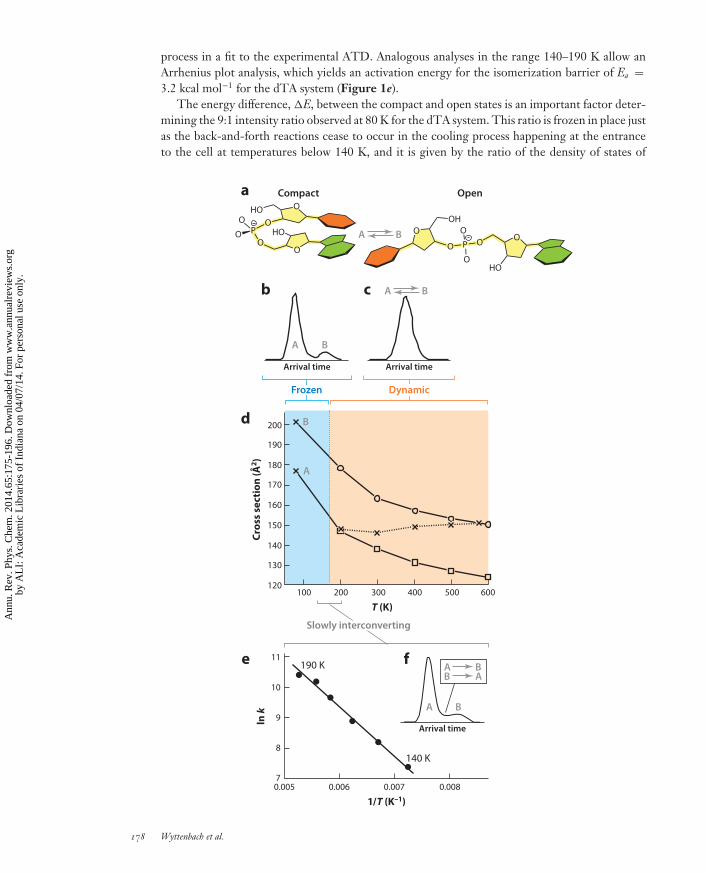
Consequently, the deprotonated dinucleotide dTA shows two resolved peaks in the ion mobilityspectrum (11) obtained in helium buffer gas cooled to 80 K (Figure 1b). The compact-to-openintensity ratio of the two conformations is 9:1. However, at approximately 140 K, peak B in themobility spectrum (open conformation) becomes a shoulder of the large peak (Figure 1f ), andabove 190 K, the shoulder has disappeared and one narrow peak remains (Figure 1c). In addition,the cross section deduced from the peak position increases slightly from 146 A2 at 300 K to 151 A2
at 570 K, whereas theory predicts a decrease from 163 A2 to 150 A2 for an open structure and adecrease from 138 A2 to 124 A2 for a compact dTA structure in the range 300–600 K (Figure 1d ).The base-base interaction in the compact dTA model structure results from π-stacking of the twoaromatic systems.
How do we rationalize these observations? Ions are generated by matrix-assisted laser desorp-tion/ionization (MALDI) (12, 13) in these experiments and travel in vacuum at room temperatureto the IMS drift cell (11). Hence, ions are expected to be hot initially upon laser evaporization, butcooling starts immediately in the expansion off the matrix surface. Ions are likely still somewhathot upon leaving the source, but if they are subthermal at this point, they get another chance tobe heated as they approach the IMS drift cell, where they undergo slightly above-thermal colli-sions with helium streaming out of the cell. Inside the cell, ions quickly thermalize. Equilibriumexperiments (14) confirm that thermal equilibration occurs rapidly on the experimental timescale(0.1–1 ms); therefore, as ions drift through the instrument, they spend the majority of time in thisstate of equilibrium.
The 80-K experiment indicates that most dTA ions (90%) are frozen into a compact conforma-tion at this temperature, whereas a smaller fraction (10%) is frozen open. The observation of tworesolved peaks in the arrival time distribution (ATD) indicates that no interconversion betweenthe two populations of structures occurs during the experiment.
At 140 K, the two ATD peaks are no longer fully resolved, indicating that interconversion be-tween the compact and open structures does happen during the drift time. Using a theoretical sim-ulation based on transport theory (15), one can evaluate the rate constant for the open → compact
www.annualreviews.org • Ion Mobility Analysis of Molecular Dynamics 177
Ann
u. R
ev. P
hys.
Che
m. 2
014.
65:1
75-1
96. D
ownl
oade
d fr
om w
ww
.ann
ualr
evie
ws.
org
by A
LI:
Aca
dem
ic L
ibra
ries
of
Indi
ana
on 0
4/07
/14.
For
per
sona
l use
onl
y.
PC65CH09-Wyttenbach ARI 5 March 2014 17:59
process in a fit to the experimental ATD. Analogous analyses in the range 140–190 K allow anArrhenius plot analysis, which yields an activation energy for the isomerization barrier of Ea =3.2 kcal mol−1 for the dTA system (Figure 1e).
The energy difference, �E, between the compact and open states is an important factor deter-mining the 9:1 intensity ratio observed at 80 K for the dTA system. This ratio is frozen in place justas the back-and-forth reactions cease to occur in the cooling process happening at the entranceto the cell at temperatures below 140 K, and it is given by the ratio of the density of states of
100 600200 500400300
Arrival time
120
200
130
140
150
160
170
180
190
Cro
ss s
ect
ion
(Å
2)
0.005 0.0080.0070.006
140 K
190 K
7
11
10
8
9ln k
1/T (K–1)
b c
d
fe
A
B
Arrival time
T (K)
A B
A B
B A
a
P
O
O
OO
OO
HO
OHP
OO
O
OHO
O
HO
O
A B
A B
DynamicFrozen
Slowly interconverting
A B
Arrival time
178 Wyttenbach et al.
Ann
u. R
ev. P
hys.
Che
m. 2
014.
65:1
75-1
96. D
ownl
oade
d fr
om w
ww
.ann
ualr
evie
ws.
org
by A
LI:
Aca
dem
ic L
ibra
ries
of
Indi
ana
on 0
4/07
/14.
For
per
sona
l use
onl
y.

PC65CH09-Wyttenbach ARI 5 March 2014 17:59
(Collision) crosssection: size of an ionevaluated by ionmobility spectrometry;kinetic theory providesan expressionconnecting the ionmobility with thecollision cross section
the two conformations at that point (16). Employing RRKM (Rice-Ramsperger-Kassel-Marcus)theory (17) and semiempirical calculations (18) for obtaining vibrational frequencies is a strategyfor estimating the density of states of both conformations at an energy level corresponding to thetop of the barrier. Moreover, by varying �E in the calculation until a match with the experimental9:1 ratio is obtained, we get an idea of the magnitude of �E. Although this type of calculation hasnot been carried out for dTA itself, �E values of 2.4 and 0.3 kcal mol−1 have been reported for thesimilar dTG and dGT systems [with barriers of Ea = 3.9 and 2.8 kcal mol−1 (10)], respectively (6).
Above 190 K, interconversion between the open and compact dTA conformations occursrapidly, and each individual molecule travels part of the way in an open conformation and part ofthe way in a compact conformation. Assuming rapid interconversion, the ratio of time spent in anopen or compact conformation is given by the interconversion equilibrium constant. This resultsin a narrow ATD. The compact-to-open ratio obviously determines the drift time observed, andbecause the equilibrium shifts with increasing temperature in favor of the open conformation,the measured cross section increases with temperature. A comparison with theoretical modeling(Figure 1d ) indicates that at 300 K the dTA molecules must travel about two-thirds of theirtotal drift time as a compact structure (138 A2) and one-third as an open structure (163 A2) toarrive at the experimental value of 146 A2 (11). Near 600 K, conversely, dTA ions must spendnearly 100% of their time in an open conformation (150 A2) to get a match with experiment(151 A2). The theoretically predicted and experimentally confirmed (19) decrease in cross sectionwith increasing temperature for a given rigid structure (e.g., 163 A2 and 150 A2 for the open dTAstructure at 300 K and 600 K, respectively; Figure 1d ) results from the reduced importance ofthe ion-helium interaction at elevated temperature (i.e., significant attractive ion-helium forces atlow temperatures and essentially hard-sphere collisions at high temperatures) (8, 9).
How representative are the dTA results for dinucleotides in general? All 16 possible dinucle-otide sequences have been analyzed by IMS as a function of temperature, and in all cases, twoor three distinct families of structures are populated at 80 K (11). MD simulations indicate thatthe transition from one family to another involves the breaking or formation of an interactionbetween the two bases. The base-base interaction results from either π-stacking (as in dTA) ora hydrogen bond (11). For dAC, dCC, dGC, and dTC, the ATD reveals the presence of allthree types of conformations (open, π-stacking, hydrogen bond) side by side at 80 K with thehydrogen-bonded conformation being less compact than π-stacking but more compact than theopen conformation. For the other 12 dinucleotides, the population of structures is frozen into twofamilies of conformations at 80 K, but the type of family present varies with nucleotide sequence.
←−−−−−−−−−−−−−−−−−−−−−−−−−−−−−−−−−−−−−−−−−−−−−−−−−−−−−−−−−−−−−−−−−−−−−−−−Figure 1Ion mobility spectrometry (IMS) data of the deprotonated dinucleotide dTA indicating frozen conformersbelow 140 K and a highly dynamic system above 190 K. For temperatures in between, interconversionbetween conformers is slow and takes place for a fraction of dTA ions only. (a) Schematic representation of acompact dinucleotide conformation A and an open conformation B based on molecular dynamicscalculations. (b) 80-K arrival time distribution (ATD), showing two frozen isomers, A and B. (c) ATD above200 K with one narrow peak. (d ) Cross section as a function of temperature. The crosses indicateexperimental data. Squares and circles indicate calculated cross sections for compact and open theoreticalcandidate structures, respectively. The solid and dotted lines connecting data points help guide the eye.(e) Arrhenius plot of the B → A rate constant k in the range 140–190 K. ( f ) ATD shape typical for slowlyinterconverting systems. With increasing temperature, the intensity of the shoulder B shifts increasinglymore to shorter arrival times and eventually merges with the intense peak A. A fit of the simulated ATD tothe experimental data yields a value for k. (The reverse reaction A → B is present too but with a rate constanttoo small to be determined accurately enough for an Arrhenius plot.) Figure reproduced in part fromReference 11 with permission of European Physical Journal. Copyright SIF and Springer.
www.annualreviews.org • Ion Mobility Analysis of Molecular Dynamics 179
Ann
u. R
ev. P
hys.
Che
m. 2
014.
65:1
75-1
96. D
ownl
oade
d fr
om w
ww
.ann
ualr
evie
ws.
org
by A
LI:
Aca
dem
ic L
ibra
ries
of
Indi
ana
on 0
4/07
/14.
For
per
sona
l use
onl
y.

PC65CH09-Wyttenbach ARI 5 March 2014 17:59
However, interconversion is turned on with increasing temperature in all cases, and barriers weresuccessfully measured for 11 dinucleotides (11). Measured Ea values range from 0.8 to 4.1 kcalmol−1, and crossing these barriers is rapid at room temperature. An exception is one transitionin dCC that exhibits a barrier of 12.9 kcal mol−1 and only becomes rapid above 480 K. Once arapid equilibrium between different conformations is reached at or above room temperature, theequilibrium shifts toward breaking the base-base interaction with increasing temperature in allcases, as it does for dTA (11).
In summary, the dinucleotide results indicate that overcoming a barrier of ≤4 kcal mol−1
is possible at room temperature on the millisecond timescale. A barrier magnitude of 3–4 kcalmol−1 is approximately equal to breaking one water-water hydrogen bond. Conversely, a barrierof 12.9 kcal mol−1, the equivalent of breaking several hydrogen bonds simultaneously, is highenough to prevent isomerization at 300 K within ≤1 ms.
NONPOLAR POLYMERS
Ionic bonds, hydrogen bonds, and electrostatic interactions between polar groups of opposite signgive rise to strong attractive noncovalent interactions. However, nonpolar molecules contain no(or very few) polar groups by definition and therefore lack the ability to form a network of stronginteractions. Hence, we expect a nonpolar polymer chain to be highly dynamic.
However, in the field of MS, we are always dealing with ions. MS methods applied to nonpolarmolecules must include a process of adding a charge to the nonpolar molecule. In the mostcommonly used ionization methods applied today, MALDI and ESI (2, 12, 13), charging of anonpolar molecule most often involves the addition of an alkali ion to the molecule, with theubiquitous sodium ion taking a lead role in this process.
The addition of an atomic ion to a nonpolar molecule has a major effect on the molecule’sdynamics. Even for a nonpolar molecule, the electrostatic ion-neutral interactions are generallysignificant. For larger molecules, this usually leads to a complex with the metal ion buried inside,well solvated by the neutral molecule (20–23). These chelate structures can be quite stable, withrather limited options for intramolecular motion. However, although longer polymer chains alsoform a rigid core around the metal center, there are parts of the polymer that end up in the secondsolvation shell, or even further removed from the charge. And these charge-remote sections canbe highly dynamic in nonpolar polymers.
For many applications, ether is the nonpolar organic solvent of choice, and its polymeric form,polyethylene glycol (PEG) [HO(CH2CH2O)nH], is a great example of a nonpolar polymer. PEG isalso a standard sample used for MS calibration and readily picks up an alkali ion in a MALDI source.
PEG-sodium complexes have been analyzed by IMS as a function of temperature (22). ForPEG oligomer sizes ranging from n = 5 to 19, one narrow peak is observed in the ion mobilityspectrum independent of temperature. This indicates that all polymer conformations are verysimilar or that interconversion between largely different conformations occurs rapidly on theexperimental timescale. An investigation involving temperature-dependent IMS analyses is ableto distinguish between these possibilities.
For sodiated PEG oligomers, the cross section deduced from the IMS peak position as afunction of temperature does not follow the trend expected for a rigid molecule (22). Instead of aslight drop with increasing temperature (19) (see the section Small Molecules and Figure 1d ), thecross section is constant or even increases (Figure 2). The increase is most evident for the largeroligomers in the n = 6–19 series: Whereas the cross section stays essentially constant from 300 Kto 600 K for the sodiated PEG nonamer, it increases by 5% from 204 A2 to 214 A2 over the sametemperature range for the sodiated 17-mer. This is clearly a dynamic effect. Charge-remote loops
180 Wyttenbach et al.
Ann
u. R
ev. P
hys.
Che
m. 2
014.
65:1
75-1
96. D
ownl
oade
d fr
om w
ww
.ann
ualr
evie
ws.
org
by A
LI:
Aca
dem
ic L
ibra
ries
of
Indi
ana
on 0
4/07
/14.
For
per
sona
l use
onl
y.
PC65CH09-Wyttenbach ARI 5 March 2014 17:59
200 300 400 500 600 700
Temperature (K)
130
120
180
140
200
190
220
210
Rigidmodel
Rigidmodel
Dynamicmodel
Dynamicmodel
Experiment
Experiment
Short chain (nonamer)
Long chain (17-mer)
Sodiated PEG
Cro
ss s
ect
ion
(Å
2)
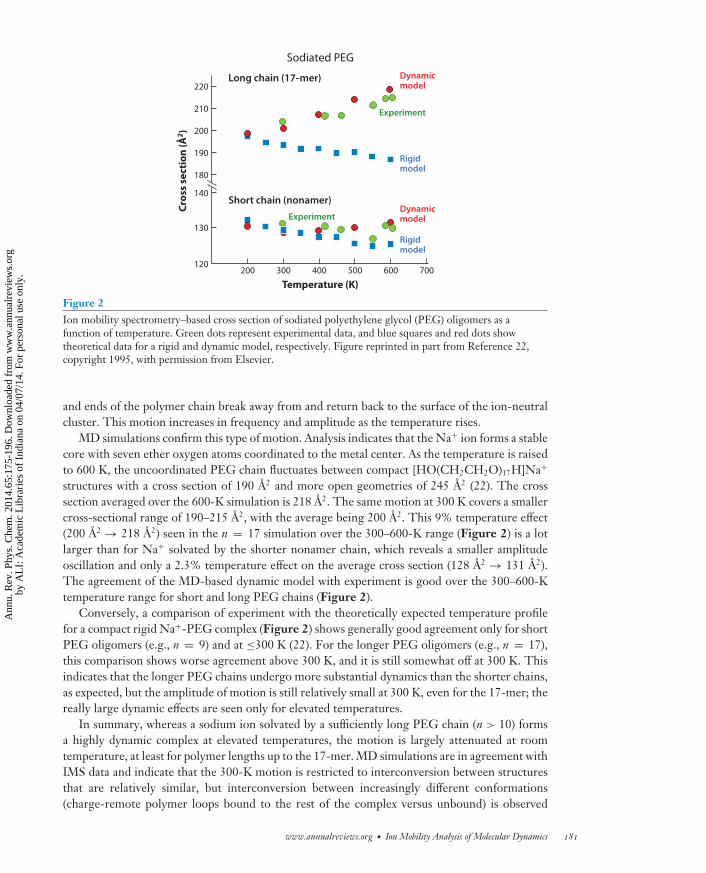
Figure 2Ion mobility spectrometry–based cross section of sodiated polyethylene glycol (PEG) oligomers as afunction of temperature. Green dots represent experimental data, and blue squares and red dots showtheoretical data for a rigid and dynamic model, respectively. Figure reprinted in part from Reference 22,copyright 1995, with permission from Elsevier.
and ends of the polymer chain break away from and return back to the surface of the ion-neutralcluster. This motion increases in frequency and amplitude as the temperature rises.
MD simulations confirm this type of motion. Analysis indicates that the Na+ ion forms a stablecore with seven ether oxygen atoms coordinated to the metal center. As the temperature is raisedto 600 K, the uncoordinated PEG chain fluctuates between compact [HO(CH2CH2O)17H]Na+
structures with a cross section of 190 A2 and more open geometries of 245 A2 (22). The crosssection averaged over the 600-K simulation is 218 A2. The same motion at 300 K covers a smallercross-sectional range of 190–215 A2, with the average being 200 A2. This 9% temperature effect(200 A2 → 218 A2) seen in the n = 17 simulation over the 300–600-K range (Figure 2) is a lotlarger than for Na+ solvated by the shorter nonamer chain, which reveals a smaller amplitudeoscillation and only a 2.3% temperature effect on the average cross section (128 A2 → 131 A2).The agreement of the MD-based dynamic model with experiment is good over the 300–600-Ktemperature range for short and long PEG chains (Figure 2).
Conversely, a comparison of experiment with the theoretically expected temperature profilefor a compact rigid Na+-PEG complex (Figure 2) shows generally good agreement only for shortPEG oligomers (e.g., n = 9) and at ≤300 K (22). For the longer PEG oligomers (e.g., n = 17),this comparison shows worse agreement above 300 K, and it is still somewhat off at 300 K. Thisindicates that the longer PEG chains undergo more substantial dynamics than the shorter chains,as expected, but the amplitude of motion is still relatively small at 300 K, even for the 17-mer; thereally large dynamic effects are seen only for elevated temperatures.
In summary, whereas a sodium ion solvated by a sufficiently long PEG chain (n > 10) formsa highly dynamic complex at elevated temperatures, the motion is largely attenuated at roomtemperature, at least for polymer lengths up to the 17-mer. MD simulations are in agreement withIMS data and indicate that the 300-K motion is restricted to interconversion between structuresthat are relatively similar, but interconversion between increasingly different conformations(charge-remote polymer loops bound to the rest of the complex versus unbound) is observed
www.annualreviews.org • Ion Mobility Analysis of Molecular Dynamics 181
Ann
u. R
ev. P
hys.
Che
m. 2
014.
65:1
75-1
96. D
ownl
oade
d fr
om w
ww
.ann
ualr
evie
ws.
org
by A
LI:
Aca
dem
ic L
ibra
ries
of
Indi
ana
on 0
4/07
/14.
For
per
sona
l use
onl
y.
PC65CH09-Wyttenbach ARI 5 March 2014 17:59
Cross-sectionalprofile: ion mobilityspectrum (or arrivaltime distribution)plotted on a collisioncross-sectional scale(in units of A2)
for increasingly higher temperatures, at which only the Na+-O7 heptadentate core remainsstructurally stable.
PEPTIDES
In contrast to the dinucleotides discussed above, peptides represent a class of highly flexiblemolecules that can potentially adopt many different conformations. However, in contrast to non-polar polymers, flexibility and dynamic effects in peptides can be offset by strong intramolecu-lar interactions, including hydrogen bonds and salt bridges. From a structural biology point ofview, peptides represent an intriguing intermediate-size regime because they are, in general, toolarge to computationally model with high-level theory and too small to adopt stable secondaryand tertiary structural elements that would make them amenable to characterization by atomicresolution techniques. For peptides that do not adopt a high degree of secondary structure, NMRyields the time average of a broad statistical distribution of structures that exist in rapid equilib-rium. For this same reason, high-resolution X-ray diffraction data are often unobtainable becausepeptides are inherently difficult to crystallize. Ultimately, this dynamic nature is the most inter-esting and biologically relevant aspect in defining peptide function. Here, we explore the utility ofIMS-MS in providing information about intrinsic peptide structure and discuss how conforma-tions that are energetically preferred in the gas phase can be distinguished from those that mightarise from solution.
The equilibrium structure of peptide ions in the gas phase is strongly influenced by intramolec-ular solvation of the charge(s) on the peptide, by the Coulomb repulsion of those charges, andin some cases by secondary structural elements (24–28). As an example of the last, Jarrold andcoworkers (29, 30) showed that the addition of a charge on the carboxyl terminus stabilizes thehelical macrodipole of polyalanine peptides in the gas phase. However, balancing charge solvationand Coulomb repulsion often dominates in smaller peptides (31–34). Here, we focus on bradykinin(BK) (35, 36) with the sequence RPPGFSPFR and specifically on its charge state +3. BK has beenwell characterized structurally in all of its positive charge states 1–3 (37–43), but triply protonatedBK clearly shows the most interesting structural and dynamical properties (42, 43). It is notewor-thy that an elongated BK structure, present in [BK+3H]3+ owing to charge repulsion (42, 43),might be most relevant in the context of the BK complex with its receptor, in which the peptidehas been reported to assume an elongated conformation (44).
Peptide dynamics has not been widely studied using MS and IMS. Temperature-dependentstudies have been reported on the dissociation of peptide dimers (5) and the helix-to-globuletransitions of [Ac-K(AGG)5+H]+ and [Ac-(AGG)5K+H]+ peptides (45). This work has provedvaluable in examining thermochemistry and kinetics of two-state phenomena (with few intermedi-ates); the analysis, however, can become convoluted in cases in which many peptide conformationsare present in the initial population. In these cases, a multidimensional IMS-IMS approach to an-alyze one conformation at a time is an effective alternative.
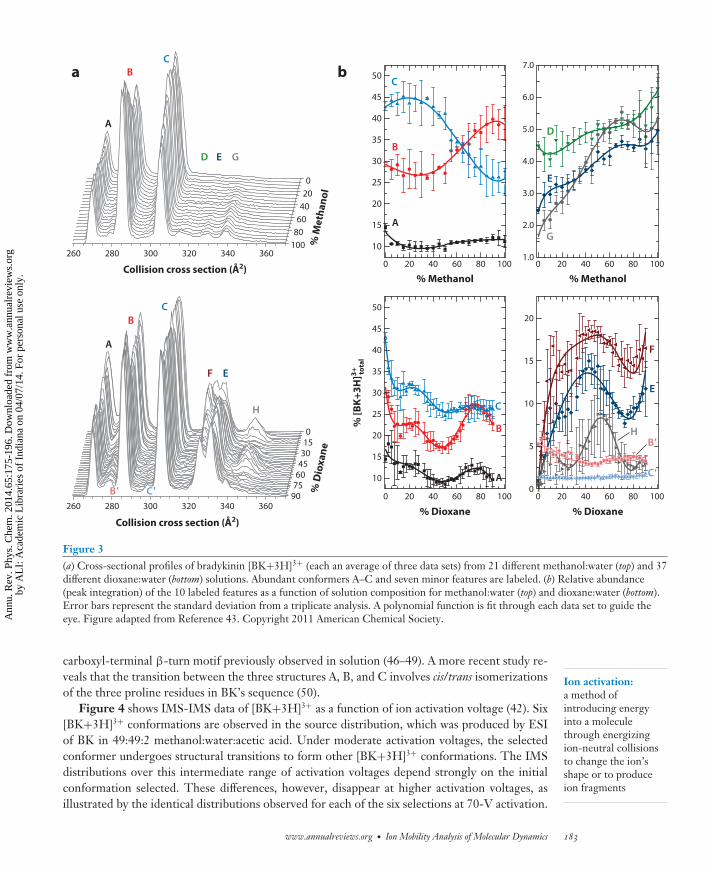
The +3 charge state of BK falls into this latter category. Figure 3 illustrates the dramaticdependence of the cross-sectional profiles of [BK+3H]3+ on the solvent composition used for ESI(43). Both the number and relative abundance of mobility-resolved conformations are observed tochange with increasing methanol:water and dioxane:water ratios. Figure 3b shows the differentchanges in the relative abundances of each of the resolved features as a function of solvent com-position, indicating that these 10 different features correspond to populations of BK structures(A–H, B′, C′) that exist in solution. The same study (43) also utilized MD simulations that foundlow-energy solution and dehydrated structures, in agreement with the experimental cross sectionsfor the main BK conformers A, B, and C. Interestingly, these candidate geometries possess the
182 Wyttenbach et al.
Ann
u. R
ev. P
hys.
Che
m. 2
014.
65:1
75-1
96. D
ownl
oade
d fr
om w
ww
.ann
ualr
evie
ws.
org
by A
LI:
Aca
dem
ic L
ibra
ries
of
Indi
ana
on 0
4/07
/14.
For
per
sona
l use
onl
y.
PC65CH09-Wyttenbach ARI 5 March 2014 17:59
10
15
20
25
30
35
40
45
50
0
5
10
15
20
10
15
20
25
30
35
40
45
50
% Methano Methanol
1.0
2.0
3.0
4.0
5.0
6.0
7.0
015
3045
6075
90
020
4060
80100
260 280 300 320 340 3600 20 40 60 80 100
% Dioxane
0 20 40 60 80 100
0 20 40 60 80 100
% Dioxane
0 20 40 60 80 100
A
BC
D E G
A
B
B'
C
F E
H
A
B
C
A
B
C
D
E
G
F
E
HB'
C'
a b
% M
eth
an
ol
% D
iox
an
e
Collision cross section (Å2)
260 280 300 320 340 360
Collision cross section (Å2)
% [
BK
+3
H]3
+ tota
l
C'
Figure 3(a) Cross-sectional profiles of bradykinin [BK+3H]3+ (each an average of three data sets) from 21 different methanol:water (top) and 37different dioxane:water (bottom) solutions. Abundant conformers A–C and seven minor features are labeled. (b) Relative abundance(peak integration) of the 10 labeled features as a function of solution composition for methanol:water (top) and dioxane:water (bottom).Error bars represent the standard deviation from a triplicate analysis. A polynomial function is fit through each data set to guide theeye. Figure adapted from Reference 43. Copyright 2011 American Chemical Society.
Ion activation:a method ofintroducing energyinto a moleculethrough energizingion-neutral collisionsto change the ion’sshape or to produceion fragments
carboxyl-terminal β-turn motif previously observed in solution (46–49). A more recent study re-veals that the transition between the three structures A, B, and C involves cis/trans isomerizationsof the three proline residues in BK’s sequence (50).
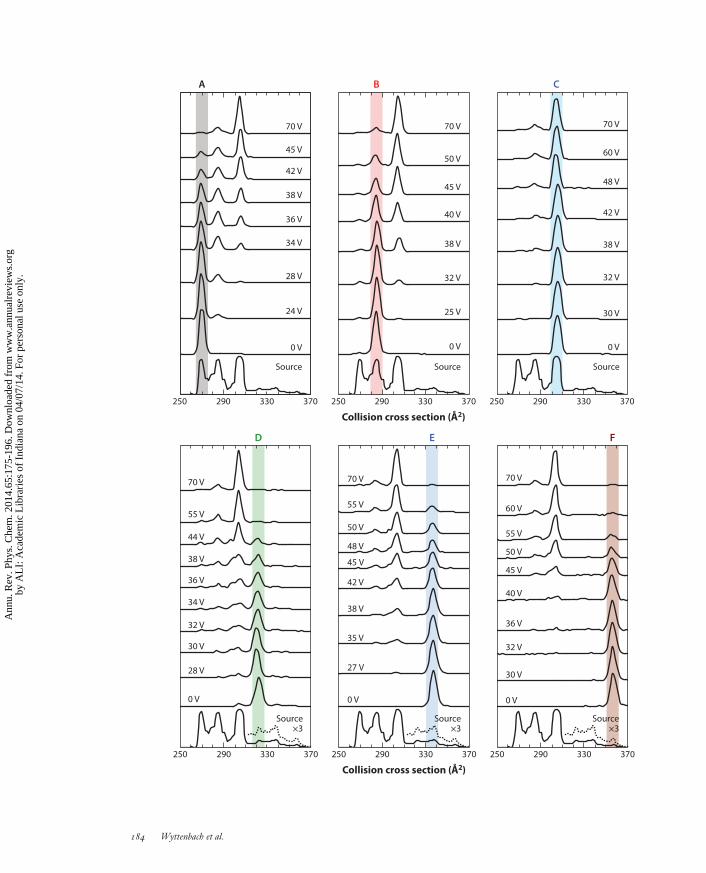
Figure 4 shows IMS-IMS data of [BK+3H]3+ as a function of ion activation voltage (42). Six[BK+3H]3+ conformations are observed in the source distribution, which was produced by ESIof BK in 49:49:2 methanol:water:acetic acid. Under moderate activation voltages, the selectedconformer undergoes structural transitions to form other [BK+3H]3+ conformations. The IMSdistributions over this intermediate range of activation voltages depend strongly on the initialconformation selected. These differences, however, disappear at higher activation voltages, asillustrated by the identical distributions observed for each of the six selections at 70-V activation.
www.annualreviews.org • Ion Mobility Analysis of Molecular Dynamics 183
Ann
u. R
ev. P
hys.
Che
m. 2
014.
65:1
75-1
96. D
ownl
oade
d fr
om w
ww
.ann
ualr
evie
ws.
org
by A
LI:
Aca
dem
ic L
ibra
ries
of
Indi
ana
on 0
4/07
/14.
For
per
sona
l use
onl
y.
PC65CH09-Wyttenbach ARI 5 March 2014 17:59
D FE
250 290 330 370 250 290 330 370 250 290 330 370
Source Source
0 V
24 V
28 V
34 V
36 V
38 V
42 V
45 V
70 V
0 V
25 V
32 V
38 V
40 V
45 V
50 V
70 V
Source
0 V
32 V
38 V
42 V
48 V
60 V
70 V
30 V
0 V
28 V
30 V
32 V
34 V
36 V
38 V
44 V
55 V
70 V
Source×3
Source×3
Source×3
0 V
27 V
35 V
38 V
42 V
45 V
48 V
50 V
55 V
70 V
0 V
30 V
32 V
36 V
40 V
45 V
50 V
55 V
60 V
70 V
Collision cross section (Å2)
250 290 330 370 250 290 330 370 250 290 330 370
Collision cross section (Å2)
A B C
184 Wyttenbach et al.
Ann
u. R
ev. P
hys.
Che
m. 2
014.
65:1
75-1
96. D
ownl
oade
d fr
om w
ww
.ann
ualr
evie
ws.
org
by A
LI:
Aca
dem
ic L
ibra
ries
of
Indi
ana
on 0
4/07
/14.
For
per
sona
l use
onl
y.

PC65CH09-Wyttenbach ARI 5 March 2014 17:59
This distribution remains constant over a range of higher activation voltages prior to dissociation,thus indicating the formation of a preferred gas-phase quasi-equilibrium population of states.
In summary, a range of solution-like [BK+3H]3+ peptide structures is preserved in the ESIprocess and frozen in place during the IMS-MS analysis. Interconversions between variousconformations are essentially absent under thermal conditions. However, collisional heating inthe gas phase accelerates interconversion and leads eventually to an equilibrium distribution ofannealed gas-phase structures. Once ions are thermal again, interconversion shuts down, and theion population stays frozen in the gas-phase equilibrium distribution.
PROTEINS
Proteins are essentially a larger version of peptides; therefore, intramolecular and intermolecularinteractions are very similar in the two systems. However, size matters in collective effects, suchas in secondary structures or the shielding of hydrophobic residues from the aqueous solvent.Water-molecule interactions play an integral role in a protein folding to its globally native form.Because of the absence of the hydrophobic effect in vacuo, however, one might begin to rationalizean inside-out protein because of the preference for hydrophobic residues to point out into thelow-dielectric environment of the vacuum (51, 52). Mounting evidence suggests this is not the casefor ESI-generated protein ions, at least on the millisecond timescales of IMS-MS analysis (53–56).
Here we present ubiquitin data available in the literature and explore how a ubiquitin structureevolves as it comes out of solution in the ESI process and travels through the solvent-free envi-ronment of the mass spectrometer. Ubiquitin is an excellent model system for this type of studybecause its properties are well characterized both in solution and in the gas phase. Ubiquitin is a76-residue protein in which two helices, a five-stranded β-sheet, and seven reverse turns composethe native structure (57); a more extended and highly helical A state (58) forms in low-pH solutionsof >40% methanol (Figure 5a,b), and an unstructured solution state has also been reported. Thenative structure state is stable in aqueous solutions to 100◦C.
Early on, ESI-MS work on proteins indicated a close correlation between the protein chargestate distribution in the mass spectrum and the ESI solution conditions, with denaturing conditionsyielding high charge states and native conditions lower charge states (59–61). The ensuing IMS-MS work on a number of proteins, such as cytochrome c (62), lysozyme (63), and apomyoglobin(64), revealed a set of well-defined structures, some compact, some extended, and some in between.This is illustrated in Figure 5c for the example of ubiquitin (53): Typical for all proteins, low–charge state ions tend to be compact, broad peaks and shoulders are observed for intermediatecharge states, and high charge states present under denaturing solution conditions are extended.
For ubiquitin, charge state 7 is one of the most intense peaks under solution conditions favoringthe native state (53, 65). Its ATD shows essentially one narrow peak of ions with a cross section of1,000 A2 (53, 66, 67). How does the fully solvated native state end up as a desolvated ion with a size
←−−−−−−−−−−−−−−−−−−−−−−−−−−−−−−−−−−−−−−−−−−−−−−−−−−−−−−−−−−−−−−−−−−−−−−−−Figure 4Cross-sectional profiles of bradykinin [BK+3H]3+. The bottom trace in each panel shows the electrosprayionization source distribution (with a portion magnified by a factor of three to better show features D–F).Each panel shows one of six separate sets (A–F) of experiments, beginning within a set with the initialselection (no activation), followed by increasing activation voltages up to 70 V. The area under all peaks in adistribution is normalized to unity. Selections of conformations A–F all converge to the same quasi-equilibrium distribution at 70 V. Figure taken from Reference 42. Copyright 2010 American ChemicalSociety, reproduced with permission.
www.annualreviews.org • Ion Mobility Analysis of Molecular Dynamics 185
Ann
u. R
ev. P
hys.
Che
m. 2
014.
65:1
75-1
96. D
ownl
oade
d fr
om w
ww
.ann
ualr
evie
ws.
org
by A
LI:
Aca
dem
ic L
ibra
ries
of
Indi
ana
on 0
4/07
/14.
For
per
sona
l use
onl
y.
PC65CH09-Wyttenbach ARI 5 March 2014 17:59
800 1,000 1,200 1,400 1,600 1,800 2,000 2,200
11
12
13
10
9
8
7
6
Ch
arge state
C
E
1,000
1,500
2,000
2,500
6 7 8 9 10 11 12 13
N
H
L L
UI2I1A
EIEII
EIIIEIV
C
A
N
Charge state
U
A state
Nativestate
a
b
c
d
Cross section (Å2)
Cro
ss s
ect
ion
(Å
2)
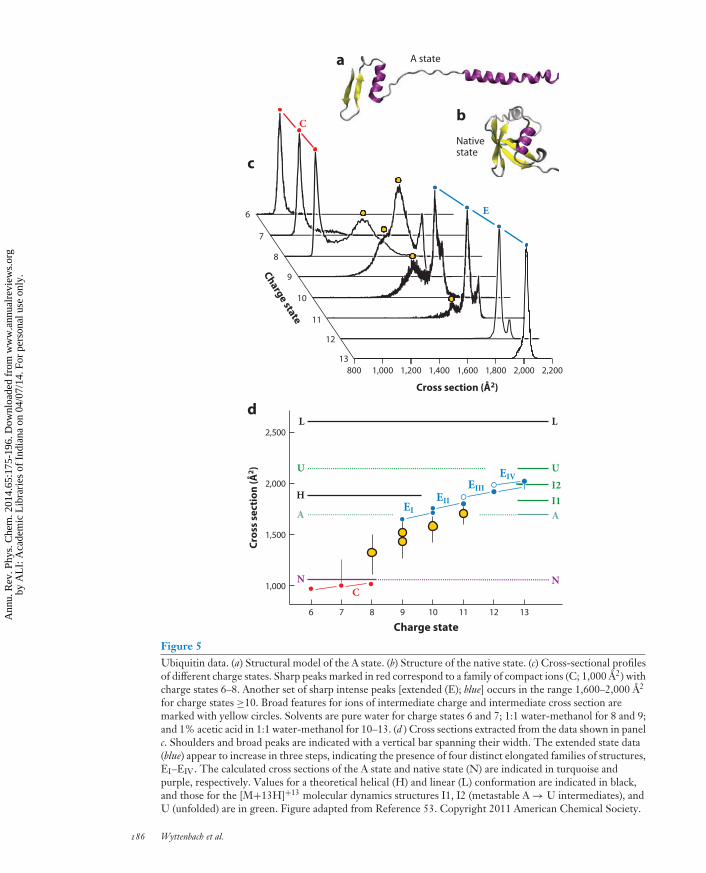
Figure 5Ubiquitin data. (a) Structural model of the A state. (b) Structure of the native state. (c) Cross-sectional profilesof different charge states. Sharp peaks marked in red correspond to a family of compact ions (C; 1,000 A2) withcharge states 6–8. Another set of sharp intense peaks [extended (E); blue] occurs in the range 1,600–2,000 A2
for charge states ≥10. Broad features for ions of intermediate charge and intermediate cross section aremarked with yellow circles. Solvents are pure water for charge states 6 and 7; 1:1 water-methanol for 8 and 9;and 1% acetic acid in 1:1 water-methanol for 10–13. (d ) Cross sections extracted from the data shown in panelc. Shoulders and broad peaks are indicated with a vertical bar spanning their width. The extended state data(blue) appear to increase in three steps, indicating the presence of four distinct elongated families of structures,EI–EIV. The calculated cross sections of the A state and native state (N) are indicated in turquoise andpurple, respectively. Values for a theoretical helical (H) and linear (L) conformation are indicated in black,and those for the [M+13H]+13 molecular dynamics structures I1, I2 (metastable A → U intermediates), andU (unfolded) are in green. Figure adapted from Reference 53. Copyright 2011 American Chemical Society.
186 Wyttenbach et al.
Ann
u. R
ev. P
hys.
Che
m. 2
014.
65:1
75-1
96. D
ownl
oade
d fr
om w
ww
.ann
ualr
evie
ws.
org
by A
LI:
Aca
dem
ic L
ibra
ries
of
Indi
ana
on 0
4/07
/14.
For
per
sona
l use
onl
y.
PC65CH09-Wyttenbach ARI 5 March 2014 17:59
of 1,000 A2? The solution structure yields a predicted cross section in helium of 1,150 A2 (53, 68).However, MD on this solvent-free native state results in an annealed orientation of the side chainsand loose loops on the protein surface (69) and leads to a structure with a cross section 5–10%smaller than the solution native state (53), in close agreement with the experimentally measuredcross section.
The narrow IMS peak C at 1,000 A2 (Figure 5c) is actually considerably broader than expectedfor a single conformation. Selecting a 20-A2 slice out of the middle of the peak and following thedistribution of the selected ions in an IMS-IMS experiment indicate that the ions are frozen intheir conformation and do not change shape during the drift time (70). Hence, the broadeningof this peak results from the presence of many similar conformations side by side that do notinterconvert in the absence of a solvent. IMS-IMS experiments also show that the weak shoulderin the range 1,100–1,300 A2 for charge state 7 results from a range of noninterconverting, moreextended structures (70). Experiments to date cannot answer the question whether these partiallyfolded ubiquitin ions are already present in solution or whether they are a result of the ESIprocess.
However, collisional activation of the ions can turn dynamics on and can initiate conversionfrom a compact conformation into a partially unfolded or elongated structure (71). Moderate acti-vation converts a compact structure into a partially folded one (1,100–1,400 A2), whereas a strongeractivation unfolds the protein to a series of well-resolved elongated conformations at approximately1,600–1,700 A2, a result that mirrors what happens as the charge state increases (Figure 5c).IMS-IMS-IMS experiments indicate that the unfolding of ubiquitin [M+7H]7+ occurs along apath of poorly defined intermediates but that the final structure obtained strongly depends onthe choice of the starting structure within the initial family of compact conformations.
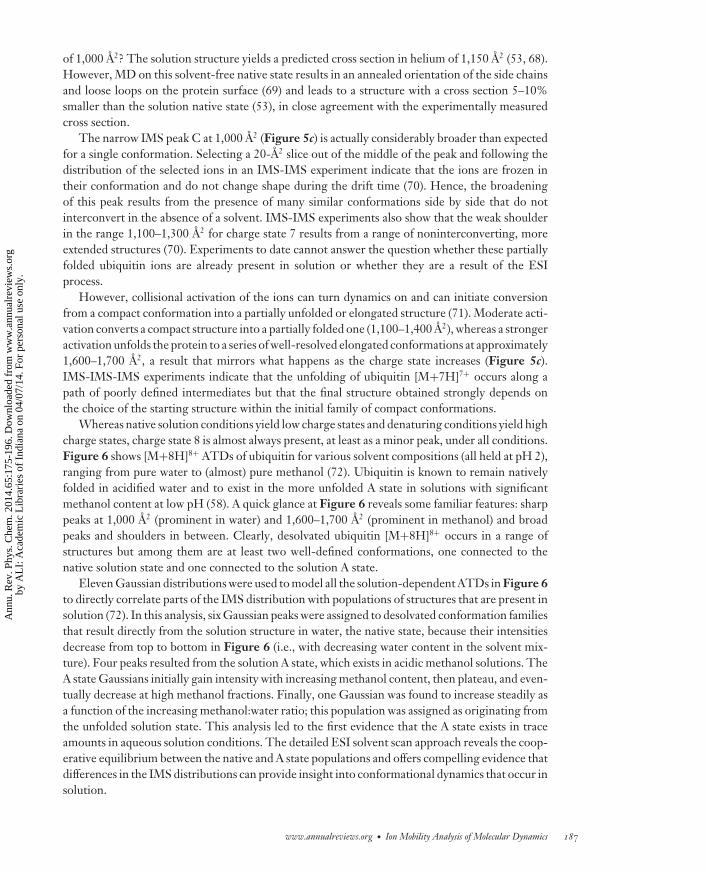
Whereas native solution conditions yield low charge states and denaturing conditions yield highcharge states, charge state 8 is almost always present, at least as a minor peak, under all conditions.Figure 6 shows [M+8H]8+ ATDs of ubiquitin for various solvent compositions (all held at pH 2),ranging from pure water to (almost) pure methanol (72). Ubiquitin is known to remain nativelyfolded in acidified water and to exist in the more unfolded A state in solutions with significantmethanol content at low pH (58). A quick glance at Figure 6 reveals some familiar features: sharppeaks at 1,000 A2 (prominent in water) and 1,600–1,700 A2 (prominent in methanol) and broadpeaks and shoulders in between. Clearly, desolvated ubiquitin [M+8H]8+ occurs in a range ofstructures but among them are at least two well-defined conformations, one connected to thenative solution state and one connected to the solution A state.
Eleven Gaussian distributions were used to model all the solution-dependent ATDs in Figure 6to directly correlate parts of the IMS distribution with populations of structures that are present insolution (72). In this analysis, six Gaussian peaks were assigned to desolvated conformation familiesthat result directly from the solution structure in water, the native state, because their intensitiesdecrease from top to bottom in Figure 6 (i.e., with decreasing water content in the solvent mix-ture). Four peaks resulted from the solution A state, which exists in acidic methanol solutions. TheA state Gaussians initially gain intensity with increasing methanol content, then plateau, and even-tually decrease at high methanol fractions. Finally, one Gaussian was found to increase steadily asa function of the increasing methanol:water ratio; this population was assigned as originating fromthe unfolded solution state. This analysis led to the first evidence that the A state exists in traceamounts in aqueous solution conditions. The detailed ESI solvent scan approach reveals the coop-erative equilibrium between the native and A state populations and offers compelling evidence thatdifferences in the IMS distributions can provide insight into conformational dynamics that occur insolution.
www.annualreviews.org • Ion Mobility Analysis of Molecular Dynamics 187
Ann
u. R
ev. P
hys.
Che
m. 2
014.
65:1
75-1
96. D
ownl
oade
d fr
om w
ww
.ann
ualr
evie
ws.
org
by A
LI:
Aca
dem
ic L
ibra
ries
of
Indi
ana
on 0
4/07
/14.
For
per
sona
l use
onl
y.
PC65CH09-Wyttenbach ARI 5 March 2014 17:59
Inte
nsi
ty (
a.u
.)
H2O:CH3OH
100:0
85:15
70:30
50:50
30:70
10:90
800 1,050 1,300
Collision cross section (Å2)
1,550 1,800 2,050
Figure 6Cross-sectional profiles of [M+8H]8+ ubiquitin ions electrosprayed from six different water:methanolsolutions. Eleven Gaussian functions have been used to model the experiment. The (normalized)experimental data are plotted as solid black dots, and the sum of the Gaussian functions is presented as a reddashed line. Gaussians representing conformer types resulting from the native solution state, the A state, andthe unfolded solution state are plotted in blue, green, and pink, respectively. Figure adapted from Reference72. Copyright 2012 American Chemical Society, reproduced with permission.
Acidic ESI solutions with significant methanol content yield not only ubiquitin [M+8H]8+
ions but mostly the higher charge states 11, 12, and 13, with their ATDs shown in Figure 5c.A series of well-defined extended structures is populated for these higher charge states. Hence,solution conditions favoring the extended A state lead to extended desolvated ubiquitin ions.Modeling predicts a cross section of 1,690 A2 for the desolvated and annealed A state. The A stateis therefore about as equally unfolded as the family of structures EI shown in Figure 5d.
188 Wyttenbach et al.
Ann
u. R
ev. P
hys.
Che
m. 2
014.
65:1
75-1
96. D
ownl
oade
d fr
om w
ww
.ann
ualr
evie
ws.
org
by A
LI:
Aca
dem
ic L
ibra
ries
of
Indi
ana
on 0
4/07
/14.
For
per
sona
l use
onl
y.
PC65CH09-Wyttenbach ARI 5 March 2014 17:59
The secondary structure present in solution surviving the ESI process is strongly suggested bythe fact that a ubiquitin molecule in the native state in solution ends up, after ESI, as a compact de-solvated ion with a well-defined cross section matching that expected for a desolvated native stateand the fact that an A state molecule ends up in a well-defined elongated conformation with a crosssection matching that expected for a desolvated A state. However, an extensive theoretical study onubiquitin [M+13H]13+ (73) indicated that for this highly charged ion, additional unfolding starts tooccur immediately after ESI, resulting in an essentially fully unfolded structure within 2 ms. This isin line with experimental data that show an extended [M+13H]13+ conformation, EIV, of approx-imately 2,000 A2 40 ms after ESI, substantially more unfolded than the A state (53, 74). Figure 5dindicates the presence of stable intermediates EII and EIII in this EI → EIV unfolding process,which are populated for charge states 10–12. The reduced amount of charge and thus the smallerCoulomb repulsive force in these charge states compared to [M+13H]13+ are likely responsible forthe slower unfolding kinetics and for the presence of trapped intermediates. In agreement with ex-periment, the [M+13H]13+ theoretical study (73) also identified two stable intermediates, I1 and I2,in the unfolding process of the desolvated A state, with their cross sections indicated in Figure 5d.
Based on the ubiquitin data presented here, we conclude that proteins electrosprayed from so-lutions stabilizing the native state retain the core secondary structure they have in solution. Minorstructural adjustments of the side chains occur rapidly and generally lead to a slight compactioncompared to the solution structure. Little or no dynamics is observed once the surface of thedesolvated protein is reorganized. Extended or partially unfolded solution structures such as theubiquitin A state result in highly charged ions, which may further unfold within milliseconds afterdesolvation due to Coulomb repulsion.
NONCOVALENT COMPLEXES
Noncovalent interactions have a pronounced effect on the shape of complexes of noncovalentlybound building blocks, and cooperative effects become increasingly important for larger com-plexes. In the context of ESI-generated ions, we wonder not only about how much the structurechanges from solution to the gas phase, but also whether the complexes are actually already presentin solution in the first place.
Numerous ESI-MS studies applying fragmentation strategies, such as collision-induced disso-ciation, to biologically relevant protein complexes (some of which are reviewed in 75–78) indicatethat the method can be used to determine not only the stoichiometry of the complex but also therelative arrangement of the units within the complex. These examples show that MS results arefully consistent with structural information previously gained by traditional biochemistry meth-ods, indicating not only that the complexes originate in solution but also that the organization ofthe building blocks in the complex remains in the biologically relevant arrangement. The abil-ity to directly determine such information makes MS an invaluable and widely accepted tool inmolecular biology (75–78).
IMS-MS methods have proven to be extremely powerful in protein aggregation research(79–81). Protein aggregation is related to certain neurological and other diseases characterizedby the deposit of large amounts of protein in the form of amyloid fibrils (79). Traditionalbiochemistry methods have been able to provide useful information about the macroscopicphenomena of the problem, such as the structural elucidation of amyloid fibrils. However, thosemethods fail to address issues such as the structures of small oligomers, the relative abundanceof specific oligomer sizes, the highly dynamic equilibrium (or steady state) between the variousoligomeric states, and the mechanism of oligomerization. The importance of these issues is
www.annualreviews.org • Ion Mobility Analysis of Molecular Dynamics 189
Ann
u. R
ev. P
hys.
Che
m. 2
014.
65:1
75-1
96. D
ownl
oade
d fr
om w
ww
.ann
ualr
evie
ws.
org
by A
LI:
Aca
dem
ic L
ibra
ries
of
Indi
ana
on 0
4/07
/14.
For
per
sona
l use
onl
y.
PC65CH09-Wyttenbach ARI 5 March 2014 17:59
200
400
600
800
1,000
1,200
1,400
1,600
2 4 6 8 10 12 14 16 18 20
200
400
600
800
1,000
Oligomer size n
Isotropicmodel
Isotropicmodel
Fibrilmodel
Peptide oligomer complexes
(YGGFL)nexperiment
(NNQQNY)nexperiment
Cro
ss s
ect
ion
(Å
2)
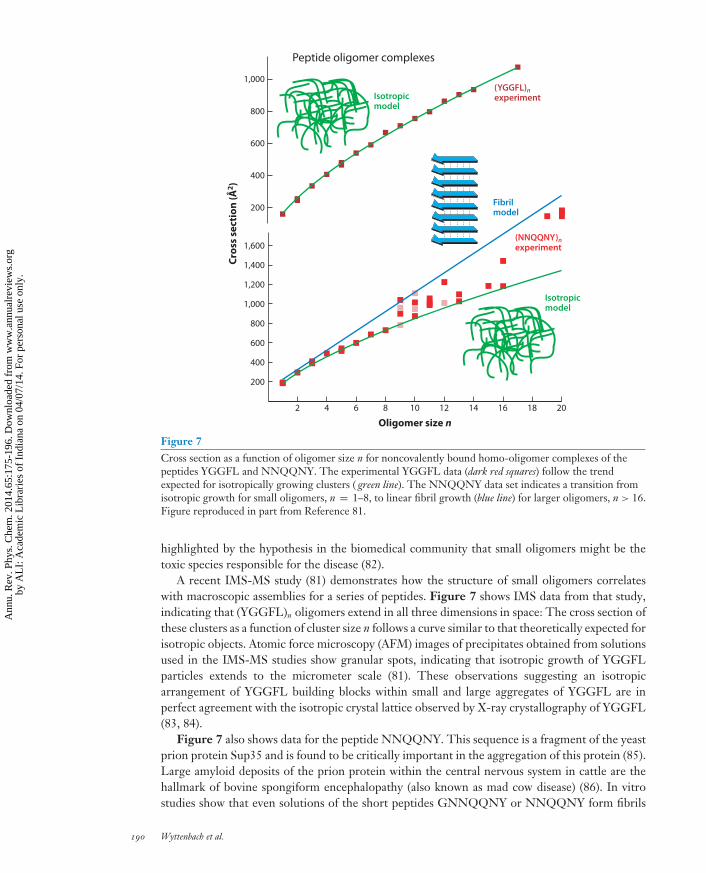
Figure 7Cross section as a function of oligomer size n for noncovalently bound homo-oligomer complexes of thepeptides YGGFL and NNQQNY. The experimental YGGFL data (dark red squares) follow the trendexpected for isotropically growing clusters ( green line). The NNQQNY data set indicates a transition fromisotropic growth for small oligomers, n = 1–8, to linear fibril growth (blue line) for larger oligomers, n > 16.Figure reproduced in part from Reference 81.
highlighted by the hypothesis in the biomedical community that small oligomers might be thetoxic species responsible for the disease (82).
A recent IMS-MS study (81) demonstrates how the structure of small oligomers correlateswith macroscopic assemblies for a series of peptides. Figure 7 shows IMS data from that study,indicating that (YGGFL)n oligomers extend in all three dimensions in space: The cross section ofthese clusters as a function of cluster size n follows a curve similar to that theoretically expected forisotropic objects. Atomic force microscopy (AFM) images of precipitates obtained from solutionsused in the IMS-MS studies show granular spots, indicating that isotropic growth of YGGFLparticles extends to the micrometer scale (81). These observations suggesting an isotropicarrangement of YGGFL building blocks within small and large aggregates of YGGFL are inperfect agreement with the isotropic crystal lattice observed by X-ray crystallography of YGGFL(83, 84).
Figure 7 also shows data for the peptide NNQQNY. This sequence is a fragment of the yeastprion protein Sup35 and is found to be critically important in the aggregation of this protein (85).Large amyloid deposits of the prion protein within the central nervous system in cattle are thehallmark of bovine spongiform encephalopathy (also known as mad cow disease) (86). In vitrostudies show that even solutions of the short peptides GNNQQNY or NNQQNY form fibrils
190 Wyttenbach et al.
Ann
u. R
ev. P
hys.
Che
m. 2
014.
65:1
75-1
96. D
ownl
oade
d fr
om w
ww
.ann
ualr
evie
ws.
org
by A
LI:
Aca
dem
ic L
ibra
ries
of
Indi
ana
on 0
4/07
/14.
For
per
sona
l use
onl
y.
PC65CH09-Wyttenbach ARI 5 March 2014 17:59
(81, 87). Interestingly, for small oligomer sizes of the NNQQNY peptide, the IMS data are nearlysuperimposable with those of YGGFL, indicating isotropic particles as well (81). However, forsome of the larger (NNQQNY)n oligomers, n ≥ 9, the experimental data diverge significantlyfrom the isotropic trend line, and for n > 16, experimental data agree much better with crosssections theoretically expected for a linear fibril-like particle (Figure 7). In the intermediate-sizerange, n = 9–16, compact and more extended structures coexist. AFM images obtained from theNNQQNY solutions used in the IMS experiments show fibril-like precipitates with an estimatedwidth of 6 nm and a length of up to 60 μm (81).
An X-ray crystallography study of NNQQNY microcrystals reveals that the crystals extendprimarily in one direction and that the individual peptide building blocks are stacked on top of eachother in a β-sheet conformation, an arrangement typical for all amyloids (88). This aeolotropicmolecular order found in the crystal leads to the theoretically expected fibril model cross sectionsshown in Figure 7 for small oligomers. The observation that the IMS data follow the fibriltrend line for some conformations in the n = 9–16 oligomer size range and especially for sizesn > 16 suggests that a β-sheet-like conformation is already present in oligomers as small as the(NNQQNY)9 nonamer. The same IMS-MS study reports that the transition from random coilto extended amyloid-like structure occurs for some peptides (such as VEALYL) as early as fromthe monomer to the dimer (81).
The strong correlation between IMS-based structural data (of small 10-kDa peptide aggre-gates) collected in the gas phase and X-ray crystal data (of macroscopic aggregates) suggests thatthe relative order of the building blocks in the assembly is similar in the crystal and in solubleaggregates and that it survives the transition from solution into the gas phase. This in turnsuggests that gas-phase dynamic effects leading to a rearrangement of the building blocks areminimal on the timescale of the IMS experiment (∼100 ms). This is not too surprising consideringthat the lack of covalent bonds between building blocks minimizes steric strain and allows theformation of a network of highly optimized noncovalent interactions including hydrogen bonds.It is also consistent with the absence of water solvent between the various β-sheets makingup the oligomers in solution (and, of course, in the solvent-free IMS experiment). As anyrearrangement of building blocks, such as a β-sheet → coil transition, most certainly involvessimultaneous breaking of several (and the subsequent reformation of different) hydrogen bonds,the corresponding activation energy must be substantial, likely exceeding 10 kcal mol−1. The datapresented in the section on small molecules (see above) indicate that this magnitude of barrieris not easily overcome at room temperature; therefore, the survival of a solution-based optimumnetwork of hydrogen bonds into the gas phase seems plausible.
SUMMARY POINTS
1. Ion mobility spectrometry (IMS) methods can be used to study the dynamics of poly-atomic gas-phase ions on the millisecond timescale. This timescale is typical for mostmass spectrometry (MS) methods. Exceptions are ion traps such as those employed inFourier transform MS, in which ion storage times routinely exceed 1 s and are sometimesas long as minutes or even hours in extreme cases. Dynamic effects may be larger on thislong timescale, and they are not considered here.
2. An IMS kinetic study of deprotonated dinucleotides indicates that breaking an in-tramolecular interaction of ≤4 kcal mol−1 is possible at room temperature within1 ms. However, a barrier of >12 kcal mol−1 is not easily overcome under the sameconditions.
www.annualreviews.org • Ion Mobility Analysis of Molecular Dynamics 191
Ann
u. R
ev. P
hys.
Che
m. 2
014.
65:1
75-1
96. D
ownl
oade
d fr
om w
ww
.ann
ualr
evie
ws.
org
by A
LI:
Aca
dem
ic L
ibra
ries
of
Indi
ana
on 0
4/07
/14.
For
per
sona
l use
onl
y.
PC65CH09-Wyttenbach ARI 5 March 2014 17:59
3. In line with this kinetic study, we find, based on further IMS work, that macromolecularions are overall remarkably static in the gas phase at room temperature on the millisecondtimescale, as evidenced by distinct arrival time distribution (ATD) peaks representingdifferent conformations that do not interconvert during the experiment.
4. Consequently, solution-like structures of peptides and the native state of proteins cansurvive the electrospray ionization (ESI) process and can be stable in the gas phase formilliseconds at room temperature. However, care must be taken both in experimentallyforming and analyzing the ions and in interpreting the results.
5. Solution-like structures can be lost by collisional activation in the gas phase. For pep-tides, activation can lead to an equilibrium population of annealed gas-phase structuresindependent of the starting conformation before activation.
6. Aggregates, such as oligomers involved in amyloid formation, generally form in solutionby the noncovalent interaction of hydrophobic residues. These structures generally ex-clude water solvent in solution and thus generally retain their solution-based structuralmotifs when sprayed, captured, and analyzed by careful IMS-MS experiments.
DISCLOSURE STATEMENT
The authors are not aware of any affiliations, memberships, funding, or financial holdings thatmight be perceived as affecting the objectivity of this review.
ACKNOWLEDGMENTS
N.A.P. and D.E.C. gratefully acknowledge partial funding for instrumentation development fromthe NIH (RC1GM090797-02) and from the Indiana University METAcyte initiative that is fundedby a grant from the Lilly Endowment. M.T.B. gratefully acknowledges support from the NationalScience Foundation.
LITERATURE CITED
1. Walther TC, Mann M. 2010. Mass spectrometry–based proteomics in cell biology. J. Cell Biol. 190:491–500
2. Fenn JB. 2003. Electrospray wings for molecular elephants (Nobel lecture). Angew. Chem. Int. Ed. Engl.42:3871–94
3. Clemmer DE, Jarrold MF. 1997. Ion mobility measurements and their applications to clusters andbiomolecules. J. Mass Spectrom. 32:577–92
4. Wyttenbach T, Bowers MT. 2003. Gas-phase conformations: the ion mobility/ion chromatographymethod. Top. Curr. Chem. 225:207–32
5. Wyttenbach T, Kemper PR, Bowers MT. 2001. Design of a new electrospray ion mobility mass spec-trometer. Int. J. Mass Spectrom. 212:13–23
6. Wyttenbach T, Gidden J, Bowers MT. 2011. Developments in ion mobility: theory, instrumentation, andapplications. In Ion Mobility Spectrometry–Mass Spectrometry, ed. CL Wilkins, S Trimpin, pp. 3–30. BocaRaton, FL: CRC
7. Koeniger SL, Merenbloom SI, Valentine SJ, Jarrold MF, Udseth HR, et al. 2006. An IMS-IMS analogueof MS-MS. Anal. Chem. 78:4161–74
8. Mason EA, McDaniel EW. 1988. Transport Properties of Ions in Gases. New York: Wiley
192 Wyttenbach et al.
Ann
u. R
ev. P
hys.
Che
m. 2
014.
65:1
75-1
96. D
ownl
oade
d fr
om w
ww
.ann
ualr
evie
ws.
org
by A
LI:
Aca
dem
ic L
ibra
ries
of
Indi
ana
on 0
4/07
/14.
For
per
sona
l use
onl
y.
PC65CH09-Wyttenbach ARI 5 March 2014 17:59
9. Wyttenbach T, Bleiholder C, Bowers MT. 2013. Factors contributing to the collision cross section ofpolyatomic ions in the kilodalton to gigadalton range: application to ion mobility measurements. Anal.Chem. 85:2191–99
10. Gidden J, Bushnell JE, Bowers MT. 2001. Gas-phase conformations and folding energetics of oligonu-cleotides: dTG− and dGT− P. J. Am. Chem. Soc. 123:5610–11
11. Gidden J, Bowers MT. 2002. Gas-phase conformational and energetic properties of deprotonated dinu-cleotides. Eur. Phys. J. D 20:409–19
12. Hillenkamp F, Karas M, Beavis RC, Chait BT. 1991. Matrix-assisted laser desorption/ionization massspectrometry of biopolymers. Anal. Chem. 63:A1193–202
13. Tanaka K. 2003. The origin of macromolecule ionization by laser irradiation (Nobel lecture). Angew.Chem. Int. Ed. Engl. 42:3860–70
14. Liu DF, Wyttenbach T, Bowers MT. 2006. Hydration of mononucleotides. J. Am. Chem. Soc. 128:15155–63
15. Gatland IR. 1974. Analysis for ion drift tube experiments. In Case Studies in Atomic Collision Physics,Vol. 4, ed. EW McDaniel, MRC McDowell, pp. 369–437. Amsterdam: North-Holland
16. Robinson PJ, Holbrook KA. 1972. Unimolecular Reactions. New York: Wiley17. Marcus RA, Rice OK. 1951. The kinetics of the recombination of methyl radicals and iodine atoms.
J. Phys. Colloid Chem. 55:894–90818. Stewart JJ. 1990. MOPAC: a semiempirical molecular orbital program. J. Comput. Aided Mol. Des. 4:1–10519. Wyttenbach T, von Helden G, Batka JJ, Carlat D, Bowers MT. 1997. Effect of the long-range potential
on ion mobility measurements. J. Am. Soc. Mass Spectrom. 8:275–8220. von Helden G, Wyttenbach T, Bowers MT. 1995. Conformation of macromolecules in the gas phase:
use of matrix-assisted laser-desorption methods in ion chromatography. Science 267:1483–8521. Wyttenbach T, von Helden G, Bowers MT. 1997. Conformations of alkali ion cationized polyethers in the
gas phase: polyethylene glycol and bis[(benzo-15-crown-5)-15-ylmethyl] pimelate. Int. J. Mass Spectrom.165:377–90
22. von Helden G, Wyttenbach T, Bowers MT. 1995. Inclusion of a MALDI ion source in the ion chromatog-raphy technique: conformational information on polymer and biomolecular ions. Int. J. Mass Spectrom.Ion Process. 146:349–64
23. Gidden J, Wyttenbach T, Jackson AT, Scrivens JH, Bowers MT. 2000. Gas-phase conformationsof synthetic polymers: poly(ethylene glycol), poly(propylene glycol), and poly(tetramethylene glycol).J. Am. Chem. Soc. 122:4692–99
24. Jarrold MF. 2000. Peptides and proteins in the vapor phase. Annu. Rev. Phys. Chem. 51:179–20725. Hoadlund-Hyzer CS, Counterman AE, Clemmer DE. 1999. Anhydrous protein ions. Chem. Rev. 99:3037–
7926. Jarrold MF. 2007. Helices and sheets in vacuo. Phys. Chem. Chem. Phys. 9:1659–7127. Gill AC, Jennings KR, Wyttenbach T, Bowers MT. 2000. Conformations of biopolymers in the gas
phase: a new mass spectrometric method. Int. J. Mass Spectrom. 196:685–9728. McLean JR, McLean JA, Wu Z, Becker C, Perez LM, et al. 2010. Factors that influence helical preferences
for singly charged gas-phase peptide ions: the effects of multiple potential charge-carrying sites. J. Phys.Chem. B 114:809–16
29. Hudgins RR, Jarrold MF. 2000. Conformations of unsolvated glycine-based peptides. J. Phys. Chem. B104:2154–58
30. Kohtani M, Jones TC, Schneider JE, Jarrold MF. 2004. Extreme stability of an unsolvated α-helix.J. Am. Chem. Soc. 126:7420–21
31. Wyttenbach T, Bushnell JE, Bowers MT. 1998. Salt bridge structures in the absence of solvent? The casefor the oligoglycines. J. Am. Chem. Soc. 120:5098–103
32. Hudgins RR, Mao Y, Ratner MA, Jarrold MF. 1999. Conformations of GlynH+ and AlanH+ peptides inthe gas phase. Biophys. J. 76:1591–97
33. Henderson SC, Li JW, Counterman AE, Clemmer DE. 1999. Intrinsic size parameters for Val, Ile, Leu,Gln, Thr, Phe, and Trp residues from ion mobility measurements of polyamino acid ions. J. Phys. Chem.B 103:8780–85
www.annualreviews.org • Ion Mobility Analysis of Molecular Dynamics 193
Ann
u. R
ev. P
hys.
Che
m. 2
014.
65:1
75-1
96. D
ownl
oade
d fr
om w
ww
.ann
ualr
evie
ws.
org
by A
LI:
Aca
dem
ic L
ibra
ries
of
Indi
ana
on 0
4/07
/14.
For
per
sona
l use
onl
y.
PC65CH09-Wyttenbach ARI 5 March 2014 17:59
34. Wong RL, Williams ER, Counterman AE, Clemmer DE. 2005. Evaluation of ion mobility spectroscopyfor determining charge-solvated versus salt-bridge structures of protonated trimers. J. Am. Soc. MassSpectrom. 16:1009–19
35. Rocha e Silva M, Beraldo WT, Rosenfeld G. 1949. Bradykinin, a hypotensive and smooth muscle stimu-lating factor released from plasma globulin by snake venoms and by trypsin. Am. J. Physiol. 156:261–73
36. Beraldo WT, Andrade SP. 1997. Discovery of bradykinin and the kallikrein-kinin system. In The Handbookof Immunopharmacology: The Kinin System, ed. SG Farmer, pp. 1–8. San Diego: Academic
37. Wyttenbach T, von Helden G, Bowers MT. 1996. Gas-phase conformation of biological molecules:bradykinin. J. Am. Chem. Soc. 118:8355–64
38. Schnier PD, Price WD, Jockusch RA, Williams ER. 1996. Blackbody infrared radiative dissociation ofbradykinin and its analogues: energetics, dynamics, and evidence for salt-bridge structures in the gas phase.J. Am. Chem. Soc. 118:7178–89
39. Freitas MA, Marshall AG. 1999. Rate and extent of gas phase hydrogen/deuterium exchange ofbradykinins: evidence for peptide zwitterions in the gas phase. Int. J. Mass Spectrom. 182–183:221–31
40. Rodriguez CF, Orlova G, Guo Y, Li X, Siu C-K, et al. 2006. Gaseous bradykinin and its singly, doubly,and triply protonated forms: a first-principles study. J. Phys. Chem. B 110:7528–37
41. Henderson SC, Valentine SJ, Counterman AE, Clemmer DE. 1999. ESI/ion trap/ion mobility/time-of-flight mass spectrometry for rapid and sensitive analysis of biomolecular mixtures. Anal. Chem. 71:291–301
42. Pierson NA, Valentine SJ, Clemmer DE. 2010. Evidence for a quasi-equilibrium distribution of states forbradykinin [M + 3H]3+ ions in the gas phase. J. Phys. Chem. B 114:7777–83
43. Pierson NA, Chen L, Valentine SJ, Russell DH, Clemmer DE. 2011. Number of solution states ofbradykinin from ion mobility and mass spectrometry measurements. J. Am. Chem. Soc. 133:13810–13
44. Lopez JJ, Shukla AK, Reinhart C, Schwalbe H, Michel H, Glaubitz C. 2008. The structure of the neu-ropeptide bradykinin bound to the human G-protein coupled receptor bradykinin B2 as determined bysolid-state NMR spectroscopy. Angew. Chem. Int. Ed. Engl. 47:1668–71
45. Kinnear BS, Hartings MR, Jarrold MF. 2001. Helix unfolding in unsolvated peptides. J. Am. Chem. Soc.123:5660–67
46. Young JK, Hicks RP. 1994. NMR and molecular modeling investigations of the neuropeptide bradykininin three different solvent systems: DMSO, 9:1 dioxane/water, and in the presence of 7.4 mM lyso phos-phatidylcholine micelles. Biopolymers 34:611–23
47. Hicks RP. 2001. Recent advances in NMR: expanding its role in rational drug design. Curr. Med. Chem.8:627–50
48. Chatterjee C, Mukhopadhyay C. 2004. Conformational alteration of bradykinin in presence of GM1micelle. Biochem. Biophys. Res. Commun. 315:866–71
49. Lee SC, Russell AF, Laidig WD. 1990. Three-dimensional structure of bradykinin in SDS micelles. Int.J. Peptide Protein Res. 35:367–77
50. Pierson NA, Chen L, Russell DH, Clemmer DE. 2013. Cis-trans isomerizations of proline residues arekey to bradykinin conformations. J. Am. Chem. Soc. 135:3186–92
51. Wolynes PG. 1995. Biomolecular folding in vacuo!!!(?). Proc. Natl. Acad. Sci. USA 92:2426–2752. Baumketner A, Bernstein SL, Wyttenbach T, Bitan G, Teplow DB, et al. 2006. Amyloid β-protein
monomer structure: a computational and experimental study. Protein Sci. 15:420–2853. Wyttenbach T, Bowers MT. 2011. Structural stability from solution to the gas phase: Native solution
structure of ubiquitin survives analysis in a solvent-free ion mobility-mass spectrometry environment.J. Phys. Chem. B 115:12266–75
54. Barylyuk K, Balabin RM, Grunstein D, Kikkeri R, Frankevich V, et al. 2011. What happens to hydrophobicinteractions during transfer from the solution to the gas phase? The case of electrospray-based softionization methods. J. Am. Soc. Mass Spectrom. 22:1167–77
55. Ruotolo BT, Robinson CV. 2006. Aspects of native proteins are retained in vacuum. Curr. Opin. Chem.Biol. 10:402–8
56. Barrera NP, Robinson CV. 2011. Advances in the mass spectrometry of membrane proteins: from indi-vidual proteins to intact complexes. Annu. Rev. Biochem. 80:247–71
57. Vijay-Kumar S, Bugg CE, Cook WJ. 1987. Structure of ubiquitin refined at 1.8 A resolution. J. Mol. Biol.194:531–44
194 Wyttenbach et al.
Ann
u. R
ev. P
hys.
Che
m. 2
014.
65:1
75-1
96. D
ownl
oade
d fr
om w
ww
.ann
ualr
evie
ws.
org
by A
LI:
Aca
dem
ic L
ibra
ries
of
Indi
ana
on 0
4/07
/14.
For
per
sona
l use
onl
y.
PC65CH09-Wyttenbach ARI 5 March 2014 17:59
58. Brutscher B, Bruschweiler R, Ernst RR. 1997. Backbone dynamics and structural characterization ofthe partially folded A state of ubiquitin by 1H, 13C, and 15N nuclear magnetic resonance spectroscopy.Biochemistry 36:13043–53
59. Chowdhury SK, Katta V, Chait BT. 1990. Probing conformational changes in proteins by mass spec-trometry. J. Am. Chem. Soc. 112:9012–13
60. Katta V, Chait BT. 1991. Conformational changes in proteins probed by hydrogen-exchange electrospray-ionization mass spectrometry. Rapid Commun. Mass Spectrom. 5:214–17
61. Konermann L, Douglas DJ. 1998. Unfolding of proteins monitored by electrospray ionization massspectrometry: a comparison of positive and negative ion modes. J. Am. Soc. Mass Spectrom. 9:1248–54
62. Clemmer DE, Hudgins RR, Jarrold MF. 1995. Naked protein conformations: cytochrome c in the gasphase. J. Am. Chem. Soc. 117:10141–42
63. Valentine SJ, Anderson JG, Ellington AD, Clemmer DE. 1997. Disulfide-intact and -reduced lysozymein the gas phase: conformations and pathways of folding and unfolding. J. Phys. Chem. B 101:3891–900
64. Shelimov KB, Jarrold MF. 1997. Conformations, unfolding, and refolding of apomyoglobin in vacuum:an activation barrier for gas-phase protein folding. J. Am. Chem. Soc. 119:2987–94
65. Wilson DJ, Konermann L. 2003. A capillary mixer with adjustable reaction chamber volume for millisec-ond time-resolved studies by electrospray mass spectrometry. Anal. Chem. 75:6408–14
66. Valentine SJ, Counterman AE, Clemmer DE. 1997. Conformer-dependent proton-transfer reactions ofubiquitin ions. J. Am. Soc. Mass Spectrom. 8:954–61
67. Myung S, Badman ER, Lee YJ, Clemmer DE. 2002. Structural transitions of electrosprayed ubiquitinions stored in an ion trap over ∼10 ms to 30 s. J. Phys. Chem. A 106:9976–82
68. Shvartsburg AA, Jarrold MF. 1996. An exact hard-spheres scattering model for the mobilities of polyatomicions. Chem. Phys. Lett. 261:86–91
69. Steinberg MZ, Elber R, McLafferty FW, Gerber RB, Breuker K. 2008. Early structural evolution of nativecytochrome c after solvent removal. Chembiochem 9:2417–23
70. Koeniger SL, Merenbloom SI, Clemmer DE. 2006. Evidence for many resolvable structures withinconformation types of electrosprayed ubiquitin ions. J. Phys. Chem. B 110:7017–21
71. Koeniger SL, Merenbloom SI, Sevugarajan S, Clemmer DE. 2006. Transfer of structural elements fromcompact to extended states in unsolvated ubiquitin. J. Am. Chem. Soc. 128:11713–19
72. Shi H, Pierson NA, Valentine SJ, Clemmer DE. 2012. Conformation types of ubiquitin [M+8H]8+ ionsfrom water:methanol solutions: evidence for the N and A states in aqueous solution. J. Phys. Chem. B116:3344–52
73. Segev E, Wyttenbach T, Bowers MT, Gerber RB. 2008. Conformational evolution of ubiquitin ions inelectrospray mass spectrometry: molecular dynamics simulations at gradually increasing temperatures.Phys. Chem. Chem. Phys. 10:3077–82
74. Koeniger SL, Clemmer DE. 2007. Resolution and structural transitions of elongated states of ubiquitin.J. Am. Soc. Mass Spectrom. 18:322–31
75. Park AY, Robinson CV. 2011. Protein–nucleic acid complexes and the role of mass spectrometry in theirstructure determination. Crit. Rev. Biochem. Mol. 46:152–64
76. Hyung SJ, Ruotolo BT. 2012. Integrating mass spectrometry of intact protein complexes into structuralproteomics. Proteomics 12:1547–64
77. Uetrecht C, Rose RJ, van Duijn E, Lorenzen K, Heck AJR. 2010. Ion mobility mass spectrometry ofproteins and protein assemblies. Chem. Soc. Rev. 39:1633–55
78. Wyttenbach T, Bowers MT. 2007. Intermolecular interactions in biomolecular systems examined by massspectrometry. Annu. Rev. Phys. Chem. 58:511–33
79. Teplow DB, Lazo ND, Bitan G, Bernstein S, Wyttenbach T, et al. 2006. Elucidating amyloid β-proteinfolding and assembly: a multidisciplinary approach. Acc. Chem. Res. 39:635–45
80. Bernstein SL, Dupuis NF, Lazo ND, Wyttenbach T, Condron MM, et al. 2009. Amyloid-β proteinoligomerization and the importance of tetramers and dodecamers in the aetiology of Alzheimer’s disease.Nat. Chem. 1:326–31
81. Bleiholder C, Dupuis NF, Wyttenbach T, Bowers MT. 2011. Ion mobility–mass spectrometry revealsa conformational conversion from random assembly to β-sheet in amyloid fibril formation. Nat. Chem.3:172–77
www.annualreviews.org • Ion Mobility Analysis of Molecular Dynamics 195
Ann
u. R
ev. P
hys.
Che
m. 2
014.
65:1
75-1
96. D
ownl
oade
d fr
om w
ww
.ann
ualr
evie
ws.
org
by A
LI:
Aca
dem
ic L
ibra
ries
of
Indi
ana
on 0
4/07
/14.
For
per
sona
l use
onl
y.

PC65CH09-Wyttenbach ARI 5 March 2014 17:59
82. Kirkitadze MD, Bitan G, Teplow DB. 2002. Paradigm shifts in Alzheimer’s disease and other neurode-generative disorders: the emerging role of oligomeric assemblies. J. Neurosci. Res. 69:567–77
83. Deschamps JR, George C, Flippen-Anderson JL. 1996. Structural studies of opioid peptides: a review ofrecent progress in X-ray diffraction studies. Biopolymers 40:121–39
84. Smith GD, Griffin JF. 1978. Conformation of [Leu5]enkephalin from X-ray diffraction: features importantfor recognition at opiate receptor. Science 199:1214–16
85. DePace AH, Santoso A, Hillner P, Weissman JS. 1998. A critical role for amino-terminal glu-tamine/asparagine repeats in the formation and propagation of a yeast prion. Cell 93:1241–52
86. Prusiner SB. 1998. Prions. Proc. Natl. Acad. Sci. USA 95:13363–8387. Balbirnie M, Grothe R, Eisenberg DS. 2001. An amyloid-forming peptide from the yeast prion Sup35
reveals a dehydrated β-sheet structure for amyloid. Proc. Natl. Acad. Sci. USA 98:2375–8088. Nelson R, Sawaya MR, Balbirnie M, Madsen AO, Riekel C, et al. 2005. Structure of the cross-β spine of
amyloid-like fibrils. Nature 435:773–78
196 Wyttenbach et al.
Ann
u. R
ev. P
hys.
Che
m. 2
014.
65:1
75-1
96. D
ownl
oade
d fr
om w
ww
.ann
ualr
evie
ws.
org
by A
LI:
Aca
dem
ic L
ibra
ries
of
Indi
ana
on 0
4/07
/14.
For
per
sona
l use
onl
y.
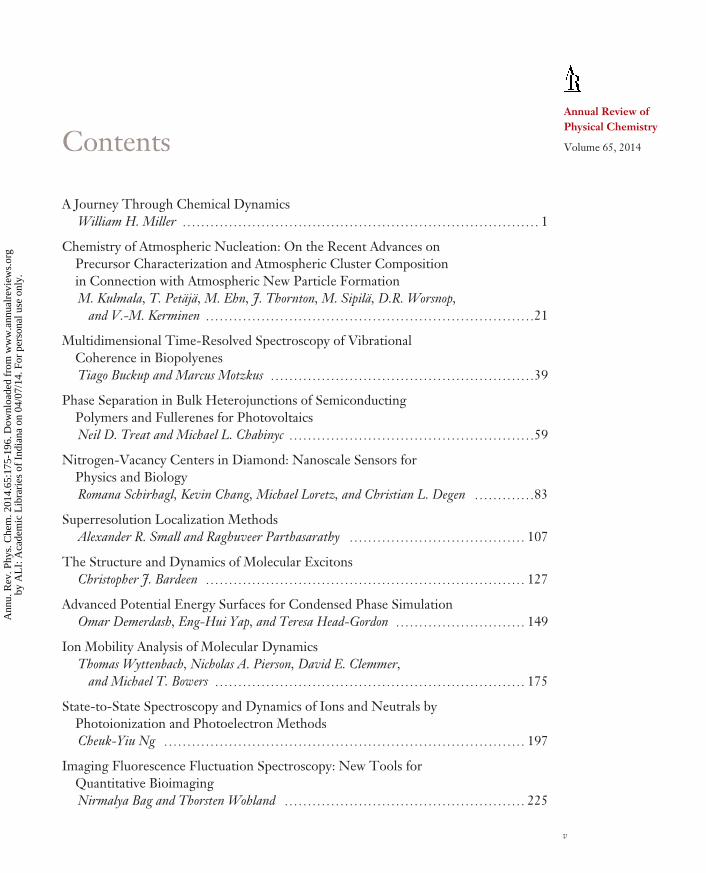
PC65-FrontMatter ARI 17 February 2014 14:33
Annual Review ofPhysical Chemistry
Volume 65, 2014Contents
A Journey Through Chemical DynamicsWilliam H. Miller � � � � � � � � � � � � � � � � � � � � � � � � � � � � � � � � � � � � � � � � � � � � � � � � � � � � � � � � � � � � � � � � � � � � � � � � � � � � � 1
Chemistry of Atmospheric Nucleation: On the Recent Advances onPrecursor Characterization and Atmospheric Cluster Compositionin Connection with Atmospheric New Particle FormationM. Kulmala, T. Petaja, M. Ehn, J. Thornton, M. Sipila, D.R. Worsnop,
and V.-M. Kerminen � � � � � � � � � � � � � � � � � � � � � � � � � � � � � � � � � � � � � � � � � � � � � � � � � � � � � � � � � � � � � � � � � � � � � � �21
Multidimensional Time-Resolved Spectroscopy of VibrationalCoherence in BiopolyenesTiago Buckup and Marcus Motzkus � � � � � � � � � � � � � � � � � � � � � � � � � � � � � � � � � � � � � � � � � � � � � � � � � � � � � � � � �39
Phase Separation in Bulk Heterojunctions of SemiconductingPolymers and Fullerenes for PhotovoltaicsNeil D. Treat and Michael L. Chabinyc � � � � � � � � � � � � � � � � � � � � � � � � � � � � � � � � � � � � � � � � � � � � � � � � � � � � �59
Nitrogen-Vacancy Centers in Diamond: Nanoscale Sensors forPhysics and BiologyRomana Schirhagl, Kevin Chang, Michael Loretz, and Christian L. Degen � � � � � � � � � � � � �83
Superresolution Localization MethodsAlexander R. Small and Raghuveer Parthasarathy � � � � � � � � � � � � � � � � � � � � � � � � � � � � � � � � � � � � � � 107
The Structure and Dynamics of Molecular ExcitonsChristopher J. Bardeen � � � � � � � � � � � � � � � � � � � � � � � � � � � � � � � � � � � � � � � � � � � � � � � � � � � � � � � � � � � � � � � � � � � � � 127
Advanced Potential Energy Surfaces for Condensed Phase SimulationOmar Demerdash, Eng-Hui Yap, and Teresa Head-Gordon � � � � � � � � � � � � � � � � � � � � � � � � � � � � 149
Ion Mobility Analysis of Molecular DynamicsThomas Wyttenbach, Nicholas A. Pierson, David E. Clemmer,
and Michael T. Bowers � � � � � � � � � � � � � � � � � � � � � � � � � � � � � � � � � � � � � � � � � � � � � � � � � � � � � � � � � � � � � � � � � � � 175
State-to-State Spectroscopy and Dynamics of Ions and Neutrals byPhotoionization and Photoelectron MethodsCheuk-Yiu Ng � � � � � � � � � � � � � � � � � � � � � � � � � � � � � � � � � � � � � � � � � � � � � � � � � � � � � � � � � � � � � � � � � � � � � � � � � � � � � � 197
Imaging Fluorescence Fluctuation Spectroscopy: New Tools forQuantitative BioimagingNirmalya Bag and Thorsten Wohland � � � � � � � � � � � � � � � � � � � � � � � � � � � � � � � � � � � � � � � � � � � � � � � � � � � � 225
v
Ann
u. R
ev. P
hys.
Che
m. 2
014.
65:1
75-1
96. D
ownl
oade
d fr
om w
ww
.ann
ualr
evie
ws.
org
by A
LI:
Aca
dem
ic L
ibra
ries
of
Indi
ana
on 0
4/07
/14.
For
per
sona
l use
onl
y.
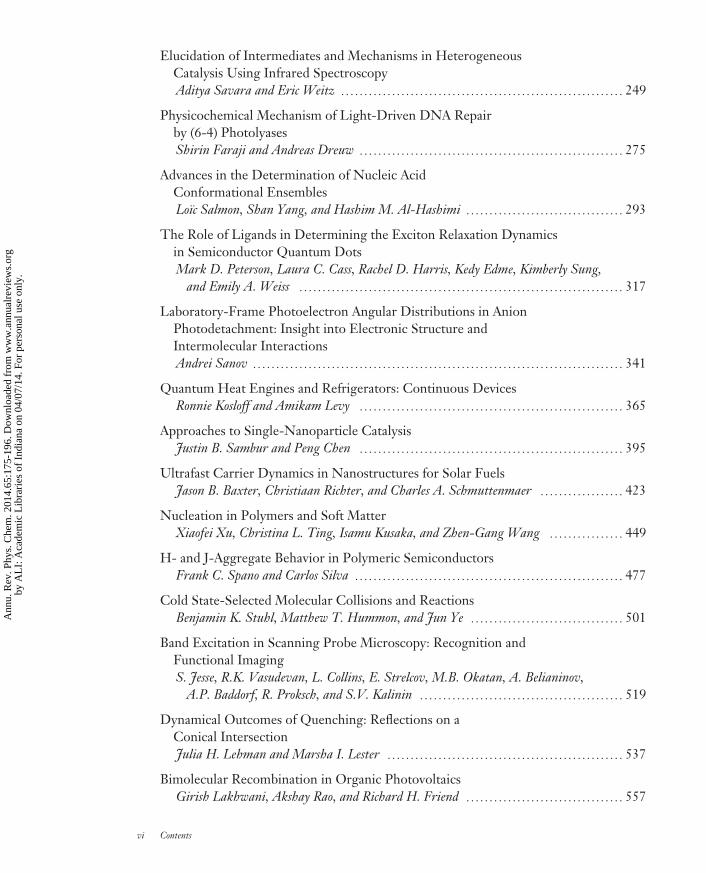
PC65-FrontMatter ARI 17 February 2014 14:33
Elucidation of Intermediates and Mechanisms in HeterogeneousCatalysis Using Infrared SpectroscopyAditya Savara and Eric Weitz � � � � � � � � � � � � � � � � � � � � � � � � � � � � � � � � � � � � � � � � � � � � � � � � � � � � � � � � � � � � � 249
Physicochemical Mechanism of Light-Driven DNA Repairby (6-4) PhotolyasesShirin Faraji and Andreas Dreuw � � � � � � � � � � � � � � � � � � � � � � � � � � � � � � � � � � � � � � � � � � � � � � � � � � � � � � � � � 275
Advances in the Determination of Nucleic AcidConformational EnsemblesLoıc Salmon, Shan Yang, and Hashim M. Al-Hashimi � � � � � � � � � � � � � � � � � � � � � � � � � � � � � � � � � � 293
The Role of Ligands in Determining the Exciton Relaxation Dynamicsin Semiconductor Quantum DotsMark D. Peterson, Laura C. Cass, Rachel D. Harris, Kedy Edme, Kimberly Sung,
and Emily A. Weiss � � � � � � � � � � � � � � � � � � � � � � � � � � � � � � � � � � � � � � � � � � � � � � � � � � � � � � � � � � � � � � � � � � � � � � 317
Laboratory-Frame Photoelectron Angular Distributions in AnionPhotodetachment: Insight into Electronic Structure andIntermolecular InteractionsAndrei Sanov � � � � � � � � � � � � � � � � � � � � � � � � � � � � � � � � � � � � � � � � � � � � � � � � � � � � � � � � � � � � � � � � � � � � � � � � � � � � � � � � 341
Quantum Heat Engines and Refrigerators: Continuous DevicesRonnie Kosloff and Amikam Levy � � � � � � � � � � � � � � � � � � � � � � � � � � � � � � � � � � � � � � � � � � � � � � � � � � � � � � � � � 365
Approaches to Single-Nanoparticle CatalysisJustin B. Sambur and Peng Chen � � � � � � � � � � � � � � � � � � � � � � � � � � � � � � � � � � � � � � � � � � � � � � � � � � � � � � � � � 395
Ultrafast Carrier Dynamics in Nanostructures for Solar FuelsJason B. Baxter, Christiaan Richter, and Charles A. Schmuttenmaer � � � � � � � � � � � � � � � � � � 423
Nucleation in Polymers and Soft MatterXiaofei Xu, Christina L. Ting, Isamu Kusaka, and Zhen-Gang Wang � � � � � � � � � � � � � � � � 449
H- and J-Aggregate Behavior in Polymeric SemiconductorsFrank C. Spano and Carlos Silva � � � � � � � � � � � � � � � � � � � � � � � � � � � � � � � � � � � � � � � � � � � � � � � � � � � � � � � � � � 477
Cold State-Selected Molecular Collisions and ReactionsBenjamin K. Stuhl, Matthew T. Hummon, and Jun Ye � � � � � � � � � � � � � � � � � � � � � � � � � � � � � � � � � 501
Band Excitation in Scanning Probe Microscopy: Recognition andFunctional ImagingS. Jesse, R.K. Vasudevan, L. Collins, E. Strelcov, M.B. Okatan, A. Belianinov,
A.P. Baddorf, R. Proksch, and S.V. Kalinin � � � � � � � � � � � � � � � � � � � � � � � � � � � � � � � � � � � � � � � � � � � � 519
Dynamical Outcomes of Quenching: Reflections on aConical IntersectionJulia H. Lehman and Marsha I. Lester � � � � � � � � � � � � � � � � � � � � � � � � � � � � � � � � � � � � � � � � � � � � � � � � � � � 537
Bimolecular Recombination in Organic PhotovoltaicsGirish Lakhwani, Akshay Rao, and Richard H. Friend � � � � � � � � � � � � � � � � � � � � � � � � � � � � � � � � � � 557
vi Contents
Ann
u. R
ev. P
hys.
Che
m. 2
014.
65:1
75-1
96. D
ownl
oade
d fr
om w
ww
.ann
ualr
evie
ws.
org
by A
LI:
Aca
dem
ic L
ibra
ries
of
Indi
ana
on 0
4/07
/14.
For
per
sona
l use
onl
y.
PC65-FrontMatter ARI 17 February 2014 14:33
Mapping Atomic Motions with Ultrabright Electrons: The Chemists’Gedanken Experiment Enters the Lab FrameR.J. Dwayne Miller � � � � � � � � � � � � � � � � � � � � � � � � � � � � � � � � � � � � � � � � � � � � � � � � � � � � � � � � � � � � � � � � � � � � � � � � 583
Optical Spectroscopy Using Gas-Phase FemtosecondLaser FilamentationJohanan Odhner and Robert Levis � � � � � � � � � � � � � � � � � � � � � � � � � � � � � � � � � � � � � � � � � � � � � � � � � � � � � � � � � 605
Indexes
Cumulative Index of Contributing Authors, Volumes 61–65 � � � � � � � � � � � � � � � � � � � � � � � � � � � 629
Cumulative Index of Article Titles, Volumes 61–65 � � � � � � � � � � � � � � � � � � � � � � � � � � � � � � � � � � � � � 632
Errata
An online log of corrections to Annual Review of Physical Chemistry articles may befound at http://www.annualreviews.org/errata/physchem
Contents vii
Ann
u. R
ev. P
hys.
Che
m. 2
014.
65:1
75-1
96. D
ownl
oade
d fr
om w
ww
.ann
ualr
evie
ws.
org
by A
LI:
Aca
dem
ic L
ibra
ries
of
Indi
ana
on 0
4/07
/14.
For
per
sona
l use
onl
y.

AnnuAl Reviewsit’s about time. Your time. it’s time well spent.
AnnuAl Reviews | Connect with Our expertsTel: 800.523.8635 (us/can) | Tel: 650.493.4400 | Fax: 650.424.0910 | Email: [email protected]
New From Annual Reviews:
Annual Review of Statistics and Its ApplicationVolume 1 • Online January 2014 • http://statistics.annualreviews.org
Editor: Stephen E. Fienberg, Carnegie Mellon UniversityAssociate Editors: Nancy Reid, University of Toronto
Stephen M. Stigler, University of ChicagoThe Annual Review of Statistics and Its Application aims to inform statisticians and quantitative methodologists, as well as all scientists and users of statistics about major methodological advances and the computational tools that allow for their implementation. It will include developments in the field of statistics, including theoretical statistical underpinnings of new methodology, as well as developments in specific application domains such as biostatistics and bioinformatics, economics, machine learning, psychology, sociology, and aspects of the physical sciences.
Complimentary online access to the first volume will be available until January 2015. table of contents:•What Is Statistics? Stephen E. Fienberg•A Systematic Statistical Approach to Evaluating Evidence
from Observational Studies, David Madigan, Paul E. Stang, Jesse A. Berlin, Martijn Schuemie, J. Marc Overhage, Marc A. Suchard, Bill Dumouchel, Abraham G. Hartzema, Patrick B. Ryan
•The Role of Statistics in the Discovery of a Higgs Boson, David A. van Dyk
•Brain Imaging Analysis, F. DuBois Bowman•Statistics and Climate, Peter Guttorp•Climate Simulators and Climate Projections,
Jonathan Rougier, Michael Goldstein•Probabilistic Forecasting, Tilmann Gneiting,
Matthias Katzfuss•Bayesian Computational Tools, Christian P. Robert•Bayesian Computation Via Markov Chain Monte Carlo,
Radu V. Craiu, Jeffrey S. Rosenthal•Build, Compute, Critique, Repeat: Data Analysis with Latent
Variable Models, David M. Blei•Structured Regularizers for High-Dimensional Problems:
Statistical and Computational Issues, Martin J. Wainwright
•High-Dimensional Statistics with a View Toward Applications in Biology, Peter Bühlmann, Markus Kalisch, Lukas Meier
•Next-Generation Statistical Genetics: Modeling, Penalization, and Optimization in High-Dimensional Data, Kenneth Lange, Jeanette C. Papp, Janet S. Sinsheimer, Eric M. Sobel
•Breaking Bad: Two Decades of Life-Course Data Analysis in Criminology, Developmental Psychology, and Beyond, Elena A. Erosheva, Ross L. Matsueda, Donatello Telesca
•Event History Analysis, Niels Keiding•StatisticalEvaluationofForensicDNAProfileEvidence,
Christopher D. Steele, David J. Balding•Using League Table Rankings in Public Policy Formation:
Statistical Issues, Harvey Goldstein•Statistical Ecology, Ruth King•Estimating the Number of Species in Microbial Diversity
Studies, John Bunge, Amy Willis, Fiona Walsh•Dynamic Treatment Regimes, Bibhas Chakraborty,
Susan A. Murphy•Statistics and Related Topics in Single-Molecule Biophysics,
Hong Qian, S.C. Kou•Statistics and Quantitative Risk Management for Banking
and Insurance, Paul Embrechts, Marius Hofert
Access this and all other Annual Reviews journals via your institution at www.annualreviews.org.
Ann
u. R
ev. P
hys.
Che
m. 2
014.
65:1
75-1
96. D
ownl
oade
d fr
om w
ww
.ann
ualr
evie
ws.
org
by A
LI:
Aca
dem
ic L
ibra
ries
of
Indi
ana
on 0
4/07
/14.
For
per
sona
l use
onl
y.