
Ion Exchange Properties of a Terpolymer Resin...
13
ISSN: 0973-4945; CODEN ECJHAO E-Journal of Chemistry http://www.e-journals.net 2009, 6(3), 639-650 Ion Exchange Properties of a Terpolymer Resin Derived from 2, 4-Dihydroxybenzaldehyde, Oxamide and Formaldehyde M. V. TARASE, W. B. GURNULE * and A. B. ZADE Department of Chemistry, Laxminarayan Institute of Technology, Rashtrasant Tukdoji Maharaj, Nagpur University, Nagpur-440 010, India. * Department of Chemistry, Kamla Nehru College, Sakkaradara, Nagpur-440 009. India. [email protected] Received 29 August 2008; Accepted 10 October 2008 Abstract: Terpolymer resins (2,4-DHBOF) were synthesized by the condensation of 2,4-dihydroxybenzaldehyde and oxamide with formaldehyde in the presence of hydrochloric acid as catalyst, proved to be selective chelation ion exchange terpolymer resins for certain metals. Chelation ion exchange properties of these polymers were studied for Fe +3 , Cu +2 , Hg +2 , Cd +2 , Co +2 , Zn +2 , Ni +2 and Pb +2 ions. A batch equilibrium method was employed in the study of the selectivity of the distribution of a given metal ions between the polymer sample and a solution containing the metal ion. The study was carried out over a wide pH range and in a media of various ionic strengths. The polymer showed a higher selectivity for Fe +3 , Cd +2 and Co +2 ions than for Cu +2 , Hg +2 , Zn +2 , Ni +2 and Pb +2 ions. Keywords: Synthesis, Ion-exchangers, Batch equilibrium, Distribution ratio, Resin Introduction Ion exchange may be defined as the reversible exchange of ions between the substrate and surrounding medium. Ion exchange technique can remove traces of ion impurities from water/process liquors and given out a product of ultra pure quality in a single efficient and techno-economically viable manner. Ion exchangers are widely used in analytical chemistry, hydrometallurgy, antibiotics, purification and separation of radioisotopes and find large application in water treatment and pollution control 1,2 . Lutfor et al 3 prepared a chelating ion exchange resin containing amidoxime functional group. The chelating poly (amidoxime) resin was characterized by FTIR spectra, TG and DSC analyses. The chelating behavior of
Transcript of Ion Exchange Properties of a Terpolymer Resin...
ISSN: 0973-4945; CODEN ECJHAO
E-Journal of Chemistry
http://www.e-journals.net 2009, 6(3), 639-650
Ion Exchange Properties of a Terpolymer
Resin Derived from 2, 4-Dihydroxybenzaldehyde,
Oxamide and Formaldehyde
M. V. TARASE, W. B. GURNULE* and A. B. ZADE
Department of Chemistry, Laxminarayan Institute of Technology,
Rashtrasant Tukdoji Maharaj, Nagpur University, Nagpur-440 010, India. *Department of Chemistry, Kamla Nehru College,
Sakkaradara, Nagpur-440 009. India.
Received 29 August 2008; Accepted 10 October 2008
Abstract: Terpolymer resins (2,4-DHBOF) were synthesized by the
condensation of 2,4-dihydroxybenzaldehyde and oxamide with formaldehyde in
the presence of hydrochloric acid as catalyst, proved to be selective chelation
ion exchange terpolymer resins for certain metals. Chelation ion exchange
properties of these polymers were studied for Fe+3, Cu+2, Hg+2, Cd+2, Co+2, Zn+2,
Ni+2 and Pb+2 ions. A batch equilibrium method was employed in the study of
the selectivity of the distribution of a given metal ions between the polymer
sample and a solution containing the metal ion. The study was carried out over a
wide pH range and in a media of various ionic strengths. The polymer showed a
higher selectivity for Fe+3, Cd+2 and Co+2 ions than for Cu+2, Hg+2, Zn+2, Ni+2
and Pb+2 ions.
Keywords: Synthesis, Ion-exchangers, Batch equilibrium, Distribution ratio, Resin
Introduction
Ion exchange may be defined as the reversible exchange of ions between the substrate and
surrounding medium. Ion exchange technique can remove traces of ion impurities from
water/process liquors and given out a product of ultra pure quality in a single efficient and
techno-economically viable manner. Ion exchangers are widely used in analytical chemistry,
hydrometallurgy, antibiotics, purification and separation of radioisotopes and find large
application in water treatment and pollution control1,2
. Lutfor et al3 prepared a chelating ion
exchange resin containing amidoxime functional group. The chelating poly (amidoxime)
resin was characterized by FTIR spectra, TG and DSC analyses. The chelating behavior of
640 W. B. GURNULE et al.
the prepared resin was studied with Cu(II), Zn(II), Ni(II), Cd(II) and Pb(II) metal ions.
Samir et al4 synthesized ion exchange resin from 8-quinolinyl methacrylate and
characterized by conventional methods. The thermal analysis was carried out using TGA
and DSC. The metal ion uptake capacities of synthesized copolymers were estimated by
batch equilibration method using different metal ion solutions under different experimental
conditions.
Three phenol-formaldehyde chelating resins, poly (8-hydroxyquinoline-5,7
diylmethylene), poly (8-hydroxyquinoldine-5,7 diylmethylene) and poly (2-aminophenol-5,7
diylmethylene) were synthesized and characterized by Ebraheem5. The chelating
characteristics of these polymers were studied by a batch equilibrium technique. The ion
exchange capacity, effect of electrolyte on metal ion up take, rate of metal uptake and
distribution of metal ion at different pH with resin copolymer derived from
thiosemicarbazone derivatives of phenolic compound shows higher order than the resin
copolymer derived from semicarbazone derivatives6. Recently much work has been carried
out to study the ion exchange properties of anchoring functional chelating groups on the
polymeric network. But as compared to anchored resins, the synthesized resins are more
advantageous because the synthesized insoluble functionalized polymer can provide good
stability and good flexibility in working conditions.
Rivas B. L7 synthesized crosslinked poly [3-(methacryloyl- amino)-propyl]-dimethyl(3-
sulfopropyl)ammoniumhydroxide-co-2-acryl-amidoglycolic acid [PCMAAPDSA-co-
AGCO] by radical polymeri-zation and tested the synthesized polymer as an absorbent under
competitive and non-competitive conditions for Cu(II), Cd(II), Hg(II), Zn(II), Pb(II) and Cr(III)
by batch and column equilibrium procedures. They reported that resin metal ion equilibrium
was achieved before 1 h. the resin showed a maximum retention capacity value of 1.084
m.equ. g-1
for Hg(II) at pH 2. The recovery of the resin was investigated at 20 0C under
different concentration of HNO3 and HClO4.
Jadhao M.M. and coworker8 synthesized a terpolymer resin by condensation of
2,2’dihydroxybiphenyl and formaldehyde in the presence of acid catalyst. They studied
chelating ion exchange properties of this polymer for Fe(III), Cu(II), Ni(II), Zn(II), Cd(II)
and Pb(II) ions. A batch equilibrium method was employed in the study of the selectivity
of metal ion uptake involving the measurement of the distribution of a given metal ion
between the polymer sample and a solution containing metal ions. The study was carried
out over a pH range and in media of various ionic strengths. They reported that the
polymer showed a higher selectivity for Fe(III), Cu(II) and Ni(II) than for Co(II), Zn(II)
Cd(II) and Pb(II) ions.
So for no resin based on 2,4-dihydroxybenzaldehyde-oxamide-formaldehyde in acidic
media has been synthesized for the quantitative separation of transition metal ions. As
industrial influence often rich in transition metal ions, removal of these metals use an
important task for industries. Therefore we have studied the use of ion exchanger for
removal and separation of heavy metal ions. In this paper synthesis and characterization of
the above resin are reported together with the condition for the effective separation of
transition metal ions.
Experimental
The chemicals 2,4-dihydroxybenzaldehyde, oxamide and formaldehyde (37%) used are
of A. R. grade and chemically pure which is purchased from Merck. Solvents like
N, N-dimethyl formamide and dimethylsulphoxide were used after distillation.
Ion Exchange Properties of a Terpolymer Resin 641
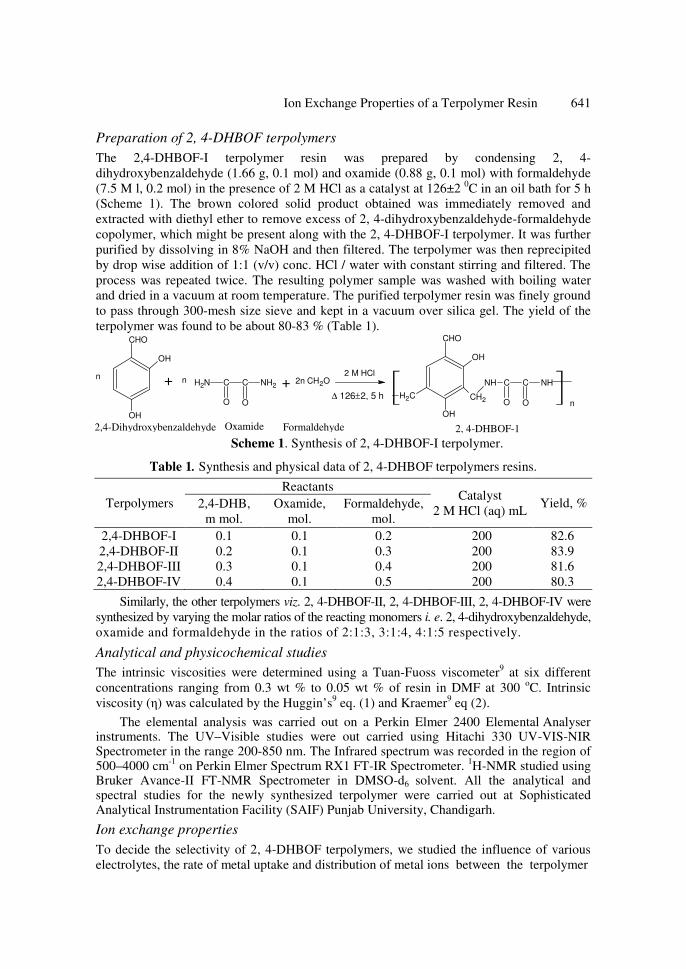
Preparation of 2, 4-DHBOF terpolymers
The 2,4-DHBOF-I terpolymer resin was prepared by condensing 2, 4-
dihydroxybenzaldehyde (1.66 g, 0.1 mol) and oxamide (0.88 g, 0.1 mol) with formaldehyde
(7.5 M l, 0.2 mol) in the presence of 2 M HCl as a catalyst at 126±2 0C in an oil bath for 5 h
(Scheme 1). The brown colored solid product obtained was immediately removed and
extracted with diethyl ether to remove excess of 2, 4-dihydroxybenzaldehyde-formaldehyde
copolymer, which might be present along with the 2, 4-DHBOF-I terpolymer. It was further
purified by dissolving in 8% NaOH and then filtered. The terpolymer was then reprecipited
by drop wise addition of 1:1 (v/v) conc. HCl / water with constant stirring and filtered. The
process was repeated twice. The resulting polymer sample was washed with boiling water
and dried in a vacuum at room temperature. The purified terpolymer resin was finely ground
to pass through 300-mesh size sieve and kept in a vacuum over silica gel. The yield of the
terpolymer was found to be about 80-83 % (Table 1). CHO
OH
OH
n + n NH2 C
O
C
O
NH2 + 2n CH2O2 M HCl
CHO
OH
OH
CH2
NH C
O
C
O
NH
H2Cn
Scheme 1. Synthesis of 2, 4-DHBOF-I terpolymer.
Table 1. Synthesis and physical data of 2, 4-DHBOF terpolymers resins.
Terpolymers
Reactants Catalyst
2 M HCl (aq) mL Yield, % 2,4-DHB,
m mol.
Oxamide,
mol.
Formaldehyde,
mol.
2,4-DHBOF-I 0.1 0.1 0.2 200 82.6
2,4-DHBOF-II 0.2 0.1 0.3 200 83.9
2,4-DHBOF-III 0.3 0.1 0.4 200 81.6
2,4-DHBOF-IV 0.4 0.1 0.5 200 80.3
Similarly, the other terpolymers viz. 2, 4-DHBOF-II, 2, 4-DHBOF-III, 2, 4-DHBOF-IV were
synthesized by varying the molar ratios of the reacting monomers i. e. 2, 4-dihydroxybenzaldehyde,
oxamide and formaldehyde in the ratios of 2:1:3, 3:1:4, 4:1:5 respectively.
Analytical and physicochemical studies
The intrinsic viscosities were determined using a Tuan-Fuoss viscometer9 at six different
concentrations ranging from 0.3 wt % to 0.05 wt % of resin in DMF at 300 oC. Intrinsic
viscosity (η) was calculated by the Huggin’s9 eq. (1) and Kraemer
9 eq (2).
The elemental analysis was carried out on a Perkin Elmer 2400 Elemental Analyser instruments. The UV–Visible studies were out carried using Hitachi 330 UV-VIS-NIR Spectrometer in the range 200-850 nm. The Infrared spectrum was recorded in the region of 500–4000 cm
-1 on Perkin Elmer Spectrum RX1 FT-IR Spectrometer.
1H-NMR studied using
Bruker Avance-II FT-NMR Spectrometer in DMSO-d6 solvent. All the analytical and spectral studies for the newly synthesized terpolymer were carried out at Sophisticated Analytical Instrumentation Facility (SAIF) Punjab University, Chandigarh.
Ion exchange properties
To decide the selectivity of 2, 4-DHBOF terpolymers, we studied the influence of various
electrolytes, the rate of metal uptake and distribution of metal ions between the terpolymer
∆ 126±2, 5 h
2,4-Dihydroxybenzaldehyde Oxamide Formaldehyde 2, 4-DHBOF-1
642 W. B. GURNULE et al.
and solution. The results of the batch equilibrium study carried out with the terpolymer
samples are presented in Tables 5-7.
Determination of metal uptake in the presence of electrolytes of different
concentrations
The terpolymer sample (25 mg) was suspended in an electrolyte solution of NaNO3 (25 mL)
of known concentration. The pH of the suspension was adjusted to the required value by
using either 0.1 N HCl or 0.1 N NaOH. The suspension was stirred for a period of 24 h at
25 0C. To this suspension 2 mL of 0.1 M solution of the metal ion was added and the pH was
adjusted to the required value. The mixture was again stirred at 25 0C for 24 h and filtered.
The solid was washed and the filtrate and washings were combined and the metal ion
content was determined by titration against standard EDTA. The amount of metal ion uptake
of the polymer was calculated from the difference between a blank experiment without
polymer and the reading in the actual experiments. The experiment was repeated in the
presence of other two electrolytes such as NaCl and NaClO4.
Evaluation of the rate of metal uptake
In order to estimate the time required to reach the state of equilibrium under the given
experimental conditions, a series of experiments of the type describe above were carried out,
in which the metal ion taken up by the chelating resins was determined from time to time at
25 0C (in the presence of 25 mL of 1 M NaNO3 solution). It was assumed that under the
given conditions, the state of equilibrium was established within 24 h. The rate of metal ions
uptake is expressed as percentage of the amount of metal ions taken up after a certain time
related to the time, which required for the state of equilibrium.
Evaluation of the distribution of the metal Ions at different pH
The distribution of each one of the five metal ions i.e. Fe+3
, Cu+2
, Hg+2
, Cd+2
, Co+2
, Zn+2
,
Ni+2
and Pb+2
between the polymer phase and the aqueous phase was determined at 25 0C
and in the presence of a 1 M NaNO3 solution. The experiments were carried out as described
above at different pH values. The distribution ratio ‘D’ is defined by eq. (3).
Results and Discussion
The terpolymers which have been use in the present investigation were prepared by the
reaction scheme 1. The resin sample was brown in color, insoluble in commonly used
solvent, but was soluble in DMF, DMSO, THF, pyridine, concentrated H2SO4. No
precipitation and degradation occurs of resin in all the solvents. These resins were analyzed
for carbon, hydrogen and nitrogen content (Table 2).
Viscometric study
Viscometric measurements were carried out in DMF solution at 30 0C using a Tuan Fouss
9
viscometer. Reduced viscosity versus concentration (3% - 0.5%) was plotted for each set of
data. The intrinsic viscosity [η] was determined by the corresponding linear plots (Figure 1).
The following equations were used to determine Huggin’s9 and Krammer’s
9 constant,
respectively:
ηsp./C = [η] + k1.[η]2.C (1)
ln ηrel../C = [η] - k2.[η]2.C (2)
D= Wt. (mg) of metal ions taken up by 1g of terpolymer
Wt. (mg) of metal ion present in 1 mL of terpolymer
Ion Exchange Properties of a Terpolymer Resin 643
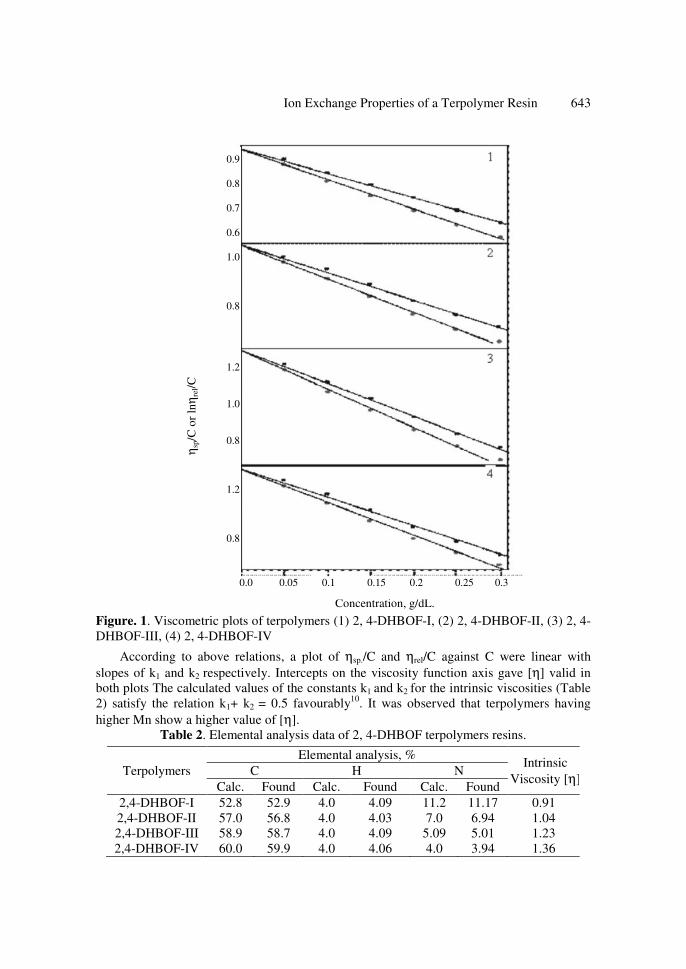
Figure. 1. Viscometric plots of terpolymers (1) 2, 4-DHBOF-I, (2) 2, 4-DHBOF-II, (3) 2, 4-
DHBOF-III, (4) 2, 4-DHBOF-IV
According to above relations, a plot of ηsp./C and ηrel/C against C were linear with
slopes of k1 and k2 respectively. Intercepts on the viscosity function axis gave [η] valid in
both plots The calculated values of the constants k1 and k2 for the intrinsic viscosities (Table
2) satisfy the relation k1+ k2 = 0.5 favourably10
. It was observed that terpolymers having
higher Mn show a higher value of [η].
Table 2. Elemental analysis data of 2, 4-DHBOF terpolymers resins.
Terpolymers
Elemental analysis, % Intrinsic
Viscosity [η]C H N
Calc. Found Calc. Found Calc. Found
2,4-DHBOF-I 52.8 52.9 4.0 4.09 11.2 11.17 0.91
2,4-DHBOF-II 57.0 56.8 4.0 4.03 7.0 6.94 1.04
2,4-DHBOF-III 58.9 58.7 4.0 4.09 5.09 5.01 1.23
2,4-DHBOF-IV 60.0 59.9 4.0 4.06 4.0 3.94 1.36
Concentration, g/dL.
ηsp
/C o
r ln
ηre
l/C
0.0 0.05 0.1 0.15 0.2 0.25 0.3
0.9
0.8
0.7
0.6
1.0
0.8
1.2
1.0
0.8
1.2
0.8
644 W. B. GURNULE et al.
Electronic spectra
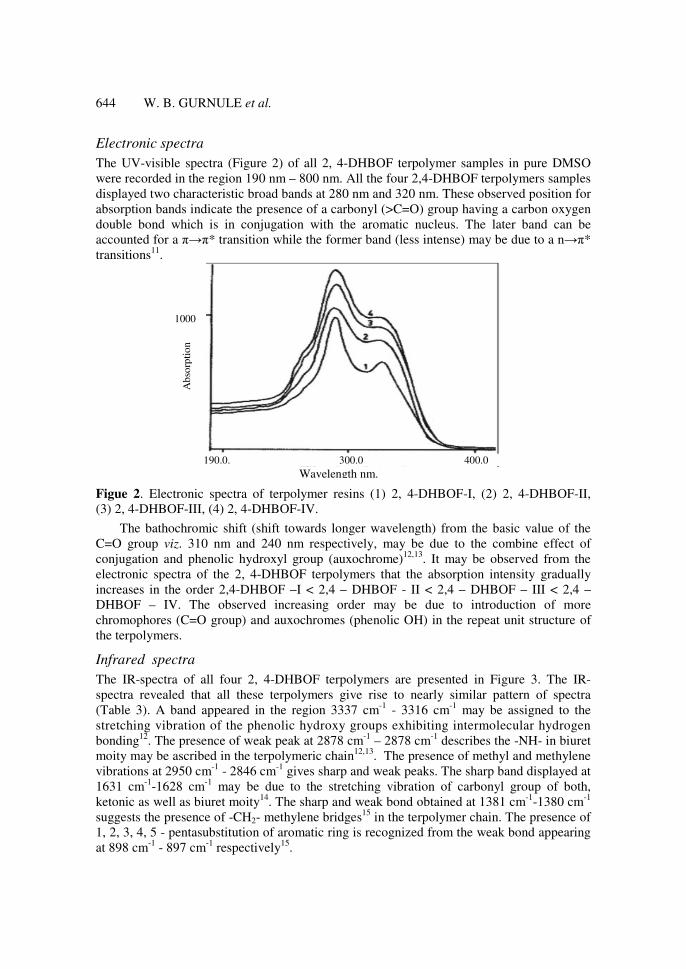
The UV-visible spectra (Figure 2) of all 2, 4-DHBOF terpolymer samples in pure DMSO
were recorded in the region 190 nm – 800 nm. All the four 2,4-DHBOF terpolymers samples
displayed two characteristic broad bands at 280 nm and 320 nm. These observed position for
absorption bands indicate the presence of a carbonyl (>C=O) group having a carbon oxygen
double bond which is in conjugation with the aromatic nucleus. The later band can be
accounted for a π→π* transition while the former band (less intense) may be due to a n→π*
transitions11
.
Figue 2. Electronic spectra of terpolymer resins (1) 2, 4-DHBOF-I, (2) 2, 4-DHBOF-II,
(3) 2, 4-DHBOF-III, (4) 2, 4-DHBOF-IV.
The bathochromic shift (shift towards longer wavelength) from the basic value of the
C=O group viz. 310 nm and 240 nm respectively, may be due to the combine effect of
conjugation and phenolic hydroxyl group (auxochrome)12,13
. It may be observed from the
electronic spectra of the 2, 4-DHBOF terpolymers that the absorption intensity gradually
increases in the order 2,4-DHBOF –I < 2,4 – DHBOF - II < 2,4 – DHBOF – III < 2,4 –
DHBOF – IV. The observed increasing order may be due to introduction of more
chromophores (C=O group) and auxochromes (phenolic OH) in the repeat unit structure of
the terpolymers.
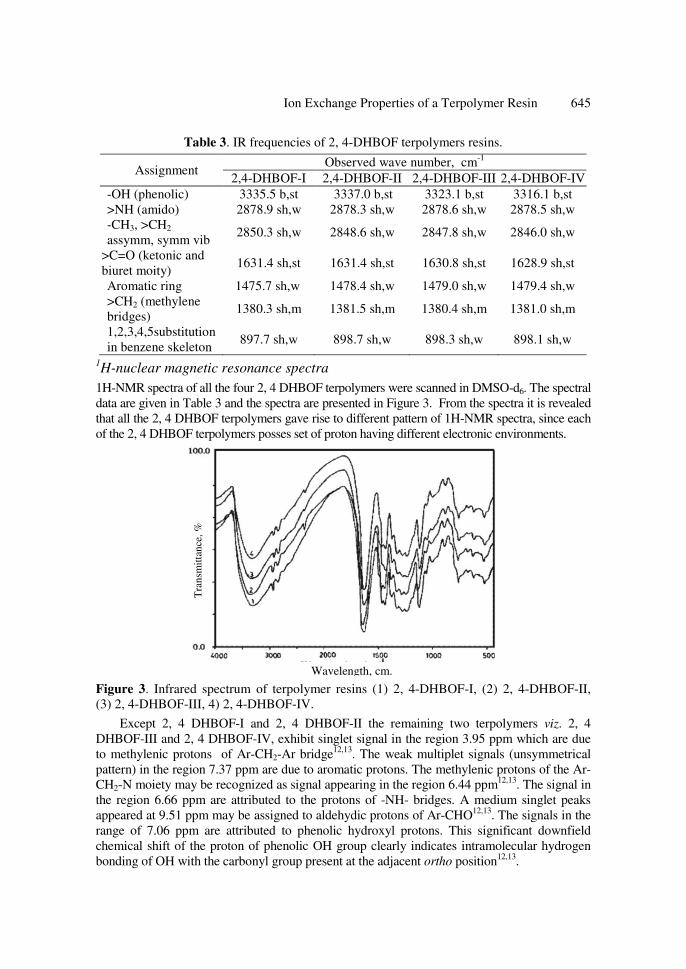
Infrared spectra
The IR-spectra of all four 2, 4-DHBOF terpolymers are presented in Figure 3. The IR-
spectra revealed that all these terpolymers give rise to nearly similar pattern of spectra
(Table 3). A band appeared in the region 3337 cm-1
- 3316 cm-1
may be assigned to the
stretching vibration of the phenolic hydroxy groups exhibiting intermolecular hydrogen
bonding12
. The presence of weak peak at 2878 cm-1
– 2878 cm-1
describes the -NH- in biuret
moity may be ascribed in the terpolymeric chain12,13
. The presence of methyl and methylene
vibrations at 2950 cm-1
- 2846 cm-1
gives sharp and weak peaks. The sharp band displayed at
1631 cm-1
-1628 cm-1
may be due to the stretching vibration of carbonyl group of both,
ketonic as well as biuret moity14
. The sharp and weak bond obtained at 1381 cm-1
-1380 cm-1
suggests the presence of -CH2- methylene bridges15
in the terpolymer chain. The presence of
1, 2, 3, 4, 5 - pentasubstitution of aromatic ring is recognized from the weak bond appearing
at 898 cm-1
- 897 cm-1
respectively15
.
Wavelength nm.
Ab
sorp
tio
n
1000
190.0. 300.0 400.0
Ion Exchange Properties of a Terpolymer Resin 645
Table 3. IR frequencies of 2, 4-DHBOF terpolymers resins.
Assignment Observed wave number, cm
-1
2,4-DHBOF-I 2,4-DHBOF-II 2,4-DHBOF-III 2,4-DHBOF-IV
-OH (phenolic) 3335.5 b,st 3337.0 b,st 3323.1 b,st 3316.1 b,st
>NH (amido) 2878.9 sh,w 2878.3 sh,w 2878.6 sh,w 2878.5 sh,w
-CH3, >CH2
assymm, symm vib 2850.3 sh,w 2848.6 sh,w 2847.8 sh,w 2846.0 sh,w
>C=O (ketonic and
biuret moity) 1631.4 sh,st 1631.4 sh,st 1630.8 sh,st 1628.9 sh,st
Aromatic ring 1475.7 sh,w 1478.4 sh,w 1479.0 sh,w 1479.4 sh,w
>CH2 (methylene
bridges) 1380.3 sh,m 1381.5 sh,m 1380.4 sh,m 1381.0 sh,m
1,2,3,4,5substitution
in benzene skeleton 897.7 sh,w 898.7 sh,w 898.3 sh,w 898.1 sh,w
1H-nuclear magnetic resonance spectra
1H-NMR spectra of all the four 2, 4 DHBOF terpolymers were scanned in DMSO-d6. The spectral
data are given in Table 3 and the spectra are presented in Figure 3. From the spectra it is revealed
that all the 2, 4 DHBOF terpolymers gave rise to different pattern of 1H-NMR spectra, since each
of the 2, 4 DHBOF terpolymers posses set of proton having different electronic environments.
Figure 3. Infrared spectrum of terpolymer resins (1) 2, 4-DHBOF-I, (2) 2, 4-DHBOF-II,
(3) 2, 4-DHBOF-III, 4) 2, 4-DHBOF-IV.
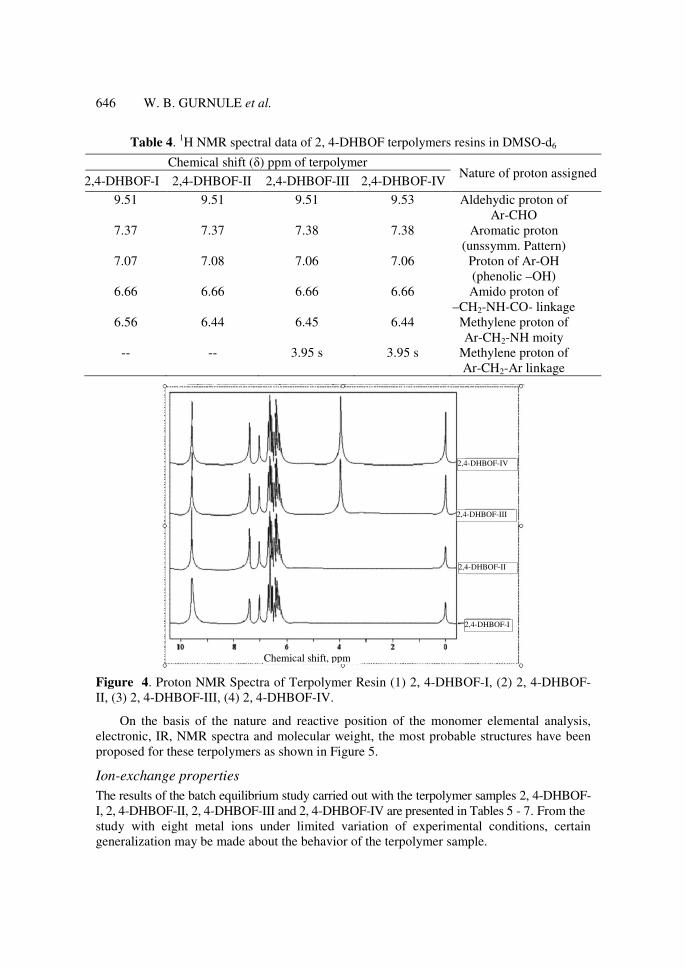
Except 2, 4 DHBOF-I and 2, 4 DHBOF-II the remaining two terpolymers viz. 2, 4
DHBOF-III and 2, 4 DHBOF-IV, exhibit singlet signal in the region 3.95 ppm which are due
to methylenic protons of Ar-CH2-Ar bridge12,13
. The weak multiplet signals (unsymmetrical
pattern) in the region 7.37 ppm are due to aromatic protons. The methylenic protons of the Ar-
CH2-N moiety may be recognized as signal appearing in the region 6.44 ppm12,13
. The signal in
the region 6.66 ppm are attributed to the protons of -NH- bridges. A medium singlet peaks
appeared at 9.51 ppm may be assigned to aldehydic protons of Ar-CHO12,13
. The signals in the
range of 7.06 ppm are attributed to phenolic hydroxyl protons. This significant downfield
chemical shift of the proton of phenolic OH group clearly indicates intramolecular hydrogen
bonding of OH with the carbonyl group present at the adjacent ortho position12,13
.
Wavelength, cm.
Tra
nsm
itta
nce
, %
646 W. B. GURNULE et al.
Table 4. 1H NMR spectral data of 2, 4-DHBOF terpolymers resins in DMSO-d6
Chemical shift (δ) ppm of terpolymer Nature of proton assigned
2,4-DHBOF-I 2,4-DHBOF-II 2,4-DHBOF-III 2,4-DHBOF-IV
9.51 9.51 9.51 9.53 Aldehydic proton of
Ar-CHO
7.37 7.37 7.38 7.38 Aromatic proton
(unssymm. Pattern)
7.07 7.08 7.06 7.06 Proton of Ar-OH
(phenolic –OH)
6.66 6.66 6.66 6.66 Amido proton of
–CH2-NH-CO- linkage
6.56 6.44 6.45 6.44 Methylene proton of
Ar-CH2-NH moity
-- -- 3.95 s 3.95 s Methylene proton of
Ar-CH2-Ar linkage
Figure 4. Proton NMR Spectra of Terpolymer Resin (1) 2, 4-DHBOF-I, (2) 2, 4-DHBOF-
II, (3) 2, 4-DHBOF-III, (4) 2, 4-DHBOF-IV.
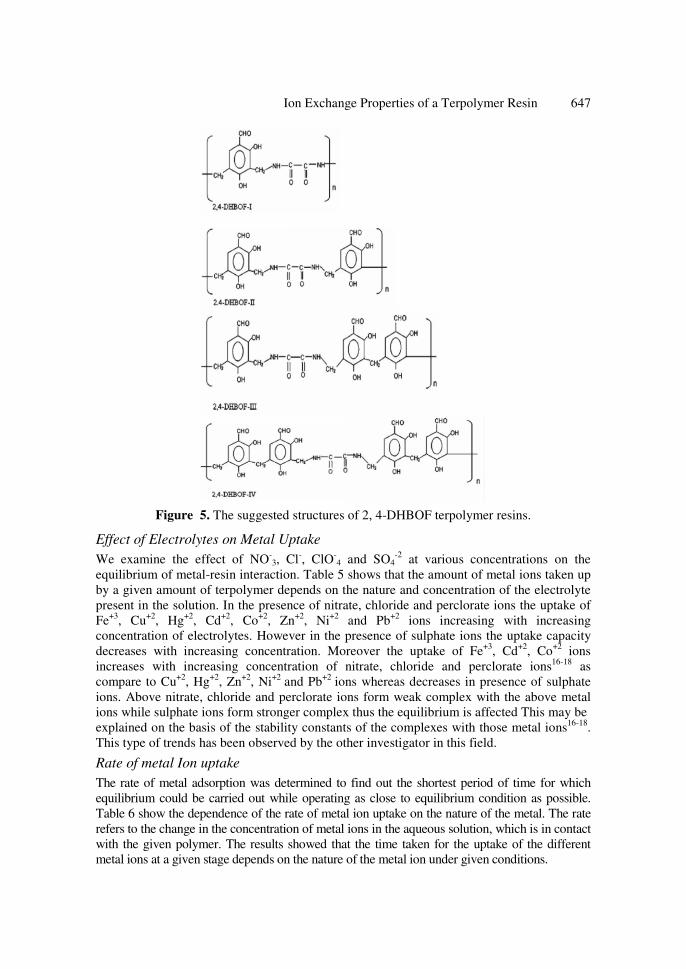
On the basis of the nature and reactive position of the monomer elemental analysis,
electronic, IR, NMR spectra and molecular weight, the most probable structures have been
proposed for these terpolymers as shown in Figure 5.
Ion-exchange properties
The results of the batch equilibrium study carried out with the terpolymer samples 2, 4-DHBOF-
I, 2, 4-DHBOF-II, 2, 4-DHBOF-III and 2, 4-DHBOF-IV are presented in Tables 5 - 7. From the
study with eight metal ions under limited variation of experimental conditions, certain
generalization may be made about the behavior of the terpolymer sample.
Chemical shift, ppm
2,4-DHBOF-I
2,4-DHBOF-II
2,4-DHBOF-III
2,4-DHBOF-IV
Ion Exchange Properties of a Terpolymer Resin 647
Figure 5. The suggested structures of 2, 4-DHBOF terpolymer resins.
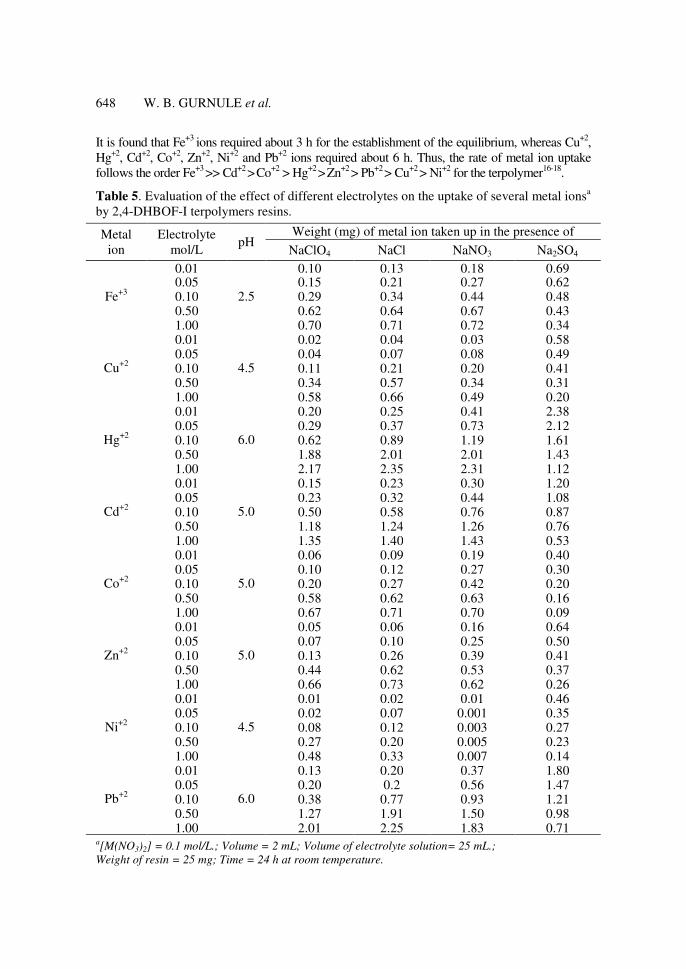
Effect of Electrolytes on Metal Uptake
We examine the effect of NO-3, Cl
-, ClO
-4 and SO4
-2 at various concentrations on the
equilibrium of metal-resin interaction. Table 5 shows that the amount of metal ions taken up
by a given amount of terpolymer depends on the nature and concentration of the electrolyte
present in the solution. In the presence of nitrate, chloride and perclorate ions the uptake of
Fe+3
, Cu+2
, Hg+2
, Cd+2
, Co+2
, Zn+2
, Ni+2
and Pb+2
ions increasing with increasing
concentration of electrolytes. However in the presence of sulphate ions the uptake capacity
decreases with increasing concentration. Moreover the uptake of Fe+3
, Cd+2
, Co+2
ions
increases with increasing concentration of nitrate, chloride and perclorate ions16-18
as
compare to Cu+2
, Hg+2
, Zn+2
, Ni+2
and Pb+2
ions whereas decreases in presence of sulphate
ions. Above nitrate, chloride and perclorate ions form weak complex with the above metal
ions while sulphate ions form stronger complex thus the equilibrium is affected This may be
explained on the basis of the stability constants of the complexes with those metal ions16-18
.
This type of trends has been observed by the other investigator in this field.
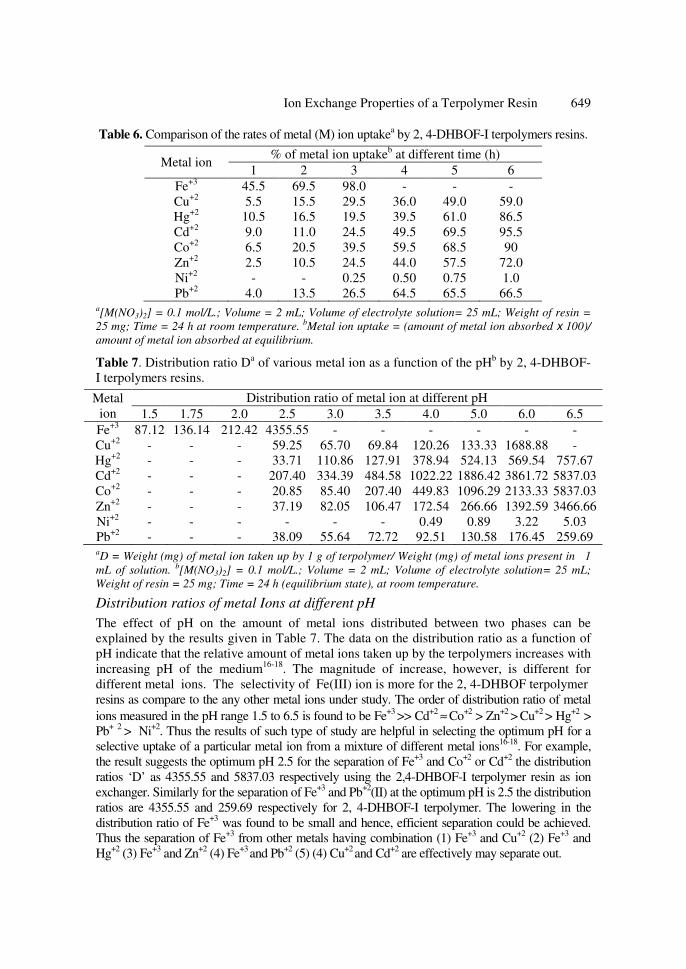
Rate of metal Ion uptake
The rate of metal adsorption was determined to find out the shortest period of time for which
equilibrium could be carried out while operating as close to equilibrium condition as possible.
Table 6 show the dependence of the rate of metal ion uptake on the nature of the metal. The rate
refers to the change in the concentration of metal ions in the aqueous solution, which is in contact
with the given polymer. The results showed that the time taken for the uptake of the different
metal ions at a given stage depends on the nature of the metal ion under given conditions.
648 W. B. GURNULE et al.
It is found that Fe+3
ions required about 3 h for the establishment of the equilibrium, whereas Cu+2
,
Hg+2
, Cd+2
, Co+2
, Zn+2
, Ni+2
and Pb+2
ions required about 6 h. Thus, the rate of metal ion uptake
follows the order Fe+3
>> Cd+2
> Co
+2 > Hg
+2 >
Zn
+2 > Pb
+2 > Cu
+2 > Ni
+2 for the terpolymer
16-18.
Table 5. Evaluation of the effect of different electrolytes on the uptake of several metal ionsa
by 2,4-DHBOF-I terpolymers resins.
Metal
ion
Electrolyte
mol/L pH
Weight (mg) of metal ion taken up in the presence of
NaClO4 NaCl NaNO3 Na2SO4
Fe+3
0.01
2.5
0.10 0.13 0.18 0.69 0.05 0.15 0.21 0.27 0.62 0.10 0.29 0.34 0.44 0.48 0.50 0.62 0.64 0.67 0.43 1.00 0.70 0.71 0.72 0.34
Cu+2
0.01
4.5
0.02 0.04 0.03 0.58 0.05 0.04 0.07 0.08 0.49 0.10 0.11 0.21 0.20 0.41 0.50 0.34 0.57 0.34 0.31 1.00 0.58 0.66 0.49 0.20
Hg+2
0.01
6.0
0.20 0.25 0.41 2.38 0.05 0.29 0.37 0.73 2.12 0.10 0.62 0.89 1.19 1.61 0.50 1.88 2.01 2.01 1.43 1.00 2.17 2.35 2.31 1.12
Cd+2
0.01
5.0
0.15 0.23 0.30 1.20 0.05 0.23 0.32 0.44 1.08 0.10 0.50 0.58 0.76 0.87 0.50 1.18 1.24 1.26 0.76 1.00 1.35 1.40 1.43 0.53
Co+2
0.01
5.0
0.06 0.09 0.19 0.40 0.05 0.10 0.12 0.27 0.30 0.10 0.20 0.27 0.42 0.20 0.50 0.58 0.62 0.63 0.16 1.00 0.67 0.71 0.70 0.09
Zn+2
0.01
5.0
0.05 0.06 0.16 0.64 0.05 0.07 0.10 0.25 0.50 0.10 0.13 0.26 0.39 0.41 0.50 0.44 0.62 0.53 0.37 1.00 0.66 0.73 0.62 0.26
Ni+2
0.01
4.5
0.01 0.02 0.01 0.46 0.05 0.02 0.07 0.001 0.35 0.10 0.08 0.12 0.003 0.27 0.50 0.27 0.20 0.005 0.23 1.00 0.48 0.33 0.007 0.14
Pb+2
0.01
6.0
0.13 0.20 0.37 1.80 0.05 0.20 0.2 0.56 1.47 0.10 0.38 0.77 0.93 1.21 0.50 1.27 1.91 1.50 0.98 1.00 2.01 2.25 1.83 0.71
a[M(NO3)2] = 0.1 mol/L.; Volume = 2 mL; Volume of electrolyte solution= 25 mL.;
Weight of resin = 25 mg; Time = 24 h at room temperature.
Ion Exchange Properties of a Terpolymer Resin 649
Table 6. Comparison of the rates of metal (M) ion uptakea by 2, 4-DHBOF-I terpolymers resins.
Metal ion % of metal ion uptake
b at different time (h)
1 2 3 4 5 6
Fe+3
45.5 69.5 98.0 - - -
Cu+2
5.5 15.5 29.5 36.0 49.0 59.0
Hg+2
10.5 16.5 19.5 39.5 61.0 86.5
Cd+2
9.0 11.0 24.5 49.5 69.5 95.5
Co+2
6.5 20.5 39.5 59.5 68.5 90
Zn+2
2.5 10.5 24.5 44.0 57.5 72.0
Ni+2
- - 0.25 0.50 0.75 1.0
Pb+2
4.0 13.5 26.5 64.5 65.5 66.5 a[M(NO3)2] = 0.1 mol/L.; Volume = 2 mL; Volume of electrolyte solution= 25 mL; Weight of resin =
25 mg; Time = 24 h at room temperature. bMetal ion uptake = (amount of metal ion absorbed x 100)/
amount of metal ion absorbed at equilibrium.
Table 7. Distribution ratio Da of various metal ion as a function of the pH
b by 2, 4-DHBOF-
I terpolymers resins.
Metal
ion
Distribution ratio of metal ion at different pH
1.5 1.75 2.0 2.5 3.0 3.5 4.0 5.0 6.0 6.5
Fe+3
87.12 136.14 212.42 4355.55 - - - - - -
Cu+2
- - - 59.25 65.70 69.84 120.26 133.33 1688.88 -
Hg+2
- - - 33.71 110.86 127.91 378.94 524.13 569.54 757.67
Cd+2
- - - 207.40 334.39 484.58 1022.22 1886.42 3861.72 5837.03
Co+2
- - - 20.85 85.40 207.40 449.83 1096.29 2133.33 5837.03
Zn+2
- - - 37.19 82.05 106.47 172.54 266.66 1392.59 3466.66
Ni+2
- - - - - - 0.49 0.89 3.22 5.03
Pb+2
- - - 38.09 55.64 72.72 92.51 130.58 176.45 259.69 aD = Weight (mg) of metal ion taken up by 1 g of terpolymer/ Weight (mg) of metal ions present in 1
mL of solution. b[M(NO3)2] = 0.1 mol/L.; Volume = 2 mL; Volume of electrolyte solution= 25 mL;
Weight of resin = 25 mg; Time = 24 h (equilibrium state), at room temperature.
Distribution ratios of metal Ions at different pH
The effect of pH on the amount of metal ions distributed between two phases can be
explained by the results given in Table 7. The data on the distribution ratio as a function of
pH indicate that the relative amount of metal ions taken up by the terpolymers increases with
increasing pH of the medium16-18
. The magnitude of increase, however, is different for
different metal ions. The selectivity of Fe(III) ion is more for the 2, 4-DHBOF terpolymer
resins as compare to the any other metal ions under study. The order of distribution ratio of metal
ions measured in the pH range 1.5 to 6.5 is found to be Fe+3
>> Cd+2
≈ Co
+2 > Zn
+2 >
Cu
+2 > Hg
+2 >
Pb+ 2
> Ni+2
. Thus the results of such type of study are helpful in selecting the optimum pH for a
selective uptake of a particular metal ion from a mixture of different metal ions16-18
. For example,
the result suggests the optimum pH 2.5 for the separation of Fe+3
and Co+2
or Cd+2
the distribution
ratios ‘D’ as 4355.55 and 5837.03 respectively using the 2,4-DHBOF-I terpolymer resin as ion
exchanger. Similarly for the separation of Fe+3
and Pb+2
(II) at the optimum pH is 2.5 the distribution
ratios are 4355.55 and 259.69 respectively for 2, 4-DHBOF-I terpolymer. The lowering in the
distribution ratio of Fe+3
was found to be small and hence, efficient separation could be achieved.
Thus the separation of Fe+3
from other metals having combination (1) Fe+3
and Cu+2
(2) Fe+3
and
Hg+2
(3) Fe+3
and Zn+2
(4) Fe+3
and Pb+2
(5) (4) Cu+2
and Cd+2
are effectively may separate out.
650 W. B. GURNULE et al.
Conclusion
1) The 2,4-DHBOF terpolymer based on the condensation polymerization of 2,4-
dihydroxybenzaldehyde and oxamide with formaldehyde in the presence of acid
catalyst has been prepared.
2) The 2,4-DHBOF terpolymer is a selective chelating ion exchange polymer for certain
metals.
3) The terpolymer showed ahigher selectivity for Fe+3
, Cd+2
and Co+2
than for Cu+2
, Hg+2
,
Zn+2
, Ni+2
and Pb+2
ions.
Acknowledgement
Authors are thankful to the Director, Laxminarayan Institute of Technology, R.T.M. Nagpur
University, Nagpur for providing laboratory facilities and also thankful to SAIF, Punjab
University, Chandigarh for carrying out spectral analysis.
References
1 Helfferich F, Ion Exchange Resins, Mc-Grow Hill:New York, 1962.
2 Kunin R, Ion Exchange Resins, 3rd
Ed; Wiley:New York, 1958.
3 Lutfor MR and Silong S, Eur Polym J., 2000, 36, 2105.
4 Patel S A, Shah B S and Patel R M, Iran Polym J., 2004, 13(6), 445.
5 Ibraheem K A K, Al-duhan J A and Himdi S T, Eur Polym J., 1985, 21, 97.
6 Dass S C, J Indian Chem Soc., 2000, 77, 69.
7 Rivas BL and Villegas SJ, Munoz C, J App Polym Sci., 2004, 19(6), 3679-3685.
8 Jadhao M M, Paliwal L J and Bhave N S, J Appl Polym Sci., 2008, 109(1), 508-514.
9 Patel J R, Sutariya D H and Patel M N, React Polym., 1995, 25, 17.
10 Lingala P S, Paliwal L J and Juneja H D, Proc Nat Acad Sci., 2001, 71(A), 205.
11 Michael P E P, Lingala P S, Juneja H D and Paliwal L J, J Appl Polym Sci., 2004, 92(4), 2278.
12 Silverstein R M and Basslel G C, Spectrometric Identification of Organic
Compounds. 2nd
Ed., Wiley, New York, 1987.
13 Dudley H and Fleming I, Spectroscopic methods in Organic Chemistry, Mc-Graw
Hill, U.K., 1975.
14 Patel M M, Kapadiya M A, Patel G P and Joshi J D, J Appl Polym Sci., 2006, 106(2), 1307.
15 Stuart B H, Infrared Spectroscopy: Fundamentals and Applications, John Wiley and
Sons, U. K., 2004, 74.
16 Rath D K, Lenka S and Nayak P L, J Appl Polym Sci., 2003, 46(12), 2109.
17 Bastia T K, Lenka S and Nayak P L, J Appl Polym Sci., 2003, 46(4), 739.
18 Aich R, Lenka S and Nayak P L, J Appl Polym Sci., 2003, 34(3), 319.

Submit your manuscripts athttp://www.hindawi.com
Chromatography Research International
Hindawi Publishing Corporationhttp://www.hindawi.com Volume 2013
Hindawi Publishing Corporationhttp://www.hindawi.com Volume 2013
Carbohydrate Chemistry
International Journal of
Hindawi Publishing Corporationhttp://www.hindawi.com
International Journal of
Analytical ChemistryVolume 2013
ISRN Chromatography
Hindawi Publishing Corporationhttp://www.hindawi.com Volume 2013
Hindawi Publishing Corporation http://www.hindawi.com Volume 2013Hindawi Publishing Corporation http://www.hindawi.com Volume 2013
The Scientific World Journal
Bioinorganic Chemistry and ApplicationsHindawi Publishing Corporationhttp://www.hindawi.com Volume 2013
Hindawi Publishing Corporationhttp://www.hindawi.com Volume 2013
CatalystsJournal of
ISRN Analytical Chemistry
Hindawi Publishing Corporationhttp://www.hindawi.com Volume 2013
ElectrochemistryInternational Journal of
Hindawi Publishing Corporation http://www.hindawi.com Volume 2013
Hindawi Publishing Corporationhttp://www.hindawi.com Volume 2013
Advances in
Physical Chemistry
ISRN Physical Chemistry
Hindawi Publishing Corporationhttp://www.hindawi.com Volume 2013
SpectroscopyInternational Journal of
Hindawi Publishing Corporationhttp://www.hindawi.com Volume 2013
ISRN Inorganic Chemistry
Hindawi Publishing Corporationhttp://www.hindawi.com Volume 2013
Hindawi Publishing Corporationhttp://www.hindawi.com Volume 2013
Journal of
Chemistry
Hindawi Publishing Corporationhttp://www.hindawi.com Volume 2013
Inorganic ChemistryInternational Journal of
Hindawi Publishing Corporation http://www.hindawi.com Volume 2013
International Journal ofPhotoenergy
Hindawi Publishing Corporationhttp://www.hindawi.com
Analytical Methods in Chemistry
Journal of
Volume 2013
ISRN Organic Chemistry
Hindawi Publishing Corporationhttp://www.hindawi.com Volume 2013
Hindawi Publishing Corporationhttp://www.hindawi.com Volume 2013
Journal of
Spectroscopy


![METAL – ION BINDING PROPERTIES OF A TERPOLYMER RESIN I ... · ratios [8]. Salicylic acid melamine with formaldehyde terpolymer found to have higher selectivity for Fe 3+, Cu 2+](https://static.fdocuments.net/doc/165x107/5ffafe9d7db73640014f13fd/metal-a-ion-binding-properties-of-a-terpolymer-resin-i-ratios-8-salicylic.jpg)


