ioe481/ioe481_past_reports/16F08.docx · Web viewUniversity of Michigan Health System C.S. Mott...
35
University of Michigan Health System C.S. Mott Children’s Hospital Program & Operations Analysis Pediatric Hematology, Oncology & Infusion Patient Flow Analysis Final Report Prepared For: Nicole Haskett, Project Client Clinic Manager; Pediatric Hematology, Oncology, BMT & Infusion C.S. Mott Children’s Hospital Kevin DeHority, Project Coordinator Lean Transformation Director Michigan Quality System Carali Van Otteren, Project Coordinator Industrial Engineer Program & Operations Analysis Course Instructor: Professor Mark Van Oyen Prepared By: IOE 481 - Team 8 Andre Lilly Madeline McCormick Brendan Roeschel Alexa Weiser
Transcript of ioe481/ioe481_past_reports/16F08.docx · Web viewUniversity of Michigan Health System C.S. Mott...

University of Michigan Health System C.S. Mott Children’s Hospital
Program & Operations Analysis
Pediatric Hematology, Oncology & Infusion Patient Flow Analysis
Final Report
Prepared For:
Nicole Haskett, Project ClientClinic Manager; Pediatric Hematology, Oncology, BMT & Infusion
C.S. Mott Children’s Hospital
Kevin DeHority, Project CoordinatorLean Transformation Director
Michigan Quality System
Carali Van Otteren, Project CoordinatorIndustrial Engineer
Program & Operations Analysis
Course Instructor:Professor Mark Van Oyen
Prepared By: IOE 481 - Team 8
Andre LillyMadeline McCormick
Brendan RoeschelAlexa Weiser
Date of Submission:December 16, 2016
Table of Contents

Executive Summary 2Introduction 7Background 7Key Issues 9Project Goals 9Project Scope 9Methodology 10Findings 14
Data Analysis 14Interviews 20Literature Search 20
Conclusions 21Recommendations 21Expected Impact 22References 23
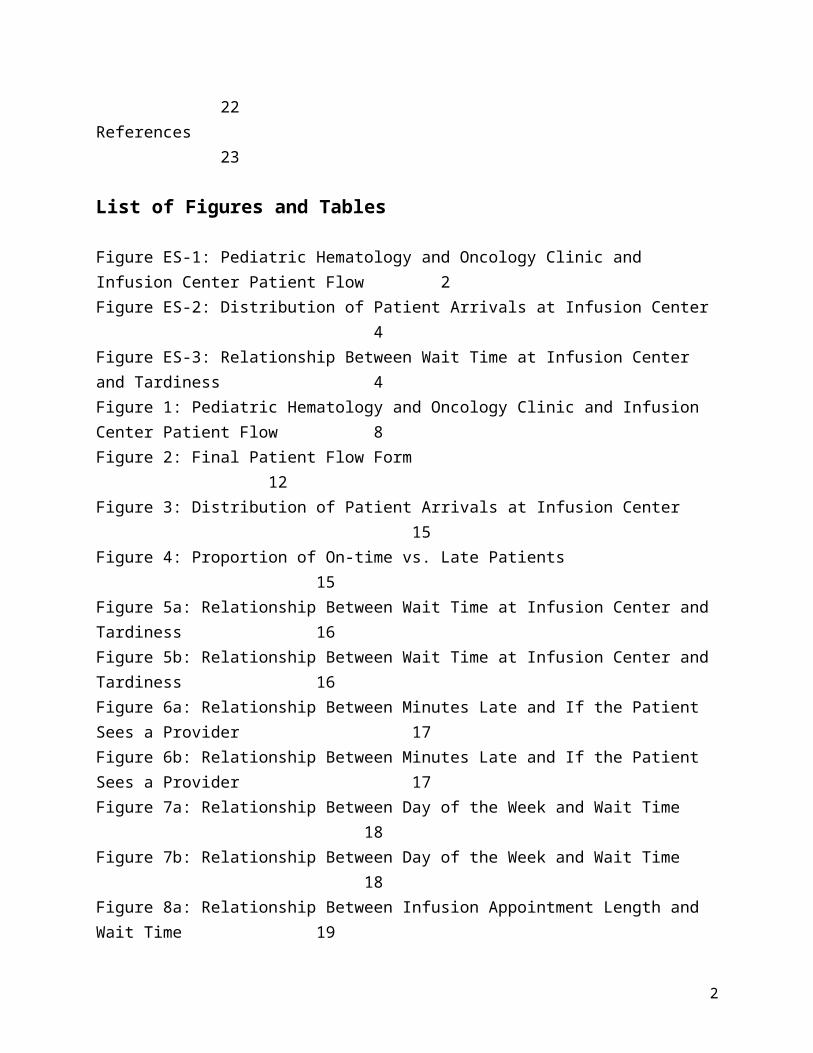
List of Figures and Tables
Figure ES-1: Pediatric Hematology and Oncology Clinic and Infusion Center Patient Flow 2Figure ES-2: Distribution of Patient Arrivals at Infusion Center 4Figure ES-3: Relationship Between Wait Time at Infusion Center and Tardiness 4Figure 1: Pediatric Hematology and Oncology Clinic and Infusion Center Patient Flow 8Figure 2: Final Patient Flow Form 12Figure 3: Distribution of Patient Arrivals at Infusion Center 15Figure 4: Proportion of On-time vs. Late Patients 15Figure 5a: Relationship Between Wait Time at Infusion Center and Tardiness 16Figure 5b: Relationship Between Wait Time at Infusion Center and Tardiness 16Figure 6a: Relationship Between Minutes Late and If the Patient Sees a Provider 17Figure 6b: Relationship Between Minutes Late and If the Patient Sees a Provider 17Figure 7a: Relationship Between Day of the Week and Wait Time 18Figure 7b: Relationship Between Day of the Week and Wait Time 18Figure 8a: Relationship Between Infusion Appointment Length and Wait Time 19Figure 8b: Relationship Between Infusion Appointment Length and Wait Time 19Figure 9: Proportion of Patients that See a Primary Nurse 20
Executive Summary
1
In basic patient flow within the Pediatric Hematology and Oncology (Peds Hem/Onc) Clinic at C.S. Mott Children’s Hospital in the University of Michigan Health System, patients typically go from their appointment with a provider in the Ped Hem/Onc Clinic immediately to an appointment in the Infusion Center for treatment. The Infusion Center and Ped Hem/Onc Clinic are separate but adjacent units that work closely together. Staff members of the clinic believe that current patient arrivals into the Infusion Center from the Ped Hem/Onc Clinic are not aligned with nurses’ servicing capacity in the Infusion Center; this lack of alignment leads to long wait times for patients and poorly utilized nurses. The clinic would like to better understand the current state of patient flow between the clinic and Infusion Center and identify opportunities for improving nurse-to-patient alignment. They asked a team of four senior Industrial and Operations Engineering Students from the University of Michigan to document the current state of patient flow in the clinic and identify sources of the problem. With this information, the clinic members will have a robust knowledge foundation regarding current operations and know where to focus future efforts toward improvement.
Background
Patient flow between the Pediatric Hematology & Oncology Clinic and the Infusion Center relies on several different staff members and varies greatly with each patient. Typical patient flow can be seen in Figure ES-1, which is based on observation and interviews.
Figure ES-1: Pediatric Hematology and Oncology and Infusion Center Patient Flow
Typically, a patient will: (1) Check in at the front desk; (2) Sit in the waiting area until a Medical Assistant calls the patient; (3) Have vitals taken by a Medical Assistant; (4) Enter exam room with provider; (5) Check out of the clinic, enter Infusion Center, and wait to be called by a nurse; and (6) Begin infusion treatment in Infusion Center. According to the Clinic Manager, patients experience an average wait time of 30 to 45 minutes between the end of their doctor’s appointment in the clinic and the start of their infusion treatment (5) during these peak periods.
2

There are many factors to take into consideration when identifying causes of these wait times. Nurses have reported the belief that primary nursing has increasingly contributed to wait times in the Infusion Center. Primary nursing is a relationship-based care model in which one nurse is continually responsible for the care of one patient throughout all of the patient’s visits. Primary nursing can be problematic because it affects the utilization of nurses and can cause appointments to back up if one nurse is sitting idle while a patient is waiting for a busy nurse. The Nurse Manager has also expressed a concern with patient safety, as an over-utilized nurse is more likely to make a mistake, as he/she must work quickly to get from one patient to another.
Project GoalsTo determine how to improve nurse-to-patient alignment, the student team targeted the following objectives:
● Understand the current patient scheduling process● Collect timestamps for Clinic and Infusion Center patient flow● Understand the pros and cons of current care model● Identify key variables that affect patient arrival rate
With this information, the team developed recommendations to:● Balance nurse utilization● Reduce patient wait times
Methodology
To achieve the project goal of improving nurse-to-patient alignment, the team conducted 16 hours of patient flow observation in the clinic and Infusion Center; interviewed two members of each of the scheduling, infusion center, and managerial staff; performed a literature search to discover similar studies and project methodologies that can be utilized in this project; and developed, distributed, and collected 89 patient flow forms, which were completed by patients and Medical Assistants (MAs). The purpose of the interviews and observation was to better understand the problem and identify all possible sources of data that would be beneficial to quantify in order to address the problem of poor nurse-to-patient alignment. The purpose of the literature search was to discover methodologies that other hospitals and engineers have developed to address similar problems. The purpose of the patient flow forms was to collect substantial and reliable data that could be used for modeling and analyzing the issues that were leading to poor nurse-to-patient alignment and long patient wait times. The team stored the patient flow form data in Microsoft Excel and analyzed it using hypothesis tests and ANOVA analysis through Minitab Statistical Software in order to determine which factors lead to the best and the worst nurse-to-patient alignment. Nurse-to-patient alignment was quantified by the amount of time a patient would sit in the waiting room before a nurse could see them in the Infusion Center.
3

Findings and Conclusions
The following findings and conclusions have been deduced from the patient flow, observations, literature search and interview data. From Figure ES-2 below, 90% of patients are arriving at the Infusion Center between the hours of 9:00 am - 11:00 am.
Figure ES-2: Distribution of Patient Arrivals at Infusion Center
The team also found that 52% of patients arrive to their appointments over 15 minutes late. From Figure ES-3 below, the patients who are arriving on time wait significantly longer than patients who arrive late.
Figure ES-3: Relationship Between Wait Time at Infusion Center and Tardiness
By observing the current care model of Primary Nursing, the team found that 41% of patients wait to see their Primary Nurse rather than seeing whichever nurse is available to give them their treatment at the time. This offsets the schedule and has a similar effect as patients arriving late: poor nurse-to-patient alignment and longer patient wait times.
Finally, by conducting a literature search, the team found a study highlighting the benefits of modular nursing in comparison to primary nursing. Modular nursing focuses on patient centered care and cost effective use of available personnel. It divides workers into teams, led by one Registered Nurse (RN) who delegates tasks to members of the team based on ability and
4
availability so that each member is ‘used’ at the level of which they are capable and expected to perform. The study found that a shift from Primary to Modular Nursing in a chemotherapy unit improved utilization of nurses and kept the Patient Caring Index relatively constant. However, this study was done on an adult chemotherapy unit, so the perception may differ in a pediatric unit.
Patient Flow Data● Peak arrivals are between 9:00am - 11:00 am● On-time patients are currently waiting longer than late patients● Late patient arrivals offset the schedule and contribute to worse nurse-to-patient
alignment and longer wait times for patients● Primary nursing is an inefficient system and is contributing to worse nurse-to-patient
alignment and longer wait times for patients● Modular nursing is an effective tool to improve nurse utilization
Recommendations
From the conclusions drawn from data analysis, the team developed six recommendations to balance nurse utilization and reduce patient wait times.
Immediate Impact RecommendationsThe team suggests implementing the following immediate impact recommendations as soon as possible, as there is significant evidence from the Findings and Conclusions that suggests patient-to-nurse alignment and patient wait times will be improved:
● Shift from the Primary Nursing Care Model to Modular Nursing Care Model● Enforce a rule where patients need to call the Clinic if they are going to be more than 15
minutes late so that the Infusion Center can plan for these arrivals● Do not see patients before their scheduled time if they arrive early to their infusion
appointment, as it will offset the schedule and result in worse nurse-to-patient alignment
Delayed Impact RecommendationsThe team suggests implementing the delayed impact recommendations as a placeholder if the immediate impact recommendations cannot be implemented due to hospital policies or other constraints. These recommendations are a second alternative as they will not have as immediate of an effect on patient-to-nurse alignment and patient wait times.
● Put up signs and send out emails to remind patients to arrive on time for their appointments
● Distribute surveys to the patients to get feedback on why they are not arriving on time to see if it is a fixable issue
5

● Increase communication between the Clinic and the Infusion Center so that the Infusion Center can be aware if there are irregular circumstances or delays with a patient they are scheduled to see
RisksThere are several risks associated with implementing these recommendations in the Clinic. First, eliminating primary nursing may affect patient satisfaction. Treatments at the Clinic are extremely sensitive and any added comfort that the Clinic can provide is of great benefit. However, after interviewing the Clinic Manager and nurses, the team believes that the positive impact of having shorter wait times outweighs the negative effect of the patient seeing multiple nurses throughout treatment. Additionally, to mitigate this risk, the team suggests that the patients be made aware (through email or in-person by a MA) that all nurses are equally qualified to treat them.
Next, patients may forget to call the Clinic if they are running late. Therefore, to mitigate this risk, the team suggests that patients be constantly reminded of this new policy during the first few months of its implementation. These reminders could be given orally from the schedulers as they schedule patients’ next appointments.
Introduction
6

The Pediatric Hematology and Oncology (Peds Hem/Onc) Clinic at C.S. Mott Children’s Hospital in the University of Michigan Health System (UMHS) treats patients under the age of 18 who have been diagnosed with cancers or tumors. Adjacent to this clinic is the Infusion Center, which provides various treatments to patients from the Peds Hem/Onc Clinic. The majority of patients in the Infusion Center have an appointment with a provider in the Peds Hem/Onc Clinic an hour before their appointment for treatment in the Infusion Center. Current patient arrivals into the Infusion Center from the Peds Hem/Onc Clinic are not aligned with nurses’ servicing capacity in the Infusion Center. Appointments often overlap and multiple patients arrive to the Infusion Center at the same time. Consequently, the nurse manager has reported that nurses in the Infusion Center are both under and over utilized at times and patients often have to wait before getting treatments. Therefore, both the Clinic Manager and the Nurse Manager of the Peds Hem/Onc Clinic would like to know how to improve nurse-to-patient alignment.
The Clinic Manager and the Nurse Manager of the Pediatric Hematology and Oncology Clinic have asked a team of senior Industrial and Operations Engineering students from the University of Michigan to analyze the current patient scheduling process and determine why it does not optimally align patient arrivals with nurses’ servicing capacity. The team has documented the current state of patient flow by interviewing faculty and staff, observing the clinic, and distributing Patient Flow Forms. This report provides the details of the project, including methods, findings, conclusions, high level recommendations, and the expected impact.
Background
According to the Clinic Manager, patients experience an average wait time of 30 to 45 minutes between the end of their doctor’s appointment in the clinic and the start of their infusion treatment during these peak periods. With many phases of this patient flow relying on each other, there are many factors to take into consideration when identifying the root cause of these wait times.
The typical flow of a clinic and infusion patient can be seen in Figure 1 below. Each patient checks in with the clerk at the front desk of the Peds/Hem Onc Clinic and waits in the seated waiting area. The Medical Assistant (MA) will then call the patient to take his or her vitals and places the patient in an exam room to be seen by a physician or nurse practitioner. The Infusion Center typically requires patients to first be seen by a doctor and have their vitals taken to ensure that they are healthy enough to receive their scheduled infusion treatment. The duration of a doctor’s appointment can vary greatly, but is usually one-hour long. If a patient’s vitals or blood cell count do not meet the requirements for their treatment, the patient must reschedule the appointment for another day. Because it is fairly common for a patient to reschedule, the relatively expensive treatments are not prepared until the patient’s vitals are taken and meet the required blood cell count. This factor affects how quickly some patients with more expensive
7

treatments ($3,000 - $20,000) can move to the Infusion Center, because the medicine can take up to an hour to prepare. However, the majority of treatments are relatively inexpensive ($2,000-$3,000) and can be prepared by the hospital pharmacy before the patient’s appointment.
Figure 1: Pediatric Hematology and Oncology Clinic and Infusion Center Patient Flow
The client reported that the majority of patients arrive to the Infusion Center between 9:00 am and 1:00 pm on Mondays, Tuesdays, and Thursdays. Appointments are made using MiChart software, the primary platform for patient documentation as well as order entry. When a scheduler makes an appointment in MiChart, the scheduler cannot see how many other patients are scheduled during that time. Clinic staff have reported that patient flow during these peak hours is overwhelming and that they struggle to serve patients in a timely manner. Staff have also reported feeling underutilized during the later hours of the day when patient volume drops dramatically. Many nurses have reported that they believe the problem is patient scheduling and arrival times, not the number of patients.
Predicting when patients will be ready for infusion is difficult and results in problems for both nurses and patients. Infusion treatment time can last from 30 minutes to 8 hours and is known when appointments are scheduled. However, it can be longer due to unforeseen issues such as difficulty drawing blood or an uncooperative patient.
Nurses have also reported their belief that primary nursing has increasingly contributed to wait times in the Infusion Center. Primary nursing is a relationship-based care model in which one nurse is continually responsible for the care of one patient throughout all of the patient’s visits.
8
Many patients have become attached to one nurse in the Infusion Center and thus insist on waiting for that nurse to be available to begin their treatment. Primary nursing can be problematic in this setting, because it affects the utilization of nurses and can cause appointments to back up if one nurse is sitting idle while a patient is waiting for a busy nurse. The Nurse Manager has also expressed a concern with patient safety, as an over utilized nurse is more likely to make a mistake as he/she must work very quickly to get from one patient to another.
Additionally, Medical Assistants (MAs) in the Infusion Center have reported feeling overworked during these peak hours, as they do not have the resources to move multiple patients to infusion at the same time.
Key Issues
The following key issues were identified as the driving factors behind this project:● Patients have significant wait times during peak hours● Staff have reported feeling overwhelmed by patient flow● Patient volume is unknown on any given day● Patient safety and satisfaction is a concern
Project Goals
To determine how to improve nurse-to-patient alignment, the student team achieved the following goals:
● Understand the current patient scheduling process● Collect timestamps for Clinic and Infusion Center patient flow● Understand the pros and cons of current care model● Identify key variables that affect patient arrival rate
With this information, the team developed recommendations to:● Balance nurse utilization● Reduce patient wait times
Project Scope
The scope of the project included the Pediatric Hematology and Oncology Clinic and Infusion Center. The team observed the flow of patients in the Infusion Center; these patients are treated by doctors in the Peds Hem/Onc Clinic. Patient flow was measured from the time a patient checks into the Peds Hem/Onc Clinic, often for an appointment with his/her provider, until the time a patient checks out of the Infusion Center after receiving an infusion treatment. Patient and staffing volume data was collected from 9:00 am through 2:00 pm on Mondays, Tuesdays, and Thursdays, from October 24th to November 15th.
9

The project did not consider patients in the Infusion Center who are receiving BMT and Sickle Cell treatments. In addition, the project did not consider patients in the Ped Hem/Onc Clinic who do not require treatment in the Infusion Center.
Methodology
In order to improve patient-to-nurse alignment, the team first identified the problem through observation. From there, they conducted interviews, performed a literature search, collected data, analyzed the data, and developed recommendations.
Problem Identification
First, the team discussed the problem with the Clinic Manager and Nurse Manager. Next, the Clinic Manager escorted the team on a walk-through of the clinic, following the steps a patient would generally take on a scheduled visit. During the walk through, the team was introduced to several of the staff members at the clinic and given a breakdown of their roles and responsibilities.
Interviews
Interviews took place during two phases of the project. The first set of interviews took place before the team began collecting data and the second took place once the team began to analyze the data. All interviews were informal and took place in the clinic.
Firstly, two schedulers, two nurses and one receptionist were interviewed. The primary purpose of these interviews was to help the team understand how the current scheduling process works, why delays are typically caused, what has already been attempted to solve the problem. The secondary purpose was to seek advice concerning the most effective way to collect data.
Secondly, one scheduler and three nurses were interviewed. The purpose of these interviews was to discuss trends in the data and see if these trends were in line with staff expectations.
Literature Search
The team reviewed previous IOE 481: Practicum in the Hospital project: ● “Analyzing Patient Flow and Process Waste in the General Thoracic Surgery Clinic,” by
Matt Bovbjerg, Lauren Meeks, Kamahl Shehadeh, and Kyle Worley
10

This project was provided to the team by the Project Coordinators; it helped the team understand the format and content of reports as well as learn about similar projects in the past within the hospital.
Additionally, the team has reviewed the following electronic articles regarding patient wait times and care models in infusion centers:
● “Stochastic Optimization to Reduce Wait Times in an Outpatient Infusion Center,” by Jeremy Castang with University of Michigan Center for Healthcare Engineering and Patient Safety
● “The Impact of Primary and Modular Nursing Delivery Systems on Perceptions of Caring Behavior,” by AK Carruth at School of Nursing, Southeastern Louisiana University, Hammond, LA., USA
Data Collection
The data used in this project was collected through Patient Flow Forms, observation of patient flow within the clinic and Infusion Center, and staff interviews.
Patient Flow FormFrom the interviews, the literature search and the input of the clients and coordinators, the team decided that the most effective and appropriate way to collect data was with a patient flow form that could be distributed to the patients each time they come in for an appointment. Several iterations of the form were made before it was finalized. The initial layout had two sections: one for information on the patient’s appointment at the Clinic, and one for information on the patient’s subsequent appointment at the Infusion Center. The problem with this layout was that it was unclear which portions of the form were to be filled out by MAs and which portions were to be filled out by patients.
In addition, the language in this version was unclear and vulnerable to misinterpretation by patients. Therefore, the team redesigned the form by creating one portion to be completed by staff members and one portion to be completed by patients. The team utilized feedback and suggestions provided by the Nurse Manager to make the language clearer and the layout simpler. Not only is the revised layout more visually appealing, it also enables the MAs to add comments on the form to explain potential outliers. The final form can be seen below in Figure 2.
11

Figure 2: Final Patient Flow Form
The team first discussed how to distribute the form to minimize clinic disruption while still ensuring accurate form completion. Initially, the team believed patients should complete the form to eliminate the bias that may stem from having 1-3 MAs responsible for all of the forms. However, the team found that it would be more efficient for MAs to fill out fixed information such as physician names and appointment times prior to patient arrival; therefore, the team asked both MAs and patients to complete separate portions of the forms. The MAs provided the physician names, appointment times, and treatment information, while the patients provided exact time stamps as they go through the clinic and infusion treatment process.
The team distributed this form to the receptionist at the clinic. The “staff section” of the form could be completed prior to the patient’s arrival and the “patient section” of the form was to be completed by the parent or guardian of the child coming in for treatment. The Clinic Manager sent out several emails to the staff of the clinic to ensure they all understood how to fill out the form and why the team is performing the study. These communications were extremely important because they helped avoid making staff feel as though they were being evaluated.
The forms were distributed for 15 days; however, many of the forms that were distributed during the first week were unusable because they were only partially filled out. Therefore, the data analysis was performed on forms that were distributed over 12 days from October 24th to November 15th. In total, 53 forms were used for data analysis.
12

Observation at Pediatric Hematology ClinicThe team conducted three weeks (9 days) of observation in the clinic. On each of these observation days, the team visited the Clinic in teams of two from ~9:00am-1:00pm. By observing the process, the team better understood how the steps in the process relate one another and were better able to make sense of the data. In addition, the team observed the MAs and the patients, as they filled out the patient flow forms to ensure that there was no confusion regarding the wording in the forms.
Data Analysis
The data analysis portion of the project can be broken down into three phases: data preparation, hypothesis testing, and ANOVA analysis. This section explains the analytical approach in detail.
Data PreparationTo prepare the data, the student team entered all the patient flow forms into an organized Excel database. The data was cleansed by removing data points that were filled out incompletely or incorrectly on the forms. Of the 89 patients surveyed, 53 had data that was sufficient for analysis. Therefore, 53 data points were used throughout the team’s analyses.
Continuous variables were generated to measure wait times, appointment tardiness, and process flow times for each portion of the flow process. Binary variables were created to identify which patients were seeing a provider before their infusion appointments and which patients were arriving late to appointments. Lastly, nominal variables were made to categorize other influential factors such as the day of the week.
Hypothesis TestingTo begin driving insights in the data, the team stratified the data across the newly-created binary variables. For example, the data was segmented according to whether or not a patient was late and whether or not a provider was seen that day. In order to compare data segments, the team conducted two sample t-tests to investigate if there was a significant difference in the samples’ means. Unless stated otherwise, a significance level of 0.05 was used throughout the analysis. Along with the tests, the team created box plots to highlight variation within certain variables. The test results and graphs were carried out using Minitab, a statistical analysis software.
ANOVA AnalysisWhile hypothesis testing was used to analyze data stratified across binary variables, ANOVA analysis was used to study data stratified across nominal variables such as the day of the week and appointment duration. Appointment duration data was split into three subsets: short, medium, and long, according to client definitions of appointment length. To follow up on this analysis, interval plots were generated, which show how the means and variances compare across variables. The team again used Minitab to complete the tests and graphs.
13

Developing Recommendations
To develop recommendations, the team examined the graphs and figures that were produced and identified trends to determine problem areas that were leading to longer patient wait times. The team investigated numerous relationships, including:
● Timeliness of patient arrivals (early, on-time, or late) vs. wait time● Duration of infusion treatment (“short”, “medium” or “long”) vs. wait time● Duration of infusion treatment vs. timeliness of patient● Time of day vs. wait time● Time of day vs. timeliness of patient
Next, the team met with a data analytics expert and the project coordinators to further collaborate and develop a set of recommendations to reduce patient wait time.
Findings
The student team has identified findings both through quantitative data in the patient flow forms and through qualitative data in the employee interviews and literature search. The team compared as many variables as possible to arrival time and patient wait time in order to find relationships between these variables and ultimately improve nurse-to-patient alignment. The variables compared include arrival time, whether patients were over 10 minutes late, whether the patient saw a provider, what day of the week it was, and whether the patient saw a primary nurse or not.
Data Analysis
As seen in Figure 3 below, it is clear that peak arrival at the infusion center is between 9:00 and 11:00 am, which is leading to poor patient-to-nurse alignment during this timeframe. This finding reveals that peak arrival occurs over a slightly narrower timeframe than originally specified by the client. Therefore, the team decided to focus its efforts on improving the patient-to-nurse alignments specifically during these hours of the day.
14

Figure 3: Distribution of Patient Arrivals at Infusion Center
As seen in Figure 4 below, more than half of the patients are late to their appointments. The Clinic Manager defined a patient as being late if the patient arrives 10 minutes or greater after the scheduled appointment time.
Figure 4: Proportion of On-time vs. Late Patients
Next, the team performed a two sample t-test to examine the effect of tardiness on patient wait time. The test’s output in Figure 5a below proves that on-time patients are actually waiting longer than late patients. This conclusion is supported by the fact that the p-value, 0.015, is less than the significance level, 0.05. The boxplot in Figure 5b supports the above conclusion and illustrates that on-time patient wait times are far more variable than those for late patients, as seen by the difference in height between the boxes.
The fact that on-time patients wait longer than late patients to be treated is counterintuitive. The data shows that it is more common for a late patient to be seen right away than an on-time patient; this late patient is essentially taking the next available slot and jeopardizing the next appointment, assuming the next patient is on time. The student team believes that since the
15

majority of patients are late, the on-time patients are disrupting the flow of the process and are therefore being punished with longer wait times.
Figure 5a: Relationship Between Wait Time at Infusion Center and Tardiness
Figure 5b: Relationship Between Wait Time at Infusion Center and Tardiness
The student team also conducted a two sample t-test to study whether a patient having a provider appointment prior to their infusion appointment affected the patient’s wait time. The test’s output in Figure 6a below suggests that seeing a provider before infusion has no effect on lateness or wait time. The p-value, 0.507, is much greater than the significance level 0.05, so the team cannot claim that the means are significantly different.
This leads the team to believe that provider appointment scheduling is not the root cause of the unbalanced patient-to-nurse alignment or the long wait times. The boxplot in Figure 6b illustrates
16
that wait time variation is the same regardless of whether a patient saw a provider prior to infusion, which further supports that the team need to look elsewhere for areas of improvement.
Figure 6a: Relationship Between Minutes Late and if the Patient sees a Provider
Figure 6b: Relationship Between Minutes Late and if the Patient sees a Provider
Next, the student team utilized ANOVA analysis to investigate both the day of the week’s effect and the infusion appointment length’s effect on wait time in the infusion center. ANOVA was used because the day of the week and appointment length (short, medium, or long) are both nominal variables rather than binary variables. As seen in both the test output in Figure 7a and the confidence interval plot in Figure 7b, all three confidence intervals overlap, which indicates that there is no statistically significant difference between the three days the infusion center is open. Therefore, the team ignored this variable and looked elsewhere for improvement opportunities.
17

Figure 7a: Relationship Between Day of the Week and Wait Time
Figures 7b: Relationship Between Day of the Week and Wait Time
Next, the team investigated whether the length of the infusion appointment has an impact on patient wait time. As seen in both Figures 8a and 8b, all three confidence intervals overlap, which suggests that there is no statistically significant difference between the wait times for appointments having different durations. Therefore, the team ignored this variable and looked at other variables to derive insights.
18

Figure 8a: Relationship Between Infusion Appointment Length and Wait Time
Figure 8b: Relationship Between Infusion Appointment Length and Wait Time
Additionally, over the data collection period from October 24th to November 15th, the team collected the patient schedules that are filled out daily by the Charge Nurse. In these patient schedules, the Charge Nurse writes down which patients came in each day and which nurse gave them their infusion treatment. Therefore, from these forms, the team was able to infer whether a patient was consistently seeing the same nurse (or his/her ‘primary nurse’). If a patient came in three or more times over the data collection period and always saw the same nurse, the team concluded that the patient was seeing a primary nurse.
Since only 27 patients came in 3 or more times during the data collection period, the sample size was 27 patients. Of these 27 patients, 11 of them (41%) saw a primary nurse, as shown in Figure 9. In addition, the team noticed that regardless of whether a patient was seeing a primary nurse, each patient is scheduled to a specific nurse rather than just a specific time.
19

Figure 9: Proportion of Patients that See a Primary Nurse
Interviews
Throughout the interviews, the subject of primary nursing and the delays caused by primary nursing was a recurring topic. The Clinic Manager stated that some patients can wait up to 3 hours to have their infusion appointment due to primary nursing. This is an unacceptable wait time according to the Nurse Manager and can be avoided because all nurses and MAs receive the same training and have equal qualifications. Therefore, they are all qualified to see any patient, whether they are the patient’s primary nurse or not. Nurses reported that the only reason for primary nursing is the emotional comfort it brings to a patient to have someone familiar administering their treatment. From these interviews, the team was able to identify that Primary Nursing leads to worse nurse-to-patient alignment.
Literature Search
The report titled “Analyzing Patient Flow and Process Waste in the General Thoracic Surgery Clinic” provided the team with the idea to use Patient Flow Forms to better understand patient flow [1]. Additionally, the team used the project featuring Stochastic Optimization [2] to form data collection techniques using time stamps, but the modeling tactics used in this project required a graduate level understanding of modeling that the team did not possess.
Further, the study on Modular Nursing and Primary Nursing [3] highlighted the benefits of Modular Nursing in comparison to Primary Nursing. Modular nursing focuses on patient centered care and cost- effective use of available personnel. It divides workers into teams, led by one Registered Nurse (RN) who delegates tasks to members of the team based on ability and availability so that each member is ‘used’ at the level of which they are capable and expected to
20

perform. The study found that a shift from Primary to Modular Nursing in a chemotherapy unit improved utilization of nurses and kept the Patient Caring Index relatively constant as mean caring scores did not differ significantly between patients receiving primary care (mean = 35.9, SD = 5.4) and patients receiving modular care (mean = 36.2, SD = 5.3). The team found this information useful as they developed recommendations to address the issues caused by Primary Nursing.
Conclusions
Following the findings in the data, the team has identified five main conclusions. Firstly, on-time patients are experiencing longer wait times than patients who arrive late. These late arrivals offset the entire schedule for the day and are the main cause of the unbalanced patient-to-nurse utilization and long wait times. Therefore, a focal point of the recommendations will be to decrease or work around patient tardiness.
Secondly, the team has determined that provider appointments are independent of the infusion process, as patients who see providers beforehand are not arriving later to infusion than those who do not see providers. Therefore, the team will not address the provider scheduling when proposing recommendations.
Thirdly, there is no difference in wait times on different days of the week when the infusion center is open. In other words, the process is more or less the same Monday, Tuesday, and Thursday, so the team does not need to dive deeper into a specific day of the week.
Fourthly, patients are not waiting any longer or shorter based on the length of their infusion appointment. Therefore, the team will not be proposing recommendations that concern infusion appointment duration.
Lastly, the team has deduced that primary nursing and scheduling a patient to a specific nurse rather than a specific time is an inefficient allocation of resources. The use of primary nurses can contribute to both staff feeling overwhelmed and patients having longer wait times.
Recommendations
From the conclusions drawn from the data analysis, the team developed six recommendations to balance nurse utilization and reduce patient wait times.
Immediate Impact Recommendations
The team suggests implementing the following immediate impact recommendations as soon as possible, as there is significant evidence from the Findings and Conclusions that suggests
21

patient-to-nurse alignment and patient wait times will be improved:
● Shift from the Primary Nursing Model to Modular Nursing Model● Enforce a rule where patients need to call the Clinic if they are going to be more than 15
minutes late so that the Infusion Center can plan for these arrivals● Do not see patients before their scheduled time if they arrive early to their infusion
appointment as it will offset the schedule and result in worse nurse-to-patient alignment
Delayed Impact Recommendations
The team suggests implementing the delayed impact recommendations as a placeholder if the immediate impact recommendations cannot be implemented due to hospital policies or other constraints. These recommendations are a second alternative, as they will not have as immediate of an effect on patient-to-nurse alignment and patient wait times.
● Put up signs and send out emails to remind patients to arrive on time for their appointments
● Distribute surveys to the patients to get feedback on why they are not arriving on time to see if it is a fixable issue
● Increase communication between the Clinic and the Infusion Center so that the Infusion Center can be aware if there are any irregular circumstances or delays with a patient they are scheduled to see
Risks
There are several risks associated with implementing these recommendations in the Clinic. First, eliminating primary nursing could affect patient satisfaction. Treatments at the Clinic are extremely sensitive and any added comfort that the Clinic can provide is of great benefit. However, after interviewing the Clinic Manager and nurses, the team believes that the positive impact of having shorter wait times outweighs the negative effect of the patient seeing multiple nurses throughout treatment. Additionally, to mitigate this risk, the team suggests that the patients be made aware (through email or in-person by a MA) that all nurses are equally qualified to treat them.
Next, patients may forget to call the Clinic if they are running late. Therefore, to mitigate this risk, the team suggests that patients be constantly reminded of this new policy during the first few months of its implementation. These reminders could be given orally from the schedulers as patients schedule their next appointment.
Expected Impact
As a result of this project, the Pediatric Hematology and Oncology Clinic gained a quantified
22

understanding of patient arrival times to the clinic and Infusion Center. By documenting the current state of patient flow, the team expects the Peds Hem/Onc Clinic and Infusion Center employees to have a foundation of current operations. This foundation will provide an improved understanding for improvement opportunities in the future.
The employees understand the consequences that a late patient arrival has on remaining appointments and patients. In other words, they know how essential it is that patients come on-time. The proposed recommendations will decrease patient tardiness, which will decrease patient wait times and improve patient-to nurse alignment.
Another outcome of this project is the acknowledgement of the Primary Nursing Model. By recommending that the Infusion Center switch to the Modular Nursing Model, patients will see a nurse when he/she is available, which will again both decrease patient wait timed and better balance patient-to-nurse alignment.
References
[1] M. Bovbjerg, L. Meeks, K. Shehadeh, and K. Worley, “Analyzing Patient Flow and Process Waste in the General Thoracic Surgery Clinic,” Dept. Ind. Eng., Univ. Michigan, Ann Arbor, Apr. 22, 2014
[2] J. Castang, A. Cohn, B. Denton, C. Friese, A. Heiney, S. Potiris. “Stochastic Optimization to Reduce Wait Times in an Outpatient Infusion Center,” CHEPS, Univ. Michigan, Ann Arbor. Dec. 6, 2013.
[3] Carruth AK, Steele S, Moffett B, Rehmeyer T, Cooper C, Burroughs R. “The impact of primary and modular nursing delivery systems on perceptions of caring behavior,” School of Nursing, Southeastern Louisiana University, Hammond, LA. USA. Jan. 26 1999.
23