
I~~Oct77 I7 - apps.dtic.mil · 11 CLS specimen load-displacement curves 24 12 Increasing load test...
125
OF' AFMCL TR-77-1 63 *~~~kt T. RBrusa~i. T Chiu Lockheed-California Company I S Mstovy atria s Research Laboratory, Inc. ___'t enwoodl, Illinois 60425 L~ Lockheed1california Cffmiv- ADivision of Lockheed Corporation Burbank,4awifevria 91520 I~~Oct77 I7 Fnal epatin E 15 Jundi7 -5Ju$7 Approved for public ees:dsrbto niie Prepared for AIR FORCE MATERIALS LABORATORY AIR FORCE WRIGHT AERONAUTICAL LABORATORIES AIR FORCE SYSTEMS COMMAND WRIGHT-PATTERSON AIR FORCE BASE, OHIO 45433
Transcript of I~~Oct77 I7 - apps.dtic.mil · 11 CLS specimen load-displacement curves 24 12 Increasing load test...

OF'
AFMCL TR-77-1 63 *~~~kt
T. RBrusa~i. T Chiu Lockheed-California Company
I S Mstovy atria s Research Laboratory, Inc.___'t enwoodl, Illinois 60425
L~ Lockheed1california Cffmiv-ADivision of Lockheed Corporation
Burbank,4awifevria 91520
I~~Oct77 I7Fnal epatin E 15 Jundi7 -5Ju$7
Approved for public ees:dsrbto niie
Prepared for
AIR FORCE MATERIALS LABORATORYAIR FORCE WRIGHT AERONAUTICAL LABORATORIESAIR FORCE SYSTEMS COMMANDWRIGHT-PATTERSON AIR FORCE BASE, OHIO 45433

I NOTICE
When Government drawings, specificatio'is, or other data are used for any purpose
other than In connection with a definitely related Government procurement operation,
the United States Governmeiit thereby incurs no responsibility nor any obligation
whatsoever; and the fact that the government may have formulated, furnished, or In
any way supplied the said drawings, specifications, or other data, is not to be regarded
by implication or otherwise as in any manner licensing the holder or any other person
or corporation, or conveying any rights or permission to manufacture. use, or sell any
2 ~ patented Invention that may In any way be related thereto.
inis technical report has been reviewed and is approved for publication.
WILLIAM4 B. JONES 0,., PhD/ u 17.4. REINHART, JR, ChefProjct MnitoComposite & Fibrous Matis Branch
Nonmetallic Materials DivisionFOR THE COMMANDER
J. M. KELBLE, ChiefNonmetallic Materials Division
Copies of this report should not be returned unless return Is required by securit>
considerations, contractual obligations, or notice on a specific document.
AIR FORCE/56780/21 Mwrh 1978 -200

UNCISSIFIEDSECURITY CLASSIFICATION OF THIS PAGE ("hen Dat Enterid)
REPORT DOCUMENTATION PAGE BEFORE COMPLETING FORM
1. REPORT NUMBER j2
. GOVT ACCESSION NO 3. RECIPIENT'S CATALOG NUMBER
V AFML-TR-77-1634. TITLE (and Subtitle) 5. TYPE OF REPORT & PERIOD COVERED
A FRACTURE MECHANICS FOR STRUCTURAL ADHESIVE 15 June 1975 - 15 July 1977
BONDS - FINAL REPORT 6. PERFORMING ORG. REPORT NUMBER__-__LR 28196
7AUTNOR()T. R. Brussat and S. T. Chiu, (Lockheed- 8. CONTRACT ORGRANT NUMBER(.)
California Company) and S. Mostovoy (Materials F33615-75-C-5224Research Laboratory, Inc., Glenwood, Illinois60425)
9. PERFORMING ORGANIZATION NAME AND ADDRESS 10. PROG-,AM ELEMENT. PROJECT, TASKAREA & WORK UNIT NUMBERS
LOCKHEED-CALIFORNIA COMPANYBurbank, California 91520 486U0009
11. CONTROLLING OFFICE NAME AND ADDRZSS 12. REPORT DATE
Air Force Materials Laboratory/Code FY-1457 October 1977Air Force Systems Command 13. NUMBER OF PAGES
Wright-Patterson Air Force Base, Ohio 45433 12514. MONITORING AGENCY NA.E & ADORESS(If different from Controlling Office) IS. SECURITY CLASS (of this report)
UNCLASSIFIED
IS. OECL ASSI FICATION/DOWNGRADINGSCHEDULE
16. DISTRIBUTION STATEMENT (of this Report)
Approved for public release: distribution unlimited.
17. DISTRIBUTION STATEMENT (of the abafract entered in Block 20, it dile.ent from Report)
IS. SUPPLEMENTARY NOTES
19. KEY WORDS (Continue on revero* side if nocoaeazv and identify by block number)Fracture Mechanics Crack Propagation TestingAdhesive Bond Fatigue Testing Finite ElementTest Specimens Sustained Load Testing Flaw Growth MonitoringFracture Properties Analysis Ultrasonic ND!
Bonded Joints
20 ABST.ACT (Continue on re ores side If necossty aend identify by block number)
Tests and ar.alyseE were conducted to develop and demonstrate the fracturemecha:ics methodology to predict the growth of bondline flaws in adhesivelybonded primary aircraft structure. The development and use of a new baselinespecimen for testing bondline cracks in combined Modes I and II is described.Specimen development work on o':her adhesive fracture mechanics specimens in-cluding combined Modes I and III is described. vracture mechanics data forAF-55S adhesive are presented covering fatigue, sustained and monotonically
DD FORM 1473 EDITION OF I NOV 6 IS OaSOLETe1) : ,JAN 7/ UNCLASSIFIED
SECURITY CLASSIFICATION OF THIS PAGE (When Date Entered)

UNCLASSIFIED
'~~%.ECuRITY CLASSIFICATION OF THIS PAGE(Whenw Data LEnteted)
increasing loading, in laboratory air and hot water, in Pure Mode I, and mixedModes I and II.
Adhesive bondline crack growth data are presented from fatigue tests oflarger structural bonded single lap joints with initial bondline flaws. Tech-niques are demonstrated for growth monitoring both ultrasonically and by acompliance technique. A fracture mechanics analysis estimate of bondlinecrack growth rates in these tests is described, and the estimated rates arecompared to the actual monitored crack growth rates.
Based on this work an evaluation is made of fracture mechanics method--
ology as applied to bondline cracks in adhesively bonded aircraft structure.
-: I
N
UNCLASSIFIED ___
SECURITY CLASSIFICATION OF THIS PAGE(W7.n t a Entemd)N
At

1P
E-A
FOREWORD
This document describes the research conducted for the Air Force Materials
Laboratory (AFML) to fulfill the Phase I objectives of Contract F33615-75-C-
5224. The Structural Methods Group of Lockheed-California Company had primary
responsibility for the project. Materials Research Laboratory (MRL) was the .
major subcontractor and performed the experimental specimen development andbaseline testing.
The continuing support and cooperation of Dr. W. B. Jones, the responsible
AFML technical monitor, is appreciated. The technical involvement and consulta-
tion of j-. C. Novelli and his broad expertise in aircraft structural adhesive _
bonding has been an asset to the program. Dr. E. J. Ripling of ML and
E. K. Walker of Lockheed are acknowledged for their leadership and, in particular, _
for maintaining the spirit of cooperation between the two companies.
Some others at Lockheed who made significant contributions are hereby
acknowledged: A. L. Pulido for his workmanship in the bonding of test speci-
mens; D. E. Pettit for coordination of structural testing; W. G. Browne and
R. R. Sederman for guidance in program management and administration; R. J.
Van Ness, Mae Roosman, and Shirley Nash for their assistance in preparation of
reports; and J. C. Wordsworth and J. C. Ekvall of the Structural Methods Group
for their technical consultation and support.
In Phase II of this AFML contract, Lockheed and MRL are currently extend-
ing the results reported herein to FM-73, the adhesive selected for the PABST
program.
&V
°i

-
TABLE OF CONTENTS
SECTION PAGE
FOREWORD iii
LIST OF ILLUSTRATIONS vii
LIST OF TABLES x
I INTRODUCTION 1
II SPECIMEN DEVELOPMENT 5
1 ANALYSIS OF THE CRACKED LAP SHEAR (CLS) SPECIMEN 10
1.1 Total Strain Energy Release Rate 15
1.2 Besm Bending Solution 16
1.3 Estimation of I 18
2 TEST METHODS FOR THE CLS SPECIMEN 21
2.1 Fatigue Test Method 21
2.2 Side Notching for Increasing-Load Testing 23
2.3 Special Test Methods for Environmental Tests 23
3 DEVELOPIENT WORK ON OTHER SPECIMENS 30
3.1 The Width-Tapered Beam (WTB) Specimen 30
3.2 Diagonal Loading of the CDCB Specimen 33
3.3 Beam and Column (BC) Specimen 35
3.4 The Mode III Test Specimen 40
III BASELINE TESTING 47
1 INCREASING LOAD TESTS 47
1.1 Mode I (- )L Tests 47
1.2 Mixed Mode I and Mode II Tests 47
2 SUSTAINED LOAD STRESS CORROSION CRACKING TESTS 53
2.1 Mode I SCC Testing 53F 2.2 Mixed Mode SCC Testing 55
v
_ __L -

TABLE OF CONTENTS (Continued)
SECTION PAGE
3 FATIGUE TESTS 57
3.1 Mode I Testing in Laboratory Air at 3 Hz 58
3.2 Mixed-Mode Testing in Laboratory Air at 3 Hz 60
3.3 Elevated Temperature Fatigue Testing 63
3.4 High Frequency Testing 633.5 Discussion of Baseline Fatigue Test Results 66
IV METHODOLOGY DEMONSTRATION 71
1 TEST PROGRAM 72
1.1 Thick-Adherend Single Lap Joint Tests 72
1.1.1 Specimen Configuration and Fabrication 72
1.1.2 Crack Growth Monitoring 74
1.2 Thin-Adherend Single Lap Joint Tests 75
2 ANALYSIS OF THE SINGLE LAP JOINT SPECIMENS 82
2.1 Thick-Adherend Specimens 82
2.2 Thin-Adherend Specimens 88
3 TEST RESULTS AND DISCUSSIONS 94
3.1 Thick-Adherend Specimens 94
3.2 Thin-Adherend Specimens 97
V CONCLUSIONS AND RECOMMENDATIONS 111
REFERENCES 117
vi

ILIST OF ILLUSTRATIONS
J Figure Page
1 Contoured double-cantilever beam (CDCB) specimen for 6
pure mode i testing
2 Cracked lap shear specimen (CLS) for combined Mode I 7
and mode II loading
3 Width tapered beam (WTB) specimen for mode I testing 9
4 Combined 9I - I test grips for CDCB specimen 10
5 Beam and column (BC) specimen for mixed modes I, II, 11and III testing
6 MZKG specimen for mode III testing 12 __
7 Mode f €cr base.ne specimens 138 CLS specimen and its deformed shape 14
9 Symmetric and antisymmetric component problems for the 19
cracked lap shear specimen in bending
10 Three views of specimen CLS-i 22
24411 CLS specimen load-displacement curves 24
12 Increasing load test record for side-notched specimen CLS-I 25
13 Load-displacement record for specimen CLS-3 28
14 Width-tapered beam (WTB) specimen shown with gripping bolts 33
15 Load-displacement record for width-tapered beam specimen 34 M(WTB-I)
16 Single actuator test assembly for two-axis loading of 36BC specimens
17 Close-up view of mode I - mode II test frame 37
18 MZKG specimen with M =1.89 mm (48 inch - ) formode II testing 410
19 Cross section of the NZKG specimen 42
20 Overlap length, bN, inches 44
21 Fracture surface photographs of MZKG specimens 45
22 Comparison of mode III fatigue crack growth curves for 46two overlap dimensions
vii

LIST OF ILLUSTRATIONS (Continued)
Figure Page -_
23 Fracture surface of specimen CLS-1 51
24 Magnified fracture surface photographs for specimen 52CLS-I
25 Pure mode I sustained-load crack grouth 54
26 Pure mode ! SCC Data in 3 27CK - 333°K (130°F - 1400F) Water 56
27 Mode I fatigue crack growth in room temperature air 59 _
28 Fatigue crack growth data from mixed-mode CLS specimens 6229 CLS fatigue data using Ageff to account for mode Il b4 _
30 Mode I fatigue crack growth rate data, RT air and .53330K (140°F) water immersion ___
31 Effect of 30 Hz frequency on crack growth in room 67temperature airA
32 Structural single lap joint specimen with thick 735adherends
33 Compliance of SLJ specimen as computed by finite 76element analyses
344 Single lap joint (SLJ) specimen with thin adherends 77
35 Test setup for thin-adherend SLJ specimens in hot water 7S
36 Environmental box and displacement gage 8C
37 Compliance of thin-adherend SLJ specimen as computed 8]by finite element method
38 Finite element model of the profile section 83of the test specimen
39 Distributions of bending moment in the splice plate 85
__ 40 Calculated strain energy release rates at various 8fbondline crack lengths
41 Finite length correction factor for a split beam 87subjected to uniform bending
42 Bending moment distributions for thin-adherend 91SLJ specimen W
43 Estimated crack growth rates at two applied stress levels 9-
44 Total lives of SLJ specimens with or without initial 95 Mbondline flaws
viii

rJ
LIST OF ILLUSTRATIONS (Continued)
Figure Page 145 Bondline crack growth histories 96
46 Crack growth rate by ultrasonic and compliance 98measurements
47 Estimated and empirical crack growth rates 99 I48 Final damage configt ration, specimen A. No initial flaw 102
49 Final damage configuration, specimen B. No initial flaw 103
50 Final damage configuration, specimen C. Initial flaw 134a 7.6 mm (0.3 in.) deep across-the-width flaw I
51 Final damage configuration, specimen D. Initial flaw is 105a 7.6 mm (0.3 in) deep across-the-width flaw
52 Final damage configuration, specimen E. Initial flaw is 196a 12.7 mm (0.5 in) wide longitudinal flaw at the center line
53 Final damage configuration, specimen F. Initial flaw is 107a 12.7 mm (0.5 in) wide longitudinal flaw at the center line
54 Predicted and experimental bondline crack growth 198
ix

LIST OF TABLES
Table Page
1 Bondline Thicknesses of CDCB Specimens 48
2c Values for 36 CDCB Specimens of AF-55S Adhesive 49
3 CLS Specimen Dimensions 614 Conservative Fatigue Threshold Values by Extrapolation 69
5 Estimated Effective Strain Energy Release Rates, and e9
Crack Growth Rates, Thick Adherend SLJ Specimen
6 Estimated Effective Strain Energy Release Rates and 92Crack Growth Rates, Thin Adherend SLJ Specimens
7 Test Lives, Thin-Adherend Single-Lap Joint 100
AI
x

SECTION i
A_ INTODUCTION
Adhesive bonding has been used as a joining technique of secondary
aircraft structural details for seve::al decades. It offers the potential
advantages of improved fatigue life, improved fail-safe capability, and reduced
manufacturing costs (References 1, 2). With the development of improved ad-
hesive systems, adherend surface treatment methods, and coating and sealing
techniques, adhesive bonding is now being considered as an alternative to
mechanical fasteners in primary aircraft structure. The United States Air
Q Force is sponscring an integrated series of programs under the general title
of Primary Adhesively Bonded Structure Technology (PABST) to study the technical
and economic feasibility of primary adhesively bonded structure.
The Air Force aircraft structural integrity program document MEI-STD-1530A
requires that the growth of initial flaws be considered in the design of primary
structure. MIL-STD-1530A specifies that dam"age tolerance design of mechanically
fastened metallic structure must meet the requirements of USAF Specification
MIL-A-83444, "Damage Tolerance Design Require-ments." However, the necessary
fracture m-chanics technology has not been developed to apply the philosophy
and requirements of MIL-A-83444 to bondline cracks (or flaws) in adhesivelybonded structure.
0 In order to apply fracture mechanics technology to predict the growth of
bondline cracks, it is important to understand the three crack tip loaetng modes.
The local stresses near the tip of any crack consist of three independent Com-
ponents, Modes I, II, and III. The Mode I or opening mode stresses result
from tensile loading normal to the crack plane, tending to separate the crack
surraces. The Mode I or sliding-mode stresses result from shear loading
7 1
_ __ __ _ __

perpendicular to the leading edge of the crack. The Mode III or tearing-mode
stresses result from shear loading parallel to the leading edge of the crack.
The strain energy release rate, Q, for a cracked body is defined as the
change in the strain energy of the body per unit of crack extension. If W is
the total strain energy and A is the fracture surface area of the extending
crack, then
=aWaA
The total strain energy release rate consists of the sum of the components
due to Mode I, Mode II, and Mode III loading; that is
= I + '011 + VInI(2
A substantial amount of fracture mechanics testing of structural adhesives
had preceded the work reported herein (e.g., References 3 - 7). This testing
was almost exclusively performed in Pure Mode I using double cantilever beam-
type specimens.
Unlike cracks in homogeneous metals, which tend to align themselves in a
direction normal to the maximum principal tension stress and propagate subse-
quently in Pure Mode I, adhesive bondline cracks are constrained in their orien-
tation to follow the bondline direction. Thus a bondline crack can (and in
large area bonds in fuselage structure it often will) have a high percentage
of Mode II or III loading, compared to Mode I.
The preponderance of shear in the bondline of adhesive bonded structure
demands that simple mixed mode test specimens containing bondline cracks be
developed for damage tolerance testing. Ideally, these specimens should simu-
late bonded structure, the cracks should be measurable, and a fracture mechanics
analysis should be developed to quantitatively relate the specimen to the
structure.
Using such specimens, prediction methodology should then be developed to
predict the grcwth of bondline flaws under cyclic loading over the full range
of mode-mix that could occur in bonded primary aircraft structure. It should
21
- N

be assured that the fundamental aspects of this methodology are applicable for
any realizable service environment.
As part of the overall PABST effort, the research program reported herein
was conducted to develop and demonstrate the fracture mechanics methodology
needed to predict the growth of bondline flaws in adhesively bonded primary
aircraft structure. In this research, new baseline fracture mechanics test
specimens were developed for Modes I, II, III and mixed-mode loading as summa-
rized in Sention II. Then baseline fracture mechanics data were obtained on
these specimens and on the Mode I CDCB specimen, as reported in Section III.
Finally, a methodology for crack growth prediction was demonstrated on 12 tests
of structural joints with initial bondline flaws, using baseline data and analyti-
cal estimates of the strain energy release rate, as presented in Section IV.
All tests in this program were done using bare 7075-T6 Aluminum sheet,
4 plate and extrusion. Surface treatment was accomplished using a Phosphnric
Acid Anodize process equivalent to Boeing's Specification 5555. The primer
used was BR-127A, which is equivalent to BR-127 but easier to apply. The ad-
hesive film was AF-55S ("S" meaning a scrim carrier was present). Unless
otherwise stated the cure conditions were 389 -400 K (2400-260°F) and
276-345 kPa (40-50 psi) pressure.
Although regarded as an initial step, this program provides much of the
technology required to assess the influence of pre-existent bondline flaws
which may occur in adhesively bonded aluminum fuselage structure. It is shown
that fracture mechanics methodology does provide a practical means for pre-
dicting flaw growth in adhesive bondlines.
WN

SECTION II
SPECIMEN DEVELOPMENT
Because prior fracture mechanics testing had been limited to testing in
Pure Mode I, the first major task in this program was to design and develop
new baseline specimens and loading fixtures for cyclic and static testing of
bondline cracks under substantially shear (Modes II and III) loading. For each
specimen it had to be determined whether or not:
• The crack could be made to propagate
a Crack growth could be measured and monitored
0 ' and could be calculated
The effort involved specimen design, mathematical stress analysis, and the Idesign of special loading fixtures, antibuckling supports, and load and crack-
length monitoring setups.
In the development of new specimens, much was learned from the example of
the Mode I contoured double-cantilever beam (CDCB) specimen, which had been a
successful fracture mechanics specimen for years. The loading of this specimen
(Figure 1) produces bending moments which tend to split the beams apart along
the bondline. The beams are contoured such that the specimen compliance, C,
increases linearly with increasing crack length (8C/8A is constant). Since
p2 a= P d(3)1 2 A
the strain energy release rate of the CDCB specimen is crack-length independent,
varying only with the square of the applied load.
There are several advantages to this crack-length independence of I -A
First, the value of 'I can be obtained without knowing the crack length.
-4'5

EACH ADHERENOIT CONTOURED TO
1 1 (90 in. 1)
CRACK
h \ADHESIVE
Figure 1. Contoured double-can'.tiever b3eau. (CIJCB) --ecir-enfor pure mode I testing
t
Secondly, because the compliance varies linearly %ith the xliagk ±th. ihe
crack length is easily estimated from the measuved digplacement at t'toad
point. This eliminates the necessity for visua? mortorng of ::he crack. whicin
is difficult and ambiguous for adhesives, or far some other more exotic, ex-
pensive crack-length monitoring method. -In addition to the crack-length independince of ?f, a goal In :b"- sp'tciti-e.
development effort was that the specimens should, if posaibl--- siul-a-1c struc-
ture in the method of loading. Also, since a large percentage of t*ie bonds ied
in fuselage structure consists of large area bonded sheet, anthitr goal w~s that
the specimens could be easily machined from large-area bondce sheer or plate,.
thus optimizing the simulation of bondline thickness aid bond qu~illty. it W~AS
these goals that led to the development of the long crackedTh shear (CLJ)
specimen shown in Figure 2. The CLS specimen consists Qf a lo.-g riece bondcd to
a shorter piece. Tension is applied through pin loading to 'nth :)ee an oii_
end and to just the longer piece on the opposite end. Because ot its largic

IFP
A
PRECRACK MADE BYMODE I LOADING ALONE
ADIIERENDS
ADHESiVE
-- a
P
Figure 2. Cracked lap shear specimen (CL.) for cor~binedmode I and mode 11 loading 4
7
! _--

length-to-thickness ratio the CLS specimen is a constant-strain-energy-release-
rate specimen. The loading is applied parallel to the bondline so it has a
substantial Mode II loading component. In addition, a significant Mode I com-
ponent is induced by the eccentricity at the crack tip. The result is a mode4 mix fairly typical of bonded aircraft structure.
The CLS and CDCB speciM=LLZ turned out to be the two primary baseline
specimens used in this research program. A great deal of additional work was
done on developing several other specimens.
A Pure Mode I specimen, the width-tapered beam (WTB) specimen shown in
Figure 3, was developed late in the program primarily to overcome the problem
of maintaining proper adhesive layer thickness encountered in the fabrication
of the CDCB specimen. Like the CDCB specimen, the WTB specimen consists of two
cantilever beams, contoured to vary the bending stiffness so as to provide a
crack-length independent value of I" In this specimen however, the beam height
is constant and the width is tapered linearly. Thus it is possible to bond two
large plates face to face and machine the specimens from the bonaed plate, the
same method that was used for the CLS specimens.
A special fixture (Fiure 4) was designed and used to apply an oblique
load to the CDCB specimen, inducing a small component (2 to 5 percent) of
Mode II loading in addition to the Mode I.
The design concept for the beam-and-column (BC) specimen is shown in
Figure 5. In concept, the specimen can be tested in any combination of
Modes I, II and III. The vertical forces P, aliqned with the bondline, induce
pure I The concentrated moments M, applied independently of P, induce a
selected combination of and " All three components of are crack-
length independent.
The modified zero K-gradient (MZKG) specimen for Mode III testing is
shown in Figure 6. In this specimen as in the CDCB, the contour leads to a
constant strain energy release rate.
The triangular area in Figure 7 represents all the possible combinations
of loading in Modes I, II and III. All of the baseline specimens considered
8

J BONDLINE i
_ ---
-I4 1
Figure 3. Width tapered beam (WTB) specimen
~~for mode I testing
:-- N
~in this program are either Pure Mode specimens, covering corner points on the
~diagram, or combinations of 2 modes, covering regions on the boundaries of~this diagram as shown. In concept, the BC specimen was supposed to have the
~capability to test combinations of all three modes covering the interior of the
i triangular region, but development of the BC specimen never successfully pro-
gressed beyond combinations of Modes I and II.
Subsection I presents the mathematical analyses for the CLS specimen, and
- = Subsection 2 discusses the test equipment and procedures that were developed
for the CLS specimen. The development of the WTB, diagonally-loaded CDCB,
ME

r ----- _____
II
II, 4 I
CDCBL SPECIMEN
44
Figure 4. Combined - test grips for CDCB specimen
BC, and MZKG specimens (as far as it progressed in each case) is discussed in
Subsection 3.
d 1. ANALYSIS OF THE CRACKED LAP SHEAR (CLS) SPECIMEN
M Major accomplishments in this research program have been the specimen
development; fatigue, environmental sustained load, and increasing load test-
ing; crack-growth monitoring; and mathematical stress analysis of the cracked
lap shear (CLS) specimen. This specimen is extremely important to this pro-
gram because, by its resemblance to typical bonded structure, the baseline
data that it provides is most directly applicable to predicting the growth of
bondline flaws in adhesively bonded structure. Also, since loading of the
CLS is predominantly Mode II, predictions for structure over a wide range of
combined Modes I and II can be obtained by simple interpolation between
results from the CLS specimen and a Pure Mode I specimen like the CDCB or WTB.
10
L

k\I" ITOP VIEWIN0 SECTION A-A
-A 0IiLEFT GRIPNOT SHOWNIN FRONT VIEW
tP
P
IMA A-
CRACK TIP - -a-
I ADHEREND
ADHESIVE
Figure 5. Beam and column (BC) specimen for mixed modes I, II, and III testing
11W

SEC. AA
4BV
LUAHit_
__ _ __ _
4Ia\
CRACK ADHESIVE BOND
1

100% MODE III
MZKG SPECIMEN
60%%II 11
U1u
Is401p
CDCB2% I
U SPECIMEN
MODEI 50MODE 11
BCL- SPECIMEN
Figure 7. Mode mix for baseline specimens
13
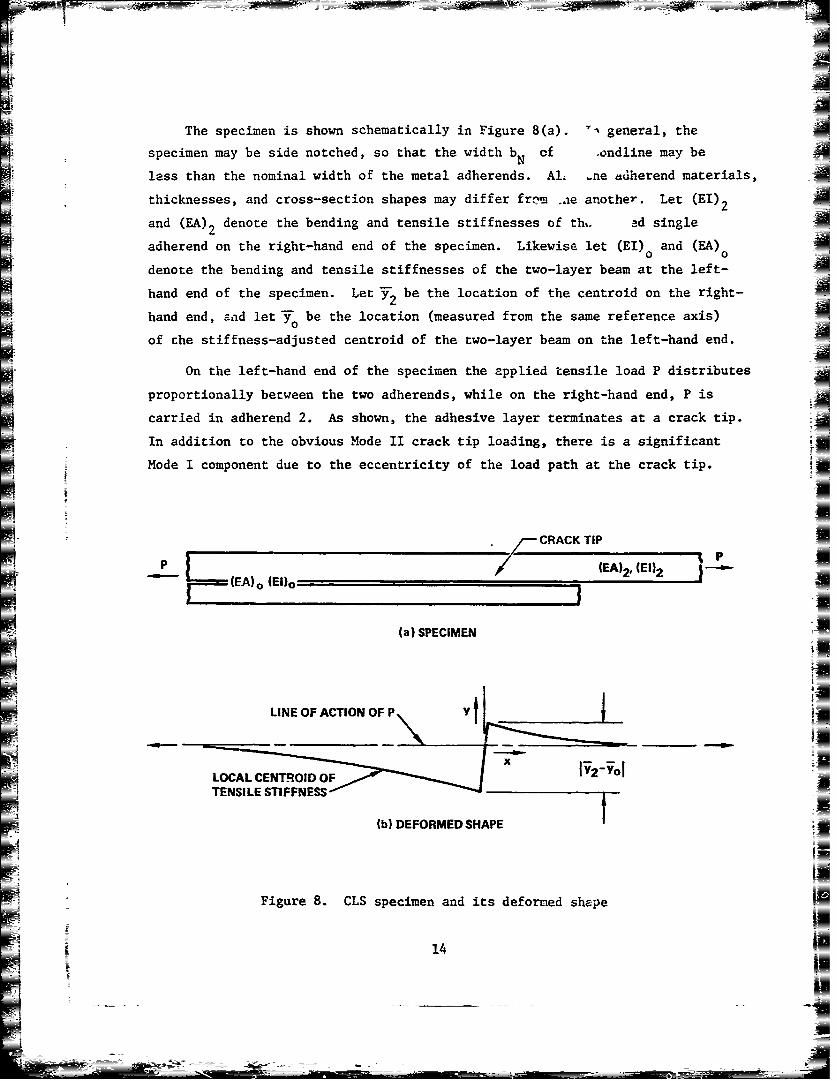
The specimen is shown schematically in Figure 8(a). " general, the
specimen may be side notched, so that the width b cf .ondline may beN
less than the nominal width of the metal adherends. Al ane adherend materials,
thicknesses, and cross-section shapes may differ frnm .ae another. Let (El)2
and (EA)2 denote the bending and tensile stiffnesses of th,. ad single
adherend on the right-hand end of the specimen. Likewise let (El) and (EA)0
denote the bending and tensile stiffnesses of the two-layer beam at the left-
hand end of the specimen. Let Y2 be the location of the centroid on the right-
hand end, and let 3T be the location (measured from the same reference axis)0
of che stiffness-adjusted centroid of the two-layer beam on the left-hand end.
On the left-hand end of the specimen the applied tensile load P distributes
proportionally between the two adherends, while on the right-hand end, P is
carried in adherend 2. As shown, the adhesive layer terminates at a crack tip.
In addition to the obvious Mode II crack tip loading, there is a significant
Mode I component due to the eccentricity of the load path at the crack tip.
CRACK TIPS P
(EA) o (EI)o )E
(a) SPECIMEN
ITE IE TFESS OFP
(b) DEFORMED SHAPE
A
Figure 8. CLS specimen and its deformed shape
~14

iI
The analysis of the CLS specimen consisted of 3 parts. First, linear
elasticity was utilized to develop an exact expression for the change in total
strain energy per unit crack extension, which by definition is the total strain
energy release rate, = + " Secondly, the induced bending moments
were calculated by beam theory. Finally, the bending moments were used to
estimate I for the CLS specimen in tension, using an exact strain energy
release rate analysis of the same specimen in pure bending.
1.1 Total Strain Energy Release Rate
When an increment of crack extension ba occurs in the CLS specimen, it
causes a 'change 6W in the total strain energy of the specimen. From Equation (1)
Jim W' (4)
6a-0\Na
Consider a coordinate system fixed with respect to the crack tip. With
respect to this coordinate system, nothing changes in the neighborhood of the
crack tip when the crack grows. However, far to the left of the crack tip lies
a uniformly strained volume of length 6a that disappears when the crack
elongates, and its strain energy is lost. Far to the right lies a uniformly
strained volume of material of length 6a that is added when the crack elongates,
adding strain energy to the system. The strain energy change due to the crack
growth increment 6a is the difference between the strain energies within these -
two uniformly strained volumetric elements. Since the adhesive layer is very =
thin and compliant, its contribution to the strain energy can be neglected.
Computing 6W and substituting the result into Equation (4) :eads to
2J46 (5)
2 bN(EA) L (EA)o JN5
15N
A}

1.2 Beam Bending Solution
Figure 8(b) shows schematically the way the cantroidal axis of the CLS
specimen deforms under the applied tensile load P. At the crack tip there is
a finite change in the location of the centroidal axis. The magnitude of this
step change is 32 As a result, the local centroid at any location x is
offset a distance y(x) from the line of action of the force P. With this offset
there is, in addition to the uniform tension field, a local bending -oment
M(x), given by
M(x) = P y(x) (6)
By beam theory the bending moment is related to the second derivative of
the deflection. This leads to a pair of second order differential equations
for the deflection of the beam. y(x), as follows:
y - y(x) 0, x>0 (7)
y"(x) - x y(x) = 0, x<O (8)0
where
= /pI(Ei 2 (9)
= ,/P(EI) (10)
16

__ -_ . . .-- - - . . .. .. - ---- ---- - -_ --- -i_ __--.=------- - -~- ......
The solution to Equations (7) and (8) must satisfy the following side conditions:
lim [y(x)] = lim [y'(x)] =
xl- O x 1-(1)
- - a,b,clim [Y(xIl) - Y(-lxl)] 2 - 0
lim [y' (Ixl) - Y'(-Ixl)] = 0
lxi- 0
The following solution satisfies (7) (8), and (11):
xI
y(x) - X-o (12)y + e ,x >. 0 (12)2o0 a ,b
-(Y2 -yo ) X 2 N 0X
y(x) = 2 +0o e ,x<O
The separation of the two adherends at a distance (a) to the right of the
crack tip is monitored during testing as a measurement of crack length, and is
given by
A(a) = y(a) - 1ir [ay' (Ixl) + y(Ix)] (13)
jxj- 0
17

Using Equation (12a) and its derivative, the following displacement
solution is obtained from Equation (13):
Na(2 Yo)o (14)
Aa) 0 \e + k a- (14)X22
The limiting value of bending moment at the crack tip, Mo, is used to
estimate I as discussed subsequently. From Equations (8) and (12),
(Y2 -Yo ) XM = lim [y(IxI)] P X (15)
Ix- +
1.3 Estimation of I'
An approximate solution for I in the CLS specimen under tension loading
was sought by consideration of the related problem of the CLS specimen subjected
to a uniform bending moment M, Figure 9(a). The total strain energy release
rate for this loading condition can be computed in a manner parallel to that
used to obtain Equation (5) for the tension loading case. This leads to the
following result for the pure bending case:
__2 (EI)2
2b-I (El) (62bN (E) 2 01
Since the loading and geometry are not symmetric about the crack plane,
the CLS specimen in pure bending is not a Pure Mode I case. However, the
special case of adherends of the same material and cross section can be decomposed
into symmetric and antisymmetric parts (Figure 9(b) and 9(c)), each of which can
be solved by the same virtual strain energy procedure. The I and solutions
are
18

7 __ __ti (El)i
-- (EI) 0 ......t 2 (El) 2
(a) THE CRACKED LAP SHEAR SPECIMENSUBJECTED TO BENDING
M/2
M/2
(b) THE SYMMETRIC PROBLEM
(c) THE ANTI SYMMETRIC PROBLEM
Figure 9. Symmetric and antisymmetric component problemsfor the cracked lap shear specimen in bending
19

M2
I =I 4b (EI)2
(17)3M2 a,b
1II 16b N (gl) 2
In other words, the ratio 4 /1?, for this special case is 4/7.
In lieu of further exact analysis, two approximations are made in order
to es_imate '- for a CLS specimen loaded in tension:
* The'-4 value due to the induced bending moment at the crack tip isassumed to be equivalent to 4 I due to an equal uniform bending moment,applied as in Figure 9(a). I
* For pure bending of a CLS specimen the / 4 ratio of 4/7, exact for
equal thickness aluminum adherends, is assumed to be a good approxi- -'
mation when the thicknesses are not equal.
Under these assumptions, the -4 value for the tension-loaded CLS specimen
is approximated as
2M2 ro- 7bi (EI) 2 3
7(E) EI)0 (18)
where M is given in Equation (15). Thereby, for a given specimen geometry,41 is expressed as proportional to the square of the load:
II
LS (19)
where standard normalization factors . and P are defined as Af0 0
20.1731 kJ/m (1.00 lb/in.) (20) Jg
20

P= 4.4482 kN (1.00 kip) (21)0
and the proportionality constant CLS is give, by
CLS 27b(EI) (/EI) 1 (22)
2 TEST METHODS FOR THE CLS SPECIMEN
The CLS specimen was designed and fabricated; test methods and crack
monitoring procedures were developed; and tests were attempced for fatigue
loading, increasing loading, and sustained loading in hot water. All the
major goals of this specimen development effort were met, as described in the
following subsections.
2.1 Fatigue Test Method
The first CLS specimen successfully fatigue tested was CLS-l, which had
equal adherend thicknesses of 12.7 mm (0.50 in.). Each adherend was itself I
laminated from available 7075-T6 aluminum sheet and plate stock, 4.8 mm
(0.19 in.) and 7.9 mm (0.31 in.) in thickness. Three views of this specimen
are shown in Figure 10.
The strain energy release rate solution for Specimen CLS-1 prior to side __
notching can be obtained from the equations of subsection 1. From Equations (18) pa
and (5), /jll = 0.205. From Equation (22), CLS = 0.0102.
The crack-length independence of the CLS specimen is exact only if the
length-to-thickness ratio is infinite. The use of the double universal end
grips instead of fixed end grips is to maximize the effective length of the il
specimen. The total length of CLS specimens used in this work was 1.17 m
(46 in.), the maximum panel length that can be accommodated by the dip tanks
used in the surface preparation prior to bonding.
Fatigue loading was applied at 3 Hz to a maximum of 89 kN (20 kips).
This cyclic rate was selected on the basis of earlier MRL work which indicated
21

1 (a) In Fatigue Test Frame
AT
I~~ t__
A (b) With Double Universal
End Grips
(c) Crack-Tip Area, Extensometer
Figure 10. Three views of specimen CLS-1
22

major effects of cyclic frequency on da/dN for structural adhesive systems
at rates above 3 Hz.
Crack growth was followed using compliance as obtained from an x-y
recorder which recorded the applied tensile load vs. the openin- 'isplacement
obtained from a noncontacting type extensometer located 14.5 mm (0.57 in.)
from the lap-sear step. The extensometer was bolted to the shorter of the
two strips and read the distance observed from the longer of the strips.
Crack length was also followed visually by marking a series of equally
spaced lines perpendicular to and crossing the crack line and observing, at 5x,
the shear displacement of the lines. The crack could be found quite easily by
locating the position where, during 0.5 Hz fatigue, one marked line appeared to
have shear displacement at the bond plane while a succeeding line did not.
A series of observations of crack length, extensometer displacement, and
load were made. Equation (14) of Section 1.2 was used to construct a series
of theoretical load-displacement curves for CLS-I for different crack lengths,
shown as solid lines in Figure 11. At visually observed crack lengths of 180,
184, and 197 mm (7.08, 7.23 and 7.74 in.), load-displacement records were made
and traced onto Figure 11. The shapes of these experimental curves match the
theoretical shapes. Note that the theory suggests slightly longer crack
lengths than visually observed; approximately 187, 193, and 201 mm (7.35,
7.60 and 7.90 in.). The errors, respectively, are 3.7%, 4.9% and 2.0%.
2.2 Side Notching for Increasing-Load Testing
Prior to fatigue testing an attempt was made to propagate the crack in
Specimen CLS-1 by gradual application of a monotonically-increasing load of
89 kN (20 kip), but no crack extension occurred. No higher load could be
used because the maximum adherend stress (tension plus induced bending) was
very near to the tensile yield stress of the 7075-T6 aluminum adherends. At Ithis load the applied total ' was 3.43 kN/m2 (19.6 lb/in) and the (i component
was 0.72 kN/r2 (4.09 lb/in).
Su.jequent to fatigue testing, CLS-l was side notched as shomn in the
sketch in Figure 12, and crack extension under an increasing load was obtained.
Side notching reduced the width of the adhesive layer by 81.5 percent while
23

N)' 'VOI IVIXV
0 0 0
U-
LU00
0--
igeat-4I
XU - 0
CAD - to
NC W
C4
-I
al

dp~ 'ciVo-l 1jVjXV
co to 4
0 t
aq u
a
Sc. 4 40 4 1
CZ R. 0
oj V
o Go
0 L 0
ob
ND
oaao 0llxaM
25

leaving the metal substantially intact. This greatly increased the ratio of -
adhesive stress to adherend stress, so that crack propagation in the bondline
could precede metal yielding. For this configuration, 4i/&= 0.257; CLS 0.0753. -?
The load-displacement record (Figure 12), obtained for slow crack extension
from the prior fatigue crack, is described as follows. Initially, at a calcu-
lated crack length of 76 mm (3.0 in.), the record follows the load-deformation
curve described by Equation (14). It began to deviate from the theoretical2curve (indicating crack extension) at P = O k (13.5 kip) and I = 2.40 kJ/m
(13.7 lb/in), but the load continued to rise. At P = 73.4 kN (16.5 kip) and
qI = 3.59 kJ/m (20.5 lb/in) the specimen was unloaded and examined for evidence
of large scale shear motion during unloading which was not apparent. Calculated
crack length was 91 mm (3.6 in.).
The specimen was reloaded and cracking began again at P = 73.4 kN
(16.5 kip) andlI = 3.59 kJ/m2 (20.5 lb/in). The load continued to rise during
crack extension until a plateau was reached at P = 85.4 kN (19.2 kip) andm2 M= 4.86 J/m (27.75 lb/in). The load remained almost constant for 25 mm
L2(1 in.) of growth, rising gradually to P = 89 kN (20 kip) and = 5.27 kJ/m2
(20.1 lb/in). The unloading curve followed the thoretical curve for a crack
length of a = 138 mm (5.4 in.). Upon reloading to P = 80 kN (18 kip) and
4.2 7 kJm (24.4 lb/in) crack growth began again, and the load becamekJ/m 2
constant at P = 86.7 kN (19.5 kip) and I = 5.01 kJ/m2 (28.6 lb/in) untilI
unloading at a 185 mm (7.3 in.).
Further increasing-load testing was done on Specimen CLS-3, which had
adherend thicknesses tI and t2 , respectively, of 19.4 and 9.7 mm (0.762 and
0.380 in.). After fatigue data were obtained, CLS-3 was side notched to the
configuration sketched in Figure 13, with all of the metal removed from the
thicker adherend. For side-notched Specimen CLS-3, 0.241; C 0.157.~ 0.241; LS =017
After side notching but before the increasing-load testing, additional
fatigue data were obtained at R 0.1 to verify that side notching does not
affect da/dN at a specified &I. value. These fatigue data are shown in Fig-
ure 28 and 29 of Section III as data points containing an X. The three data
points obtained are roughly within the scatterband of the other CLS specimens.
26

Specimen CLS-3 was then increasing-load tested to complete fracture The
total load, P, versus the Mode I displacement, A,, is shown in Figure 13. The
test was begun at a compliance-measured crack length of 68 mm (2.7 in.). The Ifirst indication of gross crack extension occurred where the curve began to
bend over at P 43.1 kN (9.7 kip) and i= 2.59 kJ/m2 (14.8 lb/in). However,
the load continued to rise to a maximum value of P 46.7 kN (10.5 kip) and I3.04 kJ/m2 (17.3 lb/in). The crack extended at approximately constant
load for about 25 mm (I in.), then dropped to a plateau value of P = 44.5 kN
(10.5 kip) and I = 2.76 kJ/m2 (15.7 lb/in) with additional crack extension.
The specimen was then unloaded and reloaded. While some deviation of the
P-A curve occurred at low loads, the curve shapes at higher loads corresponded
closely to the theoretical curves for a = 138 mm (5.42 in) for unloading and
148 mm (5.84 in) for loading. The load reached a peak value of P = 43.6 kN2
(9.8 kip) and 9 = 2.65 k/m 2 (15.1 lb/in). Further extension occurred at
a nearly constant load of P 41.8 MN (9.4 kip) and ' = 2.43 kJ/m (13.9 lb/in).
The specimen was then unloaded at a crack length of 288 mm (11.3 in.) and cut __
to expose the fracture surface.
For the 68 mm (2.7 in.) crack the experimental load-displacement curve
was not the same shape as the theoretical curve. This crack length was esti-
mated from the curve using an average slope. For the longer cracks the upper
end of the load displacement curve matched theoretical shapes perfectly for
the crack size selected, except near the load peak where crack extension
probably occurred. However, the unloading curve for a = 138 mm (5.4 inch) and
the loading curve for a = 148 mm (5.8 in.) deviated from the theoretical shape I
near zero load.
What is temarkable about this test result is the constancy of ' overc
220 mm (8.6 in.) of crack length.
The equilibrium value of 97 (or icg).for CLS-3 does not match that obtained
-1. -1wa-bot . k_ on CLS-I The average value of VI. for CLS- wa bu . Jm 28.5 ib/in)
compared to about 2.7 kJ/m2 (15.4 lb/in) for CLS-3.
27
NI

OPENING DISPLACEMENT A, mm12 3 4 5 6
12
a =67.5 mm a 138 / a 148 mm/ (2.7 in.) (5A2n!) (5.84 in.) 50
10 - '
40
-~ 8
6 a 288 mm
I4-THEORETICAL LOAD- _xDISPLACEMENT CURVE -h
20~4
4 19.73.2 -(0.380)
v C =0.157 (0.125)
=0.24 29.1 1
//0.076 (0.127)/ (0.003)H
LAYER (1.0025)
0.4 0.8 0.12 0.16 0.20 0.24
OPENING DISPLACEMENT A, in.
Figure 13. Lead-displacement record for specimen CLS-3
28

2.3 Special Test Methods for Environmental Tests
Fixturing and apparatus were prepared for elevated temperature exposure
in water for both fatigue and stress corrosion cracking (SCC) testing. The
fatigue test fixturing consisted essentially of modification to the CLS loading
train to permit constant temperature water to circulate around the specimen.
The normal loading train, assembled as shown in Figure 10(a), consisted of a
double universal at both ends of the specimen, the outer univeisal couplings
ending in a threaded rod for connection to the test machine. For fatigue
testing the test machine was a closed-loop servo-hydraulic type; however,
for SCC testing an enlarged opening creep-rupture test machine was used. This
enlarged opening machine was needed because the total length of the specimen
with the universals was more than 1.5 m (5 ft). The need for the water bath
apparatus required that the upper part of the lower universal be modified to
accept and retain a water bath tube. This grip was remanufactured from 304 AA
stainless steel, and "0" rings were used to seal a 76 mm (3 in.) inside diameter
PMMA tube around the specimen. Ports for water entry were provided in the grip
as well. The grip modification was the same for both the fatigue and SCC
testing. Thus one was made for each test set up. The specimen water bath
was provided from a heated constant temperature water reservoir designed to
provide heated deionized water for a number of elevated temperature tests.
Evaporative and other losses were made up by an automatic filling deionized
water supply. Temperature was maintained in the water surrounding the specimen
by the use of a thermostatically controlled hot water inlet valve. Temperature0 0
regulation using this system was about *2 K (3.8°F) at worst. Since the con-
tainment tube was more than 0.9 m (3 ft) long, the water inlet was located in
the bottom grip to minimize temperature variations due to convection. The
specir-' itself was fitted to the grips with a stainless pin coated with a
thin layer of plastic to avoid electrical contact between the specimen and the
grips. To avoid general corrosion 1i this environment the specimen was taped
using polytetrafluroethylene (PTFE) tape in all areas except that of the bond
line.
Monitoring of crack growth is done using compliance measurements for both
fatigue and SCC tests. For fatigue testing the use of the gage shown in
29
_

Figure 10(c) described earlier is well x'mderstood and its accurac- correlated
J_ with visual observations of the crack length. Copliance monitoring for
sustained load tests is somewhat more difficult because of a gradual shift in
Ell- ~ the displacement corresponding to zero load. This effect was noted after a_
long exposure test indicated a greater crack growth than cculd be vtsually oh- 1_-Tserved. To verify the actual compliance the specimen was unloaded and r&-
loaded periodically. The slope of the load-displacement curve gave a m.zasure-ment of the true crack length, whereas the absolulto displacement has been
misleading.
3 OELOPMENT WOMK ON OTHER SPECIMENS
A substantial amount of testing and analysis work was done on the width-
tapered beam (WTB) specimen, diagonal loading of the contoured double-cantilever
beamn (CDCB) specimen, the beam and colum (BC) specinei, and modified zero
K-gradient (MZKG) specimen. This work is sinmnarized in the following sections.
3.1 The Width-Tavered Beam (Win) Specimen
The constarr!g specimen known as the wridth-tapered beam (W.'B) (Figure 3)
was first described in Referance 7, where the applied crack unrte__'.on forc,'_Sis given for a short-height pair of beams as
2 f2\
2P,, b (-3 (23)
where I 2 .E hI_
P =applied load
E =elastic mcdulus of --he adherends
b =specimen width at the crack tip
bN width of L!,e adhesive layer at the crack tip
h =height of one adnz-end
a crack length as measured from the loading holes
For the case where bN equals b, this expression can be written in term
of the a/b ratio:

2 212P2 (a/) (= -- (24)
Eh
The maximum bending stress in the adherends can be determined from the
following:
6P /a\ (5-~- W(25)-
Crack length can be estimated from the following. The compliance of an
ideal WTB specimen where the taper begins at the load point is given bi:
C (26)Eh
In an actual specimen where there is a straight section before the start
M of thp taper, the exiression can be rewritten with a constant reduction in
the compliaiu.e
2 C = 2 C0 (27)Eh3 kb
While Equations (24) and (27) are adequate to within perhaps 20 percent when
used to estivate and crack length an accurate compliance-crack length curve
must be established to define these variables for 'I and fatigue testing. ItIc
should be recalled that the beam formula used for constant height beams required
a rotation and shear correction to define crack length and dC/da as a function
of crack length. An example of these corrections of Enuation (27) might be
C = -C° + 1 (a + ) _ n a -a- (28)
31
jar - il d v _ _ -_ -- _ _ -- A

where the first bracketed term contains the rotation correction as an offset,
a0 , in the actual crack length and the second bracketed term involves the
natural log of the a/b ratio as the shear correction.
Specimen WTB-I, shown in Figure 14, was machined from a bonded plate with
9.5 mm (0.375 in.) adherends of 7075-T6 Aluminum and AF-55S adhesive, precracked
by prying the end open, and 97 tested. The a/b ratio for the specimen is setIc
equal to 3. The load-displacement record is shown in Figure 15.
The starter crack was located 38 mm (1.5 in.) from the loading holes in
a straight section of the beam where b is 28.2 mm (1.11 in.). When first applied,
the load reached a maximum of 1.98 kN (446 lb). Using Equation (25), the maxi-
mum stress level in the beams was 175 MPa (25.4 ksi).
Once the crack entered the tapered section of the specimen, the load
dropped to a nearly constant value of 1.47 kN (330 lb), and each adherend be-
came a constant stress beam. Using Equation (25), the stresses in the beam
were 288 MPa (41.7 ksi). While these stresses are high, they are still far less
than the yield strength, 517 NPa (75 ksi), for 7075--T6 aluminum. This is verified
by examination of the specimen after testing which showed no permanent deforma-
tion had occurred in the adherends. This load corresponds to c 3.78 kJ/m2
(21.6 lb/in). The specimen was ther unloaded and reloaded, whereupon the load
returned to the same constant value as crack growth continued.
The _ value obtained in this test is 1.2 to ' 4 times higher than the
range of values obtained previously in the CDCB specimens. There are at least
two possible explanations for the high value. The first is that there is not
yet an accurate comp'iance calibration for the WTB. The second is that stat.dard
industry practice for producing large-area bonded panels results in significantly
higher values of£ .WIc
While it is gratifying to obtain data suggesting that commercial practice
results in higher toughness values than for the narrow-area laboratory bonds, it
should be recalled that there has been 3ittle, if any, : lationship observed be-
tween ' and the Mode-I fatigue properties of a given adhesive bond. Therefore,Ic
it is expected that the fatigue characteristics measured on the IWB specimen
will be similar to those measured on the CDCB specimen.
32

]
Figure 14. Width-tapered beam (WTB) specimen shown with gripping bolts
3.2 Diagonal Loading of the CDCB Specimen
J The fixturing for diagonally loading the CDCB specimen is shown in Figure 4.
Preliminary tests with this specimen-grip arrangement indicated an apparent de-
crease of as much as a 30 percent in critical strain energy release rate with theM
} addition of no more than a 5 percent Mode II component. Reexamination of the
test fixture indicated that it had been made for specimens having a grip hole
~separation of 12.7 mm (0.50 in.). Specimens tested in this fixture had an actual
Iseparation of 13.7 mm (0.54 in.), placing an additional Mode I moment on the
i =. specimen. New holes were then cut into the angled grips and new specimens tested.
i{ During the 60-degree angle test, a 60-degree triangle was placed on the
grips and lines were scribed on the specimen during loading that should have
i remained parallel to the bond line. While these lines did start out parallel
to the bond line to within 1-degree, as loading progressed the loading angle
continuously dropped. In some cases, the loading angle dropped to 56 degrees
from the -initial 60 degrees at the crack extension load. Calculation of
CI
Sfor AF 55S material with the remade grips was done using the actual angle at
i ,the crack extension load. Values of 4 in this test series were equal to or
greater than the ialue of icdetermined on this material.
"'II
Thus the idea of diagonally loading the CDCB specimen to achieve a mixedmode condition has two disadvantages. One, known from the start, is that only
dia very small percentage of Mode II is readily achieved by this means. The
tet ixur idiaedtht t adbenmae orspcien avnga ri3hl

DISPLACEMENT, mm
0.5 1.0 1.5 2.0 2.5 3.0500
BEGINNING OF TAPERED 2.0SECTION AT a = 51 mm (2 in.)
Pc -14 (28 1b400 /'Ic = 3.78 kj/m2 (21.6 lbin.)
0 74 1.009
200 V1
/ 0.5100/
00 0.02 0.04 0.06 0.08 0.10 01
DISPLACEMENT, A, in.
Figure 15. Load-displacement record for width-tapered beam specimen (WTB-1)
34

second, discovered here, is that small variations in the geometry or alignment Iof the specimen cause large changes in the computed strain energy release rates.
When possible, such geometrically ill-conditioned specimens are to be avoided,
so no further use was made of this loading configuration.
3.3 Beam-and-Column (BC) Specimen
A conceptual view of the original Beam-and-Column (BC) specimen is shown in
Figure 5. In theory the specimen can be tested in any combination of Modes I, II,
and III. The vertical forces P, aligned with the bondline, induce pure ?I' while
the concentrated moments M, applied independently of P, induce a selected com-
bination of Modes I and III. I and cIII are all crack length independent.
Redesign resulted in the specimen shown leaning against the test machine
in Figure 16. This bending moment, applied by loading bars connected at the~wo pair of h,-les on either side of the bondline, apply pure Mode I, and II=0.
Radii were provided on the surfaces of contact for the Mode II load P so that P,
applied across rollers, would remain aligned with the bondline, despite any
rotations resulting from the Mode I load. The direction of P could be reversed
for fatigue cycling at negative R ratios in Mode II.
The specimens were tested in a unique test frame that permitted two-axis
loading using a single actuator. Figure 16 shows the test frame installed in
a 3,000-pound capacity, closed-loop type hydraulic test machine. (Note that
one BC specimen is hidden in the loading members of the test frame in addi-
tion to the one shown resting against a post of the closed-loop machine.) A
closeup o' the test frame a'one is sh-own in Figure 17.
The fixture applies two-axis loading as follows: Pure shear loads areI applied by the pair of pin grip holders held in forced alignment by two sets
:f four flex plates affixed to each grip. The shear grips cannot be moved
out of alignment by the Mode I component because of these flex plates. Note
that each grip has two pins so that shear can be applied in both dire:tions.
The specimen itself has feur contoured bearing surfaces. Radii on all four
were calculated assuming the crack tip to be 102 nm (4 in.) from the
start of the uniform DCB section. Thus, when the specimen responds to the
Mode I load the contoured sections of the two specimen halves should rotate
in opposite directions but the shear load should remain on the crack line.
35

I
"IAl
EM
IIII
I °_ f
Figure 16. Single actuator test assembly for two-axis loading of BC specimens(Note that one specimen is shown in the test fixture and a second
is shown resting against the post of the test frame.)
36 AN

r
Q
Fiur I7 ls-pve fMd oeI etfae[Nte (1 oeImmn ppidtruham
I aI
Figure 17. Close-up view of Mode I - Mode II test frame. ®
[Note: (1) Mode I moment applied through arms
load cells and springs; (2) Mode I! load appliedthrough pinned grips with flex plates; (3) Deflec-tion in both axes measured with bolt-on extenso-meters being adjusted by technician.]
37 7

The total load on the specimen was measured with the load cell shown above the
top shear grip. The extended, hollowed part of the lower shear grip, which
prnvided clearance for the specimen, was connected through the Mode II spring
assembly and the Mode I loading bar to the actuator. The Mode II spring
assembly contained two springs, above and below an internally flanged loading
rod, which reacted to either tension or compression. These springs were
selected such that a sufficient motion would be available for the Mode I
loading bar to produce the desired amount of K on the test specimen.
The Mode I component of the load was applied through the two moment bars
attached by two pins in each specimen half. These bars were attached to the
Mode I loading bar through a turnbuckle, a Mode I spring assembly and load
cell on each side.
The initial set-up of a BC specimen in this fixture is done by selecting
a particular set of Mode I moment bar holes and applying a slight Mode I pre-load to each side of the specimen using the turnbuckles. The major load is Iapplied using the hydraulic ram which increased and ll proportionately. -
Loading was increased until crack growth was observed either visually or with
the instrumentation used for measuring displacements or strains.
Initially the instrumentation consisted of separate displacement gages
as shown in Figure 17, one for measuring the opening (Mode I) d.splacement
and one the sliding (Mode II) displacement. However, this instrumentation
was deemed inadequate when it was determined that the Mode II loading could
induce Mode I strains near the crack tip that would not be measurable on the
Mode I displacement gage. New instrumentation consisted of strain gages that
independently measured the adherend bending strain (Mode I) and shear strain
(Mode II).
Calculation of I and I is done using the following equationsI II
MbNEI
(29)2 a, b
PII
bEAN
38

°!
where
M = PI2
C = Moment arm selected for the particular test. For this fixture 2
can be 216 to 343 mm (8.5 to 13.5 in.).
b = Bondline width, 25.4 mm (1 inch) intervals.N
E1 = Bending stiffness
I EA = Tensile stiffness I-
Since the method of loading results in a crack length independence of v
both YI andll crack length need not be measured visually but instead can
be estimated from the load-displacement record.
Pure Mode I and mixed Modes I and II tests were conducted for a gradu-
ally increasing load using three Beam-Column (BC) specimens. On the average,
the ratio Yii/Yi in the mixed mode tests was 0.26. Wereas the average cI 2
value for the three specimens in Pure Mode I tests was 2.52 kJ/m (14.4 lb/in),
the average mixed-mode!c? value was only 1.60 kJ!m2 (9.15 lb/in).IC
The apparent drop in' for small' /V ratios as measured on theic II I
BC specimen is not consistent with the increasing-load test results
for the combined-mode CLS specimens, where a much higher!Kl percentage0 2
resulted in larger I values than 1.60 kJ/m (9.15 lb/in), as discussed inIc
subsection 2.2
It is clear from the test setup discussion that the BC specimen ist difficult to test. Furthermore, the ratio of the applied Mode II load (PII)
to the Mode I load (PI) producing the bending moment is typically about 20,
so that a small angular misalignment can cause an inadvertent increase in
due to the load P. Finally, further testing of the specimen indicated
that it was prone to scatter. Because of the scatter and the ill-conditioned
nature of the specimen, the test results were regarded with skepticism and
further testing was discontinued. j
39

3.4 The Mode III Test Specimens
One of the objectives of this program was to design a specimen to measure
critical strain energy releast rate for Mode III and to obtain otherIIIc _
slow crack growth or fracture data when loading in primarily Mode III. A
uniform beam-type specimen was tested first to ensure that crack growth can
be achieved. Then contoured specimens with constant aC/aa and independ-
ent of crak length were fabricated in the configuration shown in Figure 18.
The first order analysis for for a contoured double cantilever beam
specimen is obtained from Equation (3) as follows:
2=III ac
111II 2 b aaN
(30)
2 rIII1 [3a2 + h 2
3 EBb I A/ 1_This expression does not contain the 0.6 h rotation correction term which
is used for noncontoured specimens. It has been found from compliance
studies that this correction should not be used for contoured specimens.
Using the definitions in Figure 19 the part of Equation (30) in brackets is
given by
2 2 2(31)
M° = £3 h +) hl 2h+h O
I4 (h0 2 1 h + h]
and the expression for can 1-z written as
40
lu

E .
Goo
cog
_ _ _ _ _ -IloI-A
0 P%
'UAoi -x
0- 414U 0o..Oc -
> nw C s
Od C,
II
0 a- V:&
_LL-D
= ~ ~ ~ C =-C;: -- =
_ _ _ _ _ _ _ _ _ _ _ _ _ _ _~ -C~-~ - - - j

-F--x CG h
MILLEDSLOT---. -- _h
"- 2-MILLED=SLOT
KBH
Figure 19. Cross section of ;he MZKG specimen
i p2IIIP 2
PIII 2 [.oI (32)i!I 2 bN 3EB
This expression is independent of the crack length, a, and can be used through-
out the contoured region. It should be noted that Equation (32) may not be
exact because of the non-rectangular cross-section and the limitations of
beam theory, and would best be verified by a compliance calibration.
Since macy of the specimens were fairly thin, the grips were designed
to restrict the lateral displacement at the pinned ends. The minimum height
is 63.5 mm (2.5 inches) which places a reasonable limit on its susceptibility
to buckling.
After preliminary testing on specimens which were made from lami-
nated 3.2 mm (0.125 in.) sheet with FM 317 adhesive, test data were obtained
from nominally 12.7 mm (0.50 inch) thick specimens laminated from 6.3 mm
(0.25 in.) plate using the AF-55S material.
42

The objective here was to obtain fracture data when loading primarily in
Mcde III. The simple strength of materials analysis, while adequate to
design a constant compliance-change specimen, does not ensute that fracturing
will cccur by pure Mode III alone. For example, it is expected that there _
will be a substantial Mode I contribution at point (l) in Figure 19. In --
addition, some Mode II could be present if the crack front is nct parallel
to the direction of the applied load P
To partially define the effects of extraneous Modes I and II on the value
of l measured with this specimen configuration, the specimen geometry was
varied with a view toward changing the degree of influence of the other modes.
The calculated 'ilc values for several values of bN, the overlap length,
are shown in Figure 20. These data indicate that at values of b less thanN15.9 mm (0.625 in.) the value of is subject to some variation which does
IIInot appear at b. of 15.9 and 19.1 mm (5/8 and 3/4 in.). This is not to imply
N2that the value of 11.6 kJ/m (66 lb/in) is a true value of however, it
appears that the contribution of Modes I and II to the measured value of
is constant at values of b of 15.9 mm (0.63 in.) or greater.N
Testing of these specimens showed that there is substantial influence Cf
the crack at regions well ahead of the apparent 'll crack front. This hadA -IIIbeen seen in the preliminary tests by the fact that the back end on a fully
slotted specimen underwent deformation and rotation hinging when the apparent
crack front was still well within the constant OC/aa section. These new
specimens were made so that the milled slots defining bN did not extend to
the back end.
Fracture surface photographs of the specimens with b = 19, 16, and 13 mmN
(5.75, 0.63 and 0.5 in.) are shown in Figure 21. These photographs show that
slow crack growth in the taperered section o-curs with a substantial interface
(IF) failure area near each edge (or slot) and a mostly center-of-bond (CoB)
failure area in the middle of the overlap. This fracture appearance is essen-
tially independent of overlap size and the percentage of IF and CoB is rniiably
the 3ame for all three specimens. The fracture surface in the region of
43
=H- - --- - - -- ____

OVIERLAP LENG~ .-
C 10 U 270 0ok -0
0 o lo
.so 022
Fe
Figure 20. Effect of overlap length on -. IC
,unstable crack growth from the end of the tapered section to near the end of~the specimen does not show any IF areas.
Mo~de III XMZKG s r~cimens -*itl-- b,, of 9.5 and 15.9 (0.375 and 0.625 in.)were fatigue tested in laboratory air. The curves of crack growth rate per
cycle, da/dN, vs. applie &i Il are shown in Figure 2-2. These ca_,cves have
the same slope, but the curve for the bN 15.9 = (0.625 in.) specimensshifted to the left, tovards higher values of da/dX at a given applied &?6II !
Both specimens were machined from the same bonded panel. Thnus the overlap b,,of the Mode III specimens, which 'had ro effect in the -increasing load tests ofF--gure 20, appears to have had a substantial effect on the- fatigue crack growth
rate.
Further efforts to understand Mode III crack growth in the V.IKG specine-n -
were not 7--ticularly fruit' u!. Adiinlstudy is rec ended.
44E
-~ M

NN
19 mm... .. °" _(0.75 in.)
16 mm -
_ (0.63 in.)
(0.50 in.)
(a) Complete Specimens
13 mm
(0.50 in.) M~16 mm
(0.63 in.)
19 mm(0.75 in.)
(b) Enlarged View of Fracture Surfaces
Figure 21. Fracture surface photographs of MZKG specimens
45
-= - 4

AO-I - - -
0.2 0.4 1.0 2 4 83
110
01
SPEC. 2-091bN =15.9 mm
(0.625 in.) A0
0...0.
0 EUSPEC. 2-08 z
hb 9.5 mm (0.375 in.)
I0.1AA
J3
0.01
0.1 MZKG SPECIMENS
AM =1.9 MM 1 (48 in 1 )LRBORATORV AIR~ .0f =3.0 Hz
1 2 4 10 20 40 S
AO b/in
Figure 22. Comparison of Mode III fatigue crack growth curves fortwo overlap dimensions
46

SECTION III
BASELINE TESTING
1. INCREASING LOAD TESTS
i1.1 Mode I (,:ic) Tests
Table 1 summarizes-ly-ic values for 12 Contoured Double Cantilever Beam %;
(CDCB) specimens that were increasing-load tested. All 12 specimens were !
bonded simultaneously, four with 0.13 mm (0.005-in.) shims and eight without
shims. Bonding with shims consistently produced a thicker bondline, and the JAY
Ivalue for the shimmed specimens was higher. These results tend to confirm
earlier suspicions that Ic increases with bondline thickness for AF-55S in Oi
Ic aI
the range of thicknesses tested. :
SOther yI data generated for this program are summarized in Table 2. A=
'II
NAThe bondline thicknesses for the 36 specimens were not measured but appeared
to be thin, although the temperature and pressure (T-P) cycle was the same asA
I
used for aircraft bonding. No shims were used. The 36(,I( values varied from
IcI
1.70 to 2.68 kJ/m2 (9.7 to 15.3 ib/in) with a mean of 2.19 kJ/m2 (12.5 ib/lin.).
It was noted after bonding that four of the 36 specimens became cocked
during curing, creating a side to side tilting of the bondline. As noted in
Table 2, these specimens account for four of the nine lowest 'Ic values. ]_
IcI
1.2 Mixed Mode I and Mode II TestsI
As discussed in Section II, the CLS specimen, by its resemblance to typ-
cal bonded structure, provides baseline data which are believed to be most
directly applicable to bondline crack growth in structure. Hence the mixedS-
Tble 1t rsentdrie aues for 12notoued Doube Le Catieers Bhea mn-
tonically increasing load (MIL) tests were conducted after fatigue testing
47b-Ast
~ vaue or te simme spcimns ws hgher Thse esuls tnd t cofir

TUTABLE 1. VALUES FOR SHIMMED AND UNSHIMMED CDCB SPECIMENS
d- Ic
Bondline Thickness, Microns (inches)
IcSpecimen Number @ Crack Tip @ Back End kJ/M (lb/in)
Bonded Without Shims
7-14 152 (0.006) 152 (0.006) 2.22 (12.7)
7-42 178 (0.007) 152 (0.006) 2.28 (13.0)S7-6 127 (0.005) 152 (0.006) 2.21 (12.6)
7-41 203 (0.008) 152 (0.006) 2.28 (13.0
7-16 203 (0.008) 178 (0.007) 2.22 (12.7)
7-10 152 (0.006) 152 (0.006) 2.38 (13.6)
7-26 178 (0.007) 178 (0.007) 2.24 (12.8)
7-92 152 (0.006) 152 (0.006) 2.28 (13.0)
168 (0.0066) avg 160 (0.0063) avg 2.24 (12.8) avg
BondedWith 0.005-Inch Shims
7-83 229 (0.009) 229 (0.009) 2.89 (16.5)
7-55 229 (0.009) 229 (0.009) 2.66 (15.2) A
7-23 254 (0.010) 254 (0.010) 2.57 (14.7)
7-21 229 (0.009) 254 (0.010) 2.52 (14.4)
236 (0.0093) avg 241 (0.0095) avg 2.66 (15.2) avg
48
_A--

IA %D r- O a% 0 H- 0I cVn It in \.0CI C14 C'J 4 C4 04l Cn Cn Cr C) en Cn Cn
.JO In cn ml m C4 1- -: ~ IA IuH H- H- H- H- H- H- - H H- H- H- H- H-
~04 - - IT -zr 00 a% IT \0 .C r- 1.0 CO0-
C',~C C', C' C', C', .4 iCIA I A .
-- 09(D -.T 0nC4 C) r - % C -. P 0
tn 0 - m ~ m 040 0\ w'~ a. r-
P. z
0
H 111 - '.0O ' H H- -T In P- t- O 0 004
w0 C', C 04C4 C O' 0444 CO CO H4
U311 HI-- 040404040404040404040404- % %-
M0 a
$4 H) 04c D Ch 0 - CI D OV) p. 0. 0 H (I Of ) COO' 00 M --I 4 C .T CO
W02 I I I I I I I I I I I 1 H1
VA v r. .t-4 c,4 r-. t -t \ r- r. m- r- H- c,4
H1 04H: u
H" C4 -'Z4--- N O 4c~I I CJ. 04
cn 10004'*- I'llC m O f '0 CO CO H n H, H$2 O C;C CO CO COO :4 r4 00 -4
04 Cu)
14 4 4 4 4 4 4 'O 0 :3 W2H
O1 *o 0l 0 l0Cl~~~~4 0i H I O .O 0 4 A C.
IfI

and side-notching of Specimens CLS-l, CLS-3, and CLS-4. Consequently, in M
addition to the usual load-displacement data obtained (see ection II),
examinations of fracture surfaces provided fractographic information on the
extents of fatigue and static crack growth.
Results of a static test of Specimen CLS-l indicated a value of 4Ic
between 2.40 and 5.27 kJ/m (13.7 and 30.1 lb/in). The critical l for
Specimen CLS-3 was determined to be 2.43 to 3.04 kJ/m2 (13.9 to 17.3 lb/in).
Specimen CLS-4 had equal adherend thicknesses of 19.3 mm (0.76 in.) and
was side notched such that bN = 6.35 mm (0.25 in.). Equations (5), (18), and
(21) were used to compute, after side notching, that %/; = 0.215 and
CL 0.0266.-44
After side notching and subsequent fatigue cycling, Specimen CLS-4 was
also increasing-load tested. However, the test was different from that of
Specimen CLS-3 in that the loading rate was much higher. A loading rate of
about 1.56 kN (350 lb) per millisecond was used. At the instant the crack
began propagating the load was between 80 and 102 kN (18 and 23 kip). Thus,
.Ic was between 1.51 and 2.46 k/m (8.6 and 14.1 lb/in). Crack growth began A
at about 52 milliseconds and ended at about 62 milliseconds after start of ramp-
type loading. The total crack growth was about 280 mm (11 inches).
Figures 23 and 24 show the overall and enlarged views of the fracture
surface of CLS-l. In the overall view (Figure 23(a)) the area of the pure
Mode-I precracking of the Specimen is seen as a set of center of bond (CoB)
fingernail markings. The next 96.5 mm (3.8 in.) of fracture surface from the
precrack is by mixed-mode fatigue, which occurs along one side of the scrim,
near the primer-adhesive interface. This is best seen in the enlargement
shown in Figure 23(b) and (c). Recall that the machining operation that
reduced the bond width from 25.5 to 4.7 mm (1.005 to 0.186 in) was done after
fatigue cycling and before MIL loading.
The point at which MIL crack growth begins is clear in the magnified
views (Figure 23(d) and Figure 24(a) and (b)). To the left of this point
50N_Ig

Crack Growth Direction
(a)
A rea of Mode IP rec rack - Mixed-mode Mixed-mode MIL Crack
Fatigue Growth Extension,
(b)
(c) (d)Figure 23. Fracture surface of specimen CLS-1.
(a) 0.3X of fracture surface to cut. Note: Fracturesurface width has been reduced from one inch to 0.186 in.;(b) 0.8X magnification of area of interest. Note: cir-cular marks on fracture surface made after test was com-pleted. (c) 1.4X of Mode I to Mixed-mode Fatigue Transi-tion and (d) 2X of Mixed-Mode Fatigue to Mixad-mode MILTransis tion.
51

-ME
(a) Transition Area from top of Figure 23(d) (Approx. 1OX)
(b) Transition area from bottom of Figure 23(d) (Approx. 1oX)
IA
Figure 24. Magnified fracture surface photographs for specimen CLS-l.
52

the fatigue area appears as a flat fracture near one interface. The scrim
layer and most of the adhesive is on the top, while the impression of the
scrim and a very thin layer of adhesive is on the bottom. Fracturing under
5mixed-mode MIL loading is radically different from that observed with Pure
Mode I. The fracture surface is featured with inclined flakes on both top and
bottom. These flakes appear to be areas of cracking that occur normal to the
Mode I loading, originating from the interface and extending upward and left
on the bottom fracture surface, and downward and right on the mating surface.
Fracture surface photographs for Specimen CLS-3 are similar in appearance.
These fracture surface photographs suggest that mixed-mode fracture per-
haps occurs in two stages. By this hypothesis, Stage I would be the multiple
initiation and growth of microcracks that are inclined to the bond line,
their density highest close to the tip of the advancing macroscopic bondline
crack. Stage II would be the advancement of the macroscopic crack by linking
up with the inclined microcracks.
The flake-type fracture surface that occurred in Specimen CLS-l and CLS-3
at low-loading rate is not present in Specimen CLS-4. Instead, the fracture
appearance resembles that of a pure Mode I test.
2 SUSTAINED LOAD STRESS CORROSION CRACKING TESTS
Both pure Mode I and mixed Mode I an, Mode II stress corrosion cracking
(SCC) tests were conducted by prolonged immersion of loaded specimens in
deionized water. The pure Mode I tests were conducted using CDCB specimens
at 316'K (110°F), 3220K (120°F), 327°K (1300 F), and 3330K (1400 F). The mixed
mode tests were conducted using a CLS specimen at 3330K.
2.1 Mode I SCC Testing
The first group of SCC specimens consisted of CDCB specimen 7-22 and 7-46.
Four test temperatures were used (3160, 3220, 3270, and 3330K) and crack
growth rate, da/dt, values were obtained up to an applied 9I of 0.876 kJ/m-A I(5 lb/in). The data are plotted in Figure 25. The four curves fall into two
0 0 0groups, low rate group at 316°K (110°F) to 322°K (120°F) and higher rate group
at 3270K (1300F) to 3330K (1400F).
53

0.2 0.4 0.6 0.8 1.0
AF-55S ADHESIVEWATER IMMERSED
V SPEC 7-22 10.01 C= 2.28 J/rn2 (13 lbin)
C)~ SPEC 746 2(3W n=fi 2.28 Id/rn (13lben
io2 3330K (140 0F)1020
1.03270K (130cF)
EP
10 3160K (1100F 1
.322 0 K (120 0F)
0.1M
II
Figure 25. Pure mode .~sustained load crack growth
54
Fi

Specimen 7-22 and 7-46 were bonaed without shims and consequently had a
relatively thin bond line. Data on Specimens 7-55 and 7-83, which were shirmed
for bonding to a thickness of 0.13 mm (0.005 in.), are plotted as solid points
in Figure 26. These data show a plateau where the crack growth rate 1s between
0.14 micron (5.5 microinch) and 1.0 micron (40 microinch) per minute and
relatively independent of applied§ I from I = 0.58 kJ/m2 (3.03 lb/in) to
'I 1.3 kJ/m- (7.55 lb/in).
The q,'ISCC values cannot be reliably estinated from these data. To obtain
YISCC estimates, tests would have to be carried out for a longer period of
time, such as 6 months.
AF-55S adhesive, BR-127A primer and the phosophoric acid anodize (PAA)
process were used to prepare the shimmed and unshimmed specimen groups. In
Figure 26 the data from these two groups are compared to one another and to
data from a third group tested earlier (Reference 9), also in 3270 - 3330 K.
The third group, bonded with shims, was prepared using AF-55S adhesive and
bR-127A primer, but the surface preparation was FPL etch. There are differ-
ences between the shimmed and unshimmed, but the major difference is between _
the specimens with PAA-treated adherends and FPL-treated adherends. For
example, the crack growth rate in the shimmed PAA-treated adherends at a
of 0.61 kJ/m2 (3.5 lb/in) is about 1000 times less than that for the FPL
etched adherends using the same AF-55S adhesive system.
It is informative to examine the fracture surface to identify the loca-
tion of cracking. For FPL adherends crack growth proceeded near the metal-
to-primer interface, while in the PAA adherends, it occurred in the bulk
adhesive. Thus the data for specimens with PAA adherends show the crack -
growth resistance of bulk AF-55S. Data for specimens with FPL adherends
show the crack growth resistance near the interface.
I 2.2 Mixed Mode SCC Testing
A limited amount of mixed nodes I and II sustained load testing was done
using side-notched specimen CLS-8. This specimen had adherend thicknesses
55

#W.kJm2
0 0.2 0.4 0.6 0.8 1.0
-327 0K (1300 IF) - 0
- FPL
SHIMMED-
3/110
E~ E
PAA-
CC
0~-< .2
~10 r
3270 K (1309F)
-7-22 UNSHIMMED
333PK (1400 F)
+* CLS SPECIMEN 7 746 UNSHIMMED 1-@ 3330K (1400F) ir -7-83 SHIMMED 17
PLOTED At'p- 7-55 SHIMMED
0 1 2 3 4 5 6
Wj. bin
Frigure 26. Pure mode I SC- data in 327 K -33%1- (130'F -140'F) water.
56

t 9.5 mm (0.375 in.) and t9 = 19.5 u (0.767 in.) and was side notched
from Pn initii1 -idth of 25.4 mm (0.999 in.) such that b = 3.6 mm (0.140 in.).
From Equations (15), (18), and (21) it was calculated that after sjde notching
I= 0.106 and CLS = 0.0129.
Crack lengtns werc -.timated from compliar-e measurements during
periodic unloading and re'.ading as d-scribed in Section II, Subsection 2.3.
This procedure --as necessary because the absolute displacement gage reading
gradually incr-ased d-.ring sustained loading irrespecti- of crack extension.
The data points obtained o.L Specimen CLS-8 are as follows: P = 40 kN
(9.0 kip), * 0.18 kJ/m 2 (1.04 16/in.), da/dt = 0.47 micron (18 .iroinches)
per minute; and P = 37 kN (8.3 kip). V - 0.16 kJ!m2 (^.89 Lb/in.). a/dt =
0.31 micron (12 microinches) per minute. No mrx5urable growth occurred in
4 months for P = 29.5 IiN (6.63 kip) and,'1I 0.10 kJ/m2 (0.57 lb/in.).
Plotted as W versus da/dt these points ;uuld lie above and to the left
of the pure Mode I data. The definition of effective strain energy release
rate, obtained !:cn the fatigue data (see Equation (37)), is
f ( 1 + k (33)eff
Replacing Y e the data points are plotted as darkened diamonds
in Figure 26. Although they fall within the region of the Pure Mode I points,
the data are not really sufficient to draw conclus.ons about the effect of
K II on mixed-mode sustained-load induced crack growth.
3 FATIGUE TESTS
Fatigue test data were obtained using the CDCB and the CLS specimens.
The Mode i CDCB specimens were tested in laboratory air at 3 Hz and 30 Hz at
both R 0.1 anu 0.6, and immersed in 333°K (1400F) water at 3 Hz aitd 0.25 Hz
57

and R = 0.1. The mixed mode CLS specimens were tested in laboratory air at
3 Hz and R 0.1 only.
The fatigue data are plotted as log(da/dN) vs. log ) and fitted with
straight lines of the form
da/dN (34)a a00
where C and n are dimensionless empirical constants: whereas a and zo are
standard normalizing factors. Vo was defined in Equation (20); a. is given by
a° = 0.0254 micron (1.00 microinch) (35)
3.1 Mode I Testing in Laboratory Air at 3 Hz.
The baseline constant-amplitude fatigue test condition was a labcratory
air room temperature (RT) environment and a cyclic frequency of 3 Hz. Six
Pure Mode I specimens were tested at two range ratios, R = 0.1 (baseline) and
R = 0.6, The data are plotted in Figure 27.
For each plotted point the crack advanced at least 5 mm (0.2 in.). If
the crack growth increment was less, the point was usually not plotted. Theonly exceptions are the points shown with downward arrows. For these, a
large number of cycles N were applied with very little crack growth. The
locations of these points on the da/dN scale are obtained by the equation
daidN = 5 mm (0.2 in) (36)
AN
Equation (36) always overestimates the da/d, value; therefore tle downward
arrow is used.
58

SkJ/m2
30 0.06 0.08 0.1 0.2 0O4 0.6 0.8 1.0 2.0
-AF 55S-RT FATIGUE 102
AT 3 Hz
R-0.1
102 7-20I~7-7902
0 7-54L 7-30 1.0
.20 7-51 A~R-0.6 v
10 * 7-20 "0. L 7-79
* 7-51 0
0 7-54E47-27
0.1.
0.11
Wbin
Figure 27. Mode I Fatigue Crack Growth In Room Temperature Air
59
IA

The constants in Equation (34) for the best-fit lines are: C = 0.0667-4a
and n = 5.57 for R = 0.1; C = 5 x 10 and n = 8.3 for R = 0.6. Although thedata at R = 0.6 are more scattered, the main feature is the increased slope of
the da/dN curve, 8.3 versus 5.57. The steepness of slope means that very small
changes in AWI cause very large changes in da/dN. For R = 0.6 for example, a
5 percent increase in AI (caused by a 2.5 percent increase in stress) will
increase da/dN by a factor of 1.5.
3.2 Mixed-Mode Testing in Laboratory Air at 3 Hz
The overall dimensions of the eight CLS specimens fatigue tested are shown
in Table 3. These specimens represent a variety of conditions. Four different
adherend thickness combinations are included, leading to 4 different values of
the factor CLS in Equation (19). A few fatigue data points were obtained on
Specimens rLS-l and CLS-3 after side notching and before MIL testing (see
Figures 12 d 13 for side notch dimensions). Further, the bonded panel from
which Specimens CLS-l and CLS-lA were machined was prepared differently from
the others. First, surface preparation of these 2 specimens was by FPL
etch. Secondly, the two 12.7 mm (0.5 in.) adherends were achieved by laminat-
ing a 7.9 mm (0.312 in.) plate to a 4.8 mm (0.188 in.) sheet. DesD'e all
these variations, the ratio W /was almost constant (between 0.205 and 0.258)
for all these tests.
-A The results of these tests are plotted in Figure 28 as da/dN versus the
K AMode I component of strain energy release rate, Af" As plotted, the points
are significantly above and to the left of the best-fit line for the R =0.1
Pure Mode I data from Figure 27.
To account for this difference, an effective strain energy release rate
is defined as
_ :eff (1+ -)A (37)
Note that for pure Mode I, Aeff and AI are equal, whereas for a CLS speci-
men with (for example) 'i/Wof 0.205, Aeff is larger thanA6 I by a factor
60
I

TABLE 3. CLS SPECIMEN DIMENSIONS IJ I-
Specimen Idm d2 11 12 CLSNo. m (in.) M(in.) rm (it.) mm (in.) m- (in.) mm (in.) Eq.(22) ' I
CLS-1* 12.7(0.5) 12.7(0.5) -1168(46) 1099(43.3) 800(31.5) 953(37.5) 0.0102 0.205
CLS-lA* 12.7(0.5) 12.7(0.5) 1168(46) 1099(43.3 800(31.5) 953(37.5) 0.0102 0.205
CLS-2 19.3(0.16) 9.7(0.38) 914(36) 838(33) 502(19.8) .3(25.5) 0.0226 0.2581~
CLS-3 19.3(0.76) 9.7(0.38) 914(36) 838(33) 502(19.8) 648(25.5) 0.0226 0.258
II
CLS-4 19.3(0.76) 19.3(0.76) 1168(46) 1099(43.3) 800(31.5) 953(37.5) 0.0067 0.205
CLS-5 9.730.38) 9.7(0.38) 914(36) 838(33) 502(19.8) 648(25.5) 0.0135 0.205
CLS-6 9.7(0.38) 9.7(0.38) 914(36) 838(33) 502(19.8) 648(25.5) 0.0135 0.205
CLS-7 9.7(0.38) 9.7(0.38) 914(36) 8.8(33) 502(19.8) 648(25.5) 0.0135 0.205*Laminated
15.9 mm(5/8 in.)DIA
AA
25 mm (1 in.) Q
, I dI ti t2
Ai
611 U.i-
61N

0.04 0.06 0.08 1j.1 0.2 0.4 0.6 0.8 1.0 2.0
100
FIT TO PUREMODS IDATA,
103
10
102
0I 0 1.0
LABORATORY AIRf =3Hz0
0; 10R=T 0
(D A - .1A 0 SYM- SPEC Iti t201oBOL NO. (in.) (in.)0 CL- 050 0.50
1.0 0 CLS-1A 0.50 0.500 CLS2 10.7 0.01
CLS-3 0.76 0.3809CLS-3 (SIDE-NOTCHED)
A CLS-4 0.76 1 0.76CLS-4 (SIDE-NOTCHED)
CLS-5 0.38 0.384CLS-6 0.38 0.38
0.1 Lo CLS-7 0.38 10.38
0.001
-- ~~~0.02 t.. I I I I I
0.2 0.4 1.0 2 4 10 20
A l .b/in
Figure 28. Fatigue crack growth data from mixed-mode CLS specimens
62
I

of 2.59. When replotted in Figure 29 as aff versus da/dN, the pure Mode I
data fit line is a reasonably good representation of the mean of the mixed
mode CLS specimen data.
Equation (37) provides a means for interpolating to estimate da/dN for
mixed mode cases with Vi/Vratios between 0.2 (as in the CLS specimens) and
1.0 (pure Mode I). The equation is strictly empirical, and its form is sub-
ject to change in the future as a variety of mixed mode fatigue crack growth
data becomes available.
3.3 Elevated Temperature Fatigue Testing
Mode I CDCB specimens were fatigue tested at D = 0.1 and 3 Hz or 0.25 Hz
while immersed in hot water. The da1.N data from these tests are compared in
Figure 30 to the baseline result, R 0.1, f 3 Hz., RT air environment.
While the slope of the curve does not change much, da/dN increases by about
one order of magnitude due to the hot water environment. Based on the two
specimens tested at 3 Hz., there is not a substantial difference in da/dN0 0 00
between water immersion at 327 K and 333 K (130°F and 140°F). There does
appear to be a small cyclic frequency effect, however. The da/dN value is
higher by about a factor of 3 when the cyclic frequency is 0.25 Hz. instead of
3 Hz.
The elevated temperature fatigue data at both frequencies are fitted by mg
Equation (34) with a slope n of 5.03. The constant C is 1.75 for f 3 Hz.aand 5.25 for f = 0.25 Hz,
3.4 High Frequency Testing
Four Mode I CDCB specimens werL fatigue tested in room temperature air
(RT) at R = 0.1 and R 0.6 and a cyclic frequency of 30 Hz. Based on past
test results on other structural adhesives, it was expected that increasing =
the cyclic frequency above 3 Hz. would significantly reduce the da/dN value.
The data from the four spe,:imens tested at 30 Hz. are plotted in Fig-
ure 31. Least squares fits of the data are obtained for each range ratio in
the form of Equation (34). For 30 Hz. and R = 0.1, the constants are
63

0.04 0.06 0.08 0.1 0.2 0.4 0.6 0.8 1.0 2.0
104 T 1 1 1 I 1 1 1 1 1
SYM- SPEC t1 t13 BOL NO. (in.) (in.)
00 CL1 0.0 05* CLS-1A 0.50 0.50EJ CLS-2A 0.76 0.380 10
* CLS-3 0.76 0.38
A CLS-3 (SIDE-NOTCHED)-. A CLS-4 0.76 I 0.76
® CLS-4 (SIDE-NOTCHED) 0* CLS-5 0.38 0.38
CLS-6 0 j0.38 0.38
LABORATORY AIR01f=3 Hz
010 0
10 U
A01 0
0.1
M_0.001
0.2 0.4 1.0 2 4 10) 20
e~ ffI b/inA4
Figure 29, OLS fatigue data using AV' to account for mode II j7 SKef f
64

A',kJ/M2
0.02 0.04 0.1 0.15 0.2 0.3 0.4 0.6 0.8 1.0 1.5
WATER IMMERSED: 100f = 0.25 Hz 3270K TO 3330K (1300F TO 1400F) WATER3330 K (140O0F) 3 Hz, R =0.1
SPEC. ~ 7=4 1.75, n 5.03
1000 SPEC. 7-6
1000 AND 7-9
1 =3.0 Hz3330K (1400F) 10
(0 SPEC. 7-31
f = 3.0 Hz 0-100 3270K (1300F)
K)SPEC. 7-30 '
-~*LABORATORY AIR, f =3.0 HzROOM TEMPERATURE (RT) _
10 7 SPEC. 7-51U0E E<SPEC. 7-20
'a t>SPEC. 7-99 0.1:E_
3330 (140F) ATERROOM TEMP AIR3330 K~~~ =10F AE 0.1, 3 Hz
0.25 Hz, R=. Ca 0.0667, n 5.57 A_Ca =5.25, n 5.03 a_
-A
0.91
0.1 I
0.001
0.0110-1 0.15 0.2 0.3 0.4 0.6 0.8 1.0 1.5 2.0 3.0 4.0 6.0 8.0 10.0
Figure 30. Mude I fatigue crack growth rate data,RT air and 3330K (1400F) water imlmersion a
65

C = 0.01 and n 6.0. For 30 Hz. and R 0.6, the constants area6C 7.2 x 10 and n 9.8. Figure 31 shows these best-fit lines and comparesa
them to the best fit lines for the same two R values and f = 3 Hz. Increasing
the cyclic frequency from 3 Hz. to 30 Hz. caused reductions in crack growth
rate of a factor between 4 and 10.
3.5 Discussion of Base]itze Fa, igue Test Results
In pure Mode I, fatigue crack propagation of bondline cracks can occur at
values of A i/0iC of 0.1 or less. Furthermore, the Mode II component has a
definite detrimental effect in fatigue but seems not to affect the critical
Value of for increasing load testing. Thus fatigue will tend to be a more
critical condition for a bondline crack than a single large increasing load.
The most striking thing about the fatigue crack growth dat.a is the very
steep power-law slope of the da/dN curve. For metals the relationship be-
tween da/dN and stress intensity K is often written in the form
da/dN = C AK 2n (38)m
(where the 2 makes the n here comparable with that in Equation (34) because
1 2VWvaries as (AK) ). For aluminum and steel, 2n is between 2 and 4, so n is
between 1 and 2. This contrasts with n values of 5.02 to 9.8 for the bondline
crack growth test results presented here.
The steep slope on the da/dN curve for adhesives means that small changes
in stress cause large changes in crack growth rate. There is a greater sensi-
tivity to changes in applied stress than in metals.
Furthermore, errors in estimated stress are greatly magnifiei when con-
verted to errors in fatigue crack growth life prediction, because the factor
error in stress is raised to the 2n power. For example, for R = 0.1, laboratory
air, 3 Hz. the factor error in estimated da/dN arising from an error of 3 per-
cent in estimated stress is calculated as
( 1 32 (.311.14AError =
2n = (03) = 1.39
66

pm_ 7M
ii Y
AV1, kJ/m2
0.06 0.08 0.1 0.2 0.4 0.6 0.8 1.0 210/ 20
M AF55SLABORATORY AIR 108
16SPECINO. R=0.1 R=0.6 II4
102 7.68 ~'27-2 0.0I
17-41 >1.0
/ 0.6
U I 0.410
'0.2
3 Hz, R0.1 1 0.1,0.
Ca 0.0667 , vA ' 0 .
Z 1.0 30H,1 .C., =7.2 x10⁻⁶ 0.02N
V n = 9.8I 0.01
/ 86
IL-. 4
0.1 30 Hz, R 0.1 /C a 300 3Hz, R 0.62
An =6.0~ 5 A 04l,7Ca=~O x0-In =8.3 x0-4
p6x104
-40.3 0.4 0.6 0.8 1.0 2 3 4 6 8 10
Figure 31. Effect of 30 Hz frequency on crackgot nro eprtr i
67I

With these steep slopes, it may often be difficult to design for finite
life, since minor design alterations or small analysis errors could cause short
lives for what had appeared to be an acceptably-fatigue-designed structural
member. This means that the value of ih the no-growth threshold, may beI th'even more important for adhesives than for metals.
Crack growth threshold data are expensive to obtain because of the long
test times required. This is even more true in adhesives than in metals be-
cause the material is time dependent (so high-frequency values of AVt mayI th
be misleading), and because the increment of crack growth required for a con-
fident reading of da/dN seems to be substantially longer in adhesives than in
metals.
However, the steepness of slope of the da/dN curve makes it reasonable to
use a conservative procedure for estimation of Aq t It is fairly certainA I ththat at lower values of da/dN the da/dN curve is concave downward in log-log M
space. Thus, extrapolation linearly downward to estimate low da/dN values is
conservative.
Arbitrarily selecting 1 mm (0.04 in.) per year as a practical value fc7
"no growth," and extrapolating the straight line fits of the da/dN data down to
that value of da/dN, conservative estimates of Ait are obtained. Theseestimates of the threshold are listed in Table 4. It
In addition to the slope of the da/dN curve being steeper, the cyclic
frequency effect on da/dN (particularly in laboratory air) is stronger for
these bondline cracks than is typical for cracks in metal. Thus, laboratory
testing at high cyclic frequencies has at least two serious drawbacks. First
and most obvious, the da/dN values at high frequency are inapplicable to pre- mg
diction for service fatigue loading at slower frequencies, and such predictions
would be unconservative. Secondly, because the metal da/dN properties do not
significantly improve with increasing frequency, testing at higher frequency
may cause metal failure prior to bondline crack growth.
For the purposes of thic research effort, a cyclic frequency of 3 Hz. was
felt to be a good compromise bet- _n the inapplicability of results obtained
from testing at high cyclic frequ.ency and the costliness of testing at lower
frequency.
68

_____ _ -~=- ~7=777 -
TABLE 4. CONSERVATIVE FATIGUE THRESHOLD VALUES BY EXTRAPOLATIONIFrequency da/dN @ 9IEnvironent (Hz) R ao Ith 1 th,
333'K 0.25 0.1 5.07 x 10-30.5
Water 3.0 0.1 4.23 x 1O-4 1 019
R.T. 30 0.1 4.23 X 1050.0Laboratory - . .3-4-
30 0.6 4.23 x 10 ~ 1.198
*Growth rate for da!dN 1 mm/year (1 in125 yr)
[ 69

ISECTION IV
METHODOLOGY DE1ONSTRAT iON
The work presented in this section covers the fival phase of this research
program, the verification of prediction methodolog..
Baseline test results indicated that bonded thin-sheet structure has a
high tolerance to bondliae flaws. There is a tendency for the structure to be
critical in the adherend, even with a bondline flaw in the adhesive. -areful
selection of the test specimen configuration and test conditions is critical
so that the bondline cracks actually do propagate. Several things can be
done to increase the tendency for the bondline crack to propagate without the
adherend yielding; namely:
1. Increase the adherend thickness.
2. Increase the Mode I component of str;:, energy release rate of thebondline crack by increasing the induced bending moment at the tipof the flaw.
3. Load in fatigue rather than monotonically.
4. Use a warm, moist environment.
The bonded structural specimen selected f -r methodology demonstration,
based on the above considerations, vas a single lap joint specimen. Two A
adherend thicknesses were selected. The thicker adherend specimens were
tested first with the primary goal of succeeding in obtaining crack propaga-
tion and fracture in the adhesive layer, Having achieved this goal, the thinner
adherend specimens were then tested in order to more closely simulate practical
fuselage skin thicknesses.
71
Al

1 TEST PROGRAM
1.1 Thick-Adherend Single Lap Joint Tests
Six structural bonded single lap joints with initial bondline flaws were
constant-load-amplitude fatigue tested in laboratory air (30-50% RH; 294 -27 °K,
690-75 F) at an applied maximum tension load of 0.525 kN per mm (3 kips per
inch) of width, R 0.1, and a cyclic frequency of 3 Hz.
The objectives of these tests were as follows:
1. To obtain crack propagation and fracture in the adhesive layer undercyclic loading in laboratory air without metal yielding or metalfatigue. In similar tests of joints with bondline preflaws (References8, 9) the metal usually failed before the bondline flaw had grownany discernable amount.
2. To monitor crack growth and obtain data on crack size, shape, andlocation versus number of cycles.
3. To observe the sensitivity of the crack growth life to differences -!
in initial flaw size.
4. To evaluate the use of baseline data and a LEWM approach in estimatingthe crack growth rates in the adhesive layer.
* The following paragraphs discuss the specimen configuration for the thick
adherend specimen and the steps in specimen fabrication, including introduction
of preflaws. The test procedures are then described, including the two methods
used in crack growth monitoring.
1.1.1 Specimen Configuration and Fabrication. - As shown in Figure 32, the
test specimen was a single lap joint 229 mm (9 in.) wide. Thick (10 mm,
0.375 in.) 7075-T6 bare aluminum plate was used for the main skin and doubler
plate to induce damaging stresses in the adhesive layer but not in the metal.
The tee extrusion bonded to the doubler plate was not intended to carry much
in-plane loading, but rather to provide an appropriate way to constrain the
lateral bending of the joint. This was accomplished by connecting the out-
standing leg of the tee to an externally mounted beam using flexures.
72

0o 0 flII to
-i-
w -j
caiLC)
IDI
Ci-
N_ _ -T 03r: c
N CDLnu
C~l LU
Lua-
too
Cd (C
2
0(-4IFr
0~0I- c.toI--4
73

,i . ... ._ ____-___
iAs a first step in specimen fabrication, a 229 by 686 mm (9 by 27 in.)
piece of 10 mm (0.375 in.) plate was machined, including the grip holes.
This piece was not cut in half until after bonding. In this way, the grip
holes of the final specimens would be perfectly aligned. Along the eventual
split line and across the full width of this piece, a groove 3 mm (0.125 in.)
wide was milled partially through the thickness on the to-be-bonded surface.
The tee and doubler pieces were machined to final size, and all pieces were
cleaned by the Phosphoric Acid Anodize process and primed with BR-127A primer.
The initial flaw in each specimen was in the adhesive laver between the
doubler plate and the main skin adjacent to the split line. During layup,
teflon tape 89 micron (0.0035 in.) thick was attached to the skin piece and
the adhesive was trimmed away where each initial flaw was required. By this
methcO there was no initial degradation of the bond quality in the neighbor-
hood of the flaui. Six specimens were fabricated; Specimen SLJ-l and -2 con-
Zained no ini,'al flaws; SLJ-3 and -4 contained across-the-width flaws 13 mm
(0.5 in.) deep; and SLJ-5 and -6 contained 51 mm (2 in.) wide, 13 mm
(0.5 in.) deep initial flaws, centered on the longitudinal centerline of -
the specimen.
0 0 0 0 -All six specimens were cured together at 389 -400°K (240 -260 F) and
276-345 kPa (40-50 psi) pressure. A cooldown at 339 K (150°F) was employed
prior to removal from the autoclave. The adhesive squeezed out into the split-
line groove in the main skin, as would have occurred had ti-. skin been split Iin half prior to bonding. The squeezed-out material blocked the edge of the
joint, which could be important in reducing bo+h tl-. effects of environment
1 p , ;' a lesser extent, the stress concentration at the edge of the bondline.,=: }L After a C-scan of each specimen to confirm the dimensions of the intended flaws
! }and tht- urifoniity of bond quality, the skin piece was split in half withamm (0.125 in.) milling cut which precisely met the bottom of the existing
groove, leaving intact the squeezed-out adhesive that had filled the groove.
1.1.2 Crack Growth Monitoring. - The primary method of flaw growth moni-
toring was an ultrar '1z method using a contact technique. Three 13 mm
(r.5 in.) diameter ultrasonic transducers were bonded into position around
the existing Drecrack so that a signal was triggered after about 6 mm
(0.25 in.) o: crack growth in any direction. At that time a hand scan was
74 j"NIi%a

used to outline the estimated crack. Subsequent hand scans about every
2000 fatigue cycles outlined the progressing shape of the flaw throughout the
test.
Part way through the test program, a second crack monitoring procedure
was implemented. Displacement gages were placed across the gap of the joint,
near the side edges of the specimen. Periodically during the tests, load-
versus-displacement plots were obtained. The measured compliances (inverse
slore of the load-displacement curve) were compared to computed finite element
results given in Figure 33, From the comparison, the debond length was esti-
mated. Note in Figure 33 that exLellent correlation was obtained between the
measured and computed compliances for the two known initial flaw conditions
of no initial flaw and a 12.7 mm (0.5 in.) deep cross-the-width flaw. Further-
more, the estimated compliance is extremely sensitive to crack size, doubling
during the first inch of crack growth. Due to its accuracy and sensitivity,
the compliance method was a reliable method for crack growth monitoring in
this case.
1.2 Thin-Adherend Single Lap Joint Tests
It was desired to conduct similar tests of prezracked joints using
thinner adherends in order to more closely simulate f-;elage structure. The
problem with thinner adherends is that the stresses in the metal adherena.,
are higher, and the failure tends to occur by adherend fatigue rather than by
crack growth in the adhesive. The results of the thick adharend tests and
the baseline data from the Mode I RT fatigue and environmental fatigue tests
were used tc design thin adherend test specimens and test conditions which
would be expected to fail by c:ack propagation in the adhesive.
Six preflawed structural single-lap joints with 3.2 mm (0.2 5 in.)
adherends were constant-amplitude fatigue tested in 333°K (140'Y) deionized
water. The specimen configuration is shown in Figure 34. The specimen con-
figuration is similar to the previously-tested single-lap-joint specimens with
thicker adherends. The main differences other than the thickness are that,
for the thin-adherend specimens, the width of the base of the tee-member was W
reduced from 76 nm (3.0 in.) to 61 mm (2.4 in.), and tite overlap length
between the doubler and each skin member was increased from 76 mm (3.0 in.) to
75
-~ A

BONDLINE CRACK LENGTH a, mm
10 20 30 40 50 60 70I I I I I II
5
0.8 -
4
BONDLINE
0. C-
C CRACK 00.6 - C
P44- W
z <
0w uj
wj
~0.4 -IJ30
-A-
a 2, _
0.2 SO
0- I I I
N nq
; L 0 MEASURED COMPLIANCE
o FOR KNOWN INITIAL
' CRACKS -
0 1.0 2.0 3.0 aBONDLINE CRACK LENGTH a, in.
Figure 33. Compliance of Sl specimen as computed byfinite element analyses
76
N

-J
wO U W -J
OZ ~ U.
C) 0 2W
(30 u0
C-C)
0
O <2rLt) CO)J4T WVto 0 0 -V -
ZNI xID > - 0 -It cnz C"" i '
M- >: wUU
CDO
0. 0 u. dcc
I-- u. >0~Y -- - o
N00 0
LL 0 WW+ jWw U
4u - 0lUJ-ow - coC) j . J wc
77 L WU '
LU LL

102 mm (4.0 in.). Specimens A and B contained no preflaws in the bondline;
C and D each contained an across-the-width flaw extending 8 mm (0.3 in.) alongthe bondline from the gap of the joint; and E and F each contained a 13 mm.
(0.5 in.)-width flaw extending axially from the gap all the way to one edge of
the doubler. Fabrication procedures of these specimens were similar to that
discussed in subsection 2.1.
Figure 35 shows a profile view of the specimen in the 200 kip MTS
machine. Axial cyclic loading was applied through rigid grip plates attached
to either end of the specimen with a 31.2 mm (1.25-in.) diameter central
alignment pin and six 19.2 mm (0.75--in.) bolts, tightened so that all load
was introduced by friction. Lateral deflections were constrained by a pair
of flex rods connecting the vertical leg of the tee to a steel channel beam
that was mounted across the columns of the MTS machine.
Deionized water was pumped continuously from the thermostatically-controlled
tank (bottom of Figure 35(a)) through a plexiglass box attached to the test
section of the specimen. The plexiglass box was fastened directly to the
specimen with water-resistant RTV silicone rubber adhesive sealant. The
temperature as measured in the box (Figure 36(a)) was maintained within l.1 K
(20F) of the required temperature. The specimen was always oriented with the
preflaw on tI. bottom and totally immersed in the hot water. _
Crack length was monitored indirectly by a compliance method. Load cycling
was stopped intermittently and the water was drained from the box so that the
displacement gage could be put across the gap of the joint as in Figure 36(b).
The deflection for a tensile load of 49.4 kN (11.2 kip) had been calculated
as a fu..ction of the crack length in the bondline by a nonlinear finite ele-
ment analysi-. and plotted in Figure 37. The analysis assumed that the bond-
line, crack would grow as a single, uniform across-the-width crack originating
at the gap of the joint.
78

= -- -- - 1
-Az-i1
_ IO_ _ _ a
C) 1MT)
C.Li sof9
79U

(a) ~ ~ ~ r Duigftguyln
ww s
( ) opd fmauring diguec lacg n
Figure 36. Environmentalbo an dip centg e
80

10 20 30 40 50 60 701.4 1 1 1 8
BONDLINE CRACK LENGTH a, mm
1.2 0 FINITE ELEMENT 7
* 6
0 1.0.j-J
4 zx 0
0 o 3'e 0
0.8LTHIN ADHEREND C
00X 4
:-'-
c0.6 z2 2
td 3scmue yfnieeeetmto
Q - -* -- THICK ADHEREND0
4
il~d 0
2
0.2 DISPLACEMENTSMEASURED ACROSSTHE GAP
0.0 1.0 2.0 3.0BONDLINE CRACK LENGTH, a, in.
Figure 37. Compliance of thin-aciherend SLJ specimenas computed by finite element method
81

2 ANALYSIS OF THE SINGLE LAP JOINT SPECIMENS
Analytical crack growth estimates were obtained for these tests using a
linear elastic fracture mechanics (LEFM) approach. A finite element analysis
was used to compute macroscopic beniing and axial stresses. From these, the
approximate Mode I and Mode II components of strain energy release rate and
subsequently, the effective strain energy release rate, were calculated.
Crack growth in the adhesive layer was then estimated using baseline fatigue
crack growth data for the adhesive. Analysis results for the thick adherend
and the thin adherend single lap joint specimens are presented separately.
A finite element analysis of both SLJ specimen geometries was conducted
for two reasons. One was to compute the distribution of bending and axial
stresses, which provided a basis for estimating Wl and W , the Mode I and II
components of the strain energy release rate. The second was to calculate -
the compliance for various bondline crack lengths, which was used to estimate
crack lengths in the tests as discussed before. IThe predicted crack growth rates were calculated from crack-tip bending =
moments using the following procedure:
* At a given debod length, the Mode I strain energy release rate, I ,was computed from the bending moment.
o The Mode II strain energy release rate,s:_, for the test specimenwas assumed to be equal to the value ofl induced in a cracked lap
shear (CLS) specimen of the same adherends and subjected to the sameamount of axial load and bending moment.
* Values of AW and %T for the single-lap-joint specimen were used toobtain the eifective strain energy release rate,A e from Equation(36), Section III.
o The predicted crack growth ratez were calculated using appropriate base-line data, as shown in Figure 30 withA&eff replacing A .
ef
2.1 Thick Adherend Specimens
The finite element model of the thick adherend specimen is depicted in
Figure 38. Very simple modeling was used. The adherends (tee, splice plate,
and skin) were modeled as one dimensional axial and beam members, located in
the midplane of each structural member. Axial and shear members were used to
82
_-_

LLI w
IU NiLI-
CC _ mLU W
Ju Z Lu
J) 0- 0u
lcD
00
0V 0C"U
Na
Nucl I-0.
1% 0
FE: i
11
us -.~c_ _ _ _
_____ Z 0
0i~
IS _ 3*w ~

model the normal and shear capability of the adhesive. The axial member
modeling the lateral constraint contained the proper stiffness of the actual
lateral support fixtures used in tests.
Calculations of bending and axial stresses in the adherends and displace-
ment at the gap of the joint were dene at a sequence of crack lengths. The
crack was simulated by disconnecting axial and shear members representing
the adhesive.
Equation (17) of Section II was used to estimate for the thick-adherend
test specimens at the maximum applied load, using the computed values of bend-
ing moment induced in the splice plate. As shown in Figure 39, the bending
moments in the splice plate are fairly uniform until the crack length reaches
38 mm (1.5 in.). At this point the crack tip is located just below the edge
of the tee, and the abrupt change in stiffness appears to drastically affect
the moment distribution. For larger crack lengths the moment distribution is
nonuniform, but the portion of the distribution between the crack tip and the
edg- of the tee is approximately uniform and was used in Eq. (17) for the
computation of W. To indicate the like'y error due to nonuniformity of bend-
ing moment, two estimates of were made, one using the average bending
moment, the other the peak bending moment at the crack tip. These estimates
are plote in Figure 40.
Inicially, it was felt that ! might be influenced by the finite length
of the doubler. A correction factor was provided by the solution to the prob-
lem shown in Figure 41, a finite length, double-cantilever beam subjected to
uniform bending. For the bonded single lap joint tested specimen, interest is
limited to values of H/(H+P) less than 0.4. In this range, it is clear from
Figure 41 that no correction factor for finite length is needed.
The l component of the SLJ specimen was estimated by analogy with the
CLS Specimen. It consisted of two parts. The first part is induced by the
bending moment and can be estimzated using Equation (17) of Section Ii. The
second part is the direct result of the axial load and can be estimated by
subtracting l (Equation (18)) from (Equation (5)). Combining these two
parts, the value of SII is estimated by the equation
84

W"J ±N3WAOWi 9NIaN39
CD w % in M)
I I i2*
i
-4
zi z
000
zz
-r-
1 3-I
0 ~0 0o a (n0 0r- CI CV) U3 C2
nj-U!.LN3WOW ~IONn
z w5

BONDLINE CRACK LENGTH, mm
10 20 30 40 50 60 703.0 j
0.6
0.52.5
I-0.3
III:
1 1
i 10.2
::0 L
0 2
AVERAGNE CRAKMENTH in
Figur 40. Caclae stanenryreesrtsa
varou bAdiecac egh
0 I 2 8
-ru /odiecak egh
I6 I
1.0 I _
CALCULATEDm-: ... i- - FRO I- " : +

5.0 a
4.5
4.0 U
3.0 L_ _
M =BEND!NG MOMENT K1 3 M971IPER UNIT WIDTH IT ,
COMPUTED FINITE ELEMENT/0 2.0 HESULTS. USING SINGULAR
CRACK - TIP FINITE ELEMENT./B ~ ~PLAIN STRAIN ANI) PLANE flSTRESS, L/H = 8A
~ 3~HvW1.5
1.25- K11K0= 1.03/
0.8=I 0.98/
0.6 PLANE STRESS
1! 0.1 0.2 0.3 0.4 0.5 0.6 0.7
HI(H + 1)_
Figure 41. Finite length correction 'actor f or asplit bean Subj4ected to uniform bending=
87

__- _ _1 -
2~_f t \ [ /t \l,/I/EI 0
( 1 22 k o t o\ 0 ( 3 8 )
20 1l- + VE12 /EI 0
Here the subscripts 0 and 2 refer to the Lhick and thin ends of the CLS speci-
men, respectively. By analogy, 2 refers to the splice plate and 0 refers to
the skin/splice plate laminate. 02 is the average axial stress in the splice
plate and is defined as P/t 2b.
The fatigue data shown in Figure 29 of Section III show that the effect
of Mode II loading can be accounted for by the use of effective strain energy
release rateAeff in place of A . . Values of the estimatedA I , ratios ofef I.
Mii/ (.% + II),AW'eff, and the crack growth rates are tabulated in Table 5.
Ccmparisons of analytical estimates and test results are discussed in
subsection 4.
2.2 Thin-Adherend Specimens
The thin-adherend, single-lap-joint specimen was analyzed using the same
analysis procedure as for the thick adherend specimen. Two-dimensional geo-
metrically nonlinear finite element analyses were conducted for this specimen
at 4 debond lengths: a = 0 (the undamaged configuration) and a = 13, 51, and
64 mm (0.5, 2.0, and 2.5 in.), The finite element analyses were conducted for
two purposes. One was to calculate the compliance for various bondline crack
lengths, which will be used to estimate crack lengths during testing. The
second was to provide the distribution of bending moment in the doubler, which
provides a basis for estimating the Mode I and Mode II strain energy release
rates,WI and I" The estimated 9I and W' values were used to provide crack
growth predictionc, prior to testing these specimens, as a further demonstra-
tion of the applicability of fracture mechanics methodology to bondline failure.
The dashed line in Figure 37 is the compliance curve for this specimen
subjected to an applied axial skin stress of 69 MPa (10 ksi). Compared to
similar results for the thick-adherend specimen, the thin-adherend specimen
is more flexible, except possibly when the specimen is undamaged,
88

V)*-:j A L Ln -4T .. . --T Ln ' D "D --T~ -T
I I I I I I I I I I I 1 0 1 C )0 0 0 0 0 C0 0 0) 0 0 0 0 00.-4 a- -
4 .-I r -q -I i a-I a-I r--I -4 - - -
m' (ON CN - %D N OO 07% ON C1 - 00' -IN IT
a-i M 0 r-i -r Nq 00 %0 a-i m m'~ Nm 0 Ln m~
] 0 CD 0 0000(D00C0 0 00 00 0 00
'ON NAco -Z Ln -Z O ON -4 \0 r- -Z
Ull L O Ln co cn 0O a-I LA in LA N r -I - wlA
E-4 C') a-I 0 0 CO 0' C' E-' LA C 0 0 0
z
E- H 0 -:r LA) Nq - 0) -r co Z CO -t %,o CO LA) 0'- 0' -
~~~~ r- ' a4 C ' - %0 F- a% w' CO m ~ 0
a- ~ C C C4 LA - ~ - C4~ N4 N, N -
1-3 ~ ~ C' ON% 0 CO IT 00 ' t 0 a -I r, 1 -1 a%4 C'
1~ rz zt'a LA) a% cy) N, v) a-i T ON 0 a-I 0' 0 %0 0'
00 00 0 rg 00000000 .
>4c Z> ,C 0 0 C
z
S LA) LA LA) LA LA L) -T -7 PQ LA) LIA U LA) LA) LA, I
0 0
H F4E-
w r4%D aI ~ ~ 0 -' LA N IT (') LAC) N- ~ 0' 1a
a-I ON LA C - 'T -IT ) a- 0 * - 0 0'%
Nn: 1 LA 0 CO c 0 %D'T It 00 C LA O %D ) C 0-N CO
94E4r- cnl i -T LA 'ON m- m- 43N w 0' CO CO ' Z
C) cnC 4 N 1 N * N 7 - .1- -It m' C %4 N -I a-4 a-I Cl) Ca-)
ON L)0 * LAOC LA a-1I LA ON LAO LA)
00 a-4 a4 a-4 N4 t 00 ai - 4 a-N4
C LA N- - LA a-4 CO LA) 0 LA) r- -T LA a-I CO LA
0 N4 N4 LA 0 C8 0 Cl 0 N N4 LA 0 CO0 o '
H~ N n c') C) LA sOD r-I N c y)(v) LA) %0
89

-a_
The estimated distributions of the bending moment in the doubler for a
stress of 69 MPa (10 ksi) are shown in Figure 42. For the three debond lengths
analyzed, the moment varies gradually throughout the entire debond region. The
approach of using average bending moment values in calculating strain energy
release rates thus becomes more difficult to justify. On the other hand, the
alternative approach of using the bending moment at the crack tip (usually the
maximum value) is still reasonable. For this specimen, the predicted crack
growth rates were calculated from the maximum crack-tip bending moments only.
One purposc of the finite element analysis was to select a stress level
sufficient to induce crack growth in the adhesive layer. Because of geometric
nonlinearity the finite element analysis had to be rerun at several stress
levels each for a set ol debond conditions. The estimation of strain energy
release rates and prediction of crack growth rates were made using the results
of these analyses and following the same procedure as described for the analysis
of the thick adherend single-lap-joint specimen. The estimated strain energy
release rates and crack growth rates at two stress levels and 5 debond lengths
aze shown in Table 6. Note that the effective strain energy release rates
shown are calculated from Equation (37), which include the influence of
WTI. The estimated crack growth rates, also shown in Figure 43, are obtained
from the baseline data in Figure 30 for 333°K (1400F) water immarsion at 3 Hz.
It can be seen from Figure 43 that the predicted crack growth rates
decrease drastically as debond length increases. The predicted rate decreases
almost to its minimum value at a debond length of 31 mm (1.2 in.). The higher
applied load level of 172.38 MPa provides more desirable overall crack growth
rates and a more reasonable test duration, but the peak stress (tension plus
bending) is quite high, about 85 percent of the tensile yield strength of the
adherend. Therefore, a slightly lower applied stress level of 165.48 MPa
(24 ksi) was selected as the test load for the thin-adherend specimens.
Analytical results were interpolated to provide necessary life prediction at
this intermediate load level.
The selected load for these tests is identical to that used for the
thick adherend single-lap-joint specimens tested earlier. The thick adherend
tests had basically the same configuration and lateral support, but the
90
"-:rz ----- == -

W'N 1N3V40A ONICIN38
fMI-
0 f-0
a
aD
0
La 0U,,
pq
Ca
44
EGLo $

TABLE 6. ESTIMATED EFFECTIVE STRAIN ENERGY RELEASE RATES AND CRACKGROWTH RATES, THIN ADHEREND SLJ SPECMENS
]____(a) Applied Axial Skin Stress = 25 ksiDebond A ieffLength da/dN
SkJ/m (b/in) kJ/m (lb/in) jam/cycle (in/cycle)
0.0 0.298 (1.70) 0.59 0.650 (3.71) 31.34 (1233.86)
12.7 (0.5) 0.128 (0.73) 0.70 0.306 (1.75) 0.62 (24.41)
38.1 (1.5) 0.117 (0.67) 0.71 0.284 (1.62) 0.42 (16.54)
50.8 (2.0) 0.151 (0.86) 0.68 0.355 (2.03) 1.34 (52.76)
63.5 (2.5) 0.208 (1.19) 0.63 0.471 (2.69) 5.85 (230.31)
(b) Applied Axial Skin Stress = 20 ksi
i Debond /
Length III e da/dNk 2/m (ib/in) kJ/m (lb/in) 1m/cycle (gin/cycle)
0.0 0.226 (1.29) 0.57 0.483 (2.76) 6.674 (262.76)
12.7 (0.5) 0.096 (0.55) 0.68 0.228 (1.30) 0.134 (5.28)
38.1 (1.5) 0.092 (0.53) 0.68 0.219 (1.25) 0.109 (4.29)
50.8 (2.0) 0.118 (0.67 0.65 0.270 (1.54) 0.323 (12.72)
63.5 (2.5) 0.163 (0.93) 0.61 0.361 (2.06) 1.465 (57.t8)
adherends were three times as thick and the test environment was much milder,
i.e., laboratory air instead of 3330K (1400F) water.
The test lives of the thick adherend specimens ranged from 22,000 to
44,000 cycles. Using a fracture mechanics analysis, a longer life (118,000
cycles) was predicted for thinner specimens subjected to identical fatigue
loads (thus, much higher adherend stresses) and a harsher environment. Com-
parisons between the estimated lives and test data are discussed in subsection 4
92

DEBOND LENGTH, mm
10 20 30 40 60 70
80
602x10 3
40
103
800 20
600 /
400 / 10
////E
C6
S 200
SAIAL= 7 2 . 3 8 MPa 0
0 80 (25 '(so) /2 C2
Cr
0 40 1.0 wUi 0.8
0.4
10
8 UAXIAL- 137.90 MPa(20 ks: / 0.2
6
4 : 1.- 1.0.1
00.5 1.0 1.5 2.0 2.5 3.0
DEBOND LENGTH, in.
AAFigure 43. Estimated crack growth rates at two applied stress levels
93

3 TEST RESIr TS AND DISCUSSIONS
3.1 Thick-Adherend Specimens
Figure 44 shows the total test lives for the six thick adherend specimens.
The specimens with initial flaws failed earlier than the unflawed specimens.
There does not seem to be a significant difference between specimens with
across-the-width initial flaws and those with centered flaws only 51 mm
(2 inches) wide. The latter flaws grew sideways very rapidly so as to become
across-the-width flaws, as determined from ultrasonic measurements.
Scatter was low except for specimens SLJ-5 and SLJ-6,duplicates for "which
the lives differed by a factor of 1.8. Variations by factors of 1.8 are
present throughout the baseline fatigue data given in Figures 27 through 31
of Section III. The scatter should be expected to exceed that of metal fatigue
because, as discussed in Section III, the slopes of the fatigue crack growth
rate (da/dN) curves for structural adhesives are extremely steep compared to
those for metals. One consequence of this steepness of slope is a greater
sensitivity of da/dN to small variations in stress or strength, Usin-g n = 5.57
in Equation (34), one finds that a 5,4 percent difference in the ratio of the
applied stress to the crack growth resistance would cause the factor of 1.8
difference in crack growth lives observed for specimens SLJ-5 and -6.
Figures 45(a) through 45(e) show the crack-length-versus-cycles data for
all but the first specimen tested, SLJ-4 (for which just one data point was
obtained, a = 25 mm (1.0 in.) at N = 25,000 cycles by the ultrasonic method).
Debond length by the ultrasonic technique is defined as the debond area
divided by specimen width. Since many of the flaws grew as uniform across-
the-width flaws, this is in general an adequate definition. However, in
Specimen SLJ-1 (initially unflawed) the debond flaw initiated at one corner
and tended to grow faster along one edge than the other. Hence the area-to-
width ratio definition of debond length may have tended to underestimate the
true severity of the flaw. This would account for the poor correlation between
ultrasonic and compliance-measured crack sizes for this specimen shown in
Figure 45(a). For SLJ-2 and SLJ-5 the agreement was much better.
94

44.1 4.
40.1401
Of 34.2
30 29.7
0
U U.
00
0
O to M
CoCaC
z -z
wa. W WU5
a. '4a. a
NO INITIAL 12.7 mm x 50.8 mm 12.7 mm x WIDTHDAMAGE INITIAL FLAW INITIAL FLAW
Figure 44. Total lives of SLJ specimens with or withoutinitial bondline flaws
95

-- G COMPLIANCE -4# COMPLIANCE -60--0ULTRASONIC -0-0UTAOI
z 40,
~~~~ 20o 0 0 2 0 5
~0 10 20 30 40 TOSNSO YLso
THOUSANDS OF CYCLES(a) SPECIMEN SLJ-l (b) SFECIMEN SLj-2
-5--0 ULTRASONIC 6 1 0
00 0 2040 l
0 Ii
-A.0 -10 2 0 4
THOUANDSOF CCLESTHOUSANDS OF CYCLES(d)~~~~~ SPECIMEN SLJ- e PCIE 3-
V43e4. odiecrc rwh itre
3.0 1 1 3. 1 16
EIE OMLINC

Figure 46 shows a summary of crar* growth rates for all six specimens
as a function of crack size. The crack sizes and rates shown are as deter-
mined by both the ultrasonic measurements and the compliance measurements.
The magnitude of scatter for the compliance measurement method is smaller
than for the ultrasonic method, and the compliance method is less expensive
to use in the laboratory. However, the information on flaw shape and loca-
tion which was obtained ultrasonically cannot be obtained by the compliance
method.
Growth rates of the bondline flaws in the test specimens were estimated
from Figure 27; howeverA-eff defined in Equation (37) was used in place of
AV[. The resulting crack growth rate estimates are compared to the empirical
data in Figure 47. Two sets of estimates are shown; one based on the average
bending moments and one based on the maximum moments. Of these, the rates
estimated using maximum bending moment tended to agree more closely with the
actual rates.
3.2 Thin-Adherend Specimens
Test results for the six thin adherend specimens fatigue tested in 3330K(140°F) water are summarized in T - -" 7. Specimen B, with no bondline preflaw,
failed in the bondline at 48,297 a. s. In Specimen C, significant growth of
the bondline crack was measured but :he final failure occurred in the skin at
53,976 cycles, right at the stress concentration at the end of the doubler.
At least one fatigue crack origin could be clearly identified when the fracture
surface of the failed skin member was visually examined.
To reduce this stress concentration the edges of the doubler were beveled
on Specimens A, D, and F. Specimen D failed at 57,227 cycles due to fatigue
failure of the doubler. However, extensive adhesive cracking was evident from
compliance measurements. Specimen F and Specimen A both failed in the bond-
line at 58,338 and 57,398 cycles, respectively. No anomalies were observed
for these two specimens.
Specimen E had a longitudinal flaw it. the bondline but failed in the
doubler across the split line after only 8599 cycles. The doubler failure was
expected in this specimen because the split line had been machined too deep,
97

AVG TOTAL CRACK LENGTH, mmn10 20 30 40 s0 60 70
350 ~.to
SYMBOL SPEC NO. PREFLAW
0 SLJ-1 NONEo8<> SL2 NONE300 KA SLJ-5 12.7 mm x5028mm
0 SLJ-6 1. mx5. i7o 51.-3 12.7 x WIDTHI OPEN VOINTS-ULTRASONIC MEASUREMENTS
us SOLID POINTS-COMPLIANCE MEASUREMENTSo
'p6
02
00
-4 -:
0 K> 0~150-0
430
000
001=10 1.0J~ A. .
AVG TOTAL CRACK LEN~GTH, inl.
Figure 46. Crack growth rate by ultrasonic and compliance measurementS
98

DE1OND LENGTH, mm
0 1 2 3 4 5 6 7
8 -2
6DATA POINTS
4 PREFLAW 10-1
SLi-1 NONE 8
6
2 SLI-2 NONE4
A su-s 12.7 mm x 50-8 mm(0.5 in. x 2.0 in.)
e ANALYTICAL ESTIMATE 2= - 6BASED ON MAXIUM
z E
Uii
N 2
wANALYTICAL 4ESTIMATEI
q 04BASEDON~AVERAGEI
8 \MOMENT
61"
IN, 162-
10-51
6I
4 I 11 1040.0 1.0 2.0 3.0
DEBOND LENGTH, in.
Figure 47. Estimated and empirical crack growth rates
99

TABLE 7. TEST LIVES, THIN-ADHEREND SINGLE-LAP JOINT
InitialSpecimen Flaw
ID Condition Failure Description
A (6)* Unflawed At 57,398 cycles. Failure in adhesive.
B (1) At 48,297 cycles. Grip hole partially crackedat about 40,000 cycles. Failure in adhesivelayer.
C (2) 7.6 mm (0.3 in.) At 53,976 cycles. Failure in skin after exten-across-the- sive debonding.width flaw (oneside only)
D (4) At 57,227 cycles. Failure in doubler afterextensive debonding.
E (3) 12.7 mm (0.5 in.) At 8,599 cycles. Failure in doubler due tolongitudinal known machining defect.flaw extends
~through the
F (5) overlap region At 58,338 cycles. Failure in adhesive layer.
4(one side only)
* Numbers in parentheses indicate order of testing.
damaging the doubler at the edge of the specimen. It had been hoped, however,
that the specimen would last longer than it did and thus provide more data on
- flaw growth in the bondline. No fatigue crack origins could be visually
identified. However, approximately 50 to 75 mm (2 to 3 in.) of fracture sur-
face (beginning at one edge of the specimen where machining damage occurred)
was found to exhibit the typical flat appearance of metal fatigue cracking.
These specimens were very similar in their configuration to the thick-
adherend single-lap joints tested earlier, and the test fixturing used was
identical. Also, the identical magnitude of applied load per unit width was
used. This means that the nominal tensile stress in the metal was increased
by a factor of 3.0 by virtue of reducing the adherend thickness to one-third
its prior value. Furthermore, the hot water environment is much more detri-
mental than laboratory air. Therefore, on a superficial examination one would
expect shorter lives in the thin-adherend specimen. However, analysis prior
100

to testing indicated a lower reduced bending moment in the thin-adherend
specimen to such an extent that the lives predicted by a fracture mechanics
analysis would be longer. These predictions are supported by the fact that
all the thin-adherend specimens (except Specimen E) had longer test lives than
any of the six thick-adherend specimens tested earlier.
The exposed adhesive was visually examined after failure of Specimen A,
B and r. It was possible to identify and separate the fatigue cracks and the
static fracture, since the fracture appearances on the exposed adhesive layer
are distinctively different. In addition, ultrasonic examinations were con-
ducted of all failed specimens. It is reasonable to assume that all hidden
bondline cracks were fatigue induced, not statically induced during the failure
elsewhere in the specimen. Figures 48 to 53 show the extent of adhesive fatigue
cracking detected visually and ultrasonically. The following can be observed:
• All specimens except Specimen E had more than one bondline crack atthe time of failure.
4 The reproducibility of the final adhesive crack configuration wasextremely good for duplicate specimens with identical initial flaws.
Crack front shapes of the final bondline cracks indicate that growthwas most rapid along the free edges of the specimens. In Specimen Fgrowth was most rapid adjacent to the longitudinal strip of teflontape.
Figure 54 shows the bondline crack growth histories of all the specimens
except Specimen E. The crack length shown is an apparent length as measured
indirectly by the compliance method. In the compliance method the measured
opening displacement of the gap of the joint is correlated to an apparent bond-
line crack size using the results from finite element analyses of the specimen
with an across-the-width bondline crack of some selected length extending from
one side of the gap of the joint.
The early apparent flaw growth rates of the unflawed specimens A and B
were significantly faster than those of the specimens with initial flaws. The
I1i01
.4!

=__ __..... ..... _ _ _ _ _ __.....
DISTANCE FROM SPLIT LINE, in.
5 4 3 2 1 0 1 2 3 4 5
' ' II ' i '
100 50 0 50 100
DISTANCE FROM SPLIT LINE, mm
I 227mm
I ( in.)
STATIC FAILURE
FATIGUE DEBOND==E ERIND FATIGUE DEBOND
DETERMINED DETERMINEDFROM POST-TEST -TESTULTRASONIC FRACTURE SURFACEEXAMINATION 31 mm EXAMINATION
(1.2 in.) 102Emm
(4 in.)
Figure 48. Final damage configuration, specimen A, No initial flaw
102
- -

DISTANCE FROM SPLIT LINE, in.
5 4 3 2 1 0 1 2 3 4 5PI I
100 50 0 so 100
DISTANCE FROM SPLIT LINE, mm
EXTENT OFEXETOFAIUFATIGUE DEBOND. ETENDT DFTRIUEDDETERMINED FROD DRATURMEDIFROM ULTRASONICFRMRAT E
EXAINAI4 SURFACE EXAMINATION
(9 in.
STATIC FAILURE__ REGION
31 mm(4i)
(1.2 in) 102 mm
Figure 49, Final damage configuration, specimen B. No initial flaw
103
MILL- - - -__

DISTANCE FROM SPLIT LINE, in
5 4 3 2 1 0 1 2 3 4 5
10 0 0 50 100
DISTANCE FROM SPLIT LINE, mmn
FAIGHUE DEBONDDETERMINED IIFROM ULTRA-SON IC EXAM INA-I
I 227 mmI I I(9 in.)
I IINITIAL ACROSS-THE. ,>FATIGUE FAILURE
(1.2 in.) 102m
(4 in.)
Figure 50. Final damage configuration, specimen C. Initial flawI is ai 7.6 mm (0.3 in.L) deep across-the-width flaw
104

Ei DiSTANCE FROM SPLIT LINE, in.
100 50 0 50 100
DISTANCE FROM SPLIT LINE, mm
FATIGUE DEBOND FAIU DBNDETERMINEDI1/FTGEDODFROM POST-TEST IIDTRIE
ULTRASNIC IFROM POST-TEST
EXAMINATION IUTAOII I EXAM INATION
I I 227 mm
(9 in.)
\FATIGUE FAILUREINITIAL ACROSS-THE. OF DOUBLER
31 mm(1.2i 102 mm
Figure 51. Final damage configuration, specimen D. Initial flawis a 7.6 imm (0.3 in) deep across-the-width flaw
105
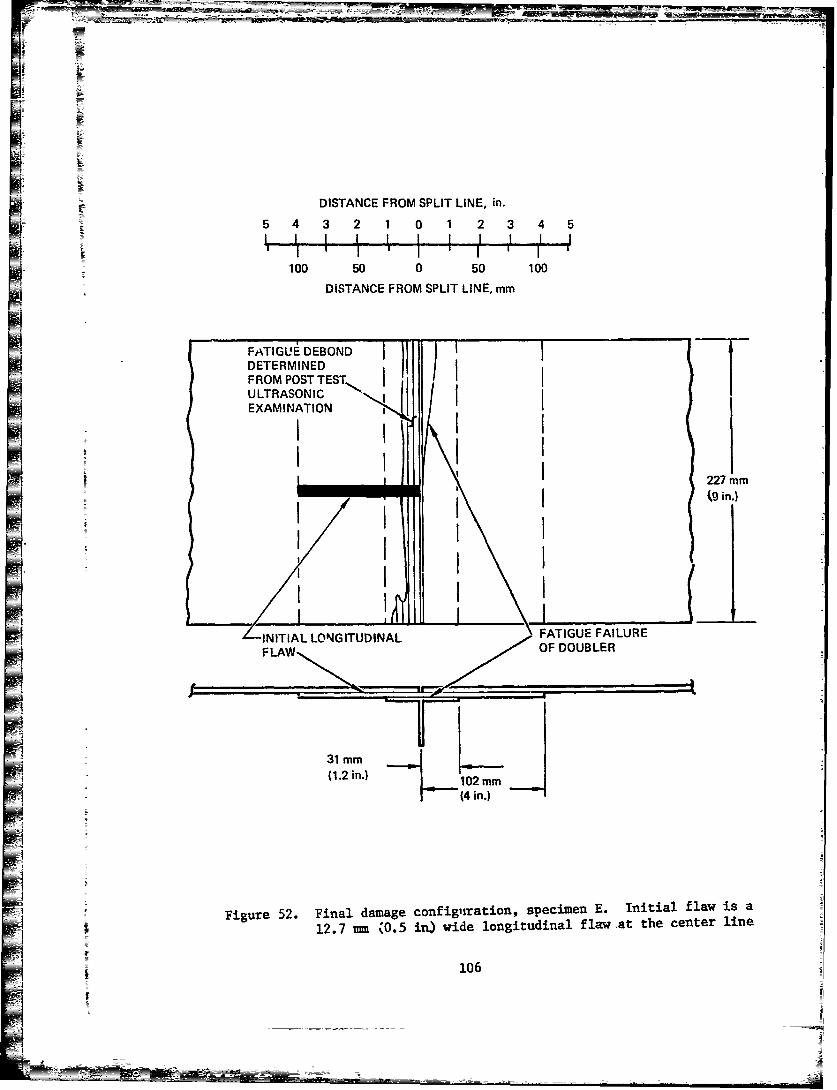
DISTANCE FROM SPLIT LINE. in.
5 4 3 2 1 0 1 2 3 4 5
100 50 0 50 100
DISTANCE FROM SPLIT LINE, mm
FATIGIJE DEBOND I- -
DETERMINED IFROM POST TEST,, lULTRASONIC '
EXAMINATION
I 227 mm(9 in.)
/INITIAL LONGITUDINAL FATIGUE FAILUREFLA OF DOUBLER
31 mm(1.2 in.) .102 mm
(4 in.)
Figure 52. Final damage confignration, specimen E. Initial flaw is a
12.7 (m0.5 in) wide longitudinal flaw at the center line
106
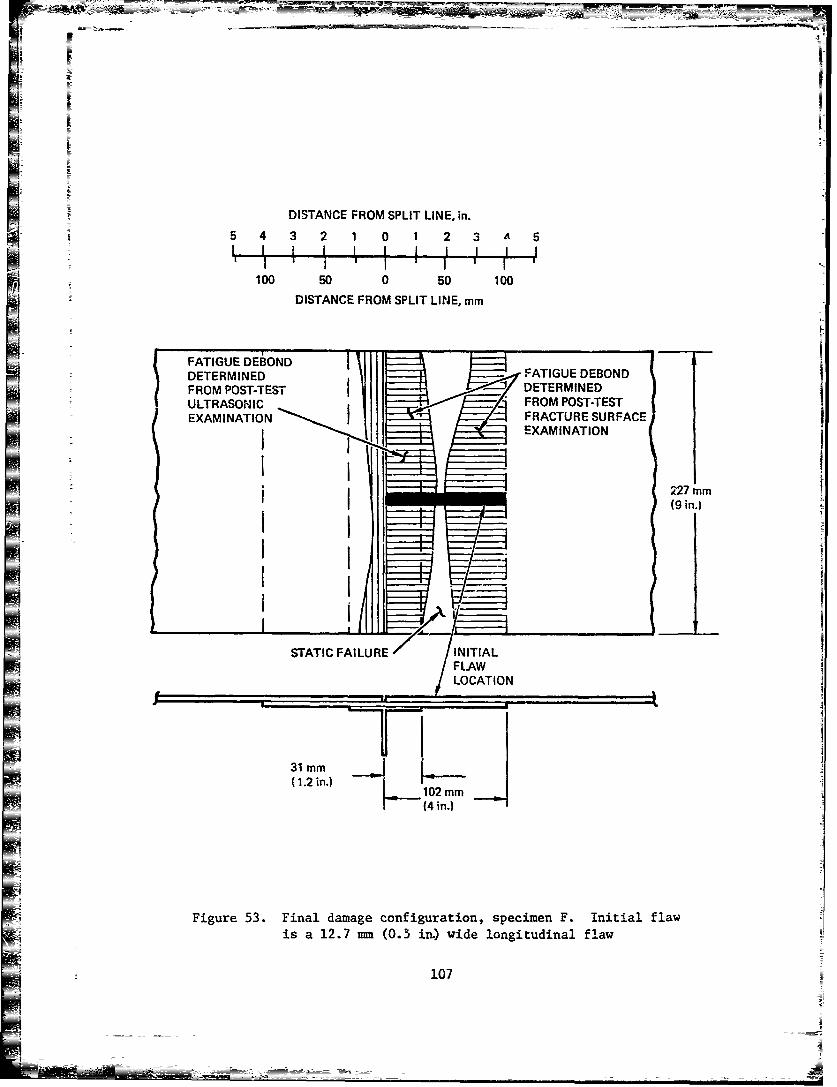
DISTANCE FROM SPLIT LINE, in.
5 4 3 2 1 0 1 2 3 5
DISTANCE FROM SPLIT LINE, mm
I FROM I FATIGUE DEBOND22m
mm m(49 in.)
31107

w'3ZIS )I3V803 NI-GNOS iLN3VddV[
0o to 0 ID)141) C1
0 0
LUU0
w 14
=) cr 1LL' Dr
ILL <I 10I
-j c) r-4zCLCL
2J -v U)LLLov54DI
< r :1:) 9
0/ IL 4'
CN Ill w
a-S-
C-) 41~uI
0)I
00Z Z Z Z
LnI

probable reason is that there were three or four separate bondline cracks in
Specimens A and B but only two in preflawed Specimens C and D. Preflawed
= Specimen F also contained three cracks when it failed, but judging from the
shape of its growth curve in Figure 54 the third crack may not have originated
until after perhaps 45,000 cycles.
There is a notable absence of scatter in Figure 54 for specimens with
similar initial flaws; that is, data from Specimens C and D matched each other
as did data from Specimens A and B. The initial deflections were essentially
equal; the growth curves coincided; and the final crack conditions at failure
were similar in size and shape.
it must be pointed out that the data for Specimen A as plotted in Fig-
ure 54 have been adjusted. The Specimen A deflections as recorded in the raw
data were lower than the deflections for Specimen B by a uniform factor of 2.0.
These raw data when converted to crack length indicated unreasonably low
crack sizes and growth rates, such as a final adhesive crack at failure of
only 18 mm (0.7 in.). After review of all the facts and discussion with the
operator who performed the tests, it is judged to be exceedingly likely that
the calibration setting on the displacement gage plotter was half of the value
recorded, and that the results for Specimen A as adjusted and as plotted in
Figure 54 are correct.
The dashed line in Figure 54 is a crack growth prediction for the six
test specimens. The predicted crack growth life was about twice the actual
lives. In the prediction, it was assumed that only one bondline crack would
grow. In the actual specimens up to four separate bondline cracks grew, two
on each side of the split line. With two cracks propagating simultaneously
across the same fracture surface, the time to fracture would be about half as
long as in the single crack case. This is the approximate error in these
predictions.
i109
AI
I

. ..w. --i
IA
SECTION V
CONCLUSIONS AND RECOMMENDATIONS
Fracture mechanics methodology has been developed and experimentally
demonstrated for the prediction of the growth of bondline flaws in adhesively
bonded structure. This work is considered to be an initial step toward pro-
viding the technology required to assess the influence of possible pre-existing
bondline flaws on the structural integrity of aluminum adhesively bonded
fuselage structure.
Test procedures and analytical relationships for the Cracked Lap Shear
(CLS) specimen are fully developed. The ratio2I/ for this specimen is
about 0.2, which is typical of many structural applications involving large
area bonds. (The exact value of (i/depends upon relative adherend thickness
and whether or not the specimen is side notched.) The value of e is indepen-
dent of crack length, which simplifies the monitoring of tests. The specimen
can be machined from large area bonded plates which are cured under exactly-A
the same conditions as used for the structure, a feature not possible with the
Mode I Contoured Double Cantilever Beam (CDCB) specimen. The CLS specimen as
used is very long to maximize the applicability of a mathematical analysis
which ignores end effects. Side notching has been a successful way to increase
Athe stresses in the bondline so as to induce bondline cracking prior to metal
failure. The use of the CLS specimen is strongly recommended for mixed Mode I
and Mode II fracture mechanics testing of structural adhesives.
A Mode III fracture mechanics specimen for bondline cracks, the Modified
Zero K-Gradient (MZKG) specimen, was increasing-load tested and fatigue tested.
The cracks did propagate; however, the specimen has an iundetermined amount
of Mode I loading. Further study of the Mode III testing problem is recommended,
especially to develop a mathematical analysis to estimate the K component in
the MZKG specimen.
X111-- ---+-- iii- - =---'------ --- ~ --

Increasing-load tests of 36 CDCB specimens resulted in a mea I value
2 Iof 2.19 kJ/m (12.5 lb/in) with a standard deviation of 0.26 %1.5 lb/in)
for the AF-55S adhesive system. Limited increasing load eata - side-
notched CLS specimens suggest that the addition of large aimot-cs of lI loading
does not significantly reduce the critical value of 'I at the ons.. Crack
instability. Because this high value of ic is maintained fo, mixed modeIc
loading, structure bonded with AF-55S adhesive exhibits a very high resistance
4to crack growth in the adhesive layer when subjected to a monotonically
increasing load in room temperature air. However, in Pure Mode I, fatigue
crack propagation of bondline cracks can occur at values of L /i ofI IC
0.1 or less, and the Mode II component has a definite detrimental effect on
da/dN. Therefore, fatigue (and also environmentally-induced crack growth)
tend to be the critical conditions for the adhesive system. It is recom-
mended that greater emphasis be placed on fatigue and environmental effects
in the fracture mechanics testing of adhesives.
Mode I stress corrosion cracking data for AF-55S adhesive and BR-127A
primer in 3330K (140°F) water appear to show a strong dependence on adherend
Wsurface treatment method. Specimens prepared by FPL etch failed near the
metal/primer interface. Specimens prepared by the Phosphoric Acid Anodize
process failed cohesively within the adhesive, and the crack growth rates
were up to 3 orders of magnitude slower at the same sustained value of (II*
It was not possib2e to obtain a confident estimate of the threshold value of
ISCC, due to practical limitations on test time.
The most important loading variable in the propagation of a bondline
crack is cI. the Mode I component of strain energy release rate. However,
fatigue testing of CDCB and CLS specimens has shown a significant effect of
on da/dN. When da/dN data were plotted as functions of A6 only, the
CLS data were segregated to the left of the CDCB data (that is, at higher
da/eN values for the same value of A',-). Based on these data an effective
strain energy release rate, ff' was defined in Equation (37) to account
for the interaction of . and 4I on the fatigue crack growth rate in AF-55S
adhesive. The empirical relationships between da/dN and A94 obtained from
112
__ _ _ _£

Mode I testing can then be extended to mixed Modes I and II by replacing
with -f. For other adhesives a slightly modified definition of &T,I eff eff
may be needed, but the same general approach is expected to apply. In future
testing of other adhesive systems it is recommended to test both Pure Mode !
specimens and mixed-mode CLS specimens in fatigue and establish a specific
definition of eff for use in data interpolation.
The slope of the plot of log(da/dN) versus log("eff) for adhesives is
much steeper than that for metallic materials. This means that small changes
in sLress cause large changes in crack growth rate. Furthermore, small
errors in estimated stress cause large errors in estimated crack growth life.
This makes it difficult to design for finite life. Thus, estimation of bIh ,
Z1 the no-growth threshold, is iecommended as an important design parameter.
Crack growth threshold data are expensive to obtain because of the long
test times required. This is even more true in adhesives than in metals
because the adhesive is time dependent (so high-frequency values of 0 ith =ay
be misleading), ard because the increment of crack growth required for a
confident reading of da/dN is substantially longer in adhesives than
in metals. It is therefore recommended to estimate Ait by linearly extrapo-'Ith
lating the da/dN curve downward in log-log space to a crack growth rate of
1 m per year (1 inch per 25 years). Although probably conservative, this
procedure tends to give a usable threshold value, by virtue of the steepness
of slope of the da/dN curve.
The cvclic frequency effect on daidN (particularly in laboratory air) is
stronger for bondiine cra:ks than is typical for crachs in zietal. Thus,
laboratory testing at high cyclic frequency has at least two drawbacks. First,
the use of da/dN curves obtained at high frequency for prediction of crack
growth in service at a slower frequency would be unconservative. Secondly,
because the metal da/dN properties do not significantly improve with increas-
ing frequency, testing at high frequency may cause metal failure before the
bondline crack growth data can be obtained. For this research, use of a
cyclic frequency of 3 PLt was a good compromise between the inapplicability
of results obtained at high frequency and the costliness of testing at low
frequency. Further study of time/frequency/environment interaction effects
113

and extended-time da/dN testing of adhesives is recommended to determine
general gu Cl=z f._ selection of cyclic test -e:uencies.
Crack growth rates from fatigue tests in 333°K (140°F) water were
significantly faster than in laboratory air. Some fazigue testing in the
extremes of the anticipated service environment is therefore recomended to
obtain applicable baseline data for prediction.
Even with a preflaw in the adhesive layer there is a tendency for bonded
thin-sheet structure to fail in the adherend. It is important to exmine the
-conditions for crack growth in the bondline, even though the structural
configurations considered lie outside the usual usage regime in design, so
that margins of safety can be quantified. The following means were u3ed in
the simulated structural tests to increase the tendency for the bondline
crack to propagate ithout adherend yielding:
* Increase the adherend thickness
increase 4 by increasing the induced bending --oent at the crack5ttip
* Load in fatigue rather than by a single large increasing load
* Use a warm, moist environment.
The use of these means was successful in that nine of the 12 simulated structural
specimens failed by fatigue crack growth in the bondline.The bonded structural single lap joints exhibited very little sensitivity
to initial flaw size. Some seci me ns were unflawed and so-e_- had in4tial i
across-the-width bondline flaws. The lives of all thick adherend specimenswere wit-hinm a --fator of ^4.0 of one another. Except for specim en E which
failed prematurely due to an inadvertent mchining flaw in the metal doubler,
the lives of the thin adherend specimens were within a factor of 1.21 of one
another. Yor the single lap joint geometry, the stress concentratf-ov at
the gap of the joint is high, so a -all flaw originating there grows rapidly
at first and then deceierates. This phenomenon leads to crack growth
lifetim-es that are insensitive to fla- c;-, 1nere =ay be other - eA
structural configurations with flaw size sensitivity re similar to that of
conventional metal structure with cracks in the metal. Further consideration
I114

of flaw sensitivity is recommended to learn more about the importance of
the initial size of bondline flaws.
Since the cracks could not be visually monitored, wo methods of flaw
growth monitoring were used in the structural tests, a direct contact ultra-
sonic method and a compliance method. The ultrasonic method utilized trans--
ducers in direct contact with the specimen. The compliance method measured
periodically the opening displacement of the gap of the joint and comparcA it
to finite-element-computed displ.ement estimates for a series of assumed
crack lengths. The compliance method was more reliable and less expensive
to use than the ultrasonic method, but the information on flaw shape and
location obtained ultrasonically cannot be obtained by the compliance method;
A fracture mecharics method for predicting the growth of bondline flaws
was demonstrated and evaluated. A finite element analysis was used to
compute benuing and axial stresses. From these, approximate values of '
(I and Aef were estimated. Crack growth in the adhesive layer was'II eff
I then estimated using the baseline da/dN data. Calculations for the thick
adherend specimens were completed after testing. However, those for the thin
adherend specimens were done prior to testing. The predicted crack growth
lives were about twice the actual lives. In the prediction it was assumed
that only one crack would grow, but in the actual specimens two cracks
propagated simultaneously in the same fracture surface. This could account
for the factor of 2 error in the prediction. However, in light of the sensi-
tivity of the adhesive crack growth process to small variations in estimated
stress, larger errors than a factor of 2 could reasonably be expected for
crack growth life predictions.
Continued efforts are recommended to apply linear elastic fracture
mechanics theory for predicting the growth of bondline cracks in structural
adhesive joints. As a continuation of the work reported herein, research is
now in progress to extend the results to be applicable to the PABST program.
Baseline data are being generated and the methodology is being tested using
the selected PABST adhesive, FM-73. This work will demonstrate the generality
of the baseline testing and analytical methods and will provide data speci-
j fically applicable to the PABST program. Further research will be required to
115

_
extend MIL-A-83444 to apply it to bondline flaws. These future efforts should
include development of criteria for initial flaw size and type, and evaluation
of the impact of such criteria on the design of bonded structure.
71
LI
I
I
116

REFERENCES
1. Adkinsson, R.E., and Deneff, G.V., "Analytical Investigation of MediumSTOL Transport Structural Concepts," Douglas Aircraft Company, McDonnellDouglas Corp., Technical Report AFFDL-TR-74-109, Volume 1, AD-8005-818,N7S-28060, August 1974.
2. McCarty, J.E., "Advanced Metallic Cargo Fuselage Design for ImprovedCost, Weight, and Integrity," Boeing Commercial Airplane Company,Technical Report AFFDL-TR-73-53, June 1.973.
3. Ripling, E.J., Mostovoy, S., and Patrick, R.L., "Application of FractureMechanics to Adhesive Joints", STP 360, ASTM (1963).
4. Ripling, E.J., Mostovoy, S., and Patrick, R.L., "Measuring FractureToughness of Adhesive Joints", Materials Res. and Stds., ASTM, Vol. 64,- No. 3 (1964).
5. Mostovoy, S., Crosley, P.B., Ripling, E.J., "Use of Crack-Line LoadedSpecimens for Measuring Plane-Strain Fracture Toughness", J. of
Materials, Vol. 2, No. 3, ASTM, (1967).
6. Ripling, E.J., Corten, H.T., and Mostovoy, S., "Fracture Mechanics:K-A A Tool for Evaluating Structural Adhesives", J. Adhesion, Vol. 3,
pp 107-123 (1971). (Also published in SAMPE Journal, 1970.)
7. Mcstovoy, S. and Ripling, E.J., "Fracturing Characteristics of AdhesiveJoints," Final Report, Contract No. N00019-75-C-0271, for the periodJanuary 16, 1975 through January 16, 1976, Naval Air Systems Command.
T 8. Clark, H.T., "Definition and Nondestructive Detection of CriticalIAdhesive Bond-Line Flaws," PABST Industry Review Book 2, DouglasAircraft Company, McDonnell Douglas Corporation, Long Beach, Calif.
Oct. 5-7, 1976.
9. Hart-Smith, L.J., "Analysis of Bonded Joints," PABST Industry ReviewBook 3, Douglas Aircraft Company, McDonnell Douglas Corporation,Long Beach, Calif., Oct. 5-7, 1976.
10. Wang, S.S., Mandell J.F., and McGarry, F.J., "Fracture of AdhesiveJoints," Research Report R76-1, Dept. of Material Science and Engineering,
MIT, Cambridge, Mass., Feb. 1976.
]117
*U.S.Government Printing Office: 1-78 - 757-080/408


![Observations of Decreased Fracture Toughness for …...Another early test geometry, the cracked lap shear (CLS) specimen, was proposed by Brussat et al. [20]. This specimen offers](https://static.fdocuments.net/doc/165x107/5e37bf064bf9c25008487b43/observations-of-decreased-fracture-toughness-for-another-early-test-geometry.jpg)
