Ioana Manafi1*, Daniela Marinescu , Monica Roman and Karen … · 2017-07-22 · International...
16
International Migration ‒ Economic Implications AE Vol. 19 • No. 46 • August 2017 711 MOBILITY IN EUROPE: RECENT TRENDS FROM A CLUSTER ANALYSIS Ioana Manafi 1* , Daniela Marinescu 2 , Monica Roman 3 and Karen Hemming 4 1) 2) 3) The Bucharest University of Economic Studies, Romania 4) Deutsches Jugendinstitut e.V., Halle (Saale), Germany Please cite this article as: Manafi, I., Marinescu, D., Roman, M. and Hemming, K., 2017. Mobility in Europe: Recent Trends from a Cluster Analysis. Amfiteatru Economic, 19(46), pp. 711-726 Article History Received: 30 March 2017 Revised: 28 May 2017 Accepted: 10 June 2017 Abstract During the past decade, Europe was confronted with major changes and events offering large opportunities for mobility. The EU enlargement process, the EU policies regarding youth, the economic crisis affecting national economies on different levels, political instabilities in some European countries, high rates of unemployment or the increasing number of refugees are only a few of the factors influencing net migration in Europe. Based on a set of socio-economic indicators for EU/EFTA countries and cluster analysis, the paper provides an overview of regional differences across European countries, related to migration magnitude in the identified clusters. The obtained clusters are in accordance with previous studies in migration, and appear stable during the period of 2005-2013, with only some exceptions. The analysis revealed three country clusters: EU/EFTA center-receiving countries, EU/EFTA periphery-sending countries and EU/EFTA outlier countries, the names suggesting not only the geographical position within Europe, but the trends in net migration flows during the years. Therewith, the results provide evidence for the persistence of a movement from periphery to center countries, which is correlated with recent flows of mobility in Europe. Keywords: mobility/migration, cluster analysis, migration patterns, sending/receiving countries. JEL Classification: J61, F22, C38, R23 Introduction In the context of an enlarged Europe and an increasing globalization, youth mobility raises more and more interest for both academics and policy makers. The European Union’s vision for youth is based on two approaches: investing in youth and therefore allocating enhanced resources towards developing certain domains within youth policies, and empowering youth, meaning the promotion of youth potential for renewing society and * Corresponding author, Ioana Manafi – [email protected]
Transcript of Ioana Manafi1*, Daniela Marinescu , Monica Roman and Karen … · 2017-07-22 · International...
International Migration ‒ Economic Implications AE
Vol. 19 • No. 46 • August 2017 711
MOBILITY IN EUROPE: RECENT TRENDS FROM A CLUSTER ANALYSIS
Ioana Manafi1*, Daniela Marinescu2, Monica Roman3 and Karen Hemming4 1) 2) 3) The Bucharest University of Economic Studies, Romania
4) Deutsches Jugendinstitut e.V., Halle (Saale), Germany
Please cite this article as:
Manafi, I., Marinescu, D., Roman, M. and Hemming, K.,
2017. Mobility in Europe: Recent Trends from a Cluster
Analysis. Amfiteatru Economic, 19(46), pp. 711-726
Article History
Received: 30 March 2017
Revised: 28 May 2017
Accepted: 10 June 2017
Abstract
During the past decade, Europe was confronted with major changes and events offering
large opportunities for mobility. The EU enlargement process, the EU policies regarding
youth, the economic crisis affecting national economies on different levels, political
instabilities in some European countries, high rates of unemployment or the increasing
number of refugees are only a few of the factors influencing net migration in Europe. Based
on a set of socio-economic indicators for EU/EFTA countries and cluster analysis, the
paper provides an overview of regional differences across European countries, related to
migration magnitude in the identified clusters. The obtained clusters are in accordance with
previous studies in migration, and appear stable during the period of 2005-2013, with only
some exceptions. The analysis revealed three country clusters: EU/EFTA center-receiving
countries, EU/EFTA periphery-sending countries and EU/EFTA outlier countries, the
names suggesting not only the geographical position within Europe, but the trends in net
migration flows during the years. Therewith, the results provide evidence for the
persistence of a movement from periphery to center countries, which is correlated with
recent flows of mobility in Europe.
Keywords: mobility/migration, cluster analysis, migration patterns, sending/receiving
countries.
JEL Classification: J61, F22, C38, R23
Introduction
In the context of an enlarged Europe and an increasing globalization, youth mobility raises
more and more interest for both academics and policy makers. The European Union’s
vision for youth is based on two approaches: investing in youth and therefore allocating
enhanced resources towards developing certain domains within youth policies, and
empowering youth, meaning the promotion of youth potential for renewing society and
* Corresponding author, Ioana Manafi – [email protected]
AE Mobility in Europe: Recent Trends from a Cluster Analysis
712 Amfiteatru Economic
contributing to the EU’s values and objectives, with special attention paid towards young
people with fewer opportunities.
Despite strong efforts, the cross-border mobility rates of young people in Europe are still
comparably low. In this context, the paper focuses European cross-border mobility of
young people within the frame of the Horizon 2020 research project: MOVE “Mapping
mobility – pathways, institutions and structural effects of youth mobility in Europe”. The
central questions of MOVE are how mobility of young people can be ‘good’ both for socio-
economic and individual development of young people, and what are the factors that
foster/hinder such beneficial mobility? The paper is based on the macro-economic analysis
conducted in work package 2 of the MOVE project “Sampling and secondary analyses of
macro data of youth mobility in Europe and the partner countries”, which were presented in
the final work package report (Hemming, Tillmann and Reißig, 2016).
The objective of the paper is to analyse country patterns for mobility using socio-economic
macro-data. The classification is produced with correlation and cluster analysis, using
macro data for a nine years period, between 2005 and 2013. Following the theory
developed by Immanuel Wallerstein (1974), the set of variables used for country cluster
analyses covers social and economic aspects at the macro level. Considering the obtained
clusters, changing patterns of mobility for EU28/EFTA countries will be analysed. The
novelty of the papers therefore lies in providing country patterns and in elaborating the
classification of European countries related to mobility, in a dynamic approach covering
almost a decade. Another significant contribution of the paper is also verifying and
validating the Wallerstein theory in recent decades, by using macroeconomics indicators,
associated to push and pull migration factors. Macroeconomic indicators have limited
power in explaining social phenomena, such as migration, in the literature dedicated to
migration these kind studies being usually based on microeconomics data.
The structure of the paper is as follows: In the second section the state of the art related to
migration is described related to respective theoretical approaches. In the third section
applied methods, research hypotheses, included indicators and statistical procedures are
reported. The fourth section descriptive statistics are presented, followed by the synthetized
results in section five and the conclusion in chapter six.
1. Literature review
Interregional differences stimulate people migration2 in general and people mobility within
Europe, in particular. The nature, causes and intensity of migration represent the main focus
of a series of contemporary theoretical approaches, emerging from complex processes and
conditions such as: the hard-economic crisis, intensified monopoly domination, a rise of
economic inequities among capitalist countries, as well as an increasing economic gap
between developed countries and developing ones. In their extensive work, Bauer and
Zimmermann (2002) selected the most relevant theories and applications in economics of
2 Following the theoretical framework of MOVE the term “mobility” is used in line with “migration”
when talking about geographical cross-border movements of young people in Europe
independently of the duration of the movement. Thus, in this paper it is not differentiated between
mobility and migration.
International Migration ‒ Economic Implications AE
Vol. 19 • No. 46 • August 2017 713
migration, while more recently Kurekova (2011) provided a synthetic description of
migration theories.
The world system theory assumes that migration cannot be explained outside the context of
globalization. The main concepts of the world system theory are exposed in Wallerstein’s
book “The Modern World System: Capitalist Agriculture and the Origins of the European
World Economy in the Sixteenth Century” (1974); which are the role, the dependence and
the development degree. The concept of „role” refers to the structure of one country’s
relations to another country and to the international division of work; „dependence” is the
degree of vulnerability of one state at the system changes, while the „development degree”
is influenced by both the role as well as the dependence. Presumably, both role and
dependence have effects on the economic performance, interacting with capital and labor
mobility.
In his analysis of the modern world economy, Wallerstein also introduced the concepts of
centre and periphery. These two concepts - relevant for the current paper - were also
associated with the information economy by Hannerz (1992), who showed that some
economic and technical activities remain in the central countries such as research and
development, activities determining global business policies, information technology
related activities, and higher education activities. For example, students’ mobility showed
clearly visible centre-periphery patterns. The process could be described geographically, it
concerns certain countries and certain cities and campuses within these countries (Salt and
Miller 2006).
Recent evidence in explaining migration through the concepts of centre and periphery also
referred to the transfer of human capital from peripheral to central labor markets. Literature
presenting the effects of migration on labour markets is extensive and rapidly growing. The
majority of studies, while using macro-economic models of aggregate supply and demand
for labour, showed that migration affects wages and employment (Battisti et al., 2014;
Borjas, 2015; Ottaviano and Peri, 2012). The competition between natives and migrants on
the labour market was subject to various studies. Borjas (1987) proved that increasing the
immigrants labour supply impacts the natives’ wages, while Mayda (2006) argued that
natives feel threatened by the migrants’ competition on the labour market. Balaz et al.
(2004) studied the implication of youth brain drain for the countries of origin starting with
the case of Slovakia. They proved a substantial loss of graduate workers from the labor
force through migration, while accounting for a potentially significant proportion of Gross
Domestic Product growth.
Different theories on migration present specific components of the determinant factors.
Economic factors and existing differences between economic development level in various
countries are among the most described in the literature, but there are also analysed social
and administrative component. Jennisen (2004) argued that social component is directly
linked to demographic factors and variations in the population structure, affecting the
migration process. Borjas (1999) showed that welfare system acts as a magnet for the
migrants in their searching for a better life, while Saeedian et al. (2016) analysed the effects
of visas on geographical shape of populations.
There are recent approaches that connect geographical distribution of migration with factors
such ideological beliefs (Vitankov, Ausloos and Rotundo, 2012) or migration networks
(Vitankov and Vitanov, 2016). Some authors used cluster analysis for analysing
AE Mobility in Europe: Recent Trends from a Cluster Analysis
714 Amfiteatru Economic
geographical patterns of migration. For instance, Akın and Dökmeci (2014) highlighted
spatial patterns of inflows and outflows of migration among different regions in Turkey,
pointing out that each country might have different patterns of interregional migration
depending on its socioeconomic conditions and technological levels. The cluster analysis of
interregional migration revealed a hierarchical pattern of a large cluster at the level of the
country. Evidence for specific youth mobility fields is mostly related to international
student mobility (González, Mesanza and Mariel, 2011; Roman and Suciu, 2007).
However, King et al. (2016) recently described the “interactions of young people’s
European mobility with several youth life transitions”, such as from “youth” to “adulthood”
or from education to work.
The academic interest in studying various mobility types and patterns was strongly
supported by the political interest of the European Union. Starting in 2001, when “The
White Paper of the European Commission” (2001) was published, a new framework for
cooperation was established among the various actors in the youth field in order to better
involve young people in political decisions concerning them. The White Paper requested
for EU and national policies to take more account of the needs of young people. The most
relevant policies refer to employment, social integration, fight against racism and
xenophobia, education, lifelong learning, and mobility. Young people are the demographic
sub-group being most mobile (Roman and Vasilescu, 2016). Thus, youth are the ones
raising more and more interest for both academics and policy makers in terms of migration
research. In April 2009, the Commission presented a new document titled “An EU Strategy
for Youth: Investing and Empowering - A renewed open method of coordination to address
youth challenges and opportunities”. A strategy is suggested for future policies in the
European youth area aiming at empowering young people to face several current
challenges: education, employment, social inclusion, and health.
As there is a lack of a comprehensive model of mobility/migration, taking all reasons and
consequences into consideration (Hárs, 2009), a heuristic causal mobility model was
developed for the macro-analysis within MOVE. The model provided a set of potentially
relevant macro-indicators which were considered for the compilation of the MOVE-
Scientific Use File (Hemming, Tillmann, and Dettmer 2016). Also, the heuristic model
served as a basis for the development of background models explaining causes and effects
of youth mobility. Therefore, macro-economic indicators – as potential push- and pull-
factors for European youth mobility – were considered in three sectors: institutional, social,
and educational variables (Tillmann, Skrobanek and Hemming, 2016)
Studying the social and economic differences between various regions and countries in
Europe is of high relevance for understanding youth mobility from a macroeconomic
perspective. The macro-approach is not highlighted so far in the literature, at the same time,
recent dynamics of mobility in Europe deserve further explanation, also from a macro
perspective. Responding to this need, the paper contributes to the development of the
current literature in the field of mobility within the EU.
2. Method and data
Cluster analysis relies on a high-level descriptive method to form groupings of cases (i.e.
counties) that are similar across a profile of variables (Gunderson, Pinto, and Williams
2008), so the pre-selection of variables is of great important. Cluster analysis is known as
International Migration ‒ Economic Implications AE
Vol. 19 • No. 46 • August 2017 715
segmentation or taxonomy analysis and it is used in data mining. It attempts to identify
homogenous groups of cases (observations, participants, respondents). The goal of
clustering is descriptive, that of classification is predictive. Being an explorative analysis it
does not make any distinction between dependent and independent variables. Most of the
available econometric software packages include three different clustering methods: K-
means cluster, hierarchical cluster, and two step cluster. The following analysis is based on
K-means cluster - especially suitable for large data sets. While using this method, the
number of clusters needs to be specified in advance. Thus, it can be useful for testing
models with different numbers of clusters.
The starting hypotheses for the current cluster analysis refer to the centre and periphery
model used by Wallerstein (1979, 1991) and Kahanec and Zimmermann (2010). Both
imply that high rates of mobility can be explained by a complex set of push and pull
factors, including the economic situation in sending and receiving countries. Based on the
centre-periphery model, the linkage between mobility-patterns and socio economic
framework conditions will be made with the analysis of the crude rate of net migration.
According to the centre-periphery model, three clusters are hypothesised:
Typical receiving countries will assign to one cluster, offering similar socio-economic
conditions for incoming mobility. These countries are assumed to be located in the centre of
Europe. For these countries, the crude rate of net migration is assumed to be positive.
Typical sending countries assign to another cluster offering similar socio-economic
conditions for outgoing mobility. They are assumed to be located at the European
periphery. For this group of countries, the negative crude rate of net migration is assumed.
The third cluster is assumed to consist of outliers (e.g. small countries, non-EU-
countries).
The aim of the presented cluster analysis is to reveal if the assumed patterns could be
confirmed or if new trends/patterns could be found. The data basis for the cluster analysis
was compiled during the MOVE project in a Scientific Use File on “Youth mobility macro
data for Europe” (see Hemming, Tillmann & Dettmer, 2016), based amongst others on
EUROSTAT, OECD and World Bank data for EU28/EFTA countries. The MOVE-SUF
was set up with data from all EU-28 and 3 EFTA countries (Switzerland, Iceland and
Norway), with a total of 31 country-cases. It covers a core period of 10 years (2004-2013).
For some indicators data for 2014 were provided additionally. The analysis was performed
for selected years, reflecting the whole observed period: 2005, 2007, 2009, 2011, 2012, and
2013. Following the heuristic macro-theoretical model on youth mobility, for the cluster
analysis, the most relevant indicators of the sectors state, society, and economy were
selected:
Economy: youth unemployment rate, GDP per capita in purchasing power standards
(PPS);
State: expenditure on social protection, GINI Index, at risk of poverty;
Society: HDI, urban population, fertility rates, population density, infant mortality
rate, and expenditure on pensions, youth population, and ratio of total emigration.
Some of the indicators, that were analysed in the first round of cluster analysis revealed to
be ineffective in determining the clusters. This was the case, if the majority of included
AE Mobility in Europe: Recent Trends from a Cluster Analysis
716 Amfiteatru Economic
countries were assigned to the same cluster. It applied for the following indicators: youth
population, and ratio of total emigration. Also, a correlation analysis between the variables
was performed proving that there are no statistically significant correlations.
The final set of indicators considered for the analysis consists of: youth unemployment rate,
GDP per capita in PPS, expenditure on social protection, GINI Index, at risk of poverty,
HDI, urban population, fertility rates, population density, infant mortality rate, and
expenditure on pensions. Additionally, the indicator “crude rate of net migration” was
included in the further steps of the analysis. “Net migration plus statistical adjustment” is
defined by EUROSTAT as “the difference between total population change and natural
change”, while „crude rate of net migration” is defined as „the ratio of net migration plus
adjustment during the year to the average population in that year, expressed per 1 000
inhabitants”.
3. Descriptive statistics
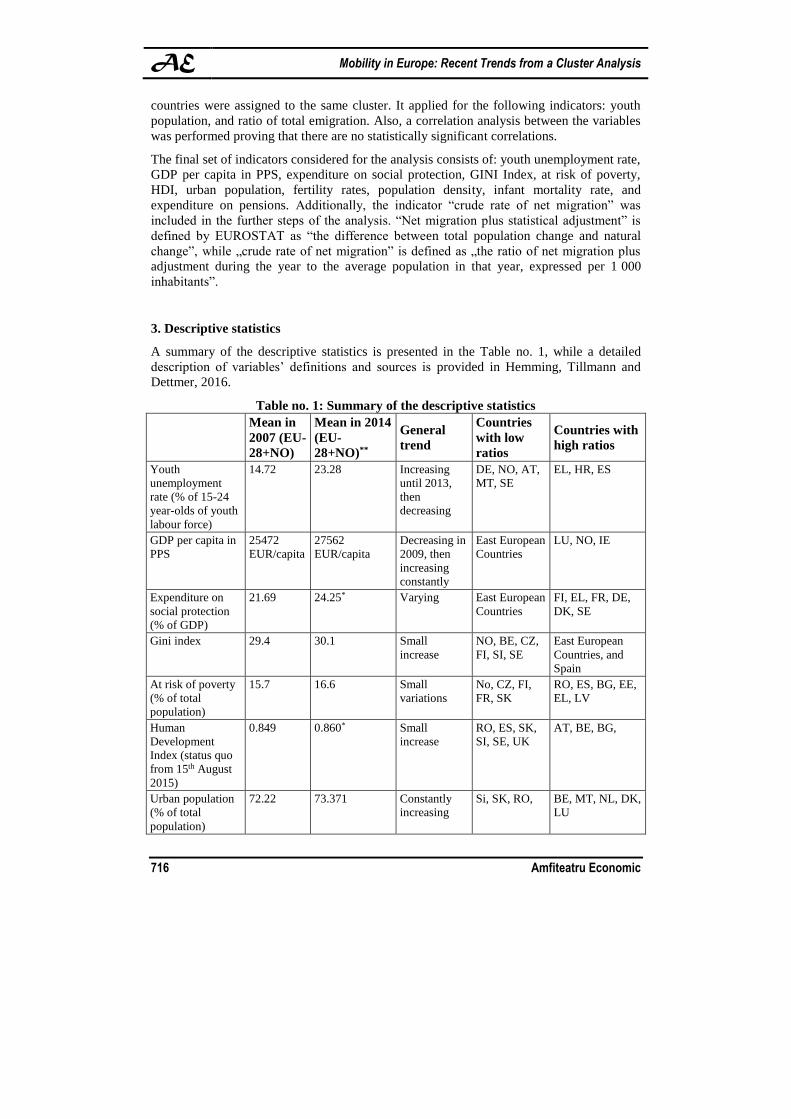
A summary of the descriptive statistics is presented in the Table no. 1, while a detailed
description of variables’ definitions and sources is provided in Hemming, Tillmann and
Dettmer, 2016.
Table no. 1: Summary of the descriptive statistics
Mean in
2007 (EU-
28+NO)
Mean in 2014
(EU-
28+NO)**
General
trend
Countries
with low
ratios
Countries with
high ratios
Youth
unemployment
rate (% of 15-24
year-olds of youth
labour force)
14.72 23.28 Increasing
until 2013,
then
decreasing
DE, NO, AT,
MT, SE
EL, HR, ES
GDP per capita in
PPS
25472
EUR/capita
27562
EUR/capita
Decreasing in
2009, then
increasing
constantly
East European
Countries
LU, NO, IE
Expenditure on
social protection
(% of GDP)
21.69 24.25* Varying East European
Countries
FI, EL, FR, DE,
DK, SE
Gini index 29.4 30.1 Small
increase
NO, BE, CZ,
FI, SI, SE
East European
Countries, and
Spain
At risk of poverty
(% of total
population)
15.7 16.6 Small
variations
No, CZ, FI,
FR, SK
RO, ES, BG, EE,
EL, LV
Human
Development
Index (status quo
from 15th August
2015)
0.849 0.860* Small
increase
RO, ES, SK,
SI, SE, UK
AT, BE, BG,
Urban population
(% of total
population)
72.22 73.371 Constantly
increasing
Si, SK, RO, BE, MT, NL, DK,
LU
International Migration ‒ Economic Implications AE
Vol. 19 • No. 46 • August 2017 717
Mean in
2007 (EU-
28+NO)
Mean in 2014
(EU-
28+NO)**
General
trend
Countries
with low
ratios
Countries with
high ratios
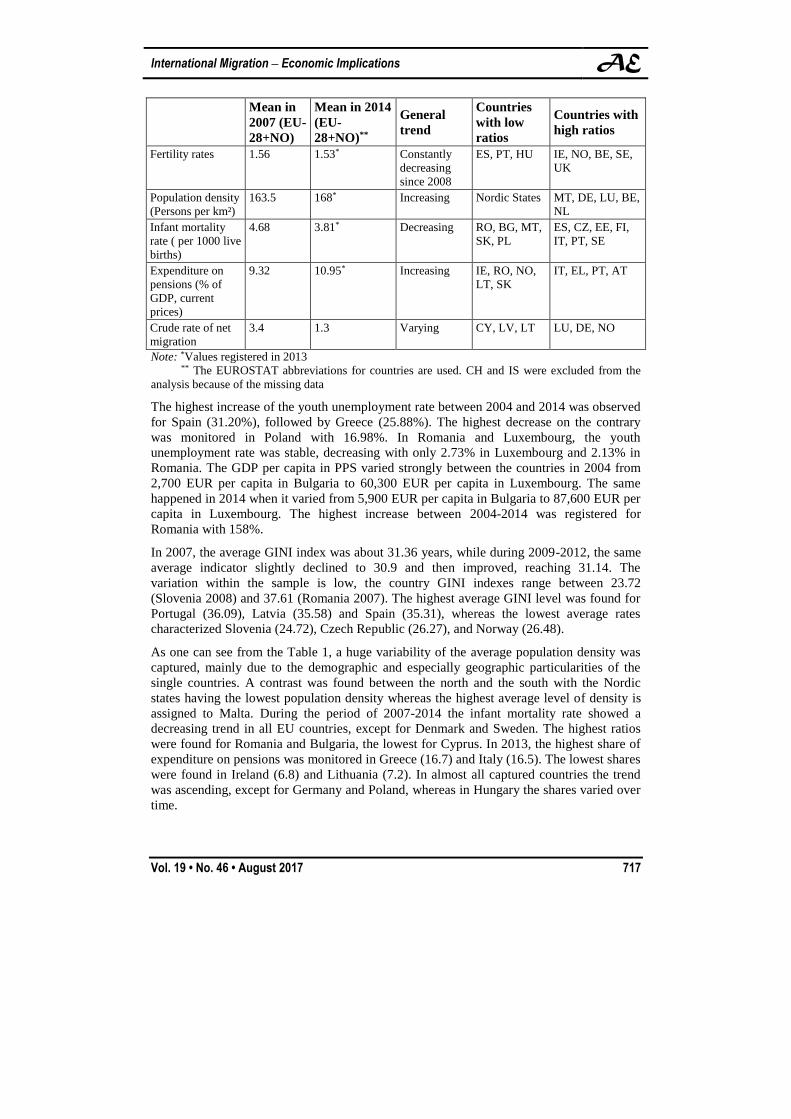
Fertility rates 1.56 1.53* Constantly
decreasing
since 2008
ES, PT, HU IE, NO, BE, SE,
UK
Population density
(Persons per km²)
163.5 168* Increasing Nordic States MT, DE, LU, BE,
NL
Infant mortality
rate ( per 1000 live
births)
4.68 3.81* Decreasing RO, BG, MT,
SK, PL
ES, CZ, EE, FI,
IT, PT, SE
Expenditure on
pensions (% of
GDP, current
prices)
9.32 10.95* Increasing IE, RO, NO,
LT, SK
IT, EL, PT, AT
Crude rate of net
migration
3.4 1.3 Varying CY, LV, LT LU, DE, NO
Note: *Values registered in 2013 ** The EUROSTAT abbreviations for countries are used. CH and IS were excluded from the
analysis because of the missing data
The highest increase of the youth unemployment rate between 2004 and 2014 was observed
for Spain (31.20%), followed by Greece (25.88%). The highest decrease on the contrary
was monitored in Poland with 16.98%. In Romania and Luxembourg, the youth
unemployment rate was stable, decreasing with only 2.73% in Luxembourg and 2.13% in
Romania. The GDP per capita in PPS varied strongly between the countries in 2004 from
2,700 EUR per capita in Bulgaria to 60,300 EUR per capita in Luxembourg. The same
happened in 2014 when it varied from 5,900 EUR per capita in Bulgaria to 87,600 EUR per
capita in Luxembourg. The highest increase between 2004-2014 was registered for
Romania with 158%.
In 2007, the average GINI index was about 31.36 years, while during 2009-2012, the same
average indicator slightly declined to 30.9 and then improved, reaching 31.14. The
variation within the sample is low, the country GINI indexes range between 23.72
(Slovenia 2008) and 37.61 (Romania 2007). The highest average GINI level was found for
Portugal (36.09), Latvia (35.58) and Spain (35.31), whereas the lowest average rates
characterized Slovenia (24.72), Czech Republic (26.27), and Norway (26.48).
As one can see from the Table 1, a huge variability of the average population density was
captured, mainly due to the demographic and especially geographic particularities of the
single countries. A contrast was found between the north and the south with the Nordic
states having the lowest population density whereas the highest average level of density is
assigned to Malta. During the period of 2007-2014 the infant mortality rate showed a
decreasing trend in all EU countries, except for Denmark and Sweden. The highest ratios
were found for Romania and Bulgaria, the lowest for Cyprus. In 2013, the highest share of
expenditure on pensions was monitored in Greece (16.7) and Italy (16.5). The lowest shares
were found in Ireland (6.8) and Lithuania (7.2). In almost all captured countries the trend
was ascending, except for Germany and Poland, whereas in Hungary the shares varied over
time.
AE Mobility in Europe: Recent Trends from a Cluster Analysis
718 Amfiteatru Economic
4. Results
The cluster analysis was performed using the 10 selected indicators with standardized and
un-standardized variables. A standardized z-score is a variable that has been rescaled to
have a mean of zero and a standard deviation of one. Variables are standardized for
contributing evenly to a scale when items are added together, or to make interpretations of
the results easier (e.g. regression). As stated above, the analyses were performed for
different years: 2005, 2007, 2009, 2010, 2011, 2012, and 2013, to see if the analysed
clusters were persistent over time. Firstly, the analyses were conducted biyearly. But as the
results revealed major effects of the economic crisis, the analysis was repeated for 2010 and
2012.
Additionally, to the range of years and the standardizes/unstandardized models, analyses
were conducted including and not including small countries (Luxembourg, Malta, Norway,
and Cyprus). This was done in line with the convention of macro-analyses in research on
poverty, suggesting that macro-analyses on national level should only include countries
with a minimum of 2 million inhabitants to avoid a modelling bias caused by special
conditions of small countries (Sachs 2005). Thus, the different models were conducted for
testing if the obtained results differ significantly from each other as a function of included
small countries.
Conduction the analyses with un-standardized variables, the clusters revealed more stable
while Luxembourg and Norway were identified as outliers. With standardized variables, the
only outlier was Malta. If all captured small countries were excluded from the analysis
(Luxembourg, Malta, Cyprus, and Norway), the clusters were not affected by un-
standardized variables, but the distances between the clusters were. Thus, the un-
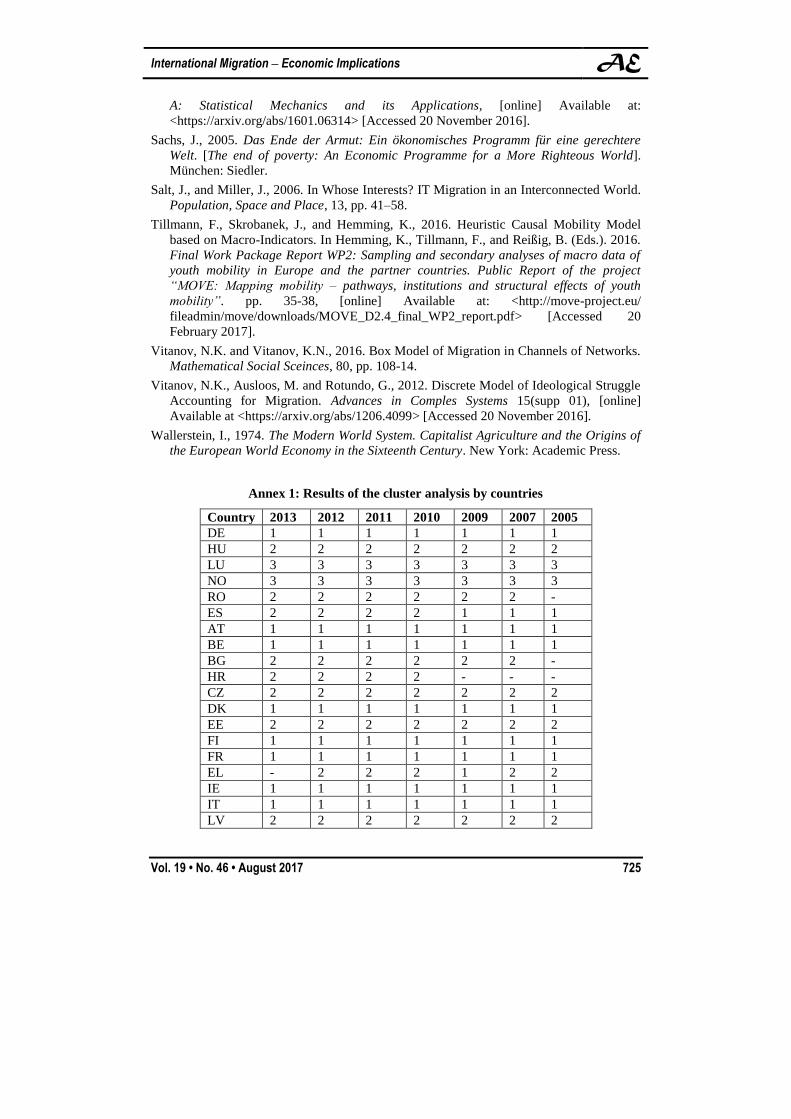
standardized cluster solution was chosen. The obtained clusters were persistent over time
with some exceptions (see Annex). In 2010, Spain moved from the first cluster into the
second one, mainly due to the economic crisis and the therewith linked increasing rate of
youth unemployment, and a reduction in GDP per capita (Elteto, 2011). Accordingly, Spain
has changed in the last years its migration flow from being sending country to becoming a
receiving country (Izquierdo, Jimeno, and Lacuesta, 2016). For the years 2012 and 2013 the
results of the unstandardized and standardized models did not differ significantly, thus the
unstandardized cluster solution was chosen.
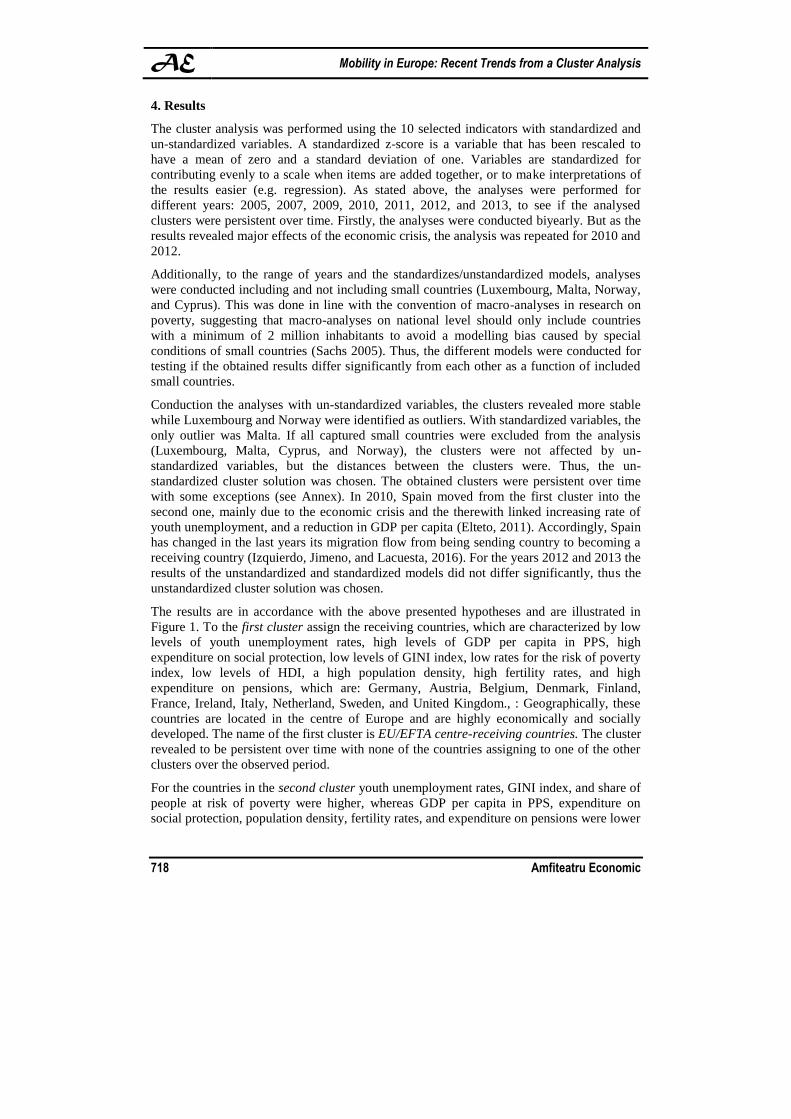
The results are in accordance with the above presented hypotheses and are illustrated in
Figure 1. To the first cluster assign the receiving countries, which are characterized by low
levels of youth unemployment rates, high levels of GDP per capita in PPS, high
expenditure on social protection, low levels of GINI index, low rates for the risk of poverty
index, low levels of HDI, a high population density, high fertility rates, and high
expenditure on pensions, which are: Germany, Austria, Belgium, Denmark, Finland,
France, Ireland, Italy, Netherland, Sweden, and United Kingdom., : Geographically, these
countries are located in the centre of Europe and are highly economically and socially
developed. The name of the first cluster is EU/EFTA centre-receiving countries. The cluster
revealed to be persistent over time with none of the countries assigning to one of the other
clusters over the observed period.
For the countries in the second cluster youth unemployment rates, GINI index, and share of
people at risk of poverty were higher, whereas GDP per capita in PPS, expenditure on
social protection, population density, fertility rates, and expenditure on pensions were lower
International Migration ‒ Economic Implications AE
Vol. 19 • No. 46 • August 2017 719
compared to the first cluster. To the second cluster, countries from Eastern Europe
(Hungary, Romania, Estonia, Bulgaria, Croatia, Czech Republic, Latvia, Lithuania,
Slovakia, and Slovenia), as well as Spain, Greece, and Portugal were assigned to. The name
of the second cluster is EU/EFTA periphery-sending countries. Except for Spain, which
assigned to this cluster only since 2010 (switching from the first to the second cluster), all
other countries were persistent over time.
In the third cluster, Norway and Luxembourg were grouped together as outliers – named
EU/EFTA outlier countries – having a GDP per capita almost 2.5 times higher compared to
the first cluster, and a youth unemployment rate more than 2 times lower compared to the
second cluster.
Figure no. 1: Solution with three clusters for EU28/EFTA countries
Source: authors
For testing the third hypothesis, the indicator “crude rate of net migration” was used for
mapping mobility flows in EU-28/EFTA countries. The indicator was chosen because no
comparable youth mobility indicator was available for EU28/EFTA countries on the macro-
level. The countries grouped in the first cluster (EU/EFTA centre-receiving), except Ireland
(since 2010) confirm the hypothesis that are receiving countries, as the next figure shows.
Spain was included in the first cluster prior to global financial crisis. Post crisis, it was
included in the second cluster, confirming the changes of migration flows in Spain
(Izquierdo, Jimeno, and Lacuesta, 2016). However, despite the economic turbulences,
Spain remained an attractive destination for Romanian people. The Romanian migration
surpassed in 2007 those of Moroccans with forming the largest foreign group in this
country. Also, Spain remained an attractive destination for European youth mobility,
especially as finished outgoing/returning mobilities to Spain mostly refer to short-term
students’/touristic mobilities (Hemming, Tillmann and Reißig, 2016).
AE Mobility in Europe: Recent Trends from a Cluster Analysis
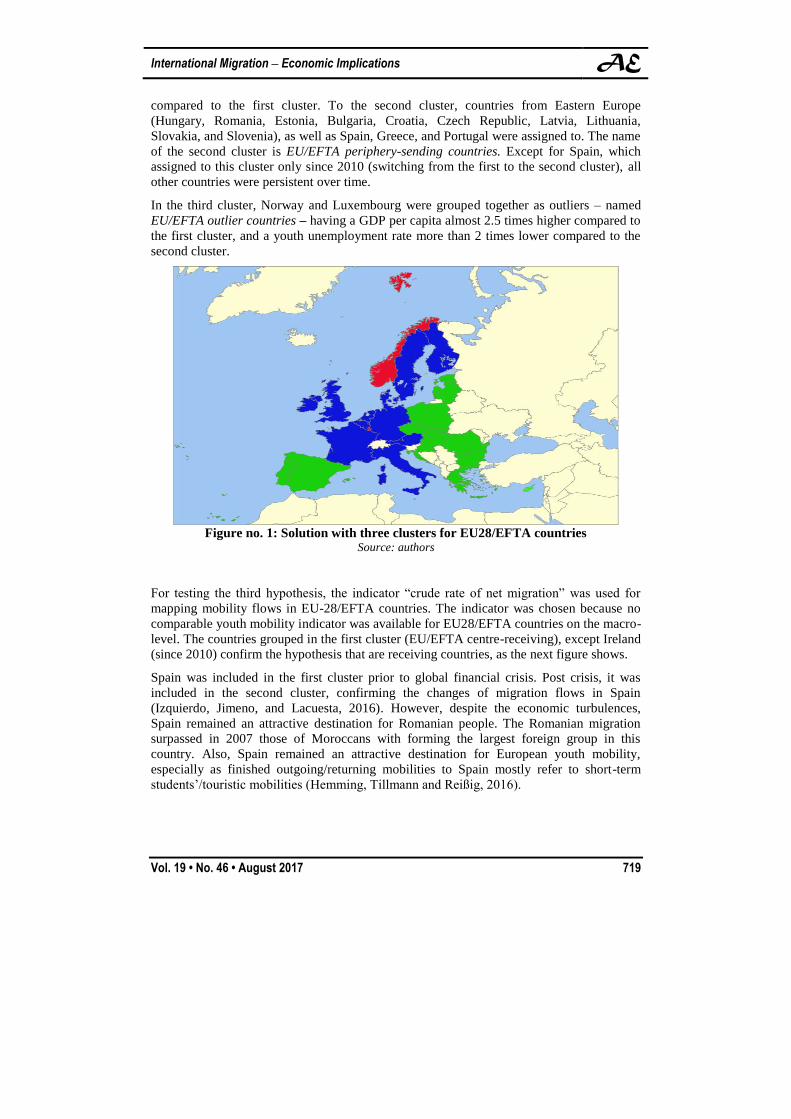
720 Amfiteatru Economic
Figure no. 2: Crude rate of net migration in EU/EFTA centre-receiving cluster
Source: authors
When comparing the above-mentioned tendency with the cluster results, it reveals that all
countries in the first cluster are typically receiving countries, except for Ireland, showing an
opposite characteristic between 2009-2015, although being a typically receiving country
before. However, as Ireland is situated at the periphery of Europe from a geographic
perspective, the result is not surprising and in line with the considered hypothesis. Also, the
receiving characteristic was more relevant during the economic crisis, stressing the fact that
socio-economic conditions play an important role in migration. In France, the net balance is
comparably low. However, when considering youth mobility, France shows an opposite
characteristic (Hemming, Tillmann and Reißig, 2016). The highest net balance was
registered for Italy in 2013. For Austria, the crude rate of net migration revealed an
increasing tendency lately.
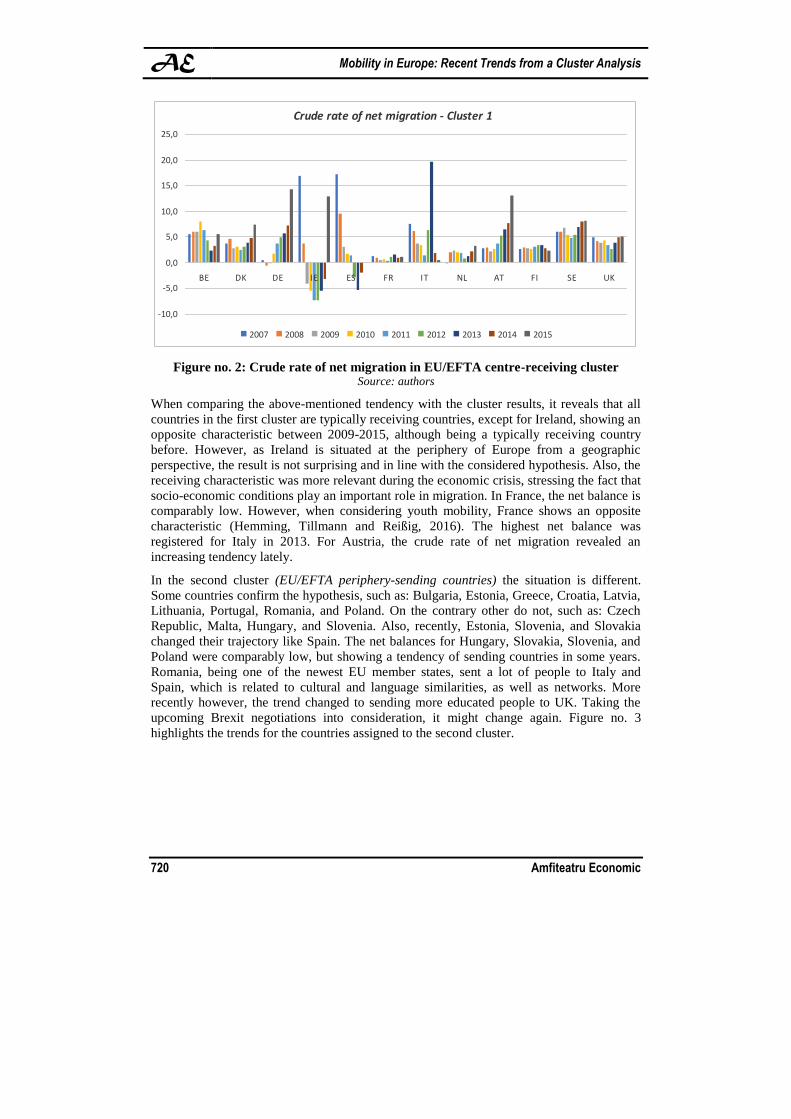
In the second cluster (EU/EFTA periphery-sending countries) the situation is different.
Some countries confirm the hypothesis, such as: Bulgaria, Estonia, Greece, Croatia, Latvia,
Lithuania, Portugal, Romania, and Poland. On the contrary other do not, such as: Czech
Republic, Malta, Hungary, and Slovenia. Also, recently, Estonia, Slovenia, and Slovakia
changed their trajectory like Spain. The net balances for Hungary, Slovakia, Slovenia, and
Poland were comparably low, but showing a tendency of sending countries in some years.
Romania, being one of the newest EU member states, sent a lot of people to Italy and
Spain, which is related to cultural and language similarities, as well as networks. More
recently however, the trend changed to sending more educated people to UK. Taking the
upcoming Brexit negotiations into consideration, it might change again. Figure no. 3
highlights the trends for the countries assigned to the second cluster.
Crude rate of net migration - Cluster 1
-10,0
-5,0
0,0
5,0
10,0
15,0
20,0
25,0
BE DK DE IE ES FR IT NL AT FI SE UK
2007 2008 2009 2010 2011 2012 2013 2014 2015

International Migration ‒ Economic Implications AE
Vol. 19 • No. 46 • August 2017 721
Figure no. 3: Crude rate of net migration in EU/EFTA periphery-sending cluster
Source: authors
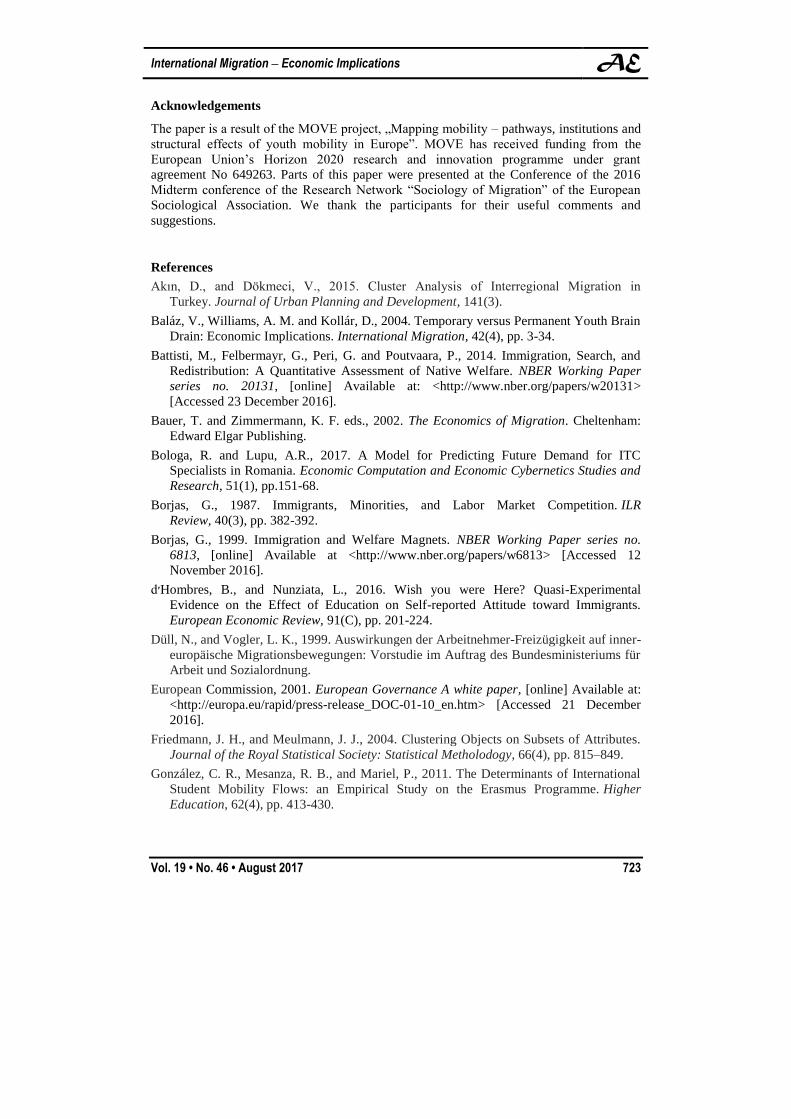
The outlier countries-(Norway and Luxemburg), showed a peak of their crude migration
rate during the economic crisis (see Figure 4). Both countries are well developed typical
receiving countries. As the cluster analysis was performed using socio-economic data, the
country characteristic could be expected afore.
Figure no. 4: Crude rate of net migration in EU/EFTA outlier countries
Source: authors
When comparing the result with the cluster analysis, one can find both similarities and
differences. The overall cluster solution is in accordance with the expected countries’ crude
rate of net migration, except for Ireland, which strengthens the central hypothesis on the
centre-receiving and periphery-sending countries. The result is also in line with the findings
Crude rate of net migration - Cluster 2
-30,0
-25,0
-20,0
-15,0
-10,0
-5,0
0,0
5,0
10,0
15,0
20,0
BG CZ EE EL ES HR LV LT HU MT PL PT RO SI SK
2007 2008 2009 2010 2011 2012 2013 2014 2015
0.0
5.0
10.0
15.0
20.0
25.0
LU NO
Crude rate of net migration- Cluster 3
2007 2008 2009 2010 2011 2012 2013 2014 2015

AE Mobility in Europe: Recent Trends from a Cluster Analysis
722 Amfiteatru Economic
of Kahanec and Zimmermann (2010), who stated that the economic situation in sending and
receiving countries is relevant for migration patterns.
Conclusions
Between 1990-2005, studies about European mobility and migration were strongly related
to East-West migration, whereas recent literature reflects new patterns and forms of
migration. These are mainly due to the EU-enlargement process and the economic and
demographic changes within EU member states. Also, the key aims of the EU-Youth
Strategy focus on the integration of young migrants into the respective host countries, and
encouraging young people to participate at EU-programmes like Erasmus+, Inclusion and
Diversity Strategy, EVS, youth exchanges.
Accordingly, based on a cluster analysis of macroeconomic indicators (for the period 2005-
2013), the paper intended to identify new trends in European migration. Performing several
variants of cluster analyses (standardized/unstandardized variables, including all or only
selected indicators), the conclusions were in line with the developed hypotheses and
confirmed them. The captured European countries were assigned to three clusters: first
cluster - EU/EFTA centre-receiving countries; second cluster – EU/EFTA periphery-
sending countries; and third cluster – EU/EFTA outlier countries.
The research performed in the paper is relying on macroeconomic variables, which could
imply some limitations. Although initial data set consisted in a large number of variables,
because of the missing data this was reduced, allowing however for the explorative
approach of the current research. The migration intention is usually based on personal
reasons that could not be captured by macroeconomic variable, so it would be difficult to
interpret the results and to draw conclusions beyond the macroeconomic level. Such
conclusions should be considered research hypothesis that would deserve further analysis.
The results also confirm the trends of migration flows within Europe. Overall, the indicator
“crude rate of net migration” is positive for countries belonging to the first cluster for the
observed period, and negative for countries from the second cluster. A possible explanation
for the few exceptions could be found in related factors characterizing the origin/destination
countries such as linguistic similarities, cultural richness, socio-political stability, the
development of IT-infrastructures and the allocation of human resources (as described by
Bologa and Lupu, 2017), the existence of social networks. However, in some cases
(Ireland, Czech Republic, Hungary, Slovakia, Slovenia) the obtained results could also
explain some new patterns of migration pattern. For instance, Ireland, geographically
located at the periphery of Europe, could be also seen as a sending country. However,
mobility and migration is strongly linked to socio-economic conditions, which was shown
in the results for the period following the economic crisis. A further interpretation referring
to the country patterns suggest, if socio-economic conditions change leading towards
smaller differences between the countries, analysed mobility patterns could become more
evident, pointing to the fact, that mobility and migration follows the centre-periphery
pattern.
International Migration ‒ Economic Implications AE
Vol. 19 • No. 46 • August 2017 723
Acknowledgements
The paper is a result of the MOVE project, „Mapping mobility – pathways, institutions and
structural effects of youth mobility in Europe”. MOVE has received funding from the
European Union’s Horizon 2020 research and innovation programme under grant
agreement No 649263. Parts of this paper were presented at the Conference of the 2016
Midterm conference of the Research Network “Sociology of Migration” of the European
Sociological Association. We thank the participants for their useful comments and
suggestions.
References
Akın, D., and Dökmeci, V., 2015. Cluster Analysis of Interregional Migration in
Turkey. Journal of Urban Planning and Development, 141(3).
Baláz, V., Williams, A. M. and Kollár, D., 2004. Temporary versus Permanent Youth Brain
Drain: Economic Implications. International Migration, 42(4), pp. 3-34.
Battisti, M., Felbermayr, G., Peri, G. and Poutvaara, P., 2014. Immigration, Search, and
Redistribution: A Quantitative Assessment of Native Welfare. NBER Working Paper
series no. 20131, [online] Available at: <http://www.nber.org/papers/w20131>
[Accessed 23 December 2016].
Bauer, T. and Zimmermann, K. F. eds., 2002. The Economics of Migration. Cheltenham:
Edward Elgar Publishing.
Bologa, R. and Lupu, A.R., 2017. A Model for Predicting Future Demand for ITC
Specialists in Romania. Economic Computation and Economic Cybernetics Studies and
Research, 51(1), pp.151-68.
Borjas, G., 1987. Immigrants, Minorities, and Labor Market Competition. ILR
Review, 40(3), pp. 382-392.
Borjas, G., 1999. Immigration and Welfare Magnets. NBER Working Paper series no.
6813, [online] Available at <http://www.nber.org/papers/w6813> [Accessed 12
November 2016].
d׳Hombres, B., and Nunziata, L., 2016. Wish you were Here? Quasi-Experimental
Evidence on the Effect of Education on Self-reported Attitude toward Immigrants.
European Economic Review, 91(C), pp. 201-224.
Düll, N., and Vogler, L. K., 1999. Auswirkungen der Arbeitnehmer-Freizügigkeit auf inner-
europäische Migrationsbewegungen: Vorstudie im Auftrag des Bundesministeriums für
Arbeit und Sozialordnung.
European Commission, 2001. European Governance A white paper, [online] Available at:
<http://europa.eu/rapid/press-release_DOC-01-10_en.htm> [Accessed 21 December
2016].
Friedmann, J. H., and Meulmann, J. J., 2004. Clustering Objects on Subsets of Attributes.
Journal of the Royal Statistical Society: Statistical Metholodogy, 66(4), pp. 815–849.
González, C. R., Mesanza, R. B., and Mariel, P., 2011. The Determinants of International
Student Mobility Flows: an Empirical Study on the Erasmus Programme. Higher
Education, 62(4), pp. 413-430.
AE Mobility in Europe: Recent Trends from a Cluster Analysis
724 Amfiteatru Economic
Gunderson, R. J., Pinto, V., and Williams, R. H., 2008. Economic or Amenity Driven
Migration? A Cluster-Based Analysis of County Migration in the Four Corners States.
Journal of Regional Analysis and Policy, 38(3), pp. 243–254.
Hannerz, U., 1992. Cultural Complexity: Studies in the Social Organization of Meaning.
New York: Columbia Press.
Hárs, A., 2009. Dimensions and Effects of Labour Migration to EU Countries: The Case of
Hungary. In: B. Galgoczi, J. Leschke, and A. Watt, ed. 2009. EU Labour Migration
since Enlargement. Trends, Impacts and Policies. Aldershot: Ashgate Publishing Ltd.
pp. 229–52.
Hemming, K., Tillmann, F., and Dettmer, M., 2016. Users’ Manual for D2.5 MOVE-SUF
“Youth Mobility Macro Data for Europe”. Public Report of the project “MOVE:
Mapping mobility – pathways, institutions and structural effects of youth mobility”.
[online] Available at: <http://move-project.eu/fileadmin/move/downloads/D2%205_
MOVE-SUF_youth%20mobility%20macro%20data%20for%20europe_users_
manualV2.pdf> [Accessed 20 February 2017].
Hemming, K., Tillmann, F., and Reißig, B. (Eds.)., 2016. Final Work Package Report
WP2: Sampling and secondary analyses of macro data of youth mobility in Europe and
the partner countries. Public Report of the project “MOVE: Mapping mobility –
pathways, institutions and structural effects of youth mobility”, [online] Available at:
<http://moveproject.eu/fileadmin/move/downloads/MOVE_D2.4_final_WP2_report.pdf
> [Accessed 20 February 2017].
Kahanec, M., and Zimmermann, K. F., 2010. EU Labour Markets After Post-Enlargement
Migration. Berlin Heidelberg: Springer Verlag.
Kurekova, L., 2011. Theories of Migration: Conceptual Review and Empirical Testing in
the Context of the EU East-West Flows, Interdisciplinary Conference on migration,
economic change, social change, London, UK, 6-9 April 2009. London: University
College London.
King, R., Lulle, A., Moroşanu, L., and Williams, A., 2016. International Youth Mobility
and Life Transitions in Europe: Questions, Definitions, Typologies and Theoretical
Approaches. Sussex Centre for Migration Research Working Papers, 86, [online]
Available at: <https://www.sussex.ac.uk/webteam/gateway/file.php?name=
mwp86.pdf&site=252> [Accessed 21 December 2016].
Jennisen, R.P.W., 2004. Macroeconomic determinants of international migration in
Europe. Groningen: Dutch University Press.
Mayda, A. M., 2006. Who Is Against Immigration? A Cross-Country Investigation of
Individual Attitudes toward Immigrants. Review of Economics and Statistics, 88 (3), pp.
510-530.
Roman, M., and Suciu, C., 2007. International Mobility of Romanian Students in Europe:
From Statistical Evidence to Policy Measures. The Romanian Journal of European
Studies, 5-6, pp. 167-177.
Roman, M., and Vasilescu, M. D., 2016. Explaining the Migration Intentions Of Romanian
Youth: Are Teenegers Different? Romanian Statistical Review, 64(4), pp. 69-86.
Saeedian, M., Jamali, T., Farahani, S.V., Jafari, G.R. and Ausloos, M., 2016. How Visas
Shape and Make Visible the Geopolitical Architecture of the Planet. Physica
International Migration ‒ Economic Implications AE
Vol. 19 • No. 46 • August 2017 725
A: Statistical Mechanics and its Applications, [online] Available at:
<https://arxiv.org/abs/1601.06314> [Accessed 20 November 2016].
Sachs, J., 2005. Das Ende der Armut: Ein ökonomisches Programm für eine gerechtere
Welt. [The end of poverty: An Economic Programme for a More Righteous World].
München: Siedler.
Salt, J., and Miller, J., 2006. In Whose Interests? IT Migration in an Interconnected World.
Population, Space and Place, 13, pp. 41–58.
Tillmann, F., Skrobanek, J., and Hemming, K., 2016. Heuristic Causal Mobility Model
based on Macro-Indicators. In Hemming, K., Tillmann, F., and Reißig, B. (Eds.). 2016.
Final Work Package Report WP2: Sampling and secondary analyses of macro data of
youth mobility in Europe and the partner countries. Public Report of the project
“MOVE: Mapping mobility – pathways, institutions and structural effects of youth
mobility”. pp. 35-38, [online] Available at: <http://move-project.eu/
fileadmin/move/downloads/MOVE_D2.4_final_WP2_report.pdf> [Accessed 20
February 2017].
Vitanov, N.K. and Vitanov, K.N., 2016. Box Model of Migration in Channels of Networks.
Mathematical Social Sceinces, 80, pp. 108-14.
Vitanov, N.K., Ausloos, M. and Rotundo, G., 2012. Discrete Model of Ideological Struggle
Accounting for Migration. Advances in Comples Systems 15(supp 01), [online]
Available at <https://arxiv.org/abs/1206.4099> [Accessed 20 November 2016].
Wallerstein, I., 1974. The Modern World System. Capitalist Agriculture and the Origins of
the European World Economy in the Sixteenth Century. New York: Academic Press.
Annex 1: Results of the cluster analysis by countries
Country 2013 2012 2011 2010 2009 2007 2005
DE 1 1 1 1 1 1 1
HU 2 2 2 2 2 2 2
LU 3 3 3 3 3 3 3
NO 3 3 3 3 3 3 3
RO 2 2 2 2 2 2 -
ES 2 2 2 2 1 1 1
AT 1 1 1 1 1 1 1
BE 1 1 1 1 1 1 1
BG 2 2 2 2 2 2 -
HR 2 2 2 2 - - -
CZ 2 2 2 2 2 2 2
DK 1 1 1 1 1 1 1
EE 2 2 2 2 2 2 2
FI 1 1 1 1 1 1 1
FR 1 1 1 1 1 1 1
EL - 2 2 2 1 2 2
IE 1 1 1 1 1 1 1
IT 1 1 1 1 1 1 1
LV 2 2 2 2 2 2 2

AE Mobility in Europe: Recent Trends from a Cluster Analysis
726 Amfiteatru Economic
Country 2013 2012 2011 2010 2009 2007 2005
LT 2 2 2 2 2 2 2
MT 2 2 2 2 2 2 2
NL 1 1 1 1 1 1 1
PL - 2 2 2 2 2 2
PT 2 2 2 2 2 2 2
SK 2 2 2 2 2 2 2
SI 2 2 2 2 2 2 2
SE 1 1 1 1 1 1 1
UK 1 1 1 1 1 1 1
Annex 2. List of macro indicators used in the analysis (for definitions and source of
data see also Hemming, Tillmann & Dettmer, 2016)
Variable Label Unit
Youth unemployment rate (% of 15 – 24-year-olds of youth
labour force
%
GDP at market prices (EURO per capita) EUR/capita
Expenditure on social protection (% of GDP) %
Gini coefficient of equivalised disposable income (number) Gini coefficient
At-risk-of-poverty rate (% of total population %
Human Development Index Version 1 (status quo from 15th
August 2015)
HDI
Urban population (% of total population) %
Fertility rates (total number, children/woman) Children/Women
Population density (Persons per km²) Persons per km²
Infant mortality rate (ratio per 1000 live births) %
Expenditure on pensions (% of GDP, current prices) %
Crude rate of net migration plus adjustments %