INVITATION HOMES INC.
73
UNITED STATES SECURITIES AND EXCHANGE COMMISSION Washington, D.C. 20549 FORM 10-Q ☑ QUARTERLY REPORT PURSUANT TO SECTION 13 OR 15(d) OF THE SECURITIES EXCHANGE ACT OF 1934 For the quarterly period ended March 31, 2021 OR ☐ TRANSITION REPORT PURSUANT TO SECTION 13 OR 15(d) OF THE SECURITIES EXCHANGE ACT OF 1934 For the transition period from to Commission File Number 001-38004 Invitation Homes Inc. (Exact name of registrant as specified in its charter) Maryland 90-0939055 (State or other jurisdiction of incorporation or organization) (I.R.S. Employer Identification No.) 1717 Main Street, Suite 2000 75201 Dallas, Texas (Address of principal executive offices) (Zip Code) (972) 421-3600 (Registrant’s telephone number, including area code) N/A (Former name, former address and former fiscal year, if changed since last report) Securities registered pursuant to Section 12(b) of the Act: Title of each class Trading Symbol(s) Name of each exchange on which registered Common stock, $0.01 par value INVH New York Stock Exchange Indicate by check mark whether the Registrant: (1) has filed all reports required to be filed by Section 13 or 15(d) of the Securities Exchange Act of 1934 during the preceding 12 months (or for such shorter period that the Registrant was required to file such reports), and (2) has been subject to such filing requirements for the past 90 days. Yes ☑ No ☐ Indicate by check mark whether the Registrant has submitted electronically every Interactive Data File required to be submitted pursuant to Rule 405 of Regulation S-T (§232.405 of this chapter) during the preceding 12 months (or for such shorter period that the Registrant was required to submit such files). Yes ☑ No ☐ Indicate by check mark whether the registrant is a large accelerated filer, an accelerated filer, a non-accelerated filer, a smaller reporting company, or an emerging growth company. See the definitions of “large accelerated filer,” “accelerated filer,” “smaller reporting company,” and “emerging growth company” in Rule 12b-2 of the Exchange Act. Large Accelerated Filer ☑ Accelerated Filer ☐ Non-Accelerated Filer ☐ Smaller Reporting Company ☐ Emerging Growth Company ☐ If an emerging growth company, indicate by check mark if the registrant has elected not to use the extended transition period for complying with any new or revised financial accounting standards provided pursuant to Section 13(a) of the Exchange Act. ☐ Indicate by check mark whether the Registrant is a shell company (as defined in Rule 12b-2 of the Exchange Act). Yes ☐ No ☑ As of April 26, 2021, there were 567,650,434 shares of common stock, par value $0.01 per share, outstanding.
Transcript of INVITATION HOMES INC.

UNITED STATESSECURITIES AND EXCHANGE COMMISSION
Washington, D.C. 20549
FORM10-Q☑
QUARTERLY REPORT PURSUANT TO SECTION 13 OR 15(d) OF THESECURITIES EXCHANGE ACT OF 1934
For the quarterly period ended March 31, 2021OR
☐TRANSITION REPORT PURSUANT TO SECTION 13 OR 15(d) OF THESECURITIES EXCHANGE ACT OF 1934
For the transition period from toCommission File Number 001-38004
Invitation Homes Inc.(Exact name of registrant as specified in its charter)
Maryland 90-0939055(State or other jurisdiction of incorporation or organization) (I.R.S. Employer Identification No.)
1717 Main Street, Suite 200075201Dallas, Texas
(Address of principal executive offices) (Zip Code)(972) 421-3600
(Registrant’s telephone number, including area code)
N/A(Former name, former address and former fiscal year, if changed since last report)
Securities registered pursuant to Section 12(b) of the Act:Title of each class Trading Symbol(s) Name of each exchange on which registered
Common stock, $0.01 par value INVH New York Stock Exchange
Indicate by check mark whether the Registrant: (1) has filed all reports required to be filed by Section 13 or 15(d) of the Securities Exchange Act of 1934 duringthe preceding 12 months (or for such shorter period that the Registrant was required to file such reports), and (2) has been subject to such filing requirements forthe past 90 days.
Yes☑☑ No☐☐Indicate by check mark whether the Registrant has submitted electronically every Interactive Data File required to be submitted pursuant to Rule 405 ofRegulation S-T (§232.405 of this chapter) during the preceding 12 months (or for such shorter period that the Registrant was required to submit such files).
Yes☑☑ No☐☐Indicate by check mark whether the registrant is a large accelerated filer, an accelerated filer, a non-accelerated filer, a smaller reporting company, or anemerging growth company. See the definitions of “large accelerated filer,” “accelerated filer,” “smaller reporting company,” and “emerging growth company”in Rule 12b-2 of the Exchange Act.
Large Accelerated Filer ☑☑ Accelerated Filer ☐☐
Non-Accelerated Filer ☐☐ Smaller Reporting Company ☐☐
Emerging Growth Company ☐☐
If an emerging growth company, indicate by check mark if the registrant has elected not to use the extended transition period for complying with any new orrevised financial accounting standards provided pursuant to Section 13(a) of the Exchange Act. ☐☐
Indicate by check mark whether the Registrant is a shell company (as defined in Rule 12b-2 of the Exchange Act).Yes☐☐ No☑☑
As of April 26, 2021, there were 567,650,434 shares of common stock, par value $0.01 per share, outstanding.

INVITATION HOMES INC.
PagePART I
Item 1. Financial Statements 6Item 2. Management’s Discussion and Analysis of Financial Condition and Results of Operations 38Item 3. Quantitative and Qualitative Disclosures About Market Risk 64Item 4. Controls and Procedures 65
PART IIItem 1. Legal Proceedings 66Item 1A. Risk Factors 66Item 2. Unregistered Sales of Equity Securities and Use of Proceeds 66Item 3. Defaults Upon Senior Securities 66Item 4. Mine Safety Disclosures 66Item 5. Other Information 66Item 6. Exhibits 67
Signatures 69
FORWARD-LOOKING STATEMENTS
This Quarterly Report on Form 10-Q contains forward-looking statements within the meaning of Section 27A of the Securities Act of 1933, as amended, and Section 21E of theSecurities Exchange Act of 1934, as amended (the “Exchange Act”), which include, but are not limited to, statements related to our expectations regarding the performance of ourbusiness, our financial results, our liquidity and capital resources, and other non-historical statements. In some cases, you can identify these forward-looking statements by the use ofwords such as “outlook,” “believes,” “expects,” “potential,” “continues,” “may,” “will,” “should,” “could,” “seeks,” “projects,” “predicts,” “intends,” “plans,” “estimates,”“anticipates,” or the negative version of these words or other comparable words. Such forward-looking statements are subject to various risks and uncertainties, including, amongothers, risks inherent to the single-family rental industry and our business model, macroeconomic factors beyond our control, competition in identifying and acquiring properties,competition in the leasing market for quality residents, increasing property taxes, homeowners’ association (“HOA”) and insurance costs, our dependence on third parties for keyservices, risks related to the evaluation of properties, poor resident selection and defaults and non-renewals by our residents, performance of our information technology systems,risks related to our indebtedness, and risks related to the potential negative impact of the ongoing COVID-19 pandemic on our financial condition, results of operations, cash flows,business, associates, and residents. Accordingly, there are or will be important factors that could cause actual outcomes or results to differ materially from those indicated in thesestatements. Many of these factors have been heightened as a result of the ongoing and numerous adverse impacts of COVID-19. We believe these factors include but are not limitedto, those described under Part I. Item 1A. “Risk Factors” in our Annual Report on Form 10-K for the year ended December 31, 2020 (the “Annual Report on Form 10-K”) as suchfactors may be updated from time to time in our periodic filings with the Securities and Exchange Commission (the “SEC”), which are accessible on the SEC’s website athttp://www.sec.gov. These factors should not be construed as exhaustive and should be read in conjunction with the other cautionary statements that are included in this QuarterlyReport on Form 10-Q, in the Annual Report on Form 10-K, and in our other periodic filings. The forward-looking statements speak only as of the date of this Quarterly Report onForm 10-Q, and we expressly disclaim any obligation or undertaking to publicly update or review any forward-looking statement, whether as a result of new information, futuredevelopments or otherwise, except to the extent otherwise required by law.
3

DEFINED TERMS
Invitation Homes Inc. (“INVH”), a real estate investment trust (“REIT”), conducts its operations through Invitation Homes Operating Partnership LP (“INVH LP”). THRProperty Management L.P., a wholly owned subsidiary of INVH LP (the “Manager”), provides all management and other administrative services with respect to the properties weown. On November 16, 2017 (the “Merger Date”), INVH and certain of its affiliates entered into a series of transactions with Starwood Waypoint Homes (“SWH”) and certainSWH affiliates which resulted in SWH and its operating partnership being merged into INVH and INVH LP, respectively, with INVH and INVH LP being the surviving entities (the“Mergers”).
Unless the context suggests otherwise, references in this Quarterly Report on Form 10-Q to “Invitation Homes,” the “Company,” “we,” “our,” and “us” refer to INVH and itsconsolidated subsidiaries.
In this Quarterly Report on Form 10-Q:
• “average monthly rent” represents average monthly rental income per home for occupied properties in an identified population of homes over the measurement period and reflectsthe impact of non-service rent concessions and contractual rent increases amortized over the life of the related lease. We believe average monthly rent reflects pricing trends thatsignificantly impact rental revenues over time, making average monthly rent useful to management and external stakeholders as a means of evaluating changes in rental revenuesacross periods;
• “average occupancy” for an identified population of homes represents (i) the total number of days that the homes in such population were occupied during the measurement period,divided by (ii) the total number of days that the homes in such population were owned during the measurement period. We believe average occupancy significantly impacts rentalrevenues in a given period, making comparisons of average occupancy across different periods helpful to management and external stakeholders in evaluating changes in rentalrevenues across periods;
• “Carolinas” includes Charlotte, NC, Greensboro, NC, Raleigh, NC, and Fort Mill, SC;
• “days to re-resident” for an individual home represents the number of days between (i) the date the prior resident moves out of a home, and (ii) the date the next resident is grantedaccess to the same home, which is deemed to be the earlier of the next resident’s contractual lease start date and the next resident’s move-in date. Days to re-resident impacts ouraverage occupancy and thus our rental revenues, making comparisons of days to re-resident helpful to management and external stakeholders in evaluating changes in rentalrevenues across periods;
• “in-fill” refers to markets, MSAs, submarkets, neighborhoods or other geographic areas that are typified by significant population densities and low availability of land suitable fordevelopment into competitive properties, resulting in limited opportunities for new construction;
• “historical average” is the simple average of each of the six months beginning October 2019 and to and including March 2020;
• “Metropolitan Statistical Area” or “MSA” is defined by the United States Office of Management and Budget as a region associated with at least one urbanized area that has apopulation of at least 50,000 and comprises the central county or counties containing the core, plus adjacent outlying counties having a high degree of social and economicintegration with the central county or counties as measured through commuting;
• “net effective rental rate growth” for any home represents the percentage difference between the monthly rent from an expiring lease and the monthly rent from the next lease and,in each case, reflects the impact of non-service rent concessions and contractual rent increases amortized over the life of the related lease. Leases are either renewal leases, whereour current resident chooses to stay for a subsequent lease term, or a new lease, where our previous resident moves out and a new resident signs a lease to occupy the same home.Net effective rental rate growth drives changes in our average monthly rent, making net effective rental rate growth useful to management and external stakeholders as a means ofevaluating changes in rental revenues across periods;
• “Northern California” includes Sacramento-Arden-Arcade-Roseville, CA, San Francisco-Oakland-Hayward, CA, Stockton-Lodi, CA, Vallejo-Fairfield, CA, and Yuba City, CA;
4

• “PSF” means per square foot. When comparing homes or cohorts of homes, we believe PSF calculations help management and external stakeholders normalize metrics fordifferences in property size, enabling more meaningful comparisons based on characteristics other than property size;
• “revenue collections as a percentage of billings” represents the total cash received in a given period for rental revenues and other property income (including receipt of latepayments that were billed in prior months) divided by the total amounts billed in that period. When a payment plan is in place with a resident, amounts are considered to be billedat the time they would have been billed based on the terms of the original lease, not the terms of the payment plan. We believe this provides management and external stakeholderswith meaningful information about our success in collecting amounts due under our lease agreements;
• “Same Store” or “Same Store portfolio” includes, for a given reporting period, wholly owned homes that have been stabilized and seasoned, excluding homes that have been sold,homes that have been identified for sale to an owner occupant and have become vacant, homes that have been deemed inoperable or significantly impaired by casualty loss eventsor force majeure, homes acquired in portfolio transactions that are deemed not to have undergone renovations of sufficiently similar quality and characteristics as the existingInvitation Homes Same Store portfolio, and homes in markets that we have announced an intent to exit where we no longer operate a significant number of homes for the primarypurpose of income generation. Homes are considered stabilized if they have (i) completed an initial renovation and (ii) entered into at least one post-initial renovation lease. Anacquired portfolio that is both leased and deemed to be of sufficiently similar quality and characteristics as the existing Invitation Homes Same Store portfolio may be consideredstabilized at the time of acquisition. Homes are considered to be seasoned once they have been stabilized for at least 15 months prior to January 1st of the year in which the SameStore portfolio was established. We believe information about the portion of our portfolio that has been fully operational for the entirety of a given reporting period and its prioryear comparison period provides management and external stakeholders with meaningful information about the performance of our comparable homes across periods and abouttrends in our organic business;
• “Southeast United States” includes our Atlanta and Carolinas markets;
• “South Florida” includes Miami-Fort Lauderdale-West Palm Beach, FL, and Port St. Lucie, FL;
• “Southern California” includes Los Angeles-Long Beach-Anaheim, CA, Oxnard-Thousand Oaks-Ventura, CA, Riverside-San Bernardino-Ontario, CA, and San Diego-Carlsbad,CA;
• “total homes” or “total portfolio” refers to the total number of homes we own, whether or not stabilized, and excludes any properties previously acquired in purchases that havebeen subsequently rescinded or vacated. Unless otherwise indicated, total homes or total portfolio refers to the wholly owned homes and excludes homes owned in joint ventures.Additionally, unless the context otherwise requires, all measures in this Quarterly Report on Form 10-Q are presented on a total portfolio basis;
• “turnover rate” represents the number of instances that homes in an identified population become unoccupied in a given period, divided by the number of homes in suchpopulation. To the extent the measurement period shown is less than 12 months, the turnover rate may be reflected on an annualized basis. We believe turnover rate impactsaverage occupancy and thus our rental revenues, making comparisons of turnover rate helpful to management and external stakeholders in evaluating changes in rental revenuesacross periods. In addition, turnover can impact our cost to maintain homes, making changes in turnover rate useful to management and external stakeholders in evaluating changesin our property operating and maintenance expenses across periods; and
• “Western United States” includes our Southern California, Northern California, Seattle, Phoenix, Las Vegas, and Denver markets.
5
PART IITEM 1. FINANCIAL STATEMENTS
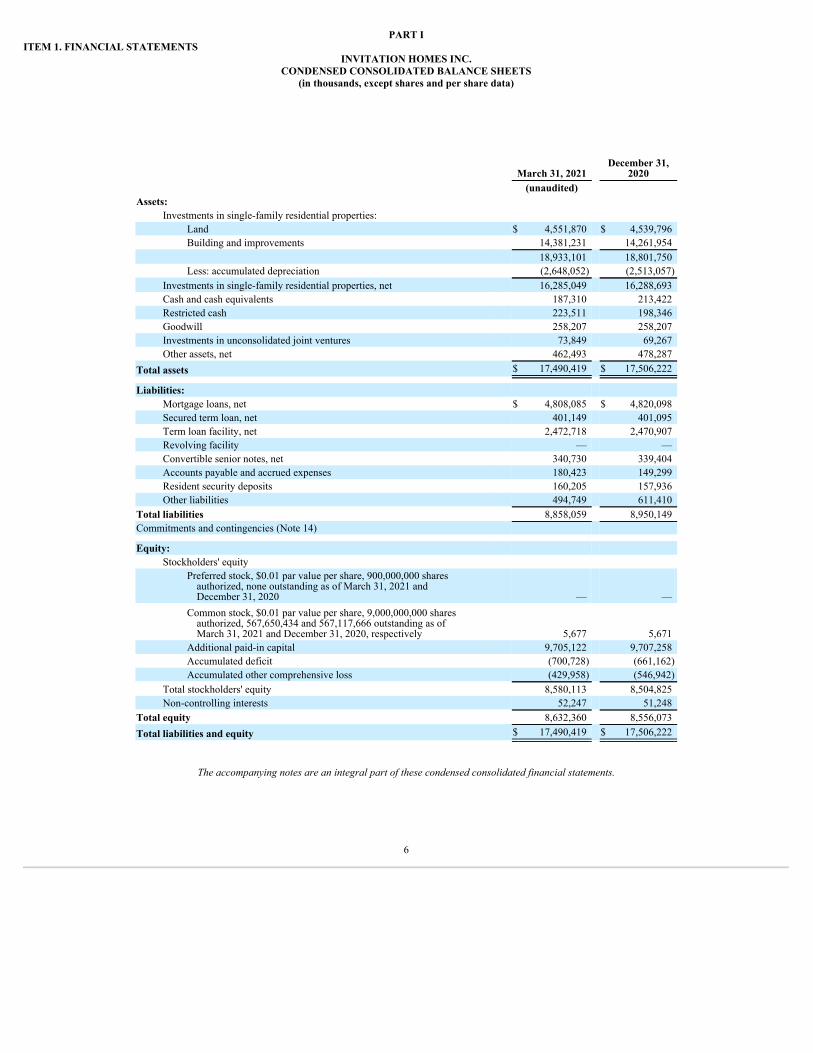
INVITATION HOMES INC.CONDENSED CONSOLIDATED BALANCE SHEETS
(in thousands, except shares and per share data)
March 31, 2021December 31,
2020(unaudited)
Assets:Investments in single-family residential properties:
Land $ 4,551,870 $ 4,539,796 Building and improvements 14,381,231 14,261,954
18,933,101 18,801,750 Less: accumulated depreciation (2,648,052) (2,513,057)
Investments in single-family residential properties, net 16,285,049 16,288,693 Cash and cash equivalents 187,310 213,422 Restricted cash 223,511 198,346 Goodwill 258,207 258,207 Investments in unconsolidated joint ventures 73,849 69,267 Other assets, net 462,493 478,287
Total assets $ 17,490,419 $ 17,506,222
Liabilities:Mortgage loans, net $ 4,808,085 $ 4,820,098 Secured term loan, net 401,149 401,095 Term loan facility, net 2,472,718 2,470,907 Revolving facility — — Convertible senior notes, net 340,730 339,404 Accounts payable and accrued expenses 180,423 149,299 Resident security deposits 160,205 157,936 Other liabilities 494,749 611,410
Total liabilities 8,858,059 8,950,149 Commitments and contingencies (Note 14)
Equity:Stockholders' equity
Preferred stock, $0.01 par value per share, 900,000,000 sharesauthorized, none outstanding as of March 31, 2021 andDecember 31, 2020 — —
Common stock, $0.01 par value per share, 9,000,000,000 sharesauthorized, 567,650,434 and 567,117,666 outstanding as ofMarch 31, 2021 and December 31, 2020, respectively 5,677 5,671
Additional paid-in capital 9,705,122 9,707,258 Accumulated deficit (700,728) (661,162)Accumulated other comprehensive loss (429,958) (546,942)
Total stockholders' equity 8,580,113 8,504,825 Non-controlling interests 52,247 51,248
Total equity 8,632,360 8,556,073 Total liabilities and equity $ 17,490,419 $ 17,506,222
The accompanying notes are an integral part of these condensed consolidated financial statements.
6

INVITATION HOMES INC.CONDENSED CONSOLIDATED STATEMENTS OF OPERATIONS
(in thousands, except shares and per share data)(unaudited)
For the Three Months Ended March 31,
2021 2020Revenues:
Rental revenues and other property income $ 474,454 $ 449,789 Joint venture management fees 771 —
Total revenues 475,225 449,789
Expenses:Property operating and maintenance 168,373 166,916 Property management expense 15,842 14,372 General and administrative 16,950 14,228 Interest expense 83,406 84,757 Depreciation and amortization 144,501 135,027 Impairment and other 356 3,127
Total expenses 429,428 418,427
Unrealized gains (losses) on investments in equitysecurities (3,140) 34
Other, net 230 3,680 Gain on sale of property, net of tax 14,484 15,200 Income from investments in unconsolidated joint
ventures 351 —
Net income 57,722 50,276 Net income attributable to non-controlling interests (355) (320)
Net income attributable to common stockholders 57,367 49,956 Net income available to participating securities (95) (102)
Net income available to common stockholders — basicand diluted (Note 12) $ 57,272 $ 49,854
Weighted average common shares outstanding — basic 567,375,502 542,549,512
Weighted average common shares outstanding — diluted 568,826,104 543,904,420
Net income per common share — basic $ 0.10 $ 0.09
Net income per common share — diluted $ 0.10 $ 0.09
The accompanying notes are an integral part of these condensed consolidated financial statements.
7

INVITATION HOMES INC.CONDENSED CONSOLIDATED STATEMENTS OF COMPREHENSIVE GAIN (LOSS)
(in thousands)(unaudited)
For the Three Months Ended March 31,
2021 2020Net income $ 57,722 $ 50,276
Other comprehensive lossUnrealized gains (losses) on interest rate swaps 80,059 (341,438)Losses from interest rate swaps reclassified into earnings
from accumulated other comprehensive loss 37,643 8,567 Other comprehensive gain (loss) 117,702 (332,871)
Comprehensive gain (loss) 175,424 (282,595)Comprehensive (gain) loss attributable to non-controlling
interests (1,073) 1,749
Comprehensive gain (loss) attributable to commonstockholders $ 174,351 $ (280,846)
The accompanying notes are an integral part of these condensed consolidated financial statements.
8

INVITATION HOMES INC.CONDENSED CONSOLIDATED STATEMENTS OF EQUITY
For the Three Months Ended March 31, 2021 and 2020(in thousands, except share and per share data)
(unaudited)
Common Stock
Number ofShares Amount
Additional Paid-inCapital
AccumulatedDeficit
AccumulatedOther
ComprehensiveLoss
TotalStockholders'
Equity
Non-Controlling
Interests Total EquityBalance as of December 31, 2020 567,117,666 $ 5,671 $ 9,707,258 $ (661,162) $ (546,942) $ 8,504,825 $ 51,248 $ 8,556,073
Capital distributions — — — — — — (605) (605)Net income — — — 57,367 — 57,367 355 57,722 Dividends and dividend equivalents declared
($0.17 per share) — — — (96,933) — (96,933) — (96,933)Issuance of common stock — settlement of RSUs,
net of tax 532,768 6 (7,419) — — (7,413) — (7,413)Share-based compensation expense — — 5,283 — — 5,283 531 5,814 Total other comprehensive income — — — — 116,984 116,984 718 117,702
Balance as of March 31, 2021 567,650,434 $ 5,677 $ 9,705,122 $ (700,728) $ (429,958) $ 8,580,113 $ 52,247 $ 8,632,360
Common Stock
Number ofShares Amount
Additional Paid-inCapital
AccumulatedDeficit
AccumulatedOther
ComprehensiveLoss
TotalStockholders'
Equity
Non-Controlling
Interests Total EquityBalance as of December 31, 2019 541,642,725 $ 5,416 $ 9,010,194 $ (524,588) $ (276,600) $ 8,214,422 $ 51,656 $ 8,266,078
Capital distributions — — — — — — (534) (534)Net income — — — 49,956 — 49,956 320 50,276 Dividends and dividend equivalents declared ($0.15 per
share) — — — (81,673) — (81,673) — (81,673)Issuance of common stock — settlement of RSUs, net of tax 252,654 3 (3,174) — — (3,171) — (3,171)Issuance of common stock, net 1,872,066 19 55,902 — — 55,921 — 55,921 Share-based compensation expense — — 3,590 — — 3,590 511 4,101 Total other comprehensive loss — — — — (330,802) (330,802) (2,069) (332,871)
Balance as of March 31, 2020 543,767,445 $ 5,438 $ 9,066,512 $ (556,305) $ (607,402) $ 7,908,243 $ 49,884 $ 7,958,127
The accompanying notes are an integral part of these condensed consolidated financial statements.
9

INVITATION HOMES INC.CONDENSED CONSOLIDATED STATEMENTS OF CASH FLOWS
(in thousands)(unaudited)
For the Three Months Ended March 31,
2021 2020Operating Activities:
Net income $ 57,722 $ 50,276 Adjustments to reconcile net income to net cash provided by
operating activities:Depreciation and amortization 144,501 135,027 Share-based compensation expense 5,814 4,101 Amortization of deferred leasing costs 2,735 2,856 Amortization of deferred financing costs 3,510 7,952 Amortization of debt discounts 1,414 1,348 Provisions for impairment 431 2,471 Unrealized (gains) losses on investments in equity securities 3,140 (34)Gain on sale of property, net of tax (14,484) (15,200)Change in fair value of derivative instruments 3,622 1,091 Income from investments in unconsolidated joint ventures, net of
operating distributions (253) — Other non-cash amounts included in net income 1,103 (151)Changes in operating assets and liabilities:
Other assets, net (2,803) (10,787)Accounts payable and accrued expenses 34,297 (4,534)Resident security deposits 2,269 2,373 Other liabilities (2,430) 932
Net cash provided by operating activities 240,588 177,721 Investing Activities:
Amounts deposited and held by others (3,330) (773)Acquisition of single-family residential properties (127,467) (137,471)Initial renovations to single-family residential properties (22,489) (31,042)Other capital expenditures for single-family residential properties (34,855) (40,220)Proceeds from sale of single-family residential properties 69,329 123,318 Repayment proceeds from retained debt securities 728 5,539 Investments in unconsolidated joint ventures (5,000) — Non-operating distributions from unconsolidated joint ventures 671 — Other investing activities (143) (93)
Net cash used in investing activities (122,556) (80,742)Financing Activities:
Payment of dividends and dividend equivalents (97,230) (81,774)Distributions to non-controlling interests (605) (534)Payment of taxes related to net share settlement of RSUs (7,413) (3,171)Payments on mortgage loans (13,022) (107,387)Proceeds from revolving facility — 320,000 Payments on revolving facility — (50,000)Proceeds from issuance of common stock, net — 55,921 Other financing activities (709) (484)
Net cash provided by (used in) financing activities (118,979) 132,571
Change in cash, cash equivalents, and restricted cash (947) 229,550 Cash, cash equivalents, and restricted cash, beginning of period
(Note 4) 411,768 286,245 Cash, cash equivalents, and restricted cash, end of period (Note 4) $ 410,821 $ 515,795
10

INVITATION HOMES INC.CONDENSED CONSOLIDATED STATEMENTS OF CASH FLOWS (continued)
(in thousands)(unaudited)
For the Three Months Ended March 31,
2021 2020Supplemental cash flow disclosures:
Interest paid, net of amounts capitalized $ 78,171 $ 77,326 Cash paid for income taxes 331 362 Cash paid for amounts included in the measurement of lease
liabilities:Operating cash flows from operating leases 1,515 1,398 Financing cash flows from finance leases 678 454
Non-cash investing and financing activities:Accrued renovation improvements at period end $ 4,540 $ 12,489 Accrued residential property capital improvements at period end 7,077 11,159 Transfer of residential property, net to other assets, net for held for
sale assets 24,666 60,061 Change in other comprehensive loss from cash flow hedges 114,111 (333,949)ROU assets obtained in exchange for operating lease liabilities 557 518 ROU assets obtained in exchange for finance lease liabilities — 7,285
The accompanying notes are an integral part of these condensed consolidated financial statements.
11

INVITATION HOMES INC.NOTES TO CONDENSED CONSOLIDATED FINANCIAL STATEMENTS
(dollar amounts in thousands)(unaudited)
Note 1—Organization and Formation
Invitation Homes Inc. (“INVH”) is a real estate investment trust (“REIT”) that conducts its operations through Invitation Homes Operating Partnership LP (“INVH LP”).INVH LP was formed for the purpose of owning, renovating, leasing, and operating single-family residential properties. Through THR Property Management L.P., a wholly ownedsubsidiary of INVH LP (the “Manager”), we provide all management and other administrative services with respect to the properties we own.
On February 6, 2017, INVH completed an initial public offering (“IPO”), changed its jurisdiction of incorporation to Maryland, and amended its charter to provide for theissuance of up to 9,000,000,000 shares of common stock and 900,000,000 shares of preferred stock, in each case $0.01 par value per share. In connection with certain pre-IPOreorganization transactions, INVH LP became (1) owned by INVH directly and through Invitation Homes OP LLC, a wholly owned subsidiary of INVH, and (2) the owner of all ofthe assets, liabilities, and operations of certain pre-IPO ownership entities. These transactions were accounted for as a reorganization of entities under common control utilizinghistorical cost basis.
On November 16, 2017 (the “Merger Date”), INVH and certain of its affiliates entered into a series of transactions with Starwood Waypoint Homes (“SWH”) and certain SWHaffiliates which resulted in SWH and its operating partnership being merged into INVH and INVH LP, respectively, with INVH and INVH LP being the surviving entities (the“Mergers”). The Mergers were accounted for as a business combination in accordance with ASC 805, Business Combinations, and INVH was designated as the accounting acquirer.
The limited partnership interests of INVH LP consist of common units and other classes of limited partnership interests that may be issued (the “OP Units”). As of March 31,2021, INVH owns 99.4% of the common OP Units and has the full, exclusive, and complete responsibility for and discretion over the day to day management and control ofINVH LP.
Our organizational structure includes several wholly owned subsidiaries of INVH LP that were formed to facilitate certain of our financing arrangements (the “BorrowerEntities”). These Borrower Entities are used to align the ownership of our single-family residential properties with certain of our debt instruments. Collateral for certain of ourindividual debt instruments may be in the form of equity interests in the Borrower Entities or in pools of single-family residential properties owned either directly by the BorrowerEntities or indirectly by their wholly owned subsidiaries (see Note 7).
References to “Invitation Homes,” the “Company,” “we,” “our,” and “us” refer, collectively, to INVH, INVH LP, and the consolidated subsidiaries of INVH LP.
Note 2—Significant Accounting Policies
Basis of Presentation
The accompanying interim condensed consolidated financial statements are unaudited and have been prepared in accordance with accounting principles generally accepted in theUnited States (“GAAP”) and with the rules and regulations of the Securities and Exchange Commission for interim financial information and Article 10 of Regulation S-X.Accordingly, they do not include all of the information and footnotes required by GAAP for complete financial statements and should be read in conjunction with our auditedconsolidated financial statements and notes thereto included in our Annual Report on Form 10-K for the year ended December 31, 2020.
These condensed consolidated financial statements include the accounts of INVH and its consolidated subsidiaries. All intercompany accounts and transactions have beeneliminated in the condensed consolidated financial statements. In the opinion of management, all adjustments that are of a normal recurring nature considered necessary for a fairpresentation of our interim financial statements have been included in these condensed consolidated financial statements. Operating results for the three months ended March 31,2021 are not necessarily indicative of the results that may be expected for the fiscal year ending December 31, 2021.
12

INVITATION HOMES INC.NOTES TO CONDENSED CONSOLIDATED FINANCIAL STATEMENTS
(dollar amounts in thousands)(unaudited)
We consolidate entities when we own, directly or indirectly, a majority interest in the entity or are otherwise able to control the entity. We consolidate variable interest entities(“VIEs”) in accordance with ASC 810, Consolidation, if we are the primary beneficiary of the VIE as determined by our power to direct the VIE’s activities and the obligation toabsorb its losses or the right to receive its benefits, which are potentially significant to the VIE. A VIE is broadly defined as an entity with one or more of the followingcharacteristics: (a) the total equity investment at risk is insufficient to finance the entity’s activities without additional subordinated financial support; (b) as a group, the holders ofthe equity investment at risk lack (i) the ability to make decisions about the entity’s activities through voting or similar rights, (ii) the obligation to absorb the expected losses of theentity, or (iii) the right to receive the expected residual returns of the entity; or (c) the equity investors have voting rights that are not proportional to their economic interests, andsubstantially all of the entity’s activities either involve, or are conducted on behalf of, an investor that has disproportionately few voting rights.
As described in Note 5, we invested in joint ventures with Rockpoint Group, L.L.C. (“Rockpoint”) and the Federal National Mortgage Association (“FNMA”), both of which arevoting interest entities. We do not hold a controlling financial interest in either joint venture but have significant influence over the operating and financial policies of each jointventure. Additionally, both Rockpoint and FNMA hold certain substantive participating rights that preclude the presumption of control by us of either joint venture; as such, weaccount for each investment using the equity method. Our investment in the Rockpoint joint venture is recorded at cost, and our investment in the FNMA joint venture was initiallyrecorded at fair value in connection with purchase accounting for the Mergers. The investments in these joint ventures are subsequently adjusted for our proportionate share of netearnings or losses and other comprehensive income or loss, cash contributions made and distributions received, and other adjustments, as appropriate. Distributions of operatingprofit from the joint ventures are reported as part of operating cash flows while distributions related to a capital transaction, such as a refinancing transaction or sale, are reported asinvesting activities.
Non-controlling interests represent the OP Units not owned by INVH, including any vested OP Units granted in connection with certain share-based compensation awards. Non-controlling interests are presented as a separate component of equity on the condensed consolidated balance sheets as of March 31, 2021 and December 31, 2020, and the condensedconsolidated statements of operations for the three months ended March 31, 2021 and 2020 include an allocation of the net income attributable to the non-controlling interest holders.Vested OP Units are redeemable for shares of our common stock on a one-for-one basis or, in our sole discretion, cash, and redemptions of OP Units are accounted for as a reductionin non-controlling interests with an offset to stockholders’ equity based on the pro rata number of OP Units redeemed.
Significant Risks and Uncertainties
One of the most significant risks and uncertainties to our financial condition and results of operations continues to be the adverse effect of the ongoing pandemic resulting fromthe coronavirus, or COVID-19. We are closely monitoring the impact of the pandemic on all aspects of our business.
Since the outbreak, a number of our residents have requested rent deferral and/or late fee relief, and components of our rental revenues and other property income have beenimpacted by the pandemic. In addition, entities directed by, or notionally affiliated with, the Federal government as well as some state and local jurisdictions across the United States,have imposed temporary eviction moratoriums if certain criteria are met by residents, are allowing residents to defer missed rent payments without incurring late fees, and areprohibiting rent increases. We comply with all applicable Federal, state, and local laws, regulations, and ordinances, and we adhere to restrictions on evictions, collections, rentincreases, and late fees as appropriate. Jurisdictions and other local and national authorities may expand or extend measures imposing restrictions on our ability to enforce residents’contractual rental obligations and limiting our ability to increase rents. We cannot predict if states, municipalities, local, and/or national authorities will expand existing restrictions, ifadditional states or municipalities will implement similar restrictions, or when restrictions currently in place will expire. While none of the current restrictions have materiallyimpacted our ability to provide services to our residents or homes, future measures may negatively impact our ability to access our homes, complete service requests, or make ourhomes ready for new residents.
The COVID-19 pandemic could have material and adverse effects on our financial condition, results of operations, and cash flows in the near term due to, but not limited to, thefollowing: (1) reduced economic activity that impacts the earnings or health of our residents, thereby causing them to be unable to fully meet their obligations to us and resulting inincreases in uncollectible revenues and thus reductions in rental revenues and other property income; (2) governmental regulations, restrictions and moratoriums that negativelyimpact our ability to charge and collect rental revenues and other property
13

INVITATION HOMES INC.NOTES TO CONDENSED CONSOLIDATED FINANCIAL STATEMENTS
(dollar amounts in thousands)(unaudited)
income or impose restrictions on our ability to provide services to our residents and homes; (3) negative financial impact of the pandemic that could impact our ability to access fundsavailable under our Revolving Facility (as defined in Note 7) or affect future compliance with financial covenants of our Credit Facility (as defined in Note 7) and other debtagreements; and (4) weaker economic conditions that could cause us to recognize impairments in value of our tangible assets or goodwill.
On March 11, 2021, the American Rescue Plan Act (the “ARPA”), a $1.9 trillion COVID-19 relief package authorizing additional federal spending and an increase in anti-poverty programs to help millions of families still struggling amid the pandemic, was signed into law. The ARPA includes nearly $50 billion in housing and homelessness resourcesand provides over $27 billion for rental assistance. It is uncertain if the ARPA’s housing and rental assistance resources will enable longer term housing stability for some of ourresidents and/or reduce rent receivable balances accrued during the pandemic.
The extent to which the ongoing COVID-19 pandemic ultimately impacts our operations depends on ongoing developments, which remain highly uncertain and cannot bepredicted with confidence, including the scope, severity, and duration of the pandemic, the extent and duration of actions taken to contain the pandemic or mitigate its impact, theavailability, distribution, and efficacy of vaccines, development and availability of effective therapeutic drugs, and the direct and indirect economic effects of the pandemic,containment measures, monetary and/or fiscal policies implemented to provide support or relief to businesses and/or residents, and other government, regulatory, and/or legislativechanges precipitated by the ongoing COVID-19 pandemic, among others. While we have taken steps to mitigate the impact of the pandemic on our results of operations, there can beno assurance that these efforts will be successful.
Reclassification
We reclassified $34 of unrealized gains on investments in equity securities from other, net into unrealized gains (losses) on investments in equity securities on our condensedconsolidated statement of operations for the three months ended March 31, 2020 to conform to our current presentation. We also reclassified $34 of unrealized gains on investmentsin equity securities from other non-cash amounts included in net income into unrealized (gains) losses on investments in equity securities on our condensed consolidated statement ofcash flows for the three months ended March 31, 2020 to conform to our current presentation. These reclassifications had no effect on the total reported net income on the condensedconsolidated statement of operations or on the total net cash provided by operating activities on the condensed consolidated statement of cash flows for the three months endedMarch 31, 2020.
Use of Estimates
The preparation of the condensed consolidated financial statements in conformity with GAAP requires us to make estimates and assumptions that affect the reported amounts ofassets and liabilities and disclosure of contingent assets and liabilities at the date of the condensed consolidated financial statements, as well as the reported amounts of revenues andexpenses during the reporting periods. These estimates are inherently subjective in nature and actual results could differ from those estimates.
Accounting Policies
There have been no changes to our significant accounting policies that have had a material impact on our condensed consolidated financial statements and related notes,compared to those policies disclosed in our audited consolidated financial statements included in our Annual Report on Form 10-K for the year ended December 31, 2020.
Recent Accounting Pronouncements
In August 2020, the Financial Accounting Standards Board issued Accounting Standards Update (“ASU”) 2020-06, Debt—Debt with Conversion and Other Options(Subtopic 470-20) and Derivatives and Hedging—Contracts in Entity’s Own Equity (Subtopic 815-40) (“ASU 2020-06”), which simplifies an issuer’s accounting for convertibleinstruments and contracts in its own equity. The guidance reduces the number of accounting models for convertible instruments, requires entities to use the “if-converted” method indiluted earnings (loss) per share (“EPS”), and requires that the effect of potential share settlement be included in the diluted EPS calculation when an instrument may be settled incash or shares. The new standard will be effective for annual reporting periods beginning after December 15, 2021, and interim periods within that reporting period, with earlyadoption permitted beginning after December 15, 2020 and interim periods within that reporting period. Our 2022 Convertible Notes (as defined in Note 7) are the only instrumentswe have that will be subject to
14

INVITATION HOMES INC.NOTES TO CONDENSED CONSOLIDATED FINANCIAL STATEMENTS
(dollar amounts in thousands)(unaudited)
ASU 2020-06, and these notes mature on January 15, 2022. As such, ASU 2020-06 will not materially affect our condensed consolidated financial statements.
Note 3—Investments in Single-Family Residential Properties
The following table sets forth the net carrying amount associated with our properties by component:
March 31, 2021December 31,
2020
Land $ 4,551,870 $ 4,539,796
Single-family residential property 13,749,781 13,631,859
Capital improvements 516,503 515,479
Equipment 114,947 114,616
Total gross investments in the properties 18,933,101 18,801,750
Less: accumulated depreciation (2,648,052) (2,513,057)
Investments in single-family residential properties, net $ 16,285,049 $ 16,288,693
As of March 31, 2021 and December 31, 2020, the carrying amount of the residential properties above includes $120,533 and $119,929, respectively, of capitalized acquisitioncosts (excluding purchase price), along with $68,702 and $68,197, respectively, of capitalized interest, $27,213 and $26,899, respectively, of capitalized property taxes, $4,669 and$4,654, respectively, of capitalized insurance, and $3,139 and $3,090, respectively, of capitalized homeowners’ association (“HOA”) fees.
During the three months ended March 31, 2021 and 2020, we recognized $142,784 and $133,914, respectively, of depreciation expense related to the components of theproperties, and $1,717 and $1,113, respectively, of depreciation and amortization related to corporate furniture and equipment. These amounts are included in depreciation andamortization in the condensed consolidated statements of operations. Further, during the three months ended March 31, 2021 and 2020, impairments totaling $431 and $2,471,respectively, have been recognized and are included in impairment and other in the condensed consolidated statements of operations. See Note 11 for additional informationregarding these impairments.
Note 4—Cash, Cash Equivalents, and Restricted Cash
The following table provides a reconciliation of cash, cash equivalents, and restricted cash reported on the condensed consolidated balance sheets that sum to the total of suchamounts shown in the condensed consolidated statements of cash flows:
March 31, 2021December 31,
2020Cash and cash equivalents $ 187,310 $ 213,422 Restricted cash 223,511 198,346
Total cash, cash equivalents, and restricted cash shown inthe condensed consolidated statements of cash flows $ 410,821 $ 411,768
Pursuant to the terms of the mortgage loans and Secured Term Loan (as defined in Note 7), we are required to establish, maintain, and fund from time to time (generally, eithermonthly or at the time borrowings are funded) certain specified reserve accounts. These reserve accounts include, but are not limited to, the following types of accounts: (i) propertytax reserves; (ii) insurance reserves; (iii) capital expenditure reserves; and (iv) HOA reserves. The reserve accounts associated with our mortgage loans and Secured Term Loan areunder the sole control of the loan servicer. Additionally, we hold security deposits pursuant to resident lease agreements that we are required to segregate. We are also required tohold letters of credit by certain of our insurance policies. Accordingly, amounts funded to these reserve accounts, security deposit accounts, and other restricted accounts have beenclassified on our condensed consolidated balance sheets as restricted cash.
15

INVITATION HOMES INC.NOTES TO CONDENSED CONSOLIDATED FINANCIAL STATEMENTS
(dollar amounts in thousands)(unaudited)
The amounts funded, and to be funded, to the reserve accounts are subject to formulae included in the mortgage loan and Secured Term Loan agreements and are to be releasedto us subject to certain conditions specified in the loan agreements being met. To the extent that an event of default were to occur, the loan servicer has discretion to use such funds toeither settle the applicable operating expenses to which such reserves relate or reduce the allocated loan amount associated with a residential property of ours.
The balances of our restricted cash accounts, as of March 31, 2021 and December 31, 2020, are set forth in the table below. As of March 31, 2021 and December 31, 2020, noamounts were funded to the insurance accounts as the conditions specified in the mortgage loan and Secured Term Loan agreements that require such funding did not exist.
March 31, 2021December 31,
2020
Resident security deposits $ 160,459 $ 158,244
Property taxes 30,458 7,511
Collections 22,979 22,978
Capital expenditures 4,919 4,919
Letters of credit 3,321 3,320
Special and other reserves 1,375 1,374
Total $ 223,511 $ 198,346
Note 5—Investments In Unconsolidated Joint Ventures
We have invested in two joint ventures which are accounted for using the equity method model of accounting. The following table summarizes our investments inunconsolidated joint ventures as of March 31, 2021 and December 31, 2020:
Number of Properties Carrying ValueOwnershipPercentage
March 31,2021
December 31,2020 March 31, 2021
December 31,2020
FNMA 10 % 554 571 $ 53,344 $ 53,678
Rockpoint 20 % 435 140 20,505 15,589
Total $ 73,849 $ 69,267
(1) Contains homes primarily located in Arizona, California, and Nevada.(2) Contains homes in markets within the Western United States, Southeast United States, Florida, and Texas.
In October 2020, we entered into an agreement with Rockpoint to form a joint venture that will acquire homes in markets where we already own homes. As of February 2021,the joint venture is funded with a combination of debt and equity, and we have guaranteed the funding of certain tax, insurance, and non-conforming property reserves related to thejoint venture’s financing. As of March 31, 2021, our remaining equity commitment to the joint venture is $54,400.
For the three months ended March 31, 2021, we recorded of $351 of income from investments in unconsolidated joint ventures which is included in income from investments inunconsolidated joint ventures in the accompanying condensed consolidated statements of operations. For the three months ended March 31, 2020, we recorded $522 of income frominvestments in unconsolidated joint ventures which is included in other, net in the accompanying condensed consolidated statements of operations.
(1)
(2)
16

INVITATION HOMES INC.NOTES TO CONDENSED CONSOLIDATED FINANCIAL STATEMENTS
(dollar amounts in thousands)(unaudited)
The administrative manager of Rockpoint and the managing member of FNMA are wholly owned subsidiaries of INVH LP and are responsible for the operations andmanagement of the properties, subject to Rockpoint and FNMA’s respective approval of major decisions. The subsidiaries earn asset and property management fees from our jointventures, which are considered to be related parties. For the three months ended March 31, 2021, we earned $771 of management fees which are included in joint venturemanagement fees in the accompanying condensed consolidated statements of operations. For the three months ended March 31, 2020, we earned $680 of management fees which areincluded in other, net in the accompanying condensed consolidated statements of operations.
Note 6—Other Assets
As of March 31, 2021 and December 31, 2020, the balances in other assets, net are as follows:
March 31, 2021December 31,
2020
Investments in debt securities, net $ 244,597 $ 245,237
Investments in equity securities 44,760 47,189
Prepaid expenses 39,737 41,347
Rent and other receivables, net 36,455 35,256
Held for sale assets 31,897 44,163
ROU lease assets — operating and finance, net 20,611 21,705
Deferred financing costs, net 10,913 11,637
Corporate fixed assets, net 9,146 9,995
Deferred leasing costs, net 6,943 7,631
Amounts deposited and held by others 6,546 2,852
Derivative instruments (Note 8) 1 1
Other 10,887 11,274
Total $ 462,493 $ 478,287
(1) As of March 31, 2021 and December 31, 2020, 128 and 179 properties, respectively, are classified as held for sale.
Investments in Debt Securities, net
In connection with certain of our Securitizations (as defined in Note 7), we have retained and purchased certificates totaling $244,597, net of unamortized discounts of $2,201, asof March 31, 2021. These investments in debt securities are classified as held to maturity investments. As of March 31, 2021, we have not recognized any credit losses with respect tothese investments in debt securities, and our retained certificates are scheduled to mature over the next two months to six years.
Investments in Equity Securities
We hold investments in equity securities both with and without a readily determinable fair value. Investments with a readily determinable fair value are measured at fair value.Investments without a readily determinable fair value are measured at cost, less any impairment, plus or minus changes resulting from observable price changes for identical orsimilar
(1)
17
INVITATION HOMES INC.NOTES TO CONDENSED CONSOLIDATED FINANCIAL STATEMENTS
(dollar amounts in thousands)(unaudited)
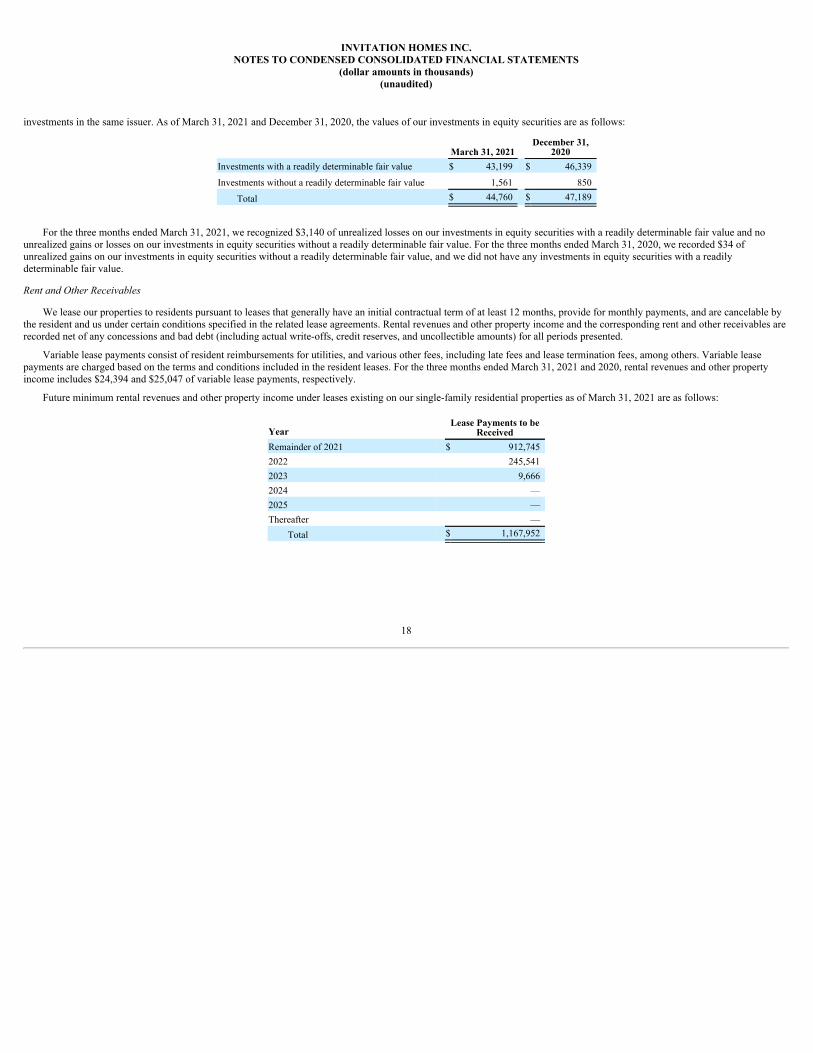
investments in the same issuer. As of March 31, 2021 and December 31, 2020, the values of our investments in equity securities are as follows:
March 31, 2021December 31,
2020Investments with a readily determinable fair value $ 43,199 $ 46,339
Investments without a readily determinable fair value 1,561 850
Total $ 44,760 $ 47,189
For the three months ended March 31, 2021, we recognized $3,140 of unrealized losses on our investments in equity securities with a readily determinable fair value and nounrealized gains or losses on our investments in equity securities without a readily determinable fair value. For the three months ended March 31, 2020, we recorded $34 ofunrealized gains on our investments in equity securities without a readily determinable fair value, and we did not have any investments in equity securities with a readilydeterminable fair value.
Rent and Other Receivables
We lease our properties to residents pursuant to leases that generally have an initial contractual term of at least 12 months, provide for monthly payments, and are cancelable bythe resident and us under certain conditions specified in the related lease agreements. Rental revenues and other property income and the corresponding rent and other receivables arerecorded net of any concessions and bad debt (including actual write-offs, credit reserves, and uncollectible amounts) for all periods presented.
Variable lease payments consist of resident reimbursements for utilities, and various other fees, including late fees and lease termination fees, among others. Variable leasepayments are charged based on the terms and conditions included in the resident leases. For the three months ended March 31, 2021 and 2020, rental revenues and other propertyincome includes $24,394 and $25,047 of variable lease payments, respectively.
Future minimum rental revenues and other property income under leases existing on our single-family residential properties as of March 31, 2021 are as follows:
YearLease Payments to be
ReceivedRemainder of 2021 $ 912,745 2022 245,541 2023 9,666 2024 — 2025 — Thereafter —
Total $ 1,167,952
18

INVITATION HOMES INC.NOTES TO CONDENSED CONSOLIDATED FINANCIAL STATEMENTS
(dollar amounts in thousands)(unaudited)
Right-of-Use (“ROU”) Lease Assets — Operating and Finance, net
The following table presents supplemental information related to leases into which we have entered as a lessee as of March 31, 2021 and December 31, 2020:
March 31, 2021 December 31, 2020
OperatingLeases
FinanceLeases
OperatingLeases
FinanceLeases
Other assets $ 12,573 $ 8,038 $ 12,942 $ 8,763
Other liabilities (Note 14) 15,505 7,712 15,988 8,389
Weighted average remaining lease term 3.9 years 2.9 years 4.0 years 3.1 years
Weighted average discount rate 3.4 % 4.0 % 3.5 % 4.0 %
Deferred Financing Costs, net
In connection with a new amended and restated Revolving Facility (see Note 7), we incurred $11,832 of financing costs during the year ended December 31, 2020, which havebeen deferred as other assets, net on our condensed consolidated balance sheets. We amortize deferred financing costs as interest expense on a straight-line basis over the term of theRevolving Facility and accelerate amortization if debt is retired before the maturity date. As of March 31, 2021 and December 31, 2020, the unamortized balances of these deferredfinancing costs are $10,913 and $11,637, respectively.
Note 7—Debt
Mortgage Loans
Our securitization transactions (the “Securitizations” or the “mortgage loans”) are collateralized by certain homes owned by the respective Borrower Entities. We utilize theproceeds from our securitizations to fund: (i) repayments of then-outstanding indebtedness; (ii) initial deposits into Securitization reserve accounts; (iii) closing costs in connectionwith the mortgage loans; and (iv) general costs associated with our operations.
19

INVITATION HOMES INC.NOTES TO CONDENSED CONSOLIDATED FINANCIAL STATEMENTS
(dollar amounts in thousands)(unaudited)
The following table sets forth a summary of our mortgage loan indebtedness as of March 31, 2021 and December 31, 2020:
Outstanding PrincipalBalance
OriginationDate
MaturityDate
Maturity Dateif Fully
ExtendedInterest Rate
Range ofSpreads March 31, 2021
December 31,2020
IH 2017-1April 28,
2017June 9,
2027June 9,
2027 4.23% N/A $ 994,875 $ 994,787
IH 2017-2November 9,
2017December 9,
2021December 9,
2024 1.26% 91-186 bps 610,862 612,506
IH 2018-1February 8,
2018March 9,
2022March 9,
2025 1.06% 76-151 bps 643,833 646,021 IH 2018-2 May 8,
2018June 9,
2021June 9,
2025 1.20% 95-150 bps 691,905 693,988 IH 2018-3 June 28,
2018July 9, 2021
July 9, 2025 1.39% 105-205 bps 1,033,451 1,036,561
IH 2018-4November 7,
2018January 9,
2022January 9,
2026 1.46% 115-200 bps 844,273 848,270 Total Securitizations 4,819,199 4,832,133
Less: deferred financing costs, net (11,114) (12,035)Total $ 4,808,085 $ 4,820,098
(1) The maturity dates above reflect all extension options that have been exercised.(2) Represents the maturity date if we exercise each of the remaining one year extension options available, which are subject to certain conditions being met.(3) Except for IH 2017-1, interest rates are based on a weighted average spread over the London Interbank Offer Rate (“LIBOR”) (or a comparable or successor rate as provided for
in our loan agreements), plus applicable servicing fees; as of March 31, 2021, LIBOR was 0.11%. Our IH 2017-1 mortgage loan bears interest at a fixed rate of 4.23% perannum, equal to the market determined pass-through rate payable on the certificates including applicable servicing fees.
(4) Range of spreads is based on outstanding principal balances as of March 31, 2021.(5) Outstanding principal balance is net of discounts and does not include deferred financing costs, net.(6) Net of unamortized discount of $2,201 and $2,289 as of March 31, 2021 and December 31, 2020, respectively.(7) The initial maturity term of each of these mortgage loans is two years, individually subject to three to five, one year extension options at the Borrower Entity’s discretion
(provided that there is no continuing event of default under the mortgage loan agreement and the Borrower Entity obtains and delivers a replacement interest rate cap agreementfrom an approved counterparty within the required timeframe to the lender). Our IH 2018-2, IH 2018-3, and IH 2018-4 mortgage loans have exercised the first extension option,and our IH 2017-2 and IH 2018-1 mortgage loans have exercised the second extension option. The maturity dates above reflect all extensions that have been exercised.
(8) On March 5, 2021, we submitted a notification to request an extension of the maturity date of the IH 2018-2 mortgage loan from June 9, 2021 to June 9, 2022.(9) On April 6, 2021, we submitted a notification to request an extension of the maturity date of the IH 2018-3 mortgage loan from July 9, 2021 to July, 9 2022 (see Note 15).
Securitization Transactions
For each Securitization transaction, the Borrower Entity executed a loan agreement with a third party lender. Except for IH 2017-1, each outstanding mortgage loan originallyconsisted of six floating rate components. The two year initial terms are individually subject to three to five, one year extension options at the Borrower Entity’s discretion. Suchextensions are available provided there is no continuing event of default under the respective mortgage loan agreement and the Borrower Entity obtains and delivers a replacementinterest rate cap agreement from an approved counterparty within the required timeframe to the lender. IH 2017-1 is a 10 year, fixed rate mortgage loan comprised of twocomponents. Certificates issued
(5)
(1) (2) (3) (4)
(6)
(7)
(7)
(7)(8)
(7)(9)
(7)
20

INVITATION HOMES INC.NOTES TO CONDENSED CONSOLIDATED FINANCIAL STATEMENTS
(dollar amounts in thousands)(unaudited)
by the trust in connection with Component A of IH 2017-1 benefit from FNMA’s guaranty of timely payment of principal and interest.
Each mortgage loan is secured by a pledge of the equity in the assets of the respective Borrower Entities, as well as first-priority mortgages on the underlying properties and agrant of security interests in all of the related personal property. As of March 31, 2021 and December 31, 2020, a total of 31,252 and 31,316 homes, respectively, with a net bookvalue of $5,708,828 and $5,761,551, respectively, are pledged pursuant to the mortgage loans. Each Borrower Entity has the right, subject to certain requirements and limitationsoutlined in the respective loan agreements, to substitute properties. We are obligated to make monthly payments of interest for each mortgage loan.
Transactions with Trusts
Concurrent with the execution of each mortgage loan agreement, the respective third party lender sold each loan it originated to individual depositor entities (the “DepositorEntities”) who subsequently transferred each loan to Securitization-specific trust entities (the “Trusts”). The Depositor Entities for our currently outstanding Securitizations arewholly owned subsidiaries. We accounted for the transfers of the individual Securitizations from the wholly owned Depositor Entities to the respective Trusts as sales underASC 860, Transfers and Servicing, with no resulting gain or loss as the Securitizations were both originated by the lender and immediately transferred at the same fair market value.
As consideration for the transfer of each loan to the Trusts, the Trusts issued classes of certificates which mirror the components of the individual loans (collectively, the“Certificates”) to the Depositor Entities, except that Class R certificates do not have related loan components as they represent residual interests in the Trusts. The Certificatesrepresent the entire beneficial interest in the Trusts. Following receipt of the Certificates, the Depositor Entities sold the Certificates to investors and used the proceeds asconsideration for the loans sold to the Depositor Entities by the lenders. These transactions had no effect on our condensed consolidated financial statements other than with respectto Certificates we retained in connection with Securitizations or purchased at a later date.
The Trusts are structured as pass-through entities that receive interest payments from the Securitizations and distribute those payments to the holders of the Certificates. Theassets held by the Trusts are restricted and can only be used to fulfill the obligations of those entities. The obligations of the Trusts do not have any recourse to the general credit ofany entities in these condensed consolidated financial statements. We have evaluated our interests in certain certificates of the Trusts held by us (discussed below) and determinedthat they do not create a more than insignificant variable interest in the Trusts. Additionally, the retained certificates do not provide us with any ability to direct activities that couldimpact the Trusts’ economic performance. Therefore, we do not consolidate the Trusts.
Retained Certificates
As the Trusts made Certificates available for sale to both domestic and foreign investors, sponsors of the mortgage loans are required to retain a portion of the risk that representsa material net economic interest in each loan pursuant to Regulation RR (the “Risk Retention Rules”) under the Securities Exchange Act of 1934, as amended. As such, loan sponsorsare required to retain a portion of the credit risk that represents not less than 5% of the aggregate fair value of the loan as of the closing date.
IH 2017-1 issued Class B certificates, which are restricted certificates that were made available exclusively to INVH LP in order to comply with the Risk Retention Rules. TheClass B certificates bear a stated annual interest rate of 4.23%, including applicable servicing fees.
For IH 2017-2, IH 2018-1, IH 2018-2, IH 2018-3, and IH 2018-4, we retain 5% of each class of certificates to meet the Risk Retention Rules. These retained certificates accrueinterest at a floating rate of LIBOR plus a spread ranging from 0.76% to 2.05%.
The retained certificates total $244,597 and $245,237 as of March 31, 2021 and December 31, 2020, respectively, and are classified as held to maturity investments and recordedin other assets, net on the condensed consolidated balance sheets (see Note 6).
21

INVITATION HOMES INC.NOTES TO CONDENSED CONSOLIDATED FINANCIAL STATEMENTS
(dollar amounts in thousands)(unaudited)
Loan Covenants
The general terms that apply to all of the mortgage loans require each Borrower Entity to maintain compliance with certain affirmative and negative covenants. Affirmativecovenants include each Borrower Entity’s, and certain of their respective affiliates’, compliance with (i) licensing, permitting and legal requirements specified in the mortgage loanagreements, (ii) organizational requirements of the jurisdictions in which they are organized, (iii) federal and state tax laws, and (iv) books and records requirements specified in therespective mortgage loan agreements. Negative covenants include each Borrower Entity’s, and certain of their affiliates’, compliance with limitations surrounding (i) the amount ofeach Borrower Entity’s indebtedness and the nature of their investments, (ii) the execution of transactions with affiliates, (iii) the Manager, (iv) the nature of each Borrower Entity’sbusiness activities, and (v) the required maintenance of specified cash reserves. As of March 31, 2021, and through the date our condensed consolidated financial statements wereissued, we believe each Borrower Entity is in compliance with all affirmative and negative covenants.
Prepayments
For the mortgage loans, prepayments of amounts owed by us are generally not permitted under the terms of the respective mortgage loan agreements unless such prepaymentsare made pursuant to the voluntary election or mandatory provisions specified in such agreements. The specified mandatory provisions become effective to the extent that a propertybecomes characterized as a disqualified property, a property is sold, and/or upon the occurrence of a condemnation or casualty event associated with a property. To the extent either avoluntary election is made, or a mandatory prepayment condition exists, in addition to paying all interest and principal, we must also pay certain breakage costs as determined by theloan servicer and a spread maintenance premium if prepayment occurs before the month following the one or two year anniversary of the closing dates of each of the mortgage loansexcept for IH 2017-1. For IH 2017-1, prepayments on or before December 2026 will require a yield maintenance premium. For the three months ended March 31, 2021 and 2020, wemade voluntary and mandatory prepayments of $13,022 and $107,387, respectively, under the terms of the mortgage loan agreements.
Secured Term Loan
On June 7, 2019, 2019-1 IH Borrower LP, a consolidated subsidiary (“2019-1 IH Borrower” and one of our Borrower Entities), entered into a 12 year loan agreement with a lifeinsurance company (the “Secured Term Loan”). The Secured Term Loan bears interest at a fixed rate of 3.59%, including applicable servicing fees, for the first 11 years and bearsinterest at a floating rate based on a spread of 147 bps, including applicable servicing fees, over one month LIBOR (subject to certain adjustments as outlined in the loan agreement)for the twelfth year. The Secured Term Loan is secured by first priority mortgages on a portfolio of single-family rental properties as well as a first priority pledge of the equityinterests of 2019-1 IH Borrower. We utilized the proceeds from the Secured Term Loan to fund: (i) repayments of then-outstanding indebtedness; (ii) initial deposits into the SecuredTerm Loan’s reserve accounts; (iii) transaction costs related to the closing of the Secured Term Loan; and (iv) general corporate purposes.
The following table sets forth a summary of our Secured Term Loan indebtedness as of March 31, 2021 and December 31, 2020:
MaturityDate
Interest Rate March 31, 2021
December 31,2020
Secured Term Loan June 9, 2031 3.59% $ 403,363 $ 403,363 Deferred financing costs, net (2,214) (2,268)
Secured Term Loan, net $ 401,149 $ 401,095
(1) The Secured Term Loan bears interest at a fixed rate of 3.59% per annum including applicable servicing fees for the first 11 years and for the twelfth year bears interest at afloating rate based on a spread of 147 bps over one month LIBOR (or a comparable or successor rate as provided for in our loan agreement), including applicable servicing fees,subject to certain adjustments as outlined in the loan agreement. Interest payments are made monthly.
(1)
22

INVITATION HOMES INC.NOTES TO CONDENSED CONSOLIDATED FINANCIAL STATEMENTS
(dollar amounts in thousands)(unaudited)
Collateral
The Secured Term Loan’s collateral pool contains 3,334 and 3,332 homes as of March 31, 2021 and December 31, 2020, respectively, with a net book value of $715,667 and$719,762, respectively. 2019-1 IH Borrower has the right, subject to certain requirements and limitations outlined in the loan agreement, to substitute properties representing up to20% of the collateral pool annually, and to substitute properties representing up to 100% of the collateral pool over the life of the Secured Term Loan. In addition, four times after thefirst anniversary of the closing date, 2019-1 IH Borrower has the right, subject to certain requirements and limitations outlined in the loan agreement, to execute a special release ofcollateral representing up to 15% of the then-outstanding principal balance of the Secured Term Loan in order to bring the loan-to-value ratio back in line with the Secured TermLoan’s loan-to-value ratio as of the closing date. Any such special release of collateral would not change the then-outstanding principal balance of the Secured Term Loan, but ratherwould reduce the number of single-family rental homes included in the collateral pool.
Loan Covenants
The Secured Term Loan requires 2019-1 IH Borrower to maintain compliance with certain affirmative and negative covenants. Affirmative covenants include 2019-1 IHBorrower’s, and certain of its affiliates’, compliance with (i) licensing, permitting and legal requirements specified in the loan agreement, (ii) organizational requirements of thejurisdictions in which they are organized, (iii) federal and state tax laws, and (iv) books and records requirements specified in the loan agreement. Negative covenants include 2019-1 IH Borrower’s, and certain of its affiliates’, compliance with limitations surrounding (i) the amount of 2019-1 IH Borrower’s indebtedness and the nature of its investments, (ii) theexecution of transactions with affiliates, (iii) the Manager, (iv) the nature of 2019-1 IH Borrower’s business activities, and (v) the required maintenance of specified cash reserves. Asof March 31, 2021, and through the date our condensed consolidated financial statements were issued, we believe 2019-1 IH Borrower is in compliance with all affirmative andnegative covenants.
Prepayments
Prepayments of the Secured Term Loan are generally not permitted unless such prepayments are made pursuant to the voluntary election or mandatory provisions specified in theloan agreement. The specified mandatory provisions become effective to the extent that a property becomes characterized as a disqualified property, a property is sold, and/or uponthe occurrence of a condemnation or casualty event associated with a property. To the extent either a voluntary election is made, or a mandatory prepayment condition exists, inaddition to paying all interest and principal, we must also pay certain breakage costs as determined by the loan servicer and a yield maintenance premium if prepayment occurs beforeJune 9, 2030. No such prepayments were made during the three months ended March 31, 2021 and 2020.
Term Loan Facility and Revolving Facility
On December 8, 2020, we entered into an Amended and Restated Revolving Credit and Term Loan Agreement with a syndicate of banks, financial institutions, and institutionallenders for a new credit facility (the “Credit Facility”). The Credit Facility provides $3,500,000 of borrowing capacity and consists of a $1,000,000 revolving facility (the “RevolvingFacility”) and a $2,500,000 term loan facility (the “Term Loan Facility”), both of which mature on January 31, 2025, with two six month extension options available. The RevolvingFacility also includes borrowing capacity for letters of credit. The Credit Facility provides us with the option to enter into additional incremental credit facilities (including anuncommitted incremental facility that provides us with the option to increase the size of the Revolving Facility and/or the Term Loan Facility such that the aggregate amount does notexceed at any time $4,000,000), subject to certain limitations.
The Credit Facility replaced a credit facility that consisted of a $1,000,000 revolving facility (the “2017 Revolving Facility”) and a $1,500,000 term loan facility (the “2017 TermLoan Facility” and together with the 2017 Revolving Facility, the “2017 Credit Facility”). The terms and conditions of the Credit Facility are consistent with those of the 2017 CreditFacility unless otherwise noted below. Proceeds from the Term Loan Facility were used to repay then-outstanding indebtedness, including the 2017 Term Loan Facility. Proceedsfrom the Revolving Facility are used for general corporate purposes.
23

INVITATION HOMES INC.NOTES TO CONDENSED CONSOLIDATED FINANCIAL STATEMENTS
(dollar amounts in thousands)(unaudited)
The following table sets forth a summary of the outstanding principal amounts under the Credit Facility as of March 31, 2021 and December 31, 2020, respectively:
Maturity Date
Interest Rate March 31, 2021
December 31,2020
Term Loan Facility January 31, 2025 1.66% $ 2,500,000 $ 2,500,000 Deferred financing costs, net (27,282) (29,093)
Term Loan Facility, net $ 2,472,718 $ 2,470,907
Revolving Facility January 31, 2025 1.71% $ — $ —
(1) Interest rates for the Term Loan Facility and the Revolving Facility are based on LIBOR plus an applicable margin. As of March 31, 2021, the applicable margins were 1.55%and 1.60% respectively, and LIBOR was 0.11%.
(2) If we exercise the two six month extension options, the maturity date will be January 31, 2026.
Interest Rate and Fees
Borrowings under the Credit Facility bear interest, at our option, at a rate equal to a margin over either (a) a LIBOR rate determined by reference to the Bloomberg LIBOR rate(or a comparable or successor rate as provided for in our loan agreement) for the interest period relevant to such borrowing, or (b) a base rate determined by reference to the highestof (1) the administrative agent’s prime lending rate, (2) the federal funds effective rate plus 0.50%, and (3) the LIBOR rate that would be payable on such day for a LIBOR rate loanwith a one month interest period plus 1.00%. The margin is based on a total leverage based grid. The margins for the Term Loan Facility, Revolving Facility, 2017 Term LoanFacility, and 2017 Revolving Facility are as follows:
Base Rate Loans LIBOR Rate LoansTerm Loan Facility 0.45% — 1.15% 1.45% — 2.15%Revolving Facility 0.50% — 1.15% 1.50% — 2.15%2017 Term Loan Facility 0.70% — 1.30% 1.70% — 2.30%2017 Revolving Facility 0.75% — 1.30% 1.75% — 2.30%
In addition, the Credit Facility provides that, upon receiving an investment grade rating on its non-credit enhanced, senior unsecured long term debt of BBB- or better fromStandard & Poor’s Rating Services, a division of The McGraw-Hill Companies, Inc., or Baa3 or better from Moody’s Investors Service, Inc., we may elect to convert to a creditrating based pricing grid. The margins for the Term Loan Facility and Revolving Facility under the credit rating based pricing grid are as follows:
Base Rate Loans LIBOR Rate LoansTerm Loan Facility — % — 0.65% 0.80% — 1.65%Revolving Facility — % — 0.45% 0.75% — 1.45%
The Credit Facility also includes a sustainability component whereby the Revolving Facility pricing can improve upon the Company’s achievement of certain sustainabilityratings, determined via an independent third party evaluation. This sustainability feature was not included in the 2017 Revolving Facility.
In addition to paying interest on outstanding principal under the Credit Facility, we are required to pay an unused facility fee to the lenders under the Revolving Facility inrespect of the unused commitments thereunder. The unused facility fee rate is based on the daily unused amount of the Revolving Facility and is either 0.30% or 0.20% per annumbased on the unused facility amount. The unused facility fee rate for the 2017 Revolving Facility was 0.35% or 0.20% per annum based on the unused facility amount. Uponconversion to a credit rating pricing based grid, the unused facility fee will no longer apply and we will be required to pay a facility fee ranging from 0.10% to 0.30%. We are alsorequired to pay customary letter of credit fees.
(1)
(2)
(2)
24

INVITATION HOMES INC.NOTES TO CONDENSED CONSOLIDATED FINANCIAL STATEMENTS
(dollar amounts in thousands)(unaudited)
Prepayments and Amortization
No principal reductions are required under the Credit Facility. We are permitted to voluntarily repay amounts outstanding under the Term Loan Facility at any time withoutpremium or penalty, subject to certain minimum amounts and the payment of customary “breakage” costs with respect to LIBOR loans. Once repaid, no further borrowings will bepermitted under the Term Loan Facility.
Loan Covenants
The Credit Facility contains certain customary affirmative and negative covenants and events of default. Such covenants will, among other things, restrict, subject to certainexceptions, our ability and that of the Subsidiary Guarantors (as defined below) and their respective subsidiaries to (i) engage in certain mergers, consolidations or liquidations,(ii) sell, lease or transfer all or substantially all of their respective assets, (iii) engage in certain transactions with affiliates, (iv) make changes to our fiscal year, (v) make changes inthe nature of our business and our subsidiaries, and (vi) enter into certain burdensome agreements.
The Credit Facility also requires us, on a consolidated basis with our subsidiaries, to maintain a (i) maximum total leverage ratio, (ii) maximum secured leverage ratio,(iii) maximum unencumbered leverage ratio, (iv) minimum fixed charge coverage ratio, (v) minimum unsecured interest coverage ratio, and (vi) maximum secured recourse leverageratio. If an event of default occurs, the lenders under the Credit Facility are entitled to take various actions, including the acceleration of amounts due under the Credit Facility. As ofMarch 31, 2021, and through the date our condensed consolidated financial statements were issued, we believe we were in compliance with all affirmative and negative covenants.
Guarantees and Security
The obligations under the Credit Facility are guaranteed on a joint and several basis by each of our direct and indirect domestic wholly owned subsidiaries that directly ownunencumbered assets (the “Subsidiary Guarantors”), subject to certain exceptions. These guarantees will be automatically released upon the occurrence of certain events, including ifthe applicable Subsidiary Guarantor is no longer a direct owner of an unencumbered asset. In addition, INVH and each subsidiary of INVH that owns equity in the Borrower may berequired to provide a guarantee of the Credit Facility under certain circumstances, including if INVH does not maintain its qualification as a REIT.
Although the 2017 Credit Facility was secured, such security interests have been released and the Credit Facility is unsecured.
Convertible Senior Notes
In connection with the Mergers, we assumed SWH’s convertible senior notes. In January 2017, SWH issued $345,000 in aggregate principal amount of 3.50% convertible seniornotes due 2022 (the “2022 Convertible Notes” or the “Convertible Senior Notes”). Interest on the 2022 Convertible Notes is payable semiannually in arrears on January 15th andJuly 15th of each year. The 2022 Convertible Notes will mature on January 15, 2022.
25

INVITATION HOMES INC.NOTES TO CONDENSED CONSOLIDATED FINANCIAL STATEMENTS
(dollar amounts in thousands)(unaudited)
The following table summarizes the terms of the Convertible Senior Notes outstanding as of March 31, 2021 and December 31, 2020:
Principal Amount
Coupon Rate
Effective Rate
Conversion Rate
Maturity Date
RemainingAmortization
Period March 31, 2021December 31,
20202022 Convertible
Notes 3.50% 5.12% 43.9024 January 15, 2022 0.79 years $ 345,000 $ 345,000 Net unamortized fair value adjustment (4,270) (5,596)
Total $ 340,730 $ 339,404
(1) Effective rate includes the effect of the adjustment to the fair value of the debt as of the Merger Date, the value of which reduced the initial liability recorded to $324,252 for the2022 Convertible Notes.
(2) The conversion rate as of March 31, 2021 represents the number of shares of common stock issuable per $1,000 principal amount (actual $) of the 2022 Convertible Notesconverted on such date, as adjusted in accordance with the indenture as a result of cash dividend payments and the effects of previous mergers. We have the option to settle the2022 Convertible Notes in cash, common stock, or a combination thereof.
Terms of Conversion
As of March 31, 2021, the conversion rate applicable to the 2022 Convertible Notes is 43.9024 shares of our common stock per $1,000 principal amount (actual $) of the 2022Convertible Notes (equivalent to a conversion price of approximately $22.78 per common share — actual $). The conversion rate for the 2022 Convertible Notes is subject toadjustment in some events, but will not be adjusted for any accrued and unpaid interest. In addition, following certain events that occur prior to the maturity date, we will adjust theconversion rate for a holder who elects to convert its 2022 Convertible Notes in connection with such an event in certain circumstances. At any time prior to July 15, 2021, holdersmay convert the 2022 Convertible Notes at their option only under specific circumstances as defined in the indenture agreement, dated as of January 10, 2017, between us and ourtrustee, Wilmington Trust National Association (the “Convertible Notes Trustee”). On or after July 15, 2021 and until maturity, holders may convert all or any portion of the 2022Convertible Notes at any time. Upon conversion, we will pay or deliver, as the case may be, cash, common stock, or a combination of cash and common stock, at our election. The“if-converted” value of the 2022 Convertible Notes exceeds the principal amount by $139,531 as of March 31, 2021 as the closing market price of our common stock of $31.99 percommon share (actual $) exceeds the implicit conversion price. For the three months ended March 31, 2021 and 2020, interest expense for the 2022 Convertible Notes, includingnon-cash amortization of discounts, was $4,344 and $4,279, respectively.
General Terms
We may not redeem the 2022 Convertible Notes prior to their maturity date except to the extent necessary to preserve our status as a REIT for United States federal income taxpurposes, as further described in the indenture. If we undergo a fundamental change as defined in the indenture, holders may require us to repurchase for cash all or any portion oftheir 2022 Convertible Notes at a fundamental change repurchase price equal to 100% of the principal amount of the 2022 Convertible Notes to be repurchased, plus accrued andunpaid interest up to, but excluding, the fundamental change repurchase date.
The indenture contains customary terms and covenants and events of default. If an event of default occurs and is continuing, the Convertible Notes Trustee, by notice to us, orthe holders of at least 25% in aggregate principal amount of the outstanding 2022 Convertible Notes, by notice to us and the Convertible Notes Trustee, may, and the ConvertibleNotes Trustee at the request of such holders shall, declare 100% of the principal of and accrued and unpaid interest on all the 2022 Convertible Notes to be due and payable. In thecase of an event of default arising out of certain events of bankruptcy, insolvency or reorganization in respect to us (as set forth in the indenture), 100% of the principal of andaccrued and unpaid interest on the 2022 Convertible Notes will automatically become due and payable.
(1) (2)
26

INVITATION HOMES INC.NOTES TO CONDENSED CONSOLIDATED FINANCIAL STATEMENTS
(dollar amounts in thousands)(unaudited)
Debt Maturities Schedule
The following table summarizes the contractual maturities of our debt as of March 31, 2021:
YearMortgageLoans
SecuredTerm Loan
Term LoanFacility
RevolvingFacility
ConvertibleSenior Notes Total
Remainder of 2021 $ 2,336,218 $ — $ — $ — $ — $ 2,336,218 2022 1,488,106 — — — 345,000 1,833,106 2023 — — — — — — 2024 — — — — — — 2025 — — 2,500,000 — — 2,500,000 Thereafter 994,875 403,363 — — — 1,398,238
Total 4,819,199 403,363 2,500,000 — 345,000 8,067,562 Less: deferred financing costs,
net (11,114) (2,214) (27,282) — — (40,610)Less: unamortized fair value
adjustment — — — — (4,270) (4,270)Total $ 4,808,085 $ 401,149 $ 2,472,718 $ — $ 340,730 $ 8,022,682
(1) The maturity dates of the obligations are reflective of all extensions that have been exercised as of March 31, 2021. If fully extended, we would have no mortgage loans maturingbefore 2024. Such extensions are available provided there is no continuing event of default under the respective mortgage loan agreement and the Borrower Entity obtains anddelivers a replacement interest rate cap agreement from an approved counterparty within the required timeframe to the lender.
(2) On March 5, 2021, we submitted a notification to request an extension of the maturity date of the IH 2018-2 mortgage loan from June 9, 2021 to June 9, 2022. On April 6, 2021,we submitted a notification to request an extension of the maturity date of the IH 2018-3 mortgage loan from July 9, 2021 to July, 9 2022 (see Note 15).
(3) If we exercise the two six month extension options, the maturity date will be in 2026.
Note 8—Derivative Instruments
From time to time, we enter into derivative instruments to manage the economic risk of changes in interest rates. We do not enter into derivative transactions for speculative ortrading purposes. Designated hedges are derivatives that meet the criteria for hedge accounting and that we have elected to designate as hedges. Non-designated hedges arederivatives that do not meet the criteria for hedge accounting or that we did not elect to designate as hedges.
Designated Hedges
We have entered into various interest rate swap agreements, which are used to hedge the variable cash flows associated with variable-rate interest payments. Currently, each ofour swap agreements is indexed to one month LIBOR and is designated for hedge accounting purposes. One month LIBOR is set to expire after June 30, 2023, and we will work withthe counterparties to our swap agreements to adjust each floating rate to a comparable or successor rate. Changes in the fair value of these swaps are recorded in other comprehensiveincome and are subsequently reclassified into earnings in the period in which the hedged forecasted transactions affect earnings.
(1)(2) (3) (3)
27
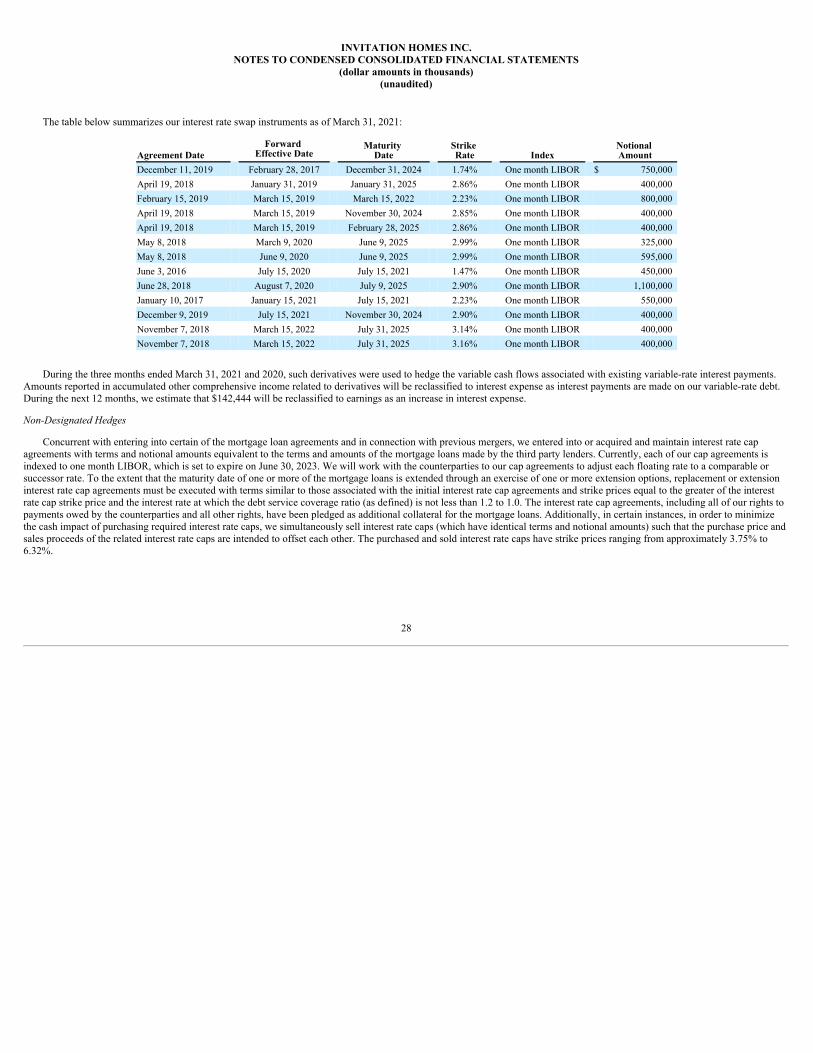
INVITATION HOMES INC.NOTES TO CONDENSED CONSOLIDATED FINANCIAL STATEMENTS
(dollar amounts in thousands)(unaudited)
The table below summarizes our interest rate swap instruments as of March 31, 2021:
Agreement DateForward
Effective DateMaturity
DateStrike Rate Index
Notional Amount
December 11, 2019 February 28, 2017 December 31, 2024 1.74% One month LIBOR $ 750,000 April 19, 2018 January 31, 2019 January 31, 2025 2.86% One month LIBOR 400,000 February 15, 2019 March 15, 2019 March 15, 2022 2.23% One month LIBOR 800,000 April 19, 2018 March 15, 2019 November 30, 2024 2.85% One month LIBOR 400,000 April 19, 2018 March 15, 2019 February 28, 2025 2.86% One month LIBOR 400,000 May 8, 2018 March 9, 2020 June 9, 2025 2.99% One month LIBOR 325,000 May 8, 2018 June 9, 2020 June 9, 2025 2.99% One month LIBOR 595,000 June 3, 2016 July 15, 2020 July 15, 2021 1.47% One month LIBOR 450,000 June 28, 2018 August 7, 2020 July 9, 2025 2.90% One month LIBOR 1,100,000 January 10, 2017 January 15, 2021 July 15, 2021 2.23% One month LIBOR 550,000 December 9, 2019 July 15, 2021 November 30, 2024 2.90% One month LIBOR 400,000 November 7, 2018 March 15, 2022 July 31, 2025 3.14% One month LIBOR 400,000 November 7, 2018 March 15, 2022 July 31, 2025 3.16% One month LIBOR 400,000
During the three months ended March 31, 2021 and 2020, such derivatives were used to hedge the variable cash flows associated with existing variable-rate interest payments.Amounts reported in accumulated other comprehensive income related to derivatives will be reclassified to interest expense as interest payments are made on our variable-rate debt.During the next 12 months, we estimate that $142,444 will be reclassified to earnings as an increase in interest expense.
Non-Designated Hedges
Concurrent with entering into certain of the mortgage loan agreements and in connection with previous mergers, we entered into or acquired and maintain interest rate capagreements with terms and notional amounts equivalent to the terms and amounts of the mortgage loans made by the third party lenders. Currently, each of our cap agreements isindexed to one month LIBOR, which is set to expire on June 30, 2023. We will work with the counterparties to our cap agreements to adjust each floating rate to a comparable orsuccessor rate. To the extent that the maturity date of one or more of the mortgage loans is extended through an exercise of one or more extension options, replacement or extensioninterest rate cap agreements must be executed with terms similar to those associated with the initial interest rate cap agreements and strike prices equal to the greater of the interestrate cap strike price and the interest rate at which the debt service coverage ratio (as defined) is not less than 1.2 to 1.0. The interest rate cap agreements, including all of our rights topayments owed by the counterparties and all other rights, have been pledged as additional collateral for the mortgage loans. Additionally, in certain instances, in order to minimizethe cash impact of purchasing required interest rate caps, we simultaneously sell interest rate caps (which have identical terms and notional amounts) such that the purchase price andsales proceeds of the related interest rate caps are intended to offset each other. The purchased and sold interest rate caps have strike prices ranging from approximately 3.75% to6.32%.
28

INVITATION HOMES INC.NOTES TO CONDENSED CONSOLIDATED FINANCIAL STATEMENTS
(dollar amounts in thousands)(unaudited)
Fair Values of Derivative Instruments on the Condensed Consolidated Balance Sheets
The table below presents the fair value of our derivative financial instruments as well as their classification on the condensed consolidated balance sheets as of March 31, 2021and December 31, 2020:
Asset Derivatives Liability DerivativesFair Value as of Fair Value as of
Balance Sheet Location
March 31,2021
December 31,2020
Balance Sheet Location March 31, 2021
December 31,2020
Derivatives designatedas hedging instruments:Interest rate swaps Other assets $ — $ — Other liabilities $ 425,448 $ 539,560
Derivatives notdesignated as hedginginstruments:Interest rate caps Other assets 1 1 Other liabilities — —
Total $ 1 $ 1 $ 425,448 $ 539,560
Offsetting Derivatives
We enter into master netting arrangements, which reduce risk by permitting net settlement of transactions with the same counterparty. The tables below present a grosspresentation, the effects of offsetting, and a net presentation of our derivatives as of March 31, 2021 and December 31, 2020:
March 31, 2021Gross Amounts Not Offset in theStatement of Financial Position
Gross Amountsof Recognized
Assets/Liabilities
Gross AmountsOffset in theStatement of
FinancialPosition
Net Amounts ofAssets/
LiabilitiesPresented in the
Statement ofFinancialPosition
FinancialInstruments
Cash CollateralReceived
Net Amount
Offsetting assets:Derivatives $ 1 $ — $ 1 $ — $ — $ 1
Offsettingliabilities:Derivatives $ 425,448 $ — $ 425,448 $ — $ — $ 425,448
December 31, 2020Gross Amounts Not Offset in theStatement of Financial Position
Gross Amountsof Recognized
Assets/Liabilities
Gross AmountsOffset in theStatement of
FinancialPosition
Net Amounts ofAssets/
LiabilitiesPresented in the
Statement ofFinancialPosition
FinancialInstruments
Cash CollateralReceived
Net Amount
Offsetting assets:Derivatives $ 1 $ — $ 1 $ — $ — $ 1
Offsettingliabilities:Derivatives $ 539,560 $ — $ 539,560 $ — $ — $ 539,560
29

INVITATION HOMES INC.NOTES TO CONDENSED CONSOLIDATED FINANCIAL STATEMENTS
(dollar amounts in thousands)(unaudited)
Effect of Derivative Instruments on the Condensed Consolidated Statements of Comprehensive Income (Loss) and the Condensed Consolidated Statements of Operations
The tables below present the effect of our derivative financial instruments in the condensed consolidated statements of comprehensive income (loss) and the condensedconsolidated statements of operations for the three months ended March 31, 2021 and 2020:
Amount of Gain (Loss)Recognized
in OCI on Derivative
Location ofLoss
Reclassifiedfrom
AccumulatedOCI into Net
Income
Amount of Loss Reclassifiedfrom Accumulated OCI into Net
Income
Total Amount of InterestExpense Presented in theCondensed ConsolidatedStatements of Operations
For the Three Months Ended March 31,
For the Three Months Ended March 31,
For the Three Months Ended March 31,
2021 2020 2021 2020 2021 2020Derivatives incash flowhedgingrelationships:Interest rateswaps $ 80,059 $ (341,438)
Interestexpense $ (37,643) $ (8,567) $ 83,406 $ 84,757
Location of Loss
Recognized in Net Income on
Derivative
Amount of Loss Recognized in NetIncome on Derivative
For the Three Months Ended March 31,
2021 2020Derivatives not designated as hedging
instruments:Interest rate caps Interest expense $ 31 $ 13
Credit-Risk-Related Contingent Features
The agreements with our derivative counterparties which govern our interest rate swap agreements contain a provision where we could be declared in default on our derivativeobligations if repayment of the underlying indebtedness is accelerated by the lender due to our default on the indebtedness.
As of March 31, 2021, the fair value of certain derivatives in a net liability position was $425,448. If we had breached any of these provisions at March 31, 2021, we could havebeen required to settle the obligations under the agreements at their termination value, which includes accrued interest and excludes the nonperformance risk related to theseagreements, of $443,318.
Note 9—Stockholders' Equity
As of March 31, 2021, we have issued 567,650,434 shares of common stock. In addition, we issue OP Units from time to time which, upon vesting, are redeemable for shares ofour common stock on a one-for-one basis or, in our sole discretion, cash and are reflected as non-controlling interests on our condensed consolidated balance sheets and statements ofequity. As of March 31, 2021, 3,463,285 outstanding OP Units are redeemable.
During the three months ended March 31, 2021 and 2020, we issued 532,768 and 2,124,720 shares of common stock, respectively.
30

INVITATION HOMES INC.NOTES TO CONDENSED CONSOLIDATED FINANCIAL STATEMENTS
(dollar amounts in thousands)(unaudited)
At the Market Equity Program
On August 22, 2019, we entered into distribution agreements with a syndicate of banks (the “Agents”), pursuant to which we may sell, from time to time, up to an aggregatesales price of $800,000 of our common stock through the Agents (the “ATM Equity Program”). During the three months ended March 31, 2020, we sold 1,872,066, shares of ourcommon stock under our ATM Equity Program, generating net proceeds of $55,921 after giving effect to Agent commissions and other costs totaling $911. We did not sell anyshares of common stock under the ATM Equity Program during the three months ended March 31, 2021. As of March 31, 2021, $500,000 remains available for future offeringsunder the ATM Equity Program.
Dividends
To qualify as a REIT, we are required to distribute annually to our stockholders at least 90% of our REIT taxable income, without regard to the deduction for dividends paid andexcluding net capital gains, and to pay tax at regular corporate rates to the extent that we annually distribute less than 100% of our net taxable income. We intend to pay quarterlydividends to our stockholders, which in the aggregate are approximately equal to or exceed our net taxable income in the relevant year. The timing, form, and amount of distributions,if any, to our stockholders, will be at the sole discretion of our board of directors.
The following table summarizes our dividends declared from January 1, 2020 through March 31, 2021:
Record DateAmount
per Share Pay DateTotal Amount
DeclaredQ1-2021 January 28, 2021 $ 0.17 February 26, 2021 $ 96,933 Q4-2020 November 10, 2020 0.15 November 25, 2020 84,911 Q3-2020 August 12, 2020 0.15 August 28, 2020 84,286 Q2-2020 May 13, 2020 0.15 May 29, 2020 81,916 Q1-2020 February 12, 2020 0.15 February 28, 2020 81,673
On April 22, 2021, our board of directors declared a dividend of $0.17 per share to stockholders of record on May 11, 2021, which is payable on May 28, 2021 (see Note 15).
Note 10—Share-Based Compensation
Prior to completion of the IPO, our board of directors adopted, and our stockholders approved, the Invitation Homes Inc. 2017 Omnibus Incentive Plan (the “Omnibus IncentivePlan”) to provide a means through which to attract and retain key personnel and to provide a means whereby our directors, officers, associates, consultants, and advisors can acquireand maintain an equity interest in us, or be paid incentive compensation, including incentive compensation measured by reference to the value of our common stock, and to aligntheir interests with those of our stockholders. Under the Omnibus Incentive Plan, we may issue up to 16,000,000 shares of common stock.
Our share-based awards consist of time-vesting restricted stock units (“RSUs”), performance and market based vesting RSUs (“PRSUs”), and Outperformance Awards (definedbelow). Time-vesting RSUs are participating securities for EPS purposes, and PRSUs and Outperformance Awards are not. For detailed discussion of RSUs and PRSUs issued priorto January 1, 2021, refer to our Annual Report on Form 10-K for the year ended December 31, 2020.
Share-Based Awards
The following summarizes our share-based award activity during the three months ended March 31, 2021.
Annual Long Term Incentive Plan (“LTIP”):
• Annual LTIP Awards Granted: During the three months ended March 31, 2021, we granted 675,627 RSUs pursuant to LTIP awards (together with previously granted annualLTIP awards, “LTIP Awards”). Each award includes components which vest based on time-vesting conditions, market based vesting conditions, and performance basedvesting conditions, each of which is subject to continued employment through the applicable vesting date. The time-vesting RSUs granted during the three months endedMarch 31, 2021 vest in three equal annual installments based on an anniversary date of March 1, 2021. The PRSUs granted during the three months ended March 31, 2021may
31

INVITATION HOMES INC.NOTES TO CONDENSED CONSOLIDATED FINANCIAL STATEMENTS
(dollar amounts in thousands)(unaudited)
be earned based on the achievement of certain measures over a three year performance period that ends December 31, 2023. The number of PRSUs earned will bedetermined based on performance achieved during the performance period for each measure at certain threshold, target, or maximum levels and corresponding payoutranges. In general, the LTIP PRSUs are earned after the end of the performance period on the date on which the performance results are certified by our compensation andmanagement development committee (the “Compensation Committee”).
All of the LTIP Awards are subject to certain change in control and retirement eligibility provisions that may impact these vesting schedules.
• PRSU Results: During the three months ended March 31, 2021, the Compensation Committee certified performance achievement with respect to our 2018 LTIP Awards.Certain PRSUs vested and achieved performance in excess of the target level, resulting in the issuance of an additional 159,180 shares of common stock. Such awards arereflected as an increase in the number of awards granted and vested in the table below. Certain other PRSUs did not achieve performance criteria, resulting in thecancellation of 47,145 awards. Such awards are reflected as an increase in the number of awards forfeited/canceled in the table below.
Outperformance Awards
On May 1, 2019, the Compensation Committee approved one-time equity based awards with market based vesting conditions in the form of PRSUs and OP Units (the“Outperformance Awards”). The Outperformance Awards may be earned based on the achievement of rigorous absolute total shareholder return and relative total shareholder returnthresholds over a three year performance period ending on March 31, 2022. Upon completion of the performance period, the dollar value of the awards earned under the absolute andrelative total shareholder return components will be separately calculated, and the number of earned Outperformance Awards will be determined based on the earned dollar value ofthe awards and the stock price at the performance certification date. Earned awards will vest 50% on March 31, 2022 and 25% on each of the first and second anniversaries of suchdate, subject to continued employment. The current aggregate $12,390 grant-date fair value of the Outperformance Awards still outstanding was determined based on Monte-Carlooption pricing models which estimate the probability of the vesting conditions being satisfied.
Summary of Total Share-Based Awards
The following table summarizes activity related to non-vested time-vesting RSUs and PRSUs, other than Outperformance Awards, during the three months ended March 31,2021:
Time-Vesting Awards PRSUs Total Share-Based Awards
Number
Weighted Average Grant Date Fair Value
(Actual $) Number
WeightedAverage GrantDate Fair Value
(Actual $) Number
Weighted Average Grant Date Fair Value
(Actual $)Balance, December 31, 2020 560,123 $ 24.54 975,811 $ 26.36 1,535,934 $ 25.70
Granted 208,482 29.32 626,325 27.44 834,807 27.91 Vested (198,522) (24.24) (436,493) (23.31) (635,015) (23.60)Forfeited / canceled (741) (27.06) (47,831) (22.05) (48,572) (22.13)
Balance, March 31, 2021 569,342 $ 26.40 1,117,812 $ 28.34 1,687,154 $ 27.68
(1) Total share-based awards excludes Outperformance Awards.(2) All vested share-based awards are included in basic EPS for the periods after each award’s vesting date. The estimated fair value of share-based awards that fully vested during
the three months ended March 31, 2021 was $13,715. During the three months ended March 31, 2021, 516 RSUs were accelerated pursuant to the terms and conditions of theOmnibus Incentive Plan and related award agreements.
(1)
(2)
32

INVITATION HOMES INC.NOTES TO CONDENSED CONSOLIDATED FINANCIAL STATEMENTS
(dollar amounts in thousands)(unaudited)
Grant-Date Fair Values
The grant-date fair values of the time-vesting RSUs and PRSUs with performance condition vesting criteria are generally based on the closing price of our common stock on thegrant date. However, the grant-date fair values for share-based awards with market condition vesting criteria are based on Monte-Carlo option pricing models. The following tablesummarizes the significant inputs utilized in these models for such awards granted during the three months ended March 31, 2021:
For the Three Months EndedMarch 31, 2021
Expected volatility 33.2%Risk-free rate 0.31%Expected holding period (years) 2.84
(1) Expected volatility was estimated based on the historical volatility of INVH’s realized returns and the applicable index.
Summary of Total Share-Based Compensation Expense
During the three months ended March 31, 2021 and 2020, we recognized share-based compensation expense as follows:
For the Three Months Ended March 31,
2021 2020General and administrative $ 4,640 $ 3,268 Property management expense 1,174 833
Total $ 5,814 $ 4,101
As of March 31, 2021, there is $34,187 of unrecognized share-based compensation expense related to non-vested share-based awards which is expected to be recognized over aweighted average period of 2.16 years.
Note 11—Fair Value Measurements
The carrying amounts of restricted cash, certain components of other assets, accounts payable and accrued expenses, resident security deposits, and certain components of otherliabilities approximate fair value due to the short maturity of these amounts. Our interest rate swap agreements, interest rate cap agreements, and investments in equity securities witha readily determinable fair value are recorded at fair value on a recurring basis within our condensed consolidated financial statements. The fair values of our interest rate caps andswaps, which are classified as Level 2 in the fair value hierarchy, are estimated using market values of instruments with similar attributes and maturities. See Note 8 for the details ofthe condensed consolidated balance sheet classification and the fair values for the interest rate caps and swaps. The fair values of our investments in equity securities with a readilydeterminable fair value are classified as Level 1 in the fair value hierarchy. For additional information related to our investments in equity securities as of March 31, 2021 andDecember 31, 2020, refer to Note 6.
(1)
33

INVITATION HOMES INC.NOTES TO CONDENSED CONSOLIDATED FINANCIAL STATEMENTS
(dollar amounts in thousands)(unaudited)
Recurring Fair Value Measurements
The following table displays the carrying values and fair values of financial instruments as of March 31, 2021 and December 31, 2020:
March 31, 2021 December 31, 2020Carrying
ValueFair Value
Carrying Value
Fair Value
Assets carried at historical cost on thecondensed consolidated balance sheets:
Investments in debt securities Level 2 $ 244,597 $ 249,545 $ 245,237 $ 249,736
Liabilities carried at historical cost on thecondensed consolidated balance sheets:
Mortgage loans Level 2 $ 4,819,199 $ 4,920,948 $ 4,832,133 $ 4,923,107 Secured Term Loan Level 3 403,363 414,728 403,363 447,190 Term Loan Facility Level 3 2,500,000 2,508,779 2,500,000 2,514,623 Convertible Senior Notes Level 3 340,730 350,100 339,404 351,166
(1) The carrying values of investments in debt securities are shown net of discount.(2) The carrying values of the mortgage loans are shown net of discount and excludes $11,114 and $12,035 of deferred financing costs as of March 31, 2021 and December 31,
2020, respectively.(3) The carrying value of the Secured Term Loan excludes $2,214 and $2,268 of deferred financing costs as of March 31, 2021 and December 31, 2020, respectively.(4) The carrying value of the Term Loan Facility excludes $27,282 and $29,093 of deferred financing costs as of March 31, 2021 and December 31, 2020, respectively.(5) The carrying values of the Convertible Senior Notes include unamortized discounts of $4,270 and $5,596 as of March 31, 2021 and December 31, 2020, respectively.
The fair values of our investments in debt securities and mortgage loans, which are classified as Level 2 in the fair value hierarchy, are estimated based on market bid prices ofcomparable instruments at the end of the period. The following table displays the significant unobservable inputs used to develop our Level 3 fair value measurements as ofMarch 31, 2021:
Quantitative Information about Level 3 Fair Value Measurement
Fair Value Valuation TechniqueUnobservable
Input Rate
Secured Term Loan $ 414,728 Discounted Cash Flow Effective Rate 3.26%
Term Loan Facility 2,508,779 Discounted Cash Flow Effective Rate 1.65 % — 3.61%
Convertible Senior Notes 350,100 Discounted Cash Flow Effective Rate 1.62%
(1) Our Level 3 fair value instruments require interest only monthly payments.
(1)
(2)
(3)
(4)
(5)
(1)
34

INVITATION HOMES INC.NOTES TO CONDENSED CONSOLIDATED FINANCIAL STATEMENTS
(dollar amounts in thousands)(unaudited)
Nonrecurring Fair Value Measurements
Our assets measured at fair value on a nonrecurring basis are those assets for which we have recorded impairments.
Single-Family Residential Properties
The single-family residential properties for which we have recorded impairments, measured at fair value on a nonrecurring basis, are summarized below:
For the Three Months Ended March 31,
2021 2020Investments in single-family residential
properties, net held for sale (Level 3):Pre-impairment amount $ 2,281 $ 10,800 Total impairments (431) (2,471)
Fair value $ 1,850 $ 8,329
We did not record any impairments for our investments in single-family residential properties, net held for use during the three months ended March 31, 2021 and 2020. Foradditional information related to our single-family residential properties as of March 31, 2021 and December 31, 2020, refer to Note 3.
Note 12—Earnings per Share
Basic and diluted EPS are calculated as follows:
For the Three Months Ended March 31,
2021 2020(in thousands, except share and per share data)Numerator:
Net income available to common stockholders — basic and diluted $ 57,272 $ 49,854
Denominator:Weighted average common shares outstanding — basic 567,375,502 542,549,512 Effect of dilutive securities:
Incremental shares attributed to non-vested share-based awards 1,450,602 1,354,908 Weighted average common shares outstanding — diluted 568,826,104 543,904,420
Net income per common share — basic $ 0.10 $ 0.09
Net income per common share — diluted $ 0.10 $ 0.09
Incremental shares attributed to non-vested share-based awards are excluded from the computation of diluted EPS when they are anti-dilutive. For the three months endedMarch 31, 2021 and 2020, 67,754 and 112,598 incremental shares attributed to non-vested share-based awards, respectively, are excluded from the denominator as their inclusionwould have been anti-dilutive.
For the three months ended March 31, 2021 and 2020, the vested OP Units have been excluded from the computation of EPS because all income attributable to the OP Units hasbeen recorded as non-controlling interest and thus excluded from net income available to common stockholders.
For the three months ended March 31, 2021 and 2020, using the “if-converted” method, 15,146,328 and 15,100,443, respectively, potential shares of common stock issuableupon the conversion of the 2022 Convertible Notes are excluded from the computation of diluted EPS as they are anti-dilutive. Additionally, no adjustment to the numerator isrequired for interest expense related to the 2022 Convertible Notes for the three months ended March 31, 2021 and 2020. See Note 7 for further discussion about the 2022Convertible Notes.
35

INVITATION HOMES INC.NOTES TO CONDENSED CONSOLIDATED FINANCIAL STATEMENTS
(dollar amounts in thousands)(unaudited)
Note 13—Income Tax
We account for income taxes under the asset and liability method. For our taxable REIT subsidiaries (“TRSs”), deferred tax assets and liabilities are recognized for the estimatedfuture tax consequences attributable to differences between the financial statement carrying amounts of existing assets and liabilities and their respective tax basis and operating lossand tax credit carry forwards. Deferred tax assets and liabilities are measured using the enacted tax rates in effect for the year in which those temporary differences are expected to berecovered or settled. We provide a valuation allowance, from time to time, for deferred tax assets for which we do not consider realization of such assets to be more likely than not.
As of March 31, 2021 and December 31, 2020, we have not recorded any deferred tax assets and liabilities or unrecognized tax benefits. We do not anticipate a significantchange in unrecognized tax benefits within the next 12 months.
We have sold assets that were either subject to Section 337(d) of the Internal Revenue Code of 1986, as amended, or were held by TRSs. These transactions resulted in $241 and$130 of current income tax expense for the three months ended March 31, 2021 and 2020, respectively, which has been recorded in gain on sale of property, net of tax in thecondensed consolidated statements of operations.
Note 14—Commitments and Contingencies
Lease Commitments
The following table sets forth our fixed lease payment commitments as a lessee as of March 31, 2021, for the periods below:
YearOperating
LeasesFinanceLeases
Remainder of 2021 $ 3,830 $ 2,427 2022 4,253 2,545 2023 3,318 2,487 2024 2,973 730 2025 1,540 — Thereafter 668 —
Total lease payments 16,582 8,189 Less: imputed interest (1,077) (477)
Total lease liability $ 15,505 $ 7,712
The components of lease expense for the three months ended March 31, 2021 and 2020 are as follows:
For the Three Months Ended March 31,
2021 2020Operating lease cost:
Fixed lease cost $ 1,059 $ 993 Variable lease cost 343 335
Total operating lease cost $ 1,402 $ 1,328
Finance lease cost:
Amortization of ROU assets $ 704 $ 208
Interest on lease liabilities 86 142
Total finance lease cost $ 790 $ 350
36

INVITATION HOMES INC.NOTES TO CONDENSED CONSOLIDATED FINANCIAL STATEMENTS
(dollar amounts in thousands)(unaudited)
Insurance Policies
Pursuant to the terms of certain of our loan agreements (see Note 7), laws and regulations of the jurisdictions in which our properties are located, and general business practices,we are required to procure insurance on our properties. As of March 31, 2021, there are no material contingent liabilities related to uninsured losses with respect to our properties.
Legal Matters
We are subject to various legal proceedings and claims that arise in the ordinary course of our business. We accrue a liability when we believe that it is both probable that aliability has been incurred and that we can reasonably estimate the amount of the loss. We do not believe that the final outcome of these proceedings or matters will have a materialadverse effect on our condensed consolidated financial statements.
Note 15—Subsequent Events
In connection with the preparation of the accompanying condensed consolidated financial statements, we have evaluated events and transactions occurring after March 31, 2021,for potential recognition or disclosure.
Extension of Existing Mortgage Loan
On April 6, 2021, we submitted a notification to request an extension of the maturity date of the IH 2018-3 mortgage loan from July 9, 2021 to July, 9 2022.
Dividend Declaration
On April 22, 2021, our board of directors declared a dividend of $0.17 per share to stockholders of record on May 11, 2021, which is payable on May 28, 2021.
37

ITEM 2. MANAGEMENT’S DISCUSSION AND ANALYSIS OF FINANCIAL CONDITION AND RESULTS OF OPERATIONS
The following discussion and analysis of our financial condition and results of operations should be read in conjunction with the information appearing elsewhere in thisQuarterly Report on Form 10-Q and in our Annual Report on Form 10-K. This discussion and analysis contains forward-looking statements based upon our current expectations thatinvolve risks and uncertainties. Our actual results may differ materially from those anticipated in these forward-looking statements as a result of various factors, including those setforth under Part I. Item 1A. “Risk Factors” in our Annual Report on Form 10-K.
Capitalized terms used without definition have the meaning provided elsewhere in this Quarterly Report on Form 10-Q.
Overview
Invitation Homes is a leading owner and operator of single-family homes for lease, offering residents high-quality homes in sought-after neighborhoods across America. Withover 80,000 homes for lease in 16 markets across the country as of March 31, 2021, Invitation Homes is meeting changing lifestyle demands by providing residents access to updatedhomes with features they value, such as close proximity to jobs and access to good schools. Our mission statement, “Together with you, we make a house a home,” reflects ourcommitment to high-touch service that continuously enhances residents’ living experiences and provides homes where individuals and families can thrive.
We operate in markets with strong demand drivers, high barriers to entry, and high rent growth potential, primarily in the Western United States, Florida, and the SoutheastUnited States. Through disciplined market and asset selection, as well as through strategic mergers and acquisitions, we designed our portfolio to capture the operating benefits oflocal density as well as economies of scale that we believe cannot be readily replicated. Since our founding in 2012, we have built a proven, vertically integrated operating platformthat enables us to effectively and efficiently acquire, renovate, lease, maintain, and manage our homes.
We invest in markets that we expect will exhibit lower new supply, stronger job and household formation growth, and superior net operating income (“NOI”) growth relative tothe broader United States housing and rental markets. Within our 16 markets, we target attractive neighborhoods in in-fill locations with multiple demand drivers, such as proximityto major employment centers, desirable schools, and transportation corridors. Our homes average approximately 1,870 square feet with three bedrooms and two bathrooms, appealingto a resident base that we believe is less transitory than the typical multifamily resident. We invest in the upfront renovation of homes in our portfolio in order to address capitalneeds, reduce ongoing maintenance costs, and drive resident demand. The in-fill locations and high quality of our homes and service further differentiate our resident experience,which we continue to refine.
COVID-19
The ongoing COVID-19 pandemic has had a significant adverse impact on global and United States economic activity and has contributed to significant volatility and disruptionin financial markets. The ultimate impacts remain unknown, but could range from macroeconomic effects (such as continued strain on global and United States economic conditionsand disruptions to, and volatility in, the credit and financial markets, consumer spending, and the market for acquisition and disposition of single-family homes) to more industry-specific effects (such as depressed collection rates, higher or lower occupancy levels, and restrictions on evictions, collections, rent increases, and late fees), and other unanticipatedconsequences. As such, we continue to closely monitor the impact of the ongoing COVID-19 pandemic on all aspects of our business and actively manage our response thereto incollaboration with our residents and business partners.
With the safety and well-being of our residents and associates being our highest priority during the ongoing COVID-19 pandemic, we implemented a host of measures andcontinue to follow protocols that enable teams to safely provide outstanding service to residents. These protocols include: (1) implementing a safety training program and providingpersonal protective equipment for all associates including a supply of masks, gloves, shoe covers, and hand sanitizer for field teams;(2) adhering to strict safety protocols formaintenance service trips; (3) leveraging self-show and virtual-tour technology; and (4) offering virtual options for resident move-in orientations and pre-move-out visits.
38

We also continue to adhere to Federal, state, and local restrictions on items such as evictions, collections, rent increases, and late fees as appropriate. Additionally, to act on ourcore values of "Genuine Care" and "Standout Citizenship," we offer flexible solutions for residents experiencing financial hardship when requested, including payment plans and latefee abatements. Due to the impact of these measures, overall revenue collections as a percentage of monthly billings was 97% for the three months ended March 31, 2021, orapproximately 98% of our historical average.
Although the majority of our office-based associates continue to work from home, we are establishing a multi-phase plan that allows associates to return to working on-site whenit is safe to do so. The plan takes into consideration factors such as the safety of our associates and residents, our business needs, applicable government regulations, community casetrends, and recommendations from public health officials. We plan to gradually allow office-based associates to return on-site while practicing social distancing and other safetymeasures.
Neither these procedural adjustments nor the overall impact of the COVID-19 pandemic created significant disruptions to our business model during the three months endedMarch 31, 2021.
The situation surrounding the ongoing COVID-19 pandemic remains fluid, and the full ensuing impact therefrom on our rental revenues and other property income, in particular,cannot be fully determined at present due to an inability to estimate collections of delinquent accounts and expiration of temporary restrictions on evictions, collections, rentincreases, and late fees. We will continue to actively manage our response in collaboration with our residents and business partners and to assess potential impacts to our financialposition and operating results, as well as potential adverse developments in our business.
For further discussion of risks related to the pandemic, see Part I. Item 1A. “Risk Factors — Risks Related to Our Business and Industry — Our business, results of operations,financial condition, and cash flows may be adversely affected by pandemics and outbreaks of infectious disease, particularly the ongoing COVID-19 pandemic” in our Annual Reporton Form 10-K.
39

Our Portfolio
The following table provides summary information regarding our total and Same Store portfolios as of and for the three months ended March 31, 2021 as noted below:
MarketNumber ofHomes
AverageOccupancy
AverageMonthly
Rent
AverageMonthly
Rent PSF% of
RevenueWestern United States:
Southern California 7,930 98.3% $2,592 $1.53 12.6 %Northern California 4,235 98.7% 2,264 1.46 6.2 %Seattle 3,696 97.3% 2,324 1.21 5.6 %Phoenix 8,240 97.3% 1,545 0.93 8.5 %Las Vegas 3,010 97.8% 1,756 0.88 3.5 %Denver 2,372 94.7% 2,158 1.18 3.3 %
Western United States Subtotal 29,483 97.6% 2,101 1.21 39.7 %
Florida:South Florida 8,280 97.1% 2,263 1.21 12.2 %Tampa 8,217 97.1% 1,753 0.94 9.6 %Orlando 6,245 96.5% 1,760 0.95 7.3 %Jacksonville 1,872 98.2% 1,764 0.89 2.2 %
Florida Subtotal 24,614 97.0% 1,928 1.03 31.3 %
Southeast United States:Atlanta 12,556 98.0% 1,600 0.78 13.2 %Carolinas 4,987 96.9% 1,666 0.78 5.4 %
Southeast United States Subtotal 17,543 97.7% 1,619 0.78 18.6 %
Texas:Houston 2,146 97.0% 1,607 0.83 2.3 %Dallas 2,808 94.3% 1,849 0.90 3.3 %
Texas Subtotal 4,954 95.5% 1,742 0.87 5.6 %
Midwest United States:Chicago 2,604 98.2% 2,018 1.25 3.4 %Minneapolis 1,125 97.8% 1,970 1.00 1.4 %
Midwest United States Subtotal 3,729 98.1% 2,004 1.16 4.8 %
Announced Market-in-Exit:Nashville 7 43.2% 2,466 0.88 — %
Total / Average 80,330 97.3% $1,916 $1.03 100.0 %
Same Store Total / Average 72,926 98.4% $1,915 $1.03 91.7 %
(1) As of March 31, 2021.(2) Represents average occupancy for the three months ended March 31, 2021.(3) Represents average monthly rent for the three months ended March 31, 2021.(4) Represents the percentage of rental revenues and other property income generated in each market for the three months ended March 31, 2021.(5) In December 2019, we announced a plan to fully exit the Nashville market. As of March 31, 2021, we have seven remaining homes in the market.
(1) (2) (3) (3) (4)
(5)
40

Factors That Affect Our Results of Operations and Financial Condition
Our results of operations and financial condition are affected by numerous factors, many of which are beyond our control. See Part I. Item 1A. “Risk Factors” in our AnnualReport on Form 10-K for more information regarding factors that could materially adversely affect our results of operations and financial condition. Key factors that impact ourresults of operations and financial condition include market fundamentals, rental rates and occupancy levels, collection rates, turnover rates and days to re-resident homes, propertyimprovements and maintenance, property acquisitions and renovations, and financing arrangements. Sensitivity to many of these factors has been heightened as a result of theongoing and numerous adverse impacts of COVID-19.
Market Fundamentals: Our results are impacted by housing market fundamentals and supply and demand conditions in our markets, particularly in the Western United Statesand Florida, which represented 71.0% of our rental revenues and other property income during the three months ended March 31, 2021. We actively monitor the impact of theCOVID-19 outbreak on market fundamentals and quickly implement changes in pricing as market fundamentals shift.
Rental Rates and Occupancy Levels: Rental rates and occupancy levels are primary drivers of rental revenues and other property income. Our rental rates and occupancy levelsare affected by macroeconomic factors and local and property-level factors, including market conditions, seasonality, resident defaults, and the amount of time it takes to prepare ahome for its next resident and re-lease homes when residents vacate. An important driver of rental rate growth is our ability to increase monthly rents from expiring leases, whichtypically have a term of one to two years. The ongoing COVID-19 pandemic has negatively impacted our ability to increase rents in certain markets and may impact our ability tomaintain occupancy levels.
Collection Rates: Our rental revenues and other property income is impacted by the rate at which we collect such revenues from our residents. We routinely work with residentsfacing financial hardships who need flexibility to fulfill their lease obligations, but the ongoing COVID-19 pandemic has increased the number of such residents. When requested, wework with these residents to create payment plans, without late fees, and then actively manage these receivables. However, a portion of these amounts may not ultimately becollected. Any amounts billed to residents that have been deemed uncollectible along with our estimate of amounts that may ultimately be uncollectible decrease our rental revenuesand other property income.
Turnover Rates and Days to Re-Resident: Other drivers of rental revenues and property operating and maintenance expense include the length of stay of our residents, residentturnover rates, and the number of days a home is unoccupied between residents. Our operating results are also impacted by the amount of time it takes to market and lease a property,which is a component of the number of days a home is unoccupied between residents. The period of time to market and lease a property can vary greatly and is impacted by localdemand, our marketing techniques, the size of our available inventory, and both current economic conditions and future economic outlook, both of which are impacted by theongoing COVID-19 pandemic. Days to re-resident may be negatively affected by homes potentially remaining vacant while prospective residents remain in their current housing. Ourturnover rate may be affected by the current COVID-19 pandemic as a result of delayed eviction proceedings and/or move outs potentially being canceled by residents who have notsecured their next housing plans. Increases in turnover rates and the average number of days to re-resident reduce rental revenues as the homes are not generating income during thisperiod of vacancy.
Property Improvements and Maintenance: Property improvements and maintenance impact capital expenditures, property operating and maintenance expense, and rentalrevenues. We actively manage our homes on a total portfolio basis to determine what capital and maintenance needs may be required and what opportunities we may have to generateadditional revenues or expense savings from such expenditures. Due to our size and scale both nationally and locally, we believe we are able to purchase goods and services atfavorable prices.
While the COVID-19 outbreak has required us to modify our property improvement and maintenance procedures to accommodate resident preferences, we complete allmaintenance work orders in a timely manner unless a resident reports symptoms of or exposure to COVID-19.
41

Property Acquisitions and Renovations: Future growth in rental revenues and other property income may be impacted by our ability to identify and acquire homes, our pace ofproperty acquisitions, and the time and cost required to renovate and lease a newly acquired home. Our ability to identify and acquire single-family homes that meet our investmentcriteria is impacted by home prices in targeted acquisition locations, the inventory of homes available for sale through our acquisition channels, and competition for our target assets.All of these factors may be negatively impacted by the ongoing COVID-19 pandemic, potentially reducing the number of homes we acquire.
The acquisition of homes involves expenditures in addition to payment of the purchase price, including payments for acquisition fees, property inspections, closing costs, titleinsurance, transfer taxes, recording fees, broker commissions, property taxes, and HOA fees (when applicable). Additionally, we typically incur costs to renovate a home to prepare itfor rental. The scope of renovation work varies, but may include paint, flooring, carpeting, cabinetry, appliances, plumbing hardware, roof replacement, HVAC replacement, andother items required to prepare the home for rental. The time and cost involved in accessing our homes and preparing them for rental can significantly impact our financialperformance. The time to renovate a newly acquired property can vary significantly among homes for several reasons, including the property’s acquisition channel, the condition ofthe property, whether the property was vacant when acquired, and whether there are any state or local restrictions on our ability to complete renovations as an essential businessfunction. Additionally, COVID-19 and related containment measures may interfere with the ability of our suppliers and other business partners to carry out their assigned tasks and/orsource labor or supply materials at ordinary levels of performance relative to the conduct of our business. Due to our size and scale both nationally and locally, we believe we are ableto purchase goods and services at favorable prices.
Financing Arrangements: Financing arrangements directly impact our interest expense, mortgage loans, secured term loan, term loan facility, revolving facility, and convertibledebt, as well as our ability to acquire and renovate homes. We have historically utilized indebtedness to fund the acquisition and renovation of new homes. Our current financingarrangements contain financial covenants, and certain financing arrangements contain variable interest rate terms. Interest rates are impacted by market conditions and the terms ofthe underlying financing arrangements. The COVID-19 pandemic has resulted in a widespread health crisis adversely affecting the economy and financial markets of many countriesresulting in an economic downturn that could negatively affect our ability to access financial markets as well as our business, results of operations, and financial condition. See Part I.Item 3. “Quantitative and Qualitative Disclosures about Market Risk” for further discussion regarding interest rate risk. Our future financing arrangements may not have similar termswith respect to amounts, interest rates, financial covenants, and durations.
Components of Revenues and Expenses
The following is a description of the components of our revenues and expenses.
Revenues
Rental Revenues and Other Property Income
Rental revenues, net of any concessions and bad debt (including write-offs, credit reserves, and uncollectible amounts), consist of rents collected under lease agreements relatedto our single-family homes for lease. We enter into leases directly with our residents, and the leases typically have a term of one to two years.
Other property income is comprised of: (i) resident reimbursements for utilities, HOA fines, and other charge-backs; (ii) rent and non-refundable deposits associated with pets;(iii) revenues from ancillary services such as smart homes and HVAC replacement filters; and (iv) various other fees, including late fees, lease termination fees, among others.
Joint Venture Management Fees
Joint venture management fees consist of asset and property management fees from our unconsolidated joint ventures.
42

Expenses
Property Operating and Maintenance
Once a property is available for its initial lease, which we refer to as “rent-ready,” we incur ongoing property-related expenses, which consist primarily of property taxes,insurance, HOA fees (when applicable), market-level personnel expenses, utility expenses, repairs and maintenance, leasing costs, marketing expenses, and property administration.Prior to a property being “rent-ready,” certain of these expenses are capitalized as building and improvements. Once a property is “rent-ready,” expenditures for ordinary repairs andmaintenance thereafter are expensed as incurred, and we capitalize expenditures that improve or extend the life of a home.
Property Management Expense
Property management expense represents personnel and other costs associated with the oversight and management of our portfolio of homes, including those within ourunconsolidated joint ventures. All of our homes are managed through our internal property manager.
General and Administrative
General and administrative expense represents personnel costs, professional fees, and other costs associated with our day-to-day activities. General and administrative expensemay also include expenses that are of a non-recurring nature, such as severance.
Share-Based Compensation Expense
All share-based compensation expense is recognized in our condensed consolidated statements of operations as components of general and administrative expense and propertymanagement expense. We issue share-based awards to align the interests of our associates with those of our investors.
Interest Expense
Interest expense includes interest payable on our debt instruments, payments and receipts related to our interest rate swap agreements, amortization of discounts and deferredfinancing costs, unrealized gains (losses) on non-designated hedging instruments, and non-cash interest expense related to our interest rate swap agreements.
Depreciation and Amortization
We recognize depreciation and amortization expense associated with our homes and other capital expenditures over the expected useful lives of the assets.
Impairment and Other
Impairment and other represents provisions for impairment when the carrying amount of our single-family residential properties is not recoverable and casualty (gains) losses,net of any insurance recoveries.
Unrealized Gains (Losses) on Investments in Equity Securities
Unrealized gains (losses) on investments in equity securities includes gains and losses resulting from mark to market adjustments on these investments.
Other, net
Other, net includes interest income and other miscellaneous income and expenses.
Gain on Sale of Property, net of tax
Gain on sale of property, net of tax consists of net gains and losses resulting from sales of our homes.
43

Income from Investments in Unconsolidated Joint Ventures
Income from investments in unconsolidated joint ventures consists of our share of net earnings and losses from investments in unconsolidated joint ventures accounted for usingthe equity method.
Results of Operations
Portfolio Information
As of March 31, 2021 and 2020, we owned 80,330 and 79,525 single-family rental homes, respectively, in our total portfolio. During the three months ended March 31, 2021 and2020, we acquired 401 and 504 homes, respectively, and sold 248 and 484 homes, respectively. During the three months ended March 31, 2021 and 2020, we owned an average of80,217 and 79,501 single-family rental homes, respectively.
We believe presenting information about the portion of our total portfolio that has been fully operational for the entirety of both a given reporting period and its prior yearcomparison period provides investors with meaningful information about the performance of our comparable homes across periods, and about trends in our organic business. To doso, we provide information regarding the performance of our Same Store portfolio.
As of March 31, 2021, our Same Store portfolio consisted of 72,926 single-family rental homes.
44

Three Months Ended March 31, 2021 Compared to Three Months March 31, 2020
The following table sets forth a comparison of the results of operations for the three months ended March 31, 2021 and 2020:
For the Three Months Ended March 31,
($ in thousands) 2021 2020 $ Change % ChangeRevenues:
Rental revenues and other property income $ 474,454 $ 449,789 $ 24,665 5.5 %Joint venture management fees 771 — 771 N/M
Total revenues 475,225 449,789 25,436 5.7 %
Expenses:Property operating and maintenance 168,373 166,916 1,457 0.9 %Property management expense 15,842 14,372 1,470 10.2 %General and administrative 16,950 14,228 2,722 19.1 %Interest expense 83,406 84,757 (1,351) (1.6)%Depreciation and amortization 144,501 135,027 9,474 7.0 %Impairment and other 356 3,127 (2,771) (88.6)%
Total expenses 429,428 418,427 11,001 2.6 %
Unrealized gains (losses) on investments inequity securities (3,140) 34 (3,174) N/M
Other, net 230 3,680 (3,450) (93.8)%Gain on sale of property, net of tax 14,484 15,200 (716) (4.7)%Income from investments in unconsolidated
joint ventures 351 — 351 N/M
Net income $ 57,722 $ 50,276 $ 7,446 14.8 %
Revenues
For the three months ended March 31, 2021 and 2020, total revenues were $475.2 million and $449.8 million, respectively. Set forth below is a discussion of changes in theindividual components of total revenues.
For the three months ended March 31, 2021 and 2020, total portfolio rental revenues and other property income totaled $474.5 million and $449.8 million, respectively, anincrease of 5.5%, driven by an increase in average occupancy, an increase in average monthly rent per occupied home, and a 716 home increase between periods in the averagenumber of homes owned, partially offset by an increase in bad debt and reduced fee income.
Average occupancy for the three months ended March 31, 2021 and 2020 for the total portfolio was 97.3% and 94.4%, respectively. Average monthly rent per occupied home forthe total portfolio for the three months ended March 31, 2021 and 2020 was $1,916 and $1,851, respectively, a 3.5% increase. For our Same Store portfolio, average occupancy was98.4% and 96.7% for the three months ended March 31, 2021 and 2020, respectively, and average monthly rent per occupied home for the three months ended March 31, 2021 and2020 was $1,915 and $1,851, respectively, a 3.5% increase.
The annualized turnover rate for the Same Store portfolio for the three months ended March 31, 2021 and 2020 was 21.2% and 25.2%, respectively. For the Same Storeportfolio, an average home remained unoccupied for 29 and 51 days between residents for the three months ended March 31, 2021 and 2020, respectively. The decreases in these twometrics contributed to our increase in occupancy on a year over year basis. Furthermore, we believe the decrease in turnover is partially attributable to the effects of the COVID-19pandemic (e.g., eviction moratoriums and residents who are not inclined to relocate during this period). We cannot predict how long eviction moratoriums will remain in place norwhen the general effects of the pandemic will subside and how those items may affect our turnover and occupancy rates.
45

To monitor prospective changes in average monthly rent per occupied home, we compare the monthly rent from an expiring lease to the monthly rent from the next lease for thesame home, in each case, net of any amortized non-service concessions, to calculate net effective rental rate growth. Leases are either renewal leases, where our current resident staysfor a subsequent lease term, or new leases, where our previous resident moves out and a new resident signs a lease to occupy the same home.
Renewal lease net effective rental rate growth for the total portfolio averaged 4.3% and 4.3% for the three months ended March 31, 2021 and 2020, respectively, and new leasenet effective rental rate growth for the total portfolio averaged 8.0% and 2.0% for the three months ended March 31, 2021 and 2020, respectively. For our Same Store portfolio,renewal lease net effective rental rate growth averaged 4.4% and 4.2% for the three months ended March 31, 2021 and 2020, respectively, and new lease net effective rental rategrowth averaged 7.9% and 1.8% for the three months ended March 31, 2021 and 2020, respectively.
The COVID-19 pandemic has negatively impacted our rental revenues and other property income in three notable ways: (1) lower collection rates, which caused our bad debt toincrease from 0.4% of gross rental income for the three months ended March 31, 2020 to 2.3% of gross rental income for the three months ended March 31, 2021; (2) non-enforcement and non-collection of late fees in certain markets during the three months ended March 31, 2021, which was a primary driver of a decrease in fee income year over year;and (3) lower reimbursements of move out and other costs as a result of lower turnover and eviction moratoriums.
The COVID-19 pandemic and the ensuing jurisdictional restrictions on rental rates, late fees, and collections, as well as eviction moratoriums are likely to continue to affectcollection rates, ability to increase rental revenues in certain markets, and fees and other ancillary income charged to residents.
For the three months ended March 31, 2021, joint venture management fees totaled $0.8 million.
Expenses
For the three months ended March 31, 2021 and 2020, total expenses were $429.4 million and $418.4 million, respectively. Set forth below is a discussion of changes in theindividual components of total expenses.
For the three months ended March 31, 2021, property operating and maintenance expense increased to $168.4 million from $166.9 million for the three months ended March 31,2020. In addition to a 716 home increase between periods in the average number of homes, this 0.9% net increase resulted from increases in property taxes and utilities, partiallyoffset by decreases in repairs and maintenance, turnover, and property administrative costs. The COVID-19 pandemic is likely to continue to impact our turnover rates, and thusturnover costs, and other property operating and maintenance expense may continue to be affected by the ongoing impacts of the pandemic.
Property management expense and general and administrative expense increased to $32.8 million from $28.6 million for the three months ended March 31, 2021 and 2020,respectively, primarily due to a $1.7 million increase in share-based compensation expense and individually immaterial increases in other compensation and administrative costs forthe three months ended March 31, 2021 as compared to the three months ended March 31, 2020. To date, the COVID-19 pandemic has not had a material impact on our propertymanagement and general and administrative expenses.
Interest expense was $83.4 million and $84.8 million for the three months ended March 31, 2021 and 2020, respectively. The decrease in interest expense was primarily drivenby a decrease in the average debt balance outstanding during the three months ended March 31, 2021 as compared to the three months ended March 31, 2020 due to variousprepayments subsequent to March 31, 2020. Debt outstanding, net of deferred financing costs and discounts, decreased to $8,022.7 million as of March 31, 2021 from$8,638.8 million as of March 31, 2020.
Depreciation and amortization expense increased to $144.5 million for the three months ended March 31, 2021 from $135.0 million for the three months ended March 31, 2020due to an increase in cumulative capital expenditures and an increase in the average number of homes owned during the three months ended March 31, 2021 compared to the threemonths ended March 31, 2020.
Impairment and other expenses were $0.4 million and $3.1 million for the three months ended March 31, 2021 and 2020, respectively. During the three months ended March 31,2021, impairment and other expenses was primarily comprised of impairment losses of $0.4 million on our single-family residential properties. During the three months endedMarch 31, 2020,
46

impairment and other expenses was comprised of impairment losses of $2.5 million on our single-family residential properties and casualty losses of $0.6 million. The impairmentcosts recognized during the three months ended March 31, 2021 and 2020 were not a direct result of the COVID-19 pandemic.
Unrealized Gains (Losses) on Investments in Equity Securities
For the three months ended March 31, 2021, unrealized gains (losses) on investments in equity securities includes a $3.1 million loss from marking an investment that has areadily determinable fair value to market.
Other, net
Other, net decreased to $0.2 million for the three months ended March 31, 2021 from $3.7 million for the three months ended March 31, 2020, primarily due to changes in thecomponents of our miscellaneous income and expenses during the three months ended March 31, 2021.
Gain on Sale of Property, net of tax
Gain on sale of property, net of tax was $14.5 million and $15.2 million for the three months ended March 31, 2021 and 2020, respectively. The primary driver of the decreasewas a decrease in the number of homes sold from 484 during the three months ended March 31, 2020 to 248 during the three months ended March 31, 2021, partially offset by anincrease in the average gain per home sold during the three months ended March 31, 2021 compared to the three months ended March 31, 2020.
Income from Investments in Unconsolidated Joint Ventures
Income from investments in unconsolidated joint ventures is comprised of our equity in earnings therefrom and totaled $0.4 million during the three months ended March 31,2021.
Liquidity and Capital Resources
Our liquidity and capital resources as of March 31, 2021 and December 31, 2020 include unrestricted cash and cash equivalents of $187.3 million and $213.4 million,respectively, a 12.2% decrease. As of March 31, 2021, our $1,000.0 million revolving facility (the “Revolving Facility”) remains undrawn, and there are no restrictions on our abilityto draw additional funds thereunder provided we remain in compliance with all covenants. We have no debt reaching final maturity until December 2024, provided all extensions areexercised, with the exception of $345.0 million of convertible notes maturing in January 2022.
Our ability to access capital as well as to use cash from operations to continue to meet our liquidity needs, all of which are highly uncertain and cannot be predicted, could beaffected by various risks and uncertainties, including, but not limited to, the effects of the COVID-19 pandemic, as detailed in Part I. Item 1A. “Risk Factors” in our Annual Reporton Form 10-K.
Through March 31, 2021, disposition channels remained healthy in our markets, and we continued to sell homes that were designated for disposition. With a pipeline ofacquisitions to which we are committed of $113.7 million as of March 31, 2021, we have limited cash commitments outside of debt service. However, the ongoing impact of theCOVID-19 pandemic may impact the acquisition and disposition of single-family homes in ways that we are unable to predict.
Liquidity is a measure of our ability to meet potential cash requirements, maintain our assets, fund our operations, make dividend payments to our stockholders, and meet othergeneral requirements of our business. Our liquidity, to a certain extent, is subject to general economic, financial, competitive, and other factors beyond our control. Our near-termliquidity requirements consist primarily of: (i) renovating newly-acquired homes; (ii) funding HOA fees (as applicable), property taxes, insurance premiums, and the ongoingmaintenance of our homes; (iii) interest expense; (iv) payment of dividends to our equity investors; and (v) required contributions to the Rockpoint Group, L.L.C. (“Rockpoint”) jointventure. We believe our rental income, net of total expenses, will generally provide cash flow sufficient to fund operations and dividend payments on a near-term basis. Additionally,we have guaranteed the funding of certain tax, insurance, and non-conforming property reserves related to the Rockpoint joint venture’s financing. We do not expect this guarantee tohave a material current or future effect on our liquidity.
47
However, the COVID-19 pandemic may negatively impact our operating cash flow such that we are unable to make required debt service payments, which would result in anevent of default for any such loan agreement under which payments were not made. Specifically, the collateral within individual borrower entities may underperform, resulting incash flow shortfalls for debt service while consolidated cash flows are sufficient to fund our operations. If an event of default occurs for a specific mortgage loan or for our securedterm loan, our loan agreements provide certain remedies, including our ability to fund shortfalls from consolidated cash flow; and such an event of default would not result in animmediate acceleration of the loan.
Our real estate assets are illiquid in nature. A timely liquidation of assets may not be a viable source of short-term liquidity should a cash flow shortfall arise, and we may need tosource liquidity from other financing sources, such as the Revolving Facility, which had an undrawn balance of $1,000.0 million as of March 31, 2021.
Our long-term liquidity requirements consist primarily of funds necessary to pay for the acquisition of, and non-recurring capital expenditures for, our homes and principalpayments on and maturities of our indebtedness. We intend to satisfy our long-term liquidity needs through cash provided by operations, long-term secured and unsecuredborrowings, the issuance of debt and equity securities, and property dispositions. As a REIT, we are required to distribute to our stockholders at least 90% of our taxable income,excluding net capital gain, on an annual basis. Therefore, as a general matter, it is unlikely that we will be able to retain substantial cash balances from our annual taxable income thatcould be used to meet our liquidity needs. Instead, we will need to meet these needs from external sources of capital and amounts, if any, by which our cash flow generated fromoperations exceeds taxable income.
Certain Securitizations, the Secured Term Loan, the Term Loan Facility (all defined below), and the Revolving Facility (collectively, the “LIBOR-Based Loans”) use the onemonth London Interbank Offer Rate (“LIBOR”) as a benchmark for establishing interest rates. Our derivative instruments are also indexed to one month LIBOR. On March 5, 2021,the Financial Conduct Authority of the United Kingdom, which has statutory powers to require panel banks to contribute to LIBOR, announced that it would cease publication of theone week and two month USD LIBOR immediately after December 31, 2021 and cease publication of the remaining tenors immediately after June 30, 2023. Once one month LIBORis phased out after June 30, 2023, the interest rates for our LIBOR-Based Loans will be based on a comparable or successor rate as provided for in our loan agreements. We will workwith the counterparties to our swap and cap agreements to adjust each floating rate to a comparable or successor rate. While we do not expect that the transition from LIBOR andrisks related thereto will have a material adverse effect on our financing costs, the ultimate outcome of this change is uncertain at this time, and significant management time andattention may be required to transition to using the new benchmark rates and to implement necessary changes to our financial models.
The following describes the key terms of our current indebtedness.
Mortgage Loans
Our securitization transactions (the “Securitizations” or the “mortgage loans”) are collateralized by certain homes owned by wholly owned subsidiaries of INVH LP that wereformed to facilitate certain of our financing arrangements (the “Borrower Entities”). We utilize the proceeds from our securitizations to fund: (i) repayments of then-outstandingindebtedness; (ii) initial deposits into Securitization reserve accounts; (iii) closing costs in connection with the mortgage loans; and (iv) general costs associated with our operations.
48
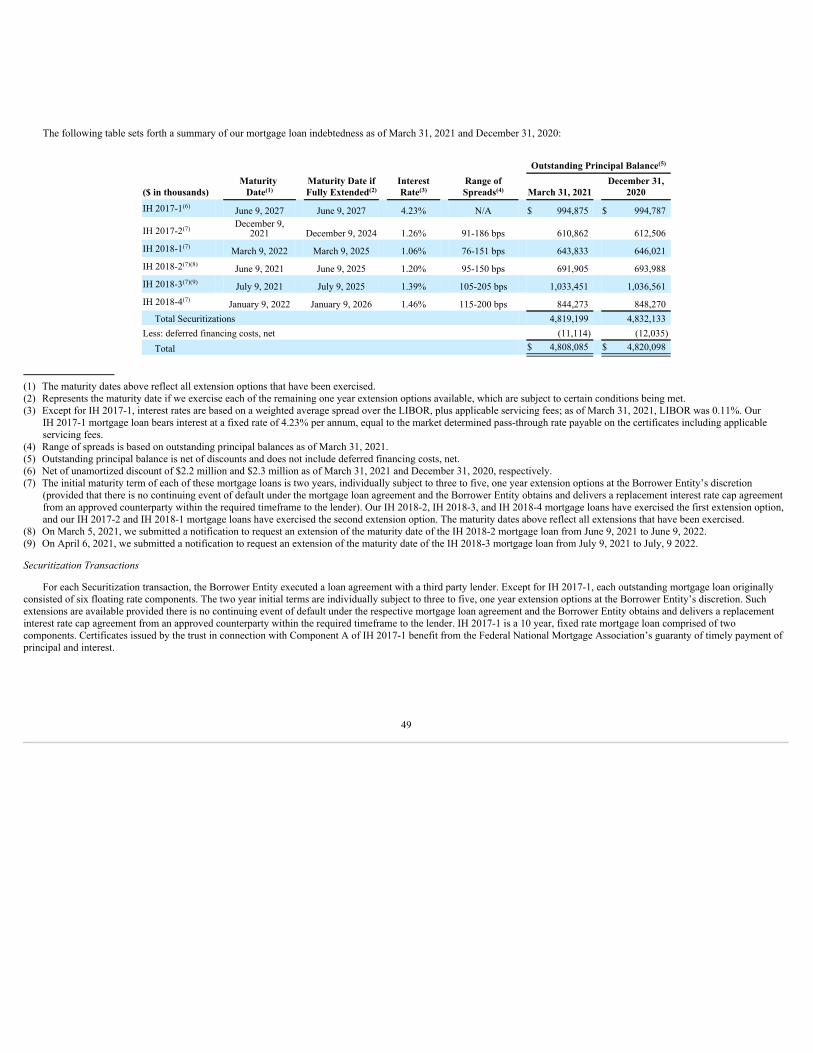
The following table sets forth a summary of our mortgage loan indebtedness as of March 31, 2021 and December 31, 2020:
Outstanding Principal Balance
($ in thousands)Maturity
DateMaturity Date ifFully Extended
InterestRate
Range ofSpreads March 31, 2021
December 31,2020
IH 2017-1 June 9, 2027 June 9, 2027 4.23% N/A $ 994,875 $ 994,787
IH 2017-2December 9,
2021 December 9, 2024 1.26% 91-186 bps 610,862 612,506 IH 2018-1 March 9, 2022 March 9, 2025 1.06% 76-151 bps 643,833 646,021 IH 2018-2 June 9, 2021 June 9, 2025 1.20% 95-150 bps 691,905 693,988 IH 2018-3 July 9, 2021 July 9, 2025 1.39% 105-205 bps 1,033,451 1,036,561 IH 2018-4 January 9, 2022 January 9, 2026 1.46% 115-200 bps 844,273 848,270
Total Securitizations 4,819,199 4,832,133 Less: deferred financing costs, net (11,114) (12,035)
Total $ 4,808,085 $ 4,820,098
(1) The maturity dates above reflect all extension options that have been exercised.(2) Represents the maturity date if we exercise each of the remaining one year extension options available, which are subject to certain conditions being met.(3) Except for IH 2017-1, interest rates are based on a weighted average spread over the LIBOR, plus applicable servicing fees; as of March 31, 2021, LIBOR was 0.11%. Our
IH 2017-1 mortgage loan bears interest at a fixed rate of 4.23% per annum, equal to the market determined pass-through rate payable on the certificates including applicableservicing fees.
(4) Range of spreads is based on outstanding principal balances as of March 31, 2021.(5) Outstanding principal balance is net of discounts and does not include deferred financing costs, net.(6) Net of unamortized discount of $2.2 million and $2.3 million as of March 31, 2021 and December 31, 2020, respectively.(7) The initial maturity term of each of these mortgage loans is two years, individually subject to three to five, one year extension options at the Borrower Entity’s discretion
(provided that there is no continuing event of default under the mortgage loan agreement and the Borrower Entity obtains and delivers a replacement interest rate cap agreementfrom an approved counterparty within the required timeframe to the lender). Our IH 2018-2, IH 2018-3, and IH 2018-4 mortgage loans have exercised the first extension option,and our IH 2017-2 and IH 2018-1 mortgage loans have exercised the second extension option. The maturity dates above reflect all extensions that have been exercised.
(8) On March 5, 2021, we submitted a notification to request an extension of the maturity date of the IH 2018-2 mortgage loan from June 9, 2021 to June 9, 2022.(9) On April 6, 2021, we submitted a notification to request an extension of the maturity date of the IH 2018-3 mortgage loan from July 9, 2021 to July, 9 2022.
Securitization Transactions
For each Securitization transaction, the Borrower Entity executed a loan agreement with a third party lender. Except for IH 2017-1, each outstanding mortgage loan originallyconsisted of six floating rate components. The two year initial terms are individually subject to three to five, one year extension options at the Borrower Entity’s discretion. Suchextensions are available provided there is no continuing event of default under the respective mortgage loan agreement and the Borrower Entity obtains and delivers a replacementinterest rate cap agreement from an approved counterparty within the required timeframe to the lender. IH 2017-1 is a 10 year, fixed rate mortgage loan comprised of twocomponents. Certificates issued by the trust in connection with Component A of IH 2017-1 benefit from the Federal National Mortgage Association’s guaranty of timely payment ofprincipal and interest.
(5)
(1) (2) (3) (4)
(6)
(7)
(7)
(7)(8)
(7)(9)
(7)
49

Each mortgage loan is secured by a pledge of the equity in the assets of the respective Borrower Entities, as well as first-priority mortgages on the underlying properties and agrant of security interests in all of the related personal property. As of March 31, 2021 and December 31, 2020, a total of 31,252 and 31,316 homes, respectively, with a net bookvalue of $5,708.8 million and $5,761.6 million, respectively, are pledged pursuant to the mortgage loans. Each Borrower Entity has the right, subject to certain requirements andlimitations outlined in the respective loan agreements, to substitute properties. We are obligated to make monthly payments of interest for each mortgage loan.
Transactions with Trusts
Concurrent with the execution of each mortgage loan agreement, the respective third party lender sold each loan it originated to individual depositor entities (the “DepositorEntities”) who subsequently transferred each loan to Securitization-specific trust entities (the “Trusts”). The Depositor Entities for our currently outstanding Securitizations arewholly owned subsidiaries.
As consideration for the transfer of each loan to the Trusts, the Trusts issued classes of certificates which mirror the components of the individual loans (collectively, the“Certificates”) to the Depositor Entities, except that Class R certificates do not have related loan components as they represent residual interests in the Trusts. The Certificatesrepresent the entire beneficial interest in the Trusts. Following receipt of the Certificates, the Depositor Entities sold the Certificates to investors and used the proceeds asconsideration for the loans sold to the Depositor Entities by the lenders. These transactions had no effect on our condensed consolidated financial statements other than with respectto Certificates we retained in connection with Securitizations or purchased at a later date.
The Trusts are structured as pass-through entities that receive interest payments from the Securitizations and distribute those payments to the holders of the Certificates. Theassets held by the Trusts are restricted and can only be used to fulfill the obligations of those entities. The obligations of the Trusts do not have any recourse to the general credit ofany entities in these condensed consolidated financial statements. We have evaluated our interests in certain certificates of the Trusts held by us (discussed below) and determinedthat they do not create a more than insignificant variable interest in the Trusts. Additionally, the retained certificates do not provide us with any ability to direct activities that couldimpact the Trusts’ economic performance. Therefore, we do not consolidate the Trusts.
Retained Certificates
As the Trusts made Certificates available for sale to both domestic and foreign investors, sponsors of the mortgage loans are required to retain a portion of the risk that representsa material net economic interest in each loan pursuant to Regulation RR (the “Risk Retention Rules”) under the Securities Exchange Act of 1934, as amended. As such, loan sponsorsare required to retain a portion of the credit risk that represents not less than 5% of the aggregate fair value of the loan as of the closing date.
IH 2017-1 issued Class B certificates, which are restricted certificates that were made available exclusively to INVH LP in order to comply with the Risk Retention Rules. TheClass B certificates bear a stated annual interest rate of 4.23%, including applicable servicing fees.
For IH 2017-2, IH 2018-1, IH 2018-2, IH 2018-3, and IH 2018-4, we retain 5% of each class of certificates to meet the Risk Retention Rules. These retained certificates accrueinterest at a floating rate of LIBOR plus a spread ranging from 0.76% to 2.05%.
The retained certificates total $244.6 million and $245.2 million as of March 31, 2021 and December 31, 2020, respectively, and are classified as held to maturity investmentsand recorded in other assets, net on the condensed consolidated balance sheets.
Loan Covenants
The general terms that apply to all of the mortgage loans require each Borrower Entity to maintain compliance with certain affirmative and negative covenants. Affirmativecovenants include each Borrower Entity’s, and certain of their respective affiliates’, compliance with (i) licensing, permitting and legal requirements specified in the mortgage loanagreements, (ii) organizational requirements of the jurisdictions in which they are organized, (iii) federal and state tax laws, and (iv) books and records requirements specified in therespective mortgage loan agreements. Negative covenants include
50

each Borrower Entity’s, and certain of their affiliates’, compliance with limitations surrounding (i) the amount of each Borrower Entity’s indebtedness and the nature of theirinvestments, (ii) the execution of transactions with affiliates, (iii) the Manager, (iv) the nature of each Borrower Entity’s business activities, and (v) the required maintenance ofspecified cash reserves. As of March 31, 2021, and through the date our condensed consolidated financial statements were issued, we believe each Borrower Entity is in compliancewith all affirmative and negative covenants.
Prepayments
For the mortgage loans, prepayments of amounts owed by us are generally not permitted under the terms of the respective mortgage loan agreements unless such prepaymentsare made pursuant to the voluntary election or mandatory provisions specified in such agreements. The specified mandatory provisions become effective to the extent that a propertybecomes characterized as a disqualified property, a property is sold, and/or upon the occurrence of a condemnation or casualty event associated with a property. To the extent either avoluntary election is made, or a mandatory prepayment condition exists, in addition to paying all interest and principal, we must also pay certain breakage costs as determined by theloan servicer and a spread maintenance premium if prepayment occurs before the month following the one or two year anniversary of the closing dates of each of the mortgage loansexcept for IH 2017-1. For IH 2017-1, prepayments on or before December 2026 will require a yield maintenance premium. For the three months ended March 31, 2021 and 2020, wemade voluntary and mandatory prepayments of $13.0 million and $107.4 million, respectively, under the terms of the mortgage loan agreements.
Secured Term Loan
On June 7, 2019, 2019-1 IH Borrower LP, a consolidated subsidiary (“2019-1 IH Borrower” and one of our Borrower Entities), entered into a 12 year loan agreement with a lifeinsurance company (the “Secured Term Loan”). The Secured Term Loan bears interest at a fixed rate of 3.59%, including applicable servicing fees, for the first 11 years and bearsinterest at a floating rate based on a spread of 147 bps, including applicable servicing fees, over one month LIBOR (subject to certain adjustments as outlined in the loan agreement)for the twelfth year. The Secured Term Loan is secured by first priority mortgages on a portfolio of single-family rental properties as well as a first priority pledge of the equityinterests of 2019-1 IH Borrower. We utilized the proceeds from the Secured Term Loan to fund: (i) repayments of then-outstanding indebtedness; (ii) initial deposits into the SecuredTerm Loan’s reserve accounts; (iii) transaction costs related to the closing of the Secured Term Loan; and (iv) general corporate purposes.
The following table sets forth a summary of our Secured Term Loan indebtedness as of March 31, 2021 and December 31, 2020:
($ in thousands)Maturity
DateInterest Rate March 31, 2021
December 31,2020
Secured Term Loan June 9, 2031 3.59% $ 403,363 $ 403,363 Deferred financing costs, net (2,214) (2,268)
Secured Term Loan, net $ 401,149 $ 401,095
(1) The Secured Term Loan bears interest at a fixed rate of 3.59% per annum including applicable servicing fees for the first 11 years and for the twelfth year bears interest at afloating rate based on a spread of 147 bps over one month LIBOR (or a comparable or successor rate as provided for in our loan agreement), including applicable servicing fees,subject to certain adjustments as outlined in the loan agreement. Interest payments are made monthly.
Collateral
The Secured Term Loan’s collateral pool contains 3,334 and 3,332 homes as of March 31, 2021 and December 31, 2020, respectively, with a net book value of $715.7 millionand $719.8 million, respectively. 2019-1 IH Borrower has the right, subject to certain requirements and limitations outlined in the loan agreement, to substitute propertiesrepresenting up to 20% of the collateral pool annually, and to substitute properties representing up to 100% of the collateral pool over the life of the Secured Term Loan. In addition,four times after the first anniversary of the closing date, 2019-1 IH Borrower has the right, subject to certain requirements and limitations outlined in the loan agreement, to execute aspecial release of collateral
(1)
51

representing up to 15% of the then-outstanding principal balance of the Secured Term Loan in order to bring the loan-to-value ratio back in line with the Secured Term Loan’s loan-to-value ratio as of the closing date. Any such special release of collateral would not change the then-outstanding principal balance of the Secured Term Loan, but rather wouldreduce the number of single-family rental homes included in the collateral pool.
Loan Covenants
The Secured Term Loan requires 2019-1 IH Borrower to maintain compliance with certain affirmative and negative covenants. Affirmative covenants include 2019-1 IHBorrower’s, and certain of its affiliates’, compliance with (i) licensing, permitting and legal requirements specified in the loan agreement, (ii) organizational requirements of thejurisdictions in which they are organized, (iii) federal and state tax laws, and (iv) books and records requirements specified in the loan agreement. Negative covenants include 2019-1 IH Borrower’s, and certain of its affiliates’, compliance with limitations surrounding (i) the amount of 2019-1 IH Borrower’s indebtedness and the nature of its investments, (ii) theexecution of transactions with affiliates, (iii) the Manager, (iv) the nature of 2019-1 IH Borrower’s business activities, and (v) the required maintenance of specified cash reserves. Asof March 31, 2021, and through the date our condensed consolidated financial statements were issued, we believe 2019-1 IH Borrower is in compliance with all affirmative andnegative covenants.
Prepayments
Prepayments of the Secured Term Loan are generally not permitted unless such prepayments are made pursuant to the voluntary election or mandatory provisions specified in theloan agreement. The specified mandatory provisions become effective to the extent that a property becomes characterized as a disqualified property, a property is sold, and/or uponthe occurrence of a condemnation or casualty event associated with a property. To the extent either a voluntary election is made, or a mandatory prepayment condition exists, inaddition to paying all interest and principal, we must also pay certain breakage costs as determined by the loan servicer and a yield maintenance premium if prepayment occurs beforeJune 9, 2030. No such prepayments were made during the three months ended March 31, 2021 and 2020.
Term Loan Facility and Revolving Facility
On December 8, 2020, we entered into an Amended and Restated Revolving Credit and Term Loan Agreement with a syndicate of banks, financial institutions, and institutionallenders for a new credit facility (the “Credit Facility”). The Credit Facility provides $3,500.0 million of borrowing capacity and consists of the $1,000.0 million Revolving Facilityand a $2,500.0 million term loan facility (the “Term Loan Facility”), both of which mature on January 31, 2025, with two six month extension options available. The RevolvingFacility also includes borrowing capacity for letters of credit. The Credit Facility provides us with the option to enter into additional incremental credit facilities (including anuncommitted incremental facility that provides us with the option to increase the size of the Revolving Facility and/or the Term Loan Facility such that the aggregate amount does notexceed at any time $4,000.0 million), subject to certain limitations.
The Credit Facility replaced a credit facility that consisted of a $1,000.0 million revolving facility (the “2017 Revolving Facility”) and a $1,500.0 million term loan facility (the“2017 Term Loan Facility” and together with the 2017 Revolving Facility, the “2017 Credit Facility”). The terms and conditions of the Credit Facility are consistent with those of the2017 Credit Facility unless otherwise noted below. Proceeds from the Term Loan Facility were used to repay then-outstanding indebtedness, including the 2017 Term Loan Facility.Proceeds from the Revolving Facility are used for general corporate purposes.
52

The following table sets forth a summary of the outstanding principal amounts under the Credit Facility as of March 31, 2021 and December 31, 2020, respectively:
($ in thousands)Maturity
DateInterest Rate March 31, 2021
December 31,2020
Term Loan Facility January 31, 2025 1.66% $ 2,500,000 $ 2,500,000 Deferred financing costs, net (27,282) (29,093)
Term Loan Facility, net $ 2,472,718 $ 2,470,907
Revolving Facility January 31, 2025 1.71% $ — $ —
(1) Interest rates for the Term Loan Facility and the Revolving Facility are based on LIBOR plus an applicable margin. As of March 31, 2021, the applicable margins were 1.55%and 1.60% respectively, and LIBOR was 0.11%.
(2) If we exercise the two six month extension options, the maturity date will be January 31, 2026.
Interest Rate and Fees
Borrowings under the Credit Facility bear interest, at our option, at a rate equal to a margin over either (a) a LIBOR rate determined by reference to the Bloomberg LIBOR rate(or a comparable or successor rate as provided for in our loan agreement) for the interest period relevant to such borrowing, or (b) a base rate determined by reference to the highestof (1) the administrative agent’s prime lending rate, (2) the federal funds effective rate plus 0.50%, and (3) the LIBOR rate that would be payable on such day for a LIBOR rate loanwith a one month interest period plus 1.00%. The margin is based on a total leverage based grid. The margins for the Term Loan Facility, Revolving Facility, 2017 Term LoanFacility, and 2017 Revolving Facility are as follows:
Base Rate Loans LIBOR Rate LoansTerm Loan Facility 0.45% — 1.15% 1.45% — 2.15%Revolving Facility 0.50% — 1.15% 1.50% — 2.15%2017 Term Loan Facility 0.70% — 1.30% 1.70% — 2.30%2017 Revolving Facility 0.75% — 1.30% 1.75% — 2.30%
In addition, the Credit Facility provides that, upon receiving an investment grade rating on its non-credit enhanced, senior unsecured long term debt of BBB- or better fromStandard & Poor’s Rating Services, a division of The McGraw-Hill Companies, Inc., or Baa3 or better from Moody’s Investors Service, Inc., we may elect to convert to a creditrating based pricing grid. The margins for the Term Loan Facility and Revolving Facility under the credit rating based pricing grid are as follows:
Base Rate Loans LIBOR Rate LoansTerm Loan Facility — % — 0.65% 0.80% — 1.65%Revolving Facility — % — 0.45% 0.75% — 1.45%
The Credit Facility also includes a sustainability component whereby the Revolving Facility pricing can improve upon the Company’s achievement of certain sustainabilityratings, determined via an independent third party evaluation. This sustainability feature was not included in the 2017 Revolving Facility.
In addition to paying interest on outstanding principal under the Credit Facility, we are required to pay an unused facility fee to the lenders under the Revolving Facility inrespect of the unused commitments thereunder. The unused facility fee rate is based on the daily unused amount of the Revolving Facility and is either 0.30% or 0.20% per annumbased on the unused facility amount. The unused facility fee rate for the 2017 Revolving Facility was 0.35% or 0.20% per annum based on the unused facility amount. Uponconversion to a credit rating pricing based grid, the unused facility fee will no longer apply and we will be required to pay a facility fee ranging from 0.10% to 0.30%. We are alsorequired to pay customary letter of credit fees.
(1)
(2)
(2)
53

Prepayments and Amortization
No principal reductions are required under the Credit Facility. We are permitted to voluntarily repay amounts outstanding under the Term Loan Facility at any time withoutpremium or penalty, subject to certain minimum amounts and the payment of customary “breakage” costs with respect to LIBOR loans. Once repaid, no further borrowings will bepermitted under the Term Loan Facility.
Loan Covenants
The Credit Facility contains certain customary affirmative and negative covenants and events of default. Such covenants will, among other things, restrict, subject to certainexceptions, our ability and that of the Subsidiary Guarantors (as defined below) and their respective subsidiaries to (i) engage in certain mergers, consolidations or liquidations,(ii) sell, lease or transfer all or substantially all of their respective assets, (iii) engage in certain transactions with affiliates, (iv) make changes to our fiscal year, (v) make changes inthe nature of our business and our subsidiaries, and (vi) enter into certain burdensome agreements.
The Credit Facility also requires us, on a consolidated basis with our subsidiaries, to maintain a (i) maximum total leverage ratio, (ii) maximum secured leverage ratio,(iii) maximum unencumbered leverage ratio, (iv) minimum fixed charge coverage ratio, (v) minimum unsecured interest coverage ratio, and (vi) maximum secured recourse leverageratio. If an event of default occurs, the lenders under the Credit Facility are entitled to take various actions, including the acceleration of amounts due under the Credit Facility. As ofMarch 31, 2021, and through the date our condensed consolidated financial statements were issued, we believe we were in compliance with all affirmative and negative covenants.
Guarantees and Security
The obligations under the Credit Facility are guaranteed on a joint and several basis by each of our direct and indirect domestic wholly owned subsidiaries that directly ownunencumbered assets (the “Subsidiary Guarantors”), subject to certain exceptions. These guarantees will be automatically released upon the occurrence of certain events, including ifthe applicable Subsidiary Guarantor is no longer a direct owner of an unencumbered asset. In addition, INVH and each subsidiary of INVH that owns equity in the Borrower may berequired to provide a guarantee of the Credit Facility under certain circumstances, including if INVH does not maintain its qualification as a REIT.
Although the 2017 Credit Facility was secured, such security interests have been released and the Credit Facility is unsecured.
Convertible Senior Notes
In connection with the Mergers, we assumed SWH’s convertible senior notes. In January 2017, SWH issued $345.0 million in aggregate principal amount of 3.50% convertiblesenior notes due 2022 (the “2022 Convertible Notes” or the “Convertible Senior Notes”). Interest on the 2022 Convertible Notes is payable semiannually in arrears on January 15thand July 15th of each year. The 2022 Convertible Notes will mature on January 15, 2022.
The following table summarizes the terms of the Convertible Senior Notes outstanding as of March 31, 2021 and December 31, 2020:
Principal Amount
($ in thousands)Coupon
RateEffective
RateConversion
RateMaturity
Date
RemainingAmortization
Period March 31, 2021December 31,
20202022 Convertible Notes 3.50% 5.12% 43.9024 January 15, 2022 0.79 years $ 345,000 $ 345,000 Net unamortized fair value adjustment (4,270) (5,596)
Total $ 340,730 $ 339,404
(1) Effective rate includes the effect of the adjustment to the fair value of the debt as of the Merger Date, the value of which reduced the initial liability recorded to $324.3 millionfor the 2022 Convertible Notes.
(2) The conversion rate as of March 31, 2021 represents the number of shares of common stock issuable per $1,000 principal amount (actual $) of the 2022 Convertible Notesconverted on such date, as adjusted in accordance with the indenture as
(1) (2)
54

a result of cash dividend payments and the effects of previous mergers. We have the option to settle the 2022 Convertible Notes in cash, common stock, or a combinationthereof.
Terms of Conversion
As of March 31, 2021, the conversion rate applicable to the 2022 Convertible Notes is 43.9024 shares of our common stock per $1,000 principal amount (actual $) of the 2022Convertible Notes (equivalent to a conversion price of approximately $22.78 per common share — actual $). The conversion rate for the 2022 Convertible Notes is subject toadjustment in some events, but will not be adjusted for any accrued and unpaid interest. In addition, following certain events that occur prior to the maturity date, we will adjust theconversion rate for a holder who elects to convert its 2022 Convertible Notes in connection with such an event in certain circumstances. At any time prior to July 15, 2021, holdersmay convert the 2022 Convertible Notes at their option only under specific circumstances as defined in the indenture agreement, dated as of January 10, 2017, between us and ourtrustee, Wilmington Trust National Association (the “Convertible Notes Trustee”). On or after July 15, 2021 and until maturity, holders may convert all or any portion of the 2022Convertible Notes at any time. Upon conversion, we will pay or deliver, as the case may be, cash, common stock, or a combination of cash and common stock, at our election. The“if-converted” value of the 2022 Convertible Notes exceeds the principal amount by $139.5 million as of March 31, 2021 as the closing market price of our common stock of $31.99per common share (actual $) exceeds the implicit conversion price. For the three months ended March 31, 2021 and 2020, interest expense for the 2022 Convertible Notes, includingnon-cash amortization of discounts, was $4.3 million and $4.3 million, respectively.
General Terms
We may not redeem the 2022 Convertible Notes prior to their maturity date except to the extent necessary to preserve our status as a REIT for United States federal income taxpurposes, as further described in the indenture. If we undergo a fundamental change as defined in the indenture, holders may require us to repurchase for cash all or any portion oftheir 2022 Convertible Notes at a fundamental change repurchase price equal to 100% of the principal amount of the 2022 Convertible Notes to be repurchased, plus accrued andunpaid interest up to, but excluding, the fundamental change repurchase date.
The indenture contains customary terms and covenants and events of default. If an event of default occurs and is continuing, the Convertible Notes Trustee, by notice to us, orthe holders of at least 25% in aggregate principal amount of the outstanding 2022 Convertible Notes, by notice to us and the Convertible Notes Trustee, may, and the ConvertibleNotes Trustee at the request of such holders shall, declare 100% of the principal of and accrued and unpaid interest on all the 2022 Convertible Notes to be due and payable. In thecase of an event of default arising out of certain events of bankruptcy, insolvency or reorganization in respect to us (as set forth in the indenture), 100% of the principal of andaccrued and unpaid interest on the 2022 Convertible Notes will automatically become due and payable.
Certain Hedging Arrangements
From time to time, we enter into derivative instruments to manage the economic risk of changes in interest rates. We do not enter into derivative transactions for speculative ortrading purposes. Designated hedges are derivatives that meet the criteria for hedge accounting and that we have elected to designate as hedges. Non-designated hedges arederivatives that do not meet the criteria for hedge accounting or that we did not elect to designate as hedges.
Designated Hedges
We have entered into various interest rate swap agreements, which are used to hedge the variable cash flows associated with variable-rate interest payments. Currently, each ofour swap agreements is indexed to one month LIBOR and is designated for hedge accounting purposes. One month LIBOR is set to expire after June 30, 2023, and we will work withthe counterparties to our swap agreements to adjust each floating rate to a comparable or successor rate. Changes in the fair value of these swaps are recorded in other comprehensiveincome and are subsequently reclassified into earnings in the period in which the hedged forecasted transactions affect earnings.
55
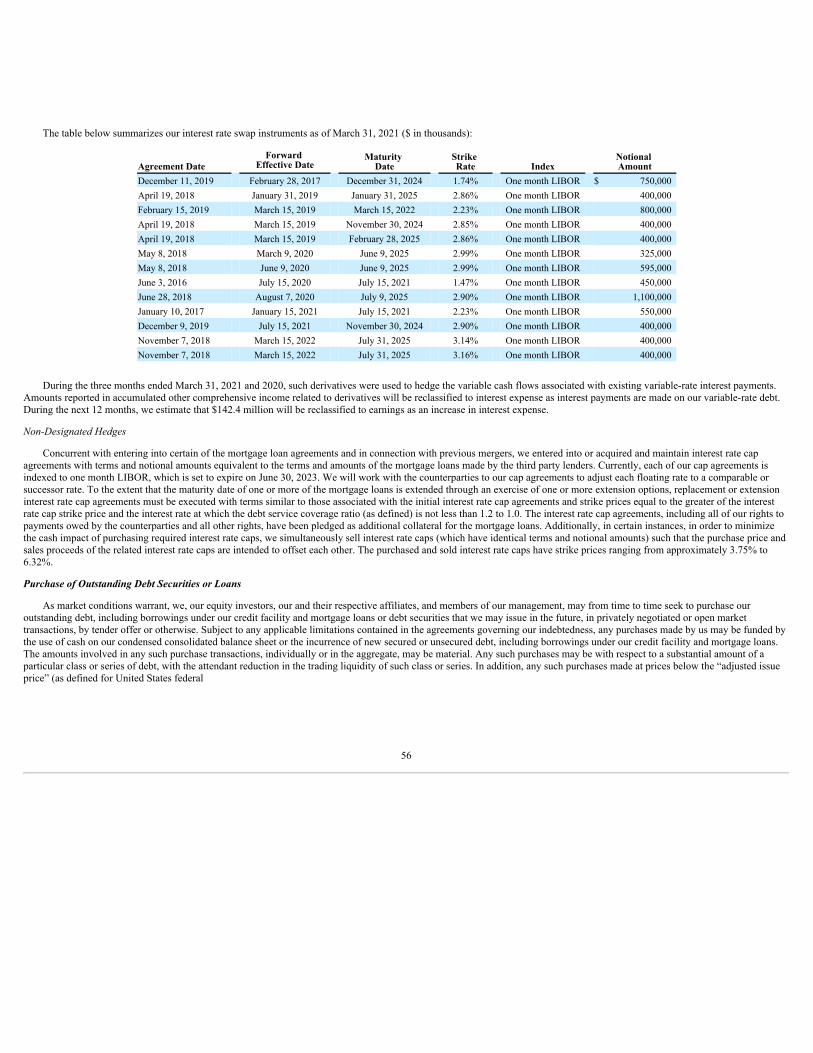
The table below summarizes our interest rate swap instruments as of March 31, 2021 ($ in thousands):
Agreement DateForward
Effective DateMaturity
DateStrike Rate Index
Notional Amount
December 11, 2019 February 28, 2017 December 31, 2024 1.74% One month LIBOR $ 750,000 April 19, 2018 January 31, 2019 January 31, 2025 2.86% One month LIBOR 400,000 February 15, 2019 March 15, 2019 March 15, 2022 2.23% One month LIBOR 800,000 April 19, 2018 March 15, 2019 November 30, 2024 2.85% One month LIBOR 400,000 April 19, 2018 March 15, 2019 February 28, 2025 2.86% One month LIBOR 400,000 May 8, 2018 March 9, 2020 June 9, 2025 2.99% One month LIBOR 325,000 May 8, 2018 June 9, 2020 June 9, 2025 2.99% One month LIBOR 595,000 June 3, 2016 July 15, 2020 July 15, 2021 1.47% One month LIBOR 450,000 June 28, 2018 August 7, 2020 July 9, 2025 2.90% One month LIBOR 1,100,000 January 10, 2017 January 15, 2021 July 15, 2021 2.23% One month LIBOR 550,000 December 9, 2019 July 15, 2021 November 30, 2024 2.90% One month LIBOR 400,000 November 7, 2018 March 15, 2022 July 31, 2025 3.14% One month LIBOR 400,000 November 7, 2018 March 15, 2022 July 31, 2025 3.16% One month LIBOR 400,000
During the three months ended March 31, 2021 and 2020, such derivatives were used to hedge the variable cash flows associated with existing variable-rate interest payments.Amounts reported in accumulated other comprehensive income related to derivatives will be reclassified to interest expense as interest payments are made on our variable-rate debt.During the next 12 months, we estimate that $142.4 million will be reclassified to earnings as an increase in interest expense.
Non-Designated Hedges
Concurrent with entering into certain of the mortgage loan agreements and in connection with previous mergers, we entered into or acquired and maintain interest rate capagreements with terms and notional amounts equivalent to the terms and amounts of the mortgage loans made by the third party lenders. Currently, each of our cap agreements isindexed to one month LIBOR, which is set to expire on June 30, 2023. We will work with the counterparties to our cap agreements to adjust each floating rate to a comparable orsuccessor rate. To the extent that the maturity date of one or more of the mortgage loans is extended through an exercise of one or more extension options, replacement or extensioninterest rate cap agreements must be executed with terms similar to those associated with the initial interest rate cap agreements and strike prices equal to the greater of the interestrate cap strike price and the interest rate at which the debt service coverage ratio (as defined) is not less than 1.2 to 1.0. The interest rate cap agreements, including all of our rights topayments owed by the counterparties and all other rights, have been pledged as additional collateral for the mortgage loans. Additionally, in certain instances, in order to minimizethe cash impact of purchasing required interest rate caps, we simultaneously sell interest rate caps (which have identical terms and notional amounts) such that the purchase price andsales proceeds of the related interest rate caps are intended to offset each other. The purchased and sold interest rate caps have strike prices ranging from approximately 3.75% to6.32%.
Purchase of Outstanding Debt Securities or Loans
As market conditions warrant, we, our equity investors, our and their respective affiliates, and members of our management, may from time to time seek to purchase ouroutstanding debt, including borrowings under our credit facility and mortgage loans or debt securities that we may issue in the future, in privately negotiated or open markettransactions, by tender offer or otherwise. Subject to any applicable limitations contained in the agreements governing our indebtedness, any purchases made by us may be funded bythe use of cash on our condensed consolidated balance sheet or the incurrence of new secured or unsecured debt, including borrowings under our credit facility and mortgage loans.The amounts involved in any such purchase transactions, individually or in the aggregate, may be material. Any such purchases may be with respect to a substantial amount of aparticular class or series of debt, with the attendant reduction in the trading liquidity of such class or series. In addition, any such purchases made at prices below the “adjusted issueprice” (as defined for United States federal
56

income tax purposes) may result in taxable cancellation of indebtedness income to us, which amounts may be material, and in related adverse tax consequences to us.
Cash Flows
Three Months Ended March 31, 2021 Compared to Three Months Ended March 31, 2020
The following table summarizes our cash flows for the three months ended March 31, 2021 and 2020:
For the Three Months Ended March 31,
($ in thousands) 2021 2020 $ Change % ChangeNet cash provided by operating activities $ 240,588 $ 177,721 $ 62,867 35.4 %Net cash used in investing activities (122,556) (80,742) (41,814) (51.8)%Net cash provided by (used in) financing activities (118,979) 132,571 (251,550) (189.7)%
Change in cash, cash equivalents, and restricted cash $ (947) $ 229,550 $ (230,497) (100.4)%
Operating Activities
Our cash flows provided by operating activities depend on numerous factors, including the occupancy level of our homes, the rental rates achieved on our leases, the collectionof rent from our residents, and the amount of our operating and other expenses. Net cash provided by operating activities was $240.6 million and $177.7 million for the three monthsended March 31, 2021 and 2020, respectively, an increase of 35.4%. The increase in cash provided by operating activities was driven by improved operational profitability andchanges in operating assets and liabilities.
Investing Activities
Net cash used in investing activities consists primarily of the acquisition costs of homes, capital improvements, and proceeds from property sales. Net cash used in investingactivities was $122.6 million and $80.7 million for the three months ended March 31, 2021 and 2020, respectively, an increase of $41.8 million. The increase in net cash used ininvesting activities primarily resulted from the combined effect of the following changes in cash flows during the three months ended March 31, 2021 compared to the three monthsended March 31, 2020: (1) a decrease in proceeds from the sale of homes partially offset by (2) a decrease in cash used for the acquisition of homes and (3) a decrease in cash usedfor the initial renovation of homes. More specifically, proceeds from sales of homes decreased $54.0 million from the three months ended March 31, 2020 to the three months endedMarch 31, 2021 due to a significant decrease in the number of homes sold from 484 to 248, respectively, partially offset by an increase in proceeds per home. Acquisition spenddecreased $10.0 million due to a decrease in the number of homes acquired from 504 homes during the three months ended March 31, 2020 to 401 homes during the three monthsended March 31, 2021. Initial renovation spend decreased $8.6 million from the three months ended March 31, 2020 compared to the three months ended March 31, 2021 due to adecrease in the number of homes undergoing their initial renovation partially offset by an increase in the cost per home.
Financing Activities
Net cash provided by (used in) financing activities was $(119.0) million and $132.6 million for the three months ended March 31, 2021 and 2020, respectively. During the threemonths ended March 31, 2021, proceeds from operations and home sales, were used to fund $97.8 million of dividend and distribution payments and to repay $13.0 million ofprincipal on our mortgage loans. For the three months ended March 31, 2020, $270.0 million of proceeds from our 2017 Revolving Facility, net of payments, along with$55.9 million of proceeds from our at the market equity program, net of commissions, and operating cash flows were partially used (1) to repay $107.4 million of our mortgage loans,including partial repayments of IH 2018-2 and IH 2018-3 and (2) to fund $82.3 million of dividend and distribution payments.
57

Contractual Obligations
Our contractual obligations as of March 31, 2021, consist of the following:
($ in thousands) Total 2021 2022-2023 2024-2025 Thereafter
Mortgage loans, net $ 5,295,634 $ 69,416 $ 184,650 $ 3,139,268 $ 1,902,300
Secured Term Loan 550,807 10,854 28,944 28,944 482,065
Term Loan Facility, net 2,703,696 31,701 84,153 84,268 2,503,574
Revolving Facility 17,179 2,674 7,097 7,107 301
2022 Convertible Notes 357,076 6,038 351,038 — —
Derivative instruments 562,860 101,603 277,983 183,274 —
Purchase commitments 113,704 113,704 — — —
Operating leases 16,582 3,830 7,571 4,513 668
Finance leases 8,189 2,427 5,032 730 —
Total $ 9,625,727 $ 342,247 $ 946,468 $ 3,448,104 $ 4,888,908
(1) Includes estimated payments for the remaining nine months of 2021.(2) Includes estimated interest payments on the respective debt based on amounts outstanding as of March 31, 2021 at rates in effect as of such date; as of March 31, 2021, LIBOR
was 0.11%.(3) Represents the maturity date if we exercise each of the remaining one year extension options available, which are subject to certain conditions being met. See Part I. Item 1.
“Financial Statements — Note 7 of Notes to Condensed Consolidated Financial Statements” for a description of maturity dates without consideration of extension options.(4) Includes the related unused commitment fee.(5) Represents the principal amount and interest obligation of the 2022 Convertible Notes which is calculated using the notes’ coupon rate.(6) Includes interest rate swap and interest rate cap obligations calculated using LIBOR as of March 31, 2021, or 0.11%.(7) Represents commitments to acquire 368 single-family rental homes as of March 31, 2021.
We have a commitment, which is not reflected in the table above, to make additional capital contributions to a joint venture. As of March 31, 2021, our remaining equitycommitment to the joint venture is $54.4 million.
Critical Accounting Policies and Estimates
Critical accounting policies are those accounting policies that management believes are important to the portrayal of our financial condition and results and requiremanagement’s most difficult, subjective or complex judgments, often as a result of the need to make estimates about the effect of matters that are inherently uncertain. We believethat our critical accounting policies pertain to our investments in single-family residential properties, including acquisition of real estate assets, related cost capitalization, provisionsfor impairment, and single-family residential properties held for sale. These critical policies and estimates are summarized in Part II. Item 7. “Management’s Discussion and Analysisof Financial Condition and Results of Operations” in our Annual Report on Form 10-K. There were no material changes to our critical accounting policies during the three monthsended March 31, 2021.
For a discussion of recently adopted accounting standards, if any, see Part I. Item 1. “Financial Statements — Note 2 of Notes to Condensed Consolidated Financial Statements.”
Segment Reporting
Operating segments are defined as components of an enterprise for which discrete financial information is available that is evaluated regularly by the chief operating decisionmaker (“CODM”) in deciding how to allocate resources and in assessing performance. Our CODM is the Chief Executive Officer.
(1)
(2)(3)
(2)
(2)
(2)(3)(4)
(5)
(6)
(7)
58

Under the provisions of ASC 280, Segment Reporting, we have determined that we have one reportable segment related to acquiring, renovating, leasing, and operating single-family homes as rental properties. The CODM evaluates operating performance and allocates resources on a total portfolio basis. The CODM utilizes NOI as the primary measure toevaluate performance of the total portfolio. The aggregation of individual homes constitutes the total portfolio. Decisions regarding acquisitions and dispositions of homes are madeat the individual home level with a focus on growing accretively in high-growth locations where we have greater scale and density.
Non-GAAP Measures
EBITDA, EBITDAre, and Adjusted EBITDAre
EBITDA, EBITDAre, and Adjusted EBITDAre are supplemental, non-GAAP measures often utilized to evaluate the performance of real estate companies. We define EBITDAas net income or loss computed in accordance with GAAP before the following items: interest expense; income tax expense; depreciation and amortization; and adjustments forunconsolidated joint ventures. The National Association of Real Estate Investment Trusts (“Nareit”) recommends as a best practice that REITs that report an EBITDA performancemeasure also report EBITDAre. We define EBITDAre, consistent with the Nareit definition, as EBITDA, further adjusted for the following: gain on sale of property, net of tax;impairment on depreciated real estate investments; and adjustments for unconsolidated joint ventures.
Adjusted EBITDAre is defined as EBITDAre before the following items: share-based compensation expense; severance; casualty (gains) losses, net; unrealized (gains) losses oninvestments in equity securities; and other income and expenses. EBITDA, EBITDAre, and Adjusted EBITDAre are used as supplemental financial performance measures bymanagement and by external users of our financial statements, such as investors and commercial banks. Set forth below is additional detail on how management uses EBITDA,EBITDAre, and Adjusted EBITDAre as measures of performance.
Our management uses EBITDA, EBITDAre, and Adjusted EBITDAre in a number of ways to assess our condensed consolidated financial and operating performance, and webelieve these measures are helpful to management and external users in identifying trends in our performance. EBITDA, EBITDAre, and Adjusted EBITDAre help managementidentify controllable expenses and make decisions designed to help us meet our current financial goals and optimize our financial performance, while neutralizing the impact ofcapital structure on results. Accordingly, we believe these metrics measure our financial performance based on operational factors that management can impact in the short-term,namely our cost structure and expenses.
We believe that the presentation of EBITDA, EBITDAre, and Adjusted EBITDAre provides information useful to investors in assessing our financial condition and results ofoperations. The GAAP measure most directly comparable to EBITDA, EBITDAre, and Adjusted EBITDAre is net income or loss. EBITDA, EBITDAre, and Adjusted EBITDAreare not used as measures of our liquidity and should not be considered alternatives to net income or loss or any other measure of financial performance presented in accordance withGAAP. Our EBITDA, EBITDAre, and Adjusted EBITDAre may not be comparable to the EBITDA, EBITDAre, and Adjusted EBITDAre of other companies due to the fact that notall companies use the same definitions of EBITDA, EBITDAre, and Adjusted EBITDAre. Accordingly, there can be no assurance that our basis for computing these non-GAAPmeasures is comparable with that of other companies.
59

The following table presents a reconciliation of net income (as determined in accordance with GAAP) to EBITDA, EBITDAre, and Adjusted EBITDAre for each of the periodsindicated:
For the Three Months Ended March 31,
($ in thousands) 2021 2020Net income available to common stockholders $ 57,272 $ 49,854
Net income available to participating securities 95 102 Non-controlling interests 355 320 Interest expense 83,406 84,757 Interest expense in unconsolidated joint ventures 74 — Depreciation and amortization 144,501 135,027 Depreciation and amortization of investments
in unconsolidated joint ventures 104 — EBITDA 285,807 270,060
Gain on sale of property, net of tax (14,484) (15,200)Impairment on depreciated real estate investments 431 2,471 Net gain on sale of investments in unconsolidated joint ventures (336) —
EBITDAre 271,418 257,331 Share-based compensation expense 5,814 4,101 Severance 114 — Casualty (gains) losses, net (75) 656 Unrealized (gains) losses on investments in equity securities 3,140 (34)Other, net (230) (3,680)
Adjusted EBITDAre $ 280,181 $ 258,374
(1) For the three months ended March 31, 2021 and 2020, $1,174 and $833 was recorded in property management expense, respectively, and $4,640 and $3,268 was recorded ingeneral and administrative expense, respectively.
(2) Includes interest income and other miscellaneous income and expenses.
Net Operating Income
NOI is a non-GAAP measure often used to evaluate the performance of real estate companies. We define NOI for an identified population of homes as rental revenues and otherproperty income less property operating and maintenance expense (which consists primarily of property taxes, insurance, HOA fees (when applicable), market-level personnelexpenses, repairs and maintenance, leasing costs, and marketing expense). NOI excludes: interest expense; depreciation and amortization; property management expense; general andadministrative expense; impairment and other; gain on sale of property, net of tax; unrealized gains (losses) on investments in equity securities; other income and expenses; jointventure management fees; and income from investments in unconsolidated joint ventures.
We consider NOI to be a meaningful supplemental financial measure of our performance when considered with the financial statements determined in accordance with GAAP.We believe NOI is helpful to investors in understanding the core performance of our real estate operations. The GAAP measure most directly comparable to NOI is net income orloss. NOI is not used as a measure of liquidity and should not be considered as an alternative to net income or loss or any other measure of financial performance presented inaccordance with GAAP. Our NOI may not be comparable to the NOI of other companies due to the fact that not all companies use the same definition of NOI. Accordingly, there canbe no assurance that our basis for computing this non-GAAP measure is comparable with that of other companies.
We believe that Same Store NOI is also a meaningful supplemental measure of our operating performance for the same reasons as NOI and is further helpful to investors as itprovides a more consistent measurement of our performance across reporting periods by reflecting NOI for homes in our Same Store portfolio.
(1)
(2)
60

The following table presents a reconciliation of net income (as determined in accordance with GAAP) to NOI for our total portfolio and NOI for our Same Store portfolio foreach of the periods indicated:
For the Three Months Ended March 31,
($ in thousands) 2021 2020Net income available to common stockholders $ 57,272 $ 49,854
Net income available to participating securities 95 102 Non-controlling interests 355 320 Interest expense 83,406 84,757 Depreciation and amortization 144,501 135,027 Property management expense 15,842 14,372 General and administrative 16,950 14,228 Impairment and other 356 3,127 Gain on sale of property, net of tax (14,484) (15,200)Unrealized (gains) losses on investments in equity securities 3,140 (34)Other, net (230) (3,680)Joint venture management fees (771) — Income from investments in unconsolidated joint ventures (351) —
NOI (total portfolio) 306,081 282,873 Non-Same Store NOI (25,818) (14,411)
NOI (Same Store portfolio) $ 280,263 $ 268,462
(1) Includes $1,174 and $833 of share-based compensation expense for the three months ended March 31, 2021 and 2020, respectively.(2) Includes $4,640 and $3,268 of share-based compensation expense for the three months ended March 31, 2021 and 2020, respectively.(3) Includes interest income and other miscellaneous income and expenses.(4) The Same Store portfolio totaled 72,926 homes for the three months ended March 31, 2021 and 2020.
Funds from Operations, Core Funds from Operations, and Adjusted Funds from Operations
Funds From Operations (“FFO”), Core FFO, and Adjusted FFO are supplemental, non-GAAP measures often utilized to evaluate the performance of real estate companies. FFOis defined by Nareit as net income or loss (computed in accordance with GAAP) excluding gains or losses from sales of previously depreciated real estate assets, plus depreciation,amortization and impairment of real estate assets, and adjustments for unconsolidated joint ventures.
We believe that FFO is a meaningful supplemental measure of the operating performance of our business because historical cost accounting for real estate assets in accordancewith GAAP assumes that the value of real estate assets diminishes predictably over time, as reflected through depreciation and amortization. Because real estate values havehistorically risen or fallen with market conditions, management considers FFO an appropriate supplemental performance measure as it excludes historical cost depreciation andamortization, impairment on depreciated real estate investments, gains or losses related to sales of previously depreciated homes, as well non-controlling interests, from net income orloss (computed in accordance with GAAP). By excluding depreciation and amortization and gains or losses on sales of real estate, management uses FFO to measure returns on itsinvestments in homes. However, because FFO excludes depreciation and amortization and captures neither the changes in the value of the homes that result from use or marketconditions nor the level of capital expenditures to maintain the operating performance of the homes, all of which have real economic effect and could materially affect our resultsfrom operations, the utility of FFO as a measure of our performance is limited.
(1)
(2)
(3)
(4)
61

Management also believes that FFO, combined with the required GAAP presentations, is useful to investors in providing more meaningful comparisons of the operatingperformance of a company’s real estate between periods or as compared to other companies. The GAAP measure most directly comparable to FFO is net income or loss. FFO is notused as a measure of our liquidity and should not be considered an alternative to net income or loss or any other measure of financial performance presented in accordance withGAAP. Our FFO may not be comparable to the FFO of other companies due to the fact that not all companies use the same definition of FFO. Accordingly, there can be no assurancethat our basis for computing this non-GAAP measures is comparable with that of other companies.
We believe that Core FFO and Adjusted FFO are also meaningful supplemental measures of our operating performance for the same reasons as FFO and are further helpful toinvestors as they provide a more consistent measurement of our performance across reporting periods by removing the impact of certain items that are not comparable from period toperiod. We define Core FFO as FFO adjusted for the following: non-cash interest expense related to amortization of deferred financing costs, loan discounts, and non-cash interestexpense from derivatives; share-based compensation expense; severance expense; unrealized (gains) losses on investments in equity securities; and casualty (gains) losses, net, asapplicable. We define Adjusted FFO as Core FFO less recurring capital expenditures, including adjustments for unconsolidated joint ventures, that are necessary to help preserve thevalue, and maintain the functionality, of our homes. The GAAP measure most directly comparable to Core FFO and Adjusted FFO is net income or loss. Core FFO and AdjustedFFO are not used as measures of our liquidity and should not be considered alternatives to net income or loss or any other measure of financial performance presented in accordancewith GAAP. Our Core FFO and Adjusted FFO may not be comparable to the Core FFO and Adjusted FFO of other companies due to the fact that not all companies use the samedefinition of Core FFO and Adjusted FFO. No adjustments were made to the Core FFO and Adjusted FFO per common share — diluted computations for potential shares of commonstock related to the Convertible Senior Notes. Accordingly, there can be no assurance that our basis for computing this non-GAAP measures is comparable with that of othercompanies.
62

The following table presents a reconciliation of net income (as determined in accordance with GAAP) to FFO, Core FFO, and Adjusted FFO for each of the periods indicated:
For the Three Months Ended March 31,
(in thousands, except shares and per share data) 2021 2020Net income available to common stockholders $ 57,272 $ 49,854
Add (deduct) adjustments from net income to derive FFO:Net income available to participating securities 95 102 Non-controlling interests 355 320 Depreciation and amortization on real estate assets 142,784 133,914 Impairment on depreciated real estate investments 431 2,471 Net gain on sale of previously depreciated investments in real estate (14,484) (15,200)Depreciation and net gain on sale of investments in unconsolidated
joint ventures (232) — FFO 186,221 171,461
Non-cash interest expense related to amortization of deferred financingcosts, loan discounts, and non-cash interest expense from derivatives,including our share from unconsolidated joint ventures 8,618 10,391
Share-based compensation expense 5,814 4,101 Severance expense 114 — Unrealized (gains) losses on investments in equity securities 3,140 (34)Casualty (gains) losses, net (75) 656
Core FFO 203,832 186,575 Recurring capital expenditures, including our share from unconsolidated
joint ventures (24,475) (25,988)Adjusted FFO $ 179,357 $ 160,587
Net income available to common stockholdersWeighted average common shares outstanding — diluted 568,826,104 543,904,420
Net income per common share — diluted $ 0.10 $ 0.09
FFONumerator for FFO per common share — diluted $ 190,565 $ 175,740 Weighted average common shares and OP Units outstanding — diluted 587,813,663 562,886,872
FFO per common share — diluted $ 0.32 $ 0.31
Core FFO and Adjusted FFOWeighted average common shares and OP Units outstanding — diluted 572,667,335 547,786,429
Core FFO per common share — diluted $ 0.36 $ 0.34
AFFO per common share — diluted $ 0.31 $ 0.29
(1) For the three months ended March 31, 2021 and 2020, $1,174 and $833 was recorded in property management expense, respectively, and $4,640 and $3,268 was recorded ingeneral and administrative expense, respectively.
(1)
(2)(3)(4)
(2)(3)(4)
(2)
(2)(3)(4)
(2)(3)(4)
(2)(3)(4)
(2)(3)(4)
(2)(3)(4)
63

(2) For the three months ended March 31, 2021 and 2020, the numerator for FFO per common share — diluted is adjusted for $4,344 and $4,279 of interest expense for the 2022Convertible Notes, respectively, including non-cash amortization of discounts. For the three months ended March 31, 2021 and 2020, the denominator is adjusted for 15,146,328and 15,100,443, respectively, potential shares of common stock issuable upon the conversion of the 2022 Convertible Notes. Additionally, no such adjustments were made toCore FFO and AFFO per common share —diluted.
(3) Incremental shares attributed to non-vested share-based awards totaling 1,450,602 and 1,354,908 shares for the three months ended March 31, 2021 and 2020, respectively, areincluded in weighted average common shares outstanding in the calculation of net income per common share — diluted. For the computations of FFO, Core FFO, and AFFO percommon share — diluted, common share equivalents of 1,828,548 and 1,773,632 for the three months ended March 31, 2021 and 2020, respectively, related to incrementalshares attributed to non-vested share-based awards are included in the denominator.
(4) Vested units of partnership interests in INVH LP (“OP Units”) have been excluded from the computation of net income per common share — diluted for the periods abovebecause all net income attributable to the vested OP Units has been recorded as non-controlling interest and thus excluded from net income available to common stockholders.Weighted average vested OP Units of 3,463,285 for the three months ended March 31, 2021 and 2020 are included in the denominator for the computations of FFO, Core FFO,and AFFO per common share — diluted.
ITEM 3. QUANTITATIVE AND QUALITATIVE DISCLOSURES ABOUT MARKET RISK
Our future income, cash flows, and fair values relevant to financial instruments are dependent upon prevalent market interest rates. Market risk refers to the risk of loss fromadverse changes in interest rates, seasonality, market prices, commodity prices, and inflation. The primary market risks to which we are exposed are interest rate risk and seasonality.We may in the future use derivative financial instruments to manage, or hedge, interest rate risks related to any borrowings we may have. We may enter into such contracts only withmajor financial institutions based on their credit ratings and other factors.
Interest Rate Risk
A primary market risk to which we believe we are exposed is interest rate risk, which may result from many factors, including government monetary and tax policies, domesticand international economic and political considerations, and other factors that are beyond our control. We may incur additional variable rate debt in the future, including additionalamounts that we may borrow under the Credit Facility. In addition, decreases in interest rates may lead to additional competition for the acquisition of single-family homes, whichmay lead to future acquisitions being more costly and resulting in lower yields on single-family homes targeted for acquisition. Significant increases in interest rates may also have anadverse impact on our earnings if we are unable to increase rents on expired leases or acquire single-family homes with rental rates high enough to offset the increase in interest rateson our borrowings.
As of March 31, 2021, our outstanding variable-rate debt was comprised of borrowings on our mortgage loans of $3,824.3 million and Term Loan Facility of $2,500.0 millionfor a combined total of $6,324.3 million. We effectively converted 91.2% of these borrowings to a fixed rate through interest rate swap agreements. Additionally, all borrowings bearinterest at LIBOR plus the applicable spread. Assuming no change in the outstanding balance of our existing debt, the projected effect of a 100 bps increase or decrease in LIBOR onour annual interest expense would be an estimated increase of $5.5 million or $16.7 million, respectively. This estimate considers the impact of our interest rate swap agreements,interest rate cap agreements, and any LIBOR floors or minimum interest rates stated in the agreements of the respective borrowings. A 100 bps decrease in LIBOR results in anegative LIBOR rate and additional interest expense for us. Our variable rate loan agreements contain LIBOR floors, and there is no reciprocal feature in our interest rate swapagreements.
This analysis does not consider the effects of the reduced level of overall economic activity that could exist in such an environment. Further, in the event of a change of suchmagnitude, we may consider taking actions to further mitigate our exposure to the change. However, because of the uncertainty of the specific actions that would be taken and theirpossible effects, the sensitivity analysis assumes no changes in our capital structure.
64

Seasonality
Our business and related operating results have been, and we believe that they will continue to be, impacted by seasonal factors throughout the year. In particular, we haveexperienced higher levels of resident move-outs during the summer months, which impacts both our rental revenues and related turnover costs. Further, our property operating costsare seasonally impacted in certain markets by increases in expenses such as HVAC repairs, costs to re-resident, and landscaping expenses during the summer season.
ITEM 4. CONTROLS AND PROCEDURES
Disclosure Controls and Procedures
We maintain a set of disclosure controls and procedures (as defined in Rules 13a-15(e) and 15d-15(e) under the Exchange Act) designed to ensure that information required to bedisclosed in reports we file or submit under the Exchange Act, is recorded, processed, summarized and reported within the time periods specified in SEC rules and forms and thatsuch information is accumulated and communicated to our management, including our Chief Executive Officer and Chief Financial Officer, as appropriate, to allow timely decisionsregarding required disclosures. The design of any disclosure controls and procedures is based in part upon certain assumptions about the likelihood of future events, and there can beno assurance that any design will succeed in achieving its goals under all potential future conditions. Any controls and procedures, no matter how well designed and operated, canprovide only reasonable, not absolute, assurance of achieving the desired control objectives. Our management, with the participation of our Chief Executive Officer and ChiefFinancial Officer, has evaluated the effectiveness of the design and operation of our disclosure controls and procedures as of March 31, 2021. Based upon that evaluation, our ChiefExecutive Officer and Chief Financial Officer concluded that, as of March 31, 2021, the design and operation of our disclosure controls and procedures were effective to accomplishtheir objectives at the reasonable assurance level.
Changes in Internal Control
There has been no change in our internal control over financial reporting during our most recent fiscal quarter that has materially affected, or is reasonably likely to materiallyaffect, our internal control over financial reporting.
65

PART II
ITEM 1. LEGAL PROCEEDINGS
The Company currently is not subject to any material litigation nor, to management’s knowledge, is any material litigation currently threatened against the Company other thanroutine litigation and administrative proceedings arising in the ordinary course of business.
ITEM 1A. RISK FACTORS
For a discussion of our potential risks or uncertainties, you should carefully read and consider risk factors previously disclosed under Part I. Item 1A. “Risk Factors” of ourAnnual Report on Form 10-K.
ITEM 2. UNREGISTERED SALES OF EQUITY SECURITIES AND USE OF PROCEEDS
None.
ITEM 3. DEFAULTS UPON SENIOR SECURITIES
None.
ITEM 4. MINE SAFETY DISCLOSURES
Not applicable.
ITEM 5. OTHER INFORMATION
None.
66

EXHIBIT INDEX
Exhibitnumber Description
3.1 Charter of Invitation Homes Inc., dated as of February 6, 2017 (incorporated by reference to Exhibit 3.1 to theCompany’s Current Report on Form 8-K (File No. 1-38004) filed on February 6, 2017).
3.2 Amended and Restated Bylaws of Invitation Homes Inc., dated as of February 6, 2017 (incorporated by reference toExhibit 3.2 to the Company’s Current Report on Form 8-K (File No. 1-38004) filed on February 6, 2017).
10.1 Form of Award Notice and Restricted Stock Unit Agreement (2021 LTIP Equity Award) (incorporated by reference toExhibit 10.1 to the Company’s Current Report on Form 8-K (File No. 1-38004) filed on March 4, 2021).†
31.1 Certificate of Dallas B. Tanner, President and Chief Executive Officer, pursuant to Section 302 of the Sarbanes-OxleyAct of 2002.
31.2 Certificate of Ernest M. Freedman, Executive Vice President and Chief Financial Officer, pursuant to Section 302 of theSarbanes-Oxley Act of 2002.
32.1 Certificate of Dallas B. Tanner, President and Chief Executive Officer, pursuant to Section 18 U.S.C. Section 1350, asadopted pursuant to Section 906 of the Sarbanes-Oxley Act of 2002 (furnished herewith).
32.2 Certificate of Ernest M. Freedman, Executive Vice President and Chief Financial Officer, pursuant to Section 18 U.S.C.Section 1350, as adopted pursuant to Section 906 of the Sarbanes-Oxley Act of 2002 (furnished herewith).
101.INS Inline XBRL Instance Document - the instance document does not appear in the Interactive Data File because its XBRLtags are embedded within the Inline XBRL document.
101.SCH Inline XBRL Taxonomy Extension Schema Document.
101.CAL Inline XBRL Taxonomy Extension Calculation Linkbase Document.
101.DEF Inline XBRL Taxonomy Extension Definition Linkbase Document.
101.LAB Inline XBRL Taxonomy Extension Label Linkbase Document.
101.PRE Inline XBRL Taxonomy Extension Presentation Linkbase Document.
104 Cover page Interactive Data File (formatted as Inline XBRL and contained in Exhibit 101).
† This document has been identified as a management contract or compensatory plan or arrangement.
Certain agreements and other documents filed as exhibits to this Quarterly Report on Form 10-Q contain representations and warranties that the parties thereto made to eachother. These representations and warranties have been made solely for the benefit of the other parties to such agreements and may have been qualified by certain information that hasbeen disclosed to the other parties to such agreements and other documents and that may not be reflected in such agreements and other documents. In addition, these representationsand warranties may be intended as a way of allocating risks among parties if the statements contained therein prove to be incorrect, rather than as actual statements of fact.Accordingly, there can be no
67

reliance on any such representations and warranties as characterizations of the actual state of facts. Moreover, information concerning the subject matter of any such representationsand warranties may have changed since the date of such agreements and other documents.
68

SIGNATURES
Pursuant to the requirements of the Securities Act of 1934, the Registrant has duly caused this report to be signed on its behalf by the undersigned, thereunto duly authorized.
Invitation Homes Inc.
By: /s/ Ernest M. Freedman
Name: Ernest M. Freedman
Title: Executive Vice President and ChiefFinancial Officer(Principal Financial Officer)
Date: April 29, 2021
By: /s/ Kimberly K. Norrell
Name: Kimberly K. Norrell
Title: Executive Vice President and ChiefAccounting Officer(Principal Accounting Officer)Date: April 29, 2021
69

Exhibit 31.1
CERTIFICATION OF PRINCIPAL EXECUTIVE OFFICER
I, Dallas B. Tanner, certify that:
1. I have reviewed this Quarterly Report on Form 10-Q of Invitation Homes Inc. for the quarterly period ended March 31, 2021;
2. Based on my knowledge, this report does not contain any untrue statement of a material fact or omit to state a material fact necessary to make the statements made, in light of thecircumstances under which such statements were made, not misleading with respect to the period covered by this report;
3. Based on my knowledge, the financial statements, and other financial information included in this report, fairly present in all material respects the financial condition, results ofoperations and cash flows of the registrant as of, and for, the periods presented in this report;
4. The registrant’s other certifying officer and I are responsible for establishing and maintaining disclosure controls and procedures (as defined in Exchange Act Rules 13a-15(e)and 15d-15(e)) and internal control over financial reporting (as defined in Exchange Act Rules 13a-15(f) and 15d-15(f)) for the registrant and have:
a. Designed such disclosure controls and procedures, or caused such disclosure controls and procedures to be designed under our supervision, to ensure that materialinformation relating to the registrant, including its consolidated subsidiaries, is made known to us by others within those entities, particularly during the period in which thisreport is being prepared;
b. Designed such internal control over financial reporting, or caused such internal control over financial reporting to be designed under our supervision, to provide reasonableassurance regarding the reliability of financial reporting and the preparation of financial statements for external purposes in accordance with generally accepted accountingprinciples;
c. Evaluated the effectiveness of the registrant’s disclosure controls and procedures and presented in this report our conclusions about the effectiveness of the disclosurecontrols and procedures, as of the end of the period covered by this report based on such evaluation; and
d. Disclosed in this report any change in the registrant’s internal control over financial reporting that occurred during the registrant’s most recent fiscal quarter (the registrant’sfourth fiscal quarter in the case of an annual report) that has materially affected, or is reasonably likely to materially affect, the registrant’s internal control over financialreporting; and
5. The registrant’s other certifying officer and I have disclosed, based on our most recent evaluation of internal control over financial reporting, to the registrant’s auditors and theaudit committee of the registrant’s board of directors (or persons performing the equivalent functions):
a. All significant deficiencies and material weaknesses in the design or operation of internal control over financial reporting which are reasonably likely to adversely affect theregistrant’s ability to record, process, summarize and report financial information; and
b. Any fraud, whether or not material, that involves management or other employees who have a significant role in the registrant’s internal control over financial reporting.
By: /s/ Dallas B. Tanner Dallas B. Tanner President and Chief Executive Officer (Principal Executive Officer) April 29, 2021

Exhibit 31.2
CERTIFICATION OF CHIEF FINANCIAL OFFICER
I, Ernest M. Freedman, certify that:
1. I have reviewed this Quarterly Report on Form 10-Q of Invitation Homes Inc. for the quarterly period ended March 31, 2021;
2. Based on my knowledge, this report does not contain any untrue statement of a material fact or omit to state a material fact necessary to make the statements made, in light of thecircumstances under which such statements were made, not misleading with respect to the period covered by this report;
3. Based on my knowledge, the financial statements, and other financial information included in this report, fairly present in all material respects the financial condition, results ofoperations and cash flows of the registrant as of, and for, the periods presented in this report;
4. The registrant’s other certifying officer and I are responsible for establishing and maintaining disclosure controls and procedures (as defined in Exchange Act Rules 13a-15(e)and 15d-15(e)) and internal control over financial reporting (as defined in Exchange Act Rules 13a-15(f) and 15d-15(f)) for the registrant and have:
a. Designed such disclosure controls and procedures, or caused such disclosure controls and procedures to be designed under our supervision, to ensure that materialinformation relating to the registrant, including its consolidated subsidiaries, is made known to us by others within those entities, particularly during the period in which thisreport is being prepared;
b. Designed such internal control over financial reporting, or caused such internal control over financial reporting to be designed under our supervision, to provide reasonableassurance regarding the reliability of financial reporting and the preparation of financial statements for external purposes in accordance with generally accepted accountingprinciples;
c. Evaluated the effectiveness of the registrant’s disclosure controls and procedures and presented in this report our conclusions about the effectiveness of the disclosurecontrols and procedures, as of the end of the period covered by this report based on such evaluation; and
d. Disclosed in this report any change in the registrant’s internal control over financial reporting that occurred during the registrant’s most recent fiscal quarter (the registrant’sfourth fiscal quarter in the case of an annual report) that has materially affected, or is reasonably likely to materially affect, the registrant’s internal control over financialreporting; and
5. The registrant’s other certifying officer and I have disclosed, based on our most recent evaluation of internal control over financial reporting, to the registrant’s auditors and the
audit committee of the registrant’s board of directors (or persons performing the equivalent functions):
a. All significant deficiencies and material weaknesses in the design or operation of internal control over financial reporting which are reasonably likely to adversely affect theregistrant’s ability to record, process, summarize and report financial information; and
b. Any fraud, whether or not material, that involves management or other employees who have a significant role in the registrant’s internal control over financial reporting.
By: /s/ Ernest M. Freedman Ernest M. Freedman Chief Financial Officer (Principal Financial Officer) April 29, 2021

Exhibit 32.1CERTIFICATION PURSUANT TO
18 U.S.C. SECTION 1350,AS ADOPTED PURSUANT TO
SECTION 906 OF THE SARBANES-OXLEYACT OF 2002
In connection with the Quarterly Report on Form 10-Q of Invitation Homes Inc. (the “Company”) for the quarterly period ended March 31, 2021 as filed with the Securities andExchange Commission on the date hereof (the “Report”), I, Dallas B. Tanner, President and Chief Executive Officer of the Company, certify, pursuant to 18 U.S.C. Section 1350, asadopted pursuant to Section 906 of the Sarbanes-Oxley Act of 2002, that:
1. The Report fully complies with the requirements of Section 13(a) or 15(d) of the Securities Exchange Act of 1934; and
2. The information contained in the Report fairly presents, in all material respects, the financial condition and results of operations of the Company.
By: /s/ Dallas B. Tanner Dallas B. Tanner President and Chief Executive Officer (Principal Executive Officer)
April 29, 2021
A signed original of this certification required by Section 906, or other document authenticating, acknowledging, or otherwise adopting the signature that appears in typed formwithin the electronic version of this written statement required by Section 906, has been provided to the Company and will be retained by the Company and furnished to theSecurities and Exchange Commission or its staff upon request. The foregoing certification is being furnished solely pursuant to 18 U.S.C. Section 1350 and is not being filed as partof the Report or as a separate disclosure document.

Exhibit 32.2CERTIFICATION PURSUANT TO
18 U.S.C. SECTION 1350,AS ADOPTED PURSUANT TO
SECTION 906 OF THE SARBANES-OXLEYACT OF 2002
In connection with the Quarterly Report on Form 10-Q of Invitation Homes Inc. (the “Company”) for the quarterly period ended March 31, 2021 as filed with the Securities andExchange Commission on the date hereof (the “Report”), I, Ernest M. Freedman, Chief Financial Officer of the Company, certify, pursuant to 18 U.S.C. Section 1350, as adoptedpursuant to Section 906 of the Sarbanes-Oxley Act of 2002, that:
1. The Report fully complies with the requirements of Section 13(a) or 15(d) of the Securities Exchange Act of 1934; and
2. The information contained in the Report fairly presents, in all material respects, the financial condition and results of operations of the Company.
By: /s/ Ernest M. Freedman Ernest M. Freedman Chief Financial Officer (Principal Financial Officer)
April 29, 2021
A signed original of this certification required by Section 906, or other document authenticating, acknowledging, or otherwise adopting the signature that appears in typed formwithin the electronic version of this written statement required by Section 906, has been provided to the Company and will be retained by the Company and furnished to theSecurities and Exchange Commission or its staff upon request. The foregoing certification is being furnished solely pursuant to 18 U.S.C. Section 1350 and is not being filed as partof the Report or as a separate disclosure document.