Investors as Managers 7 Figure 1.1 The Structure of ... · PDF fileCapital structure 70...
27
General Partners, Private Equity Firm Private Equity Fund 2 Private Equity Fund 1 Portfolio Company 1 Limited Partners • Pension funds • Endowments • Wealthy individuals Creditors • Banks • Bondholders Stakeholders • Managers • Workers • Suppliers • Communities Stakeholders • Managers • Workers • Suppliers • Communities Portfolio Company 2 Fees (2 percent of capital annually) Own investment 1 to 2 percent Equity investment (30 to 40 percent of price) Equity investment (30 to 40 percent of price) Loans (60 to 70 percent of price) Loans (60 to 70 percent of price) Capital gains (asset sales, dividend recapitalizations, resale) Debt service (interest, principal) 20 percent profits (carry) after 8 percent hurdle Advisory/ management fees Advisory/ management fees 98 percent of capital Returns Source: Adapted from Watt 2008. Figure 1.1 The Structure of Private Equity: Firms, Funds, and Portfolio Companies
Transcript of Investors as Managers 7 Figure 1.1 The Structure of ... · PDF fileCapital structure 70...

Investors as Managers 7
vary somewhat in their strategies and incentive structures. It is particu-larly important to recognize that the PE model is multilayered, operat-ing at the level of the private equity firm, the funds that it sponsors, and the portfolio companies that the funds buy (see figure 1.1). At the firm level, private equity is typically structured as a limited liability partner-ship that in its operations resembles a diversified conglomerate but with centralized control of legally separate portfolio companies; this structure reduces the legal liability of the firm and its funds for the companies in the funds’ portfolios. With the portfolio companies of most private equity
General Partners, Private Equity Firm
PrivateEquityFund 2
PrivateEquityFund 1
PortfolioCompany 1
LimitedPartners
• Pension funds• Endowments• Wealthy
individuals
Creditors• Banks• Bondholders
Stakeholders• Managers• Workers• Suppliers• Communities
Stakeholders• Managers• Workers• Suppliers• Communities
PortfolioCompany 2
Fees(2 percent ofcapitalannually)
Own investment1 to 2 percent
Equity investment(30 to 40 percent of price)
Equity investment(30 to 40 percent of price)
Loans(60 to 70 percent of price)
Loans(60 to 70 percent of price)
Capital gains(asset sales,
dividendrecapitalizations,
resale)
Debt service(interest,principal)
20 percent profits(carry) after 8 percent hurdle
Advisory/managementfees
Advisory/managementfees
98 percentof capital
Returns
Source: Adapted from Watt 2008.
Figure 1.1 The Structure of Private Equity: Firms, Funds, and Portfolio Companies
13583_01_Ch01-3rdPgs.indd 7 3/3/14 1:12 PM

4 Private Equity at Work
take control of companies, appoint boards of directors, hire and fire top executives, and set the direction of business strategy and employment policies. The general partners and their legal team often negotiate directly with unions in collective bargaining or demand concessions in wages and benefits as a condition of taking over the company. Unlike public compa-nies, however, they are not held legally or publicly accountable for many of the outcomes of their decisions, a pattern we document throughout the book. When something goes wrong in a private equity–owned company, the negative reputational effect typically falls on the company itself, as the private equity owner is behind the scenes with little visibility.
The fundamental differences between private equity–owned and pub-lic corporations are summarized in table 1.1. When private equity firms take over companies, moral hazard problems often ensue because the general partners in these firms, in a position to make greater use of other people’s money than their own, engage in high-risk behaviors. These include financial engineering strategies such as the substantial use of debt, junk bonds, and other high-risk financial tools; asset sales for profit; and dividend recapitalizations. They also charge large fees not available to public corporations, are taxed at the lower capital gains rate rather than the corporate tax rate, and face little legal oversight—leading to low trans-parency and accountability.
In sum, the private equity business model represents a test of the notion that pursuing shareholder value aggressively is a good thing by putting the shareholders even more in charge. The argument is that leav-ing executives in charge of decisions about how companies should be run
Table 1.1 Differences Between Private Equity–Owned and Public Corporations
Dimension Private EquityPublic
Corporations
Risk-taking High Low“Moral hazard” High LowerCapital structure 70 percent debt,
30 percent equity30 percent debt,
70 percent equityUse of junk bonds Considerable LowAsset sales for profits Higher LowerDividend recapitalizations Frequent RareFees Key part of earnings No advisory feesTaxes Capital gains rate Corporate rateLegal oversight Low HighTransparency Low HigherAccountability Low Higher
Source: Authors’ compilation.
13583_01_Ch01-3rdPgs.indd 4 3/3/14 1:12 PM
Institutional Change and the Emergence of Private Equity 35
and the Washington State Investment Board.99 Access to workers’ capital in pension funds enabled PE firms to expand the scale and scope of their operations and to become global in their investment activities. Both the number and transaction value of leveraged buyouts by PE firms increased rapidly between 2002 and 2007 before the bubble economy burst.
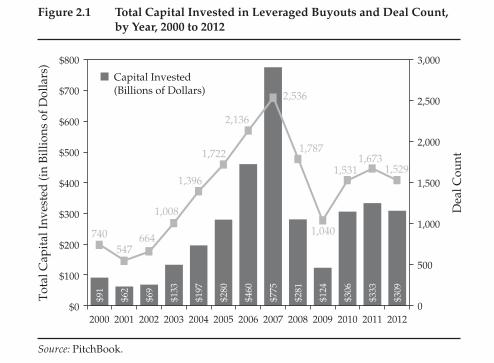
The marked expansion of private equity investments is illustrated in figure 2.1, which plots the number of PE-leveraged buyouts and their total capital value, by year, from 2000 to 2012.100 In 2002, for example, PE firms invested $69 billion in U.S. LBOs of 664 portfolio companies. The annual value of PE investments in LBOs doubled by 2003, and more than doubled again by 2005. PE LBOs continued to accelerate during the 2006 to 2007 boom years. Between 2005 and 2007, the number of deals rose by almost 50 percent, but the capital value of those deals rose by 175 percent, reflecting the fact that the average size of transactions increased and megadeals became more popular. These trends are broadly consistent with other data and estimates.101 And nine of the top ten largest LBOs in history (see table 2.1) took place in the 2007 to 2008 boom period.
When the bubble burst, the financial crisis took a toll on private equity investments: the annual number of deals and capital invested in those deals fell after 2007 and reached their low points in 2009 before begin-ning to recover. Total capital invested in LBOs in 2009 fell below its 2003 level. A strong fourth quarter in 2010 for LBOs raised hopes of a robust
Figure 2.1 Total Capital Invested in Leveraged Buyouts and Deal Count, by Year, 2000 to 2012
$91
$62
$69
$133
$197
$280
$460
$775
$281
$124
$306
$333
$309
740547
664
1,008
1,396
1,722
2,136
2,536
1,787
1,040
1,5311,673
1,529
0
500
1,000
1,500
2,000
2,500
3,000
$0
$100
$200
$300
$400
$500
$600
$700
$800
Capital Invested (Billions of Dollars)
Source: PitchBook.
Tot
al C
apit
al In
vest
ed (i
n B
illio
ns o
f Dol
lars
)
Dea
l Cou
nt
2000 2001 2002 2003 2004 2005 2006 2007 2008 2009 2010 2011 2012
13583_02_Ch02-3rdPgs.indd 35 3/3/14 1:12 PM
Institutional Change and the Emergence of Private Equity 37
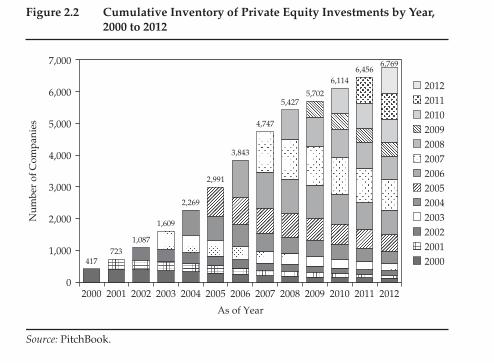
Cumulatively, private equity firms invested a total of about $3.4 trillion in leveraged buyouts of approximately 18,300 companies between 2000 and 2012. (These figures represent the sum of annual PE investments as shown in figure 1.1.) About two-thirds of these companies (11,500) were unique sales, while the remaining one-third were companies bought by one PE firm from another (secondary buyouts). Estimates of the num-ber of employees who have worked or currently work for companies owned by private equity are more difficult to come by. For the period 2000 to 2010, private equity’s industry association, PEGCC, estimated that PE-owned companies employed a total of about 7.5 million people.102
Our data also show that in 2012 the cumulative PE-owned inventory of companies was roughly 6,700 (figure 2.2). These are companies that PE firms have purchased since 2000, but had not yet sold by the end of 2012. Figure 2.2 also shows the percentage of PE-owned companies in 2012 by the year in which they were acquired. For example, roughly one-third of the companies purchased between 2000 and 2006 were still owned by PE firms in 2012. This is a pattern we discuss more fully in chapter 4 regard-ing the postcrisis period. The actual capital value of these companies is more difficult to assess. One estimate of the total value of the companies held in 2011 is about $1.3 trillion.103
Buyout activity also spread beyond manufacturing and retail to other industries in the 2000s. The two largest targets for private equity buyouts
Figure 2.2 Cumulative Inventory of Private Equity Investments by Year, 2000 to 2012
Source: PitchBook.
417723
1,087
1,609
2,269
2,991
3,843
4,747
5,4275,702
6,1146,456
6,769
0
1,000
2,000
3,000
4,000
5,000
6,000
7,000
2000 2001 2002 2003 2004 2005 2006 2007 2008 2009 2010 2011 2012
As of Year
20122011201020092008200720062005200420032002
20002001
Num
ber
of C
ompa
nies
13583_02_Ch02-3rdPgs.indd 37 3/3/14 1:12 PM

38 Private Equity at Work
were business products and services and consumer products and ser-vices, representing 36 and 25 percent of total capital invested, respec-tively. Figure 2.3 shows the percentage of total investments, by sector, for 2000 to 2012. Investments in energy, financial services, and information technology companies represented between 9 and 13 percent of invest-ments each, while health care represented 6 percent. These percentages do not differ substantially if we examine the total number of companies purchased rather than their capital value.
The patterns of investment did change somewhat over the course of the 2000s. Traditional investments in business products and services and in consumer products and services represented about 62 percent of investments from 2000 to 2005, but fell to 48 percent in the post-crisis years of 2008 to 2012. Investments in four other sectors—energy, financial services, health care, and information technology—became increasingly important. Together, they accounted for 30 percent of capital invested in leveraged buyouts prior to 2006, but rose to 46 per-cent during the boom years and maintained that level in the postcrisis period. Notably, average annual investments in financial services rose from 4 percent prior to the boom to 11 percent in the postcrisis period. Comparable figures for the energy sector are 6 percent and 10 percent, and for health care 8 percent and 13 percent.104
Figure 2.3 Total Capital Invested, by Sector, 2000 to 2012
Source: PitchBook.
Business Productsand Services
26%
Consumer Productsand Services
26%Energy9%
FinancialServices
9%
Health Care11%
InformationTechnology
13%
Materials andResources
6%
13583_02_Ch02-3rdPgs.indd 38 3/3/14 1:12 PM
Institutional Change and the Emergence of Private Equity 39
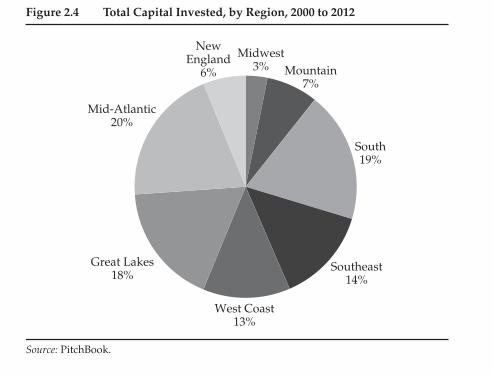
Private equity investment has also been dispersed by region, but some regions have received very little PE investment, as shown in figure 2.4.105 The largest share of capital investment occurred in three regions: the Mid-Atlantic (20 percent), the South (19 percent), and the Great Lakes (18 percent). The West Coast and the Southeast each attracted 13 and 14 percent of all PE capital, respectively. Together, New England, the Midwest, and the Mountain states garnered only 16 percent of all PE invest-ments during the period. This regional distribution of investments ebbed and flowed somewhat over the period but overall was relatively stable.
Taken together, the data suggest that private equity is now well rep-resented in all sectors of the U.S. economy and in most regions. Its influ-ence, as well as the example of its business model, is felt in nearly every industry and most regions of the country.
ConclusionThe last three decades have witnessed a fundamental shift in the nature of the U.S. economy as the power and influence of the financial industry has increasingly dominated the post-industrial restructuring of economic activity. Firms that used to make money by producing goods and services are increasingly used as investment vehicles—assets in the portfolio of a
Figure 2.4 Total Capital Invested, by Region, 2000 to 2012
Source: PitchBook.
Midwest3% Mountain
7%
South19%
Southeast14%
West Coast13%
Great Lakes18%
Mid-Atlantic20%
NewEngland
6%
13583_02_Ch02-3rdPgs.indd 39 3/3/14 1:12 PM

36 Private Equity at Work
Table 2.1 Top Ten Largest Buyouts in History, as of 2012
Company
Deal Value (Billions of U.S.
Dollars) PE Investors Date Industry
TXU (Energy Futures Holding)
$43.80 KKR, Goldman Sachs Capital Partners, TPG
2007 Utilities/energy
Equity Office Properties Trust
38.90 Blackstone Real Estate Partners LP
2007 Real estate
HCA, Inc. 32.70 Bain Capital, Inc., KKR, Merrill Lynch Global Private Equity
2007 Health care
RJR Nabisco, Inc. 31.10 KKR 1988 Food/tobaccoAlltel Corporation 27.87 TPG, Goldman Sachs
Capital Partners LP2007 Telecom
First Data Corporation
27.73 KKR 2007 Finance/ technology
Harrah’s Entertainment, Inc.
27.40 Apollo Management LP, TPG
2008 Entertainment
Hilton Hotels, Inc. 25.80 Blackstone Group LP 2007 LodgingClear Channel
Communications, Inc.
24.86 Bain Capital, Inc., Thomas H. Lee Partners
2008 Media
Kinder Morgan, Inc. 21.56 Goldman Sachs Capital Partners LP, AIG Global Asset Management, Riverstone Holdings, and Carlyle Group, Inc.
2007 Energy
Source: Pensions&Investments, “Largest Leveraged Buyouts,” January 16, 2013. Available at: http://www.pionline.com/gallery/20130116/SLIDESHOW2/116009999/1 (accessed February 13, 2014).
recovery, but these hopes were disappointed as PE activity failed to maintain this pace, slowing further in the first half of 2012.
Private equity investors also branched out beyond leveraged buy-outs in the 2000s, making investments in publicly traded companies (private investments in public equities, or PIPEs) and taking minority positions in various types of enterprises. This activity became more prominent in the postcrisis period as attractive opportunities for LBOs became more difficult to identify. Given our focus on LBOs and the portfolio companies that private equity controls, however, our data analysis does not include PE investments as minority owners.
13583_02_Ch02-3rdPgs.indd 36 3/3/14 1:12 PM

96 Private Equity at Work
The boom-bust cycle in private equity was particularly evident during the financial crisis. As we saw in chapter 2, total capital invested by private equity in leveraged buyouts of U.S. companies peaked in 2007, as did the number of deals closed, and capital invested climbed more rapidly than deal activity as the number of megadeals increased. With the onset of the recession and the financial crisis, however, PE deal-making collapsed. Total capital invested in leveraged buyouts of U.S. companies declined by two-thirds between the fourth quarter of 2007 and the first quarter of 2008, and it reached its low point in the second quarter of 2009. New PE investments fell from $245 billion to just $20 billion between the fourth quarter of 2007 and the second quarter of 2009 (see figure 4.1). The number of LBO deals also fell over this period. Deals closed and capital invested in buyouts of companies recovered somewhat in 2010, reaching postcrisis peaks in the fourth quarter of that year before slowing somewhat in 2011. Both capital invested and the number of deals declined further in the first three quarters of 2012, with the amount invested falling more rapidly than the number of deals closed as the focus of many PE firms turned to smaller “midmarket” deals.
The increased emphasis in the postcrisis period on midmarket deals has meant that the share of megadeals in which large, publicly traded companies
Capital Invested
Source: PitchBook.
Tot
al C
apit
al In
vest
ed (i
n B
illio
ns o
f Dol
lars
)
Dea
l Cou
nt
$167
$172
$190
$245
$100
$55
$92
$35
$42
$20
$21
$41
$62
$68
$62
$114
$81
$73
$84
$97
$63
$67
$61
$118
634
666 639597
591
416
465
315 263
243 244
290
366
330338
497
397
411
405
460
386
352 346
445
0
100
200
300
400
500
600
700
$0
$50
$100
$150
$200
$250
$300
1Q 2Q 3Q 4Q 1Q 2Q 3Q 4Q 1Q 2Q 3Q 4Q 1Q 2Q 3Q 4Q 1Q 2Q 3Q 4Q 1Q 2Q 3Q 4Q
2007 2008 2009 2010 2011 2012
Deals Closed
Figure 4.1 Total Capital Invested in Leveraged Buyouts and Deal Count, Quarterly, 2007 Q1 to 2012 Q4
13583_04_Ch04_3rdPgs.indd 96 3/3/14 1:12 PM

The Effects of the Financial Crisis 105
committed by limited partners. From 2005 to 2009, unrealized capital rep-resented the highest proportion. That is, private equity firms invested heavily in this period, but had not yet exited those investments. As is typical of newer funds, from 2010 to 2012, dry powder was the high-est category. PE firms anticipated exiting investments made in 2007 or earlier at least by 2012, but that did not happen. Instead, the proportions of unrealized gains and dry powder in relation to capital committed to private equity increased.
Exiting mature investments was also more challenging in the postcrisis years (2008 through 2012) because portfolio companies—notably those in cyclical industries—performed poorly during the recession. For many, their value fell below or remained near their original purchase price, and their PE owners were reluctant to sell under those conditions. PE general partners usually cannot collect their share of the funds’ profits unless a “hurdle” rate of 8 percent return is achieved. With many investments still underwater in 2011 and 2012, PE firms had an incentive to hold on to the companies in their portfolios. The cofounder of the PE firm TPG, David Bonderman, suggested that if things did not improve, hurdle rates might need to be eliminated and investors might need to ratchet down their expectation that PE investments would yield 20 percent returns.41
In some cases during those years, PE owners were willing to sell the portfolio company but strategic buyers, usually publicly traded compa-nies, had difficulty obtaining debt financing to carry out the acquisition.
Source: Preqin, reprinted from Bain & Company, Inc., Global Private Equity Report 2013.Note: DPI is the ratio of distributed to paid-in capital.
Perc
enta
ge
100
0
20
40
60
80
2000 2001 2002 2003 2004 2005 2006
Vintage Year
Percentage of Funds with DPI Less than One
2007 2008 2009 2010 2011 2012
13 12 31 42 48 71 96 92 97 90 98 100 100
Realized Capital Value Unrealized Capital Value Uncommitted Capital
Figure 4.2 Relative Mix of Realized, Unrealized, and Uncommitted Capital, 2000 to 2012
13583_04_Ch04_3rdPgs.indd 105 3/3/14 1:12 PM

118 Private Equity at Work
from the United States and the United Kingdom and toward emerging markets—especially China, India, and Brazil. These arenas are expected to provide ongoing opportunities for private equity investments in the coming years.
Attempts at Strategic and Operational Improvements
In the boom years 2003 through 2007, private equity funds could rely on a combination of factors to generate high returns. GDP growth provided an expanding market for the products and services of the portfolio firms they acquired. A buoyant stock market with rising price-to-earnings mul-
Table 4.1 U.S. Private Equity Firms with Assets Under Management Valued at More Than $20 Billion, 2013
Investor NameActive
Investments
Investments in the Last Five Years
Assets Under Management (Millions of
Dollars)
Blackstone Group (BX) 172 202 $248,000Carlyle Group (CG) 255 220 180,400Apollo Global Management (APO) 66 82 113,100Kohlberg Kravis Roberts (KKR) 120 173 90,200Goldman Sachs Capital Partners 119 122 76,217Oaktree Capital Management 80 100 74,900Bain Capital 69 110 70,000GTCR Golder Rauner 39 75 69,732CVC Capital Partners 41 51 68,034TPG Capital 100 129 60,551Apax Partners 62 96 46,619Warburg Pincus 144 116 39,370Resource Capital Funds 17 12 34,000Lone Star Funds 15 17 30,830Kelso & Co. 24 35 27,000Providence Equity Partners 54 66 27,000Silver Lake Partners 29 61 25,962Riverstone Holdings 67 66 23,445Cerberus Capital Management 57 42 23,000Lexington Partners 5 9 22,500New MainStream Capital 1 2 22,000First Reserve 51 41 20,897Hellman & Friedman 26 54 20,800Black Canyon Capital 6 8 20,000Centerbridge Partners 23 40 20,000Welsh, Carson, Anderson & Stowe 55 47 20,000
Source: PitchBook.
13583_04_Ch04_3rdPgs.indd 118 3/3/14 1:12 PM

The Middle Market 133
Table 5.1 Total Number and Value of U.S. Leveraged Buyouts, by Market Segment, 2000 to 2012
Market SegmentTotal Number
of LBOsPercentage Deal Count
Total Capital Invested
Average Percentage
Capital Invested
$0 to $25 million 5,639 32% $56.67 2%$25 million to
$100 million5,701 32 287.70 11
$100 million to $500 million
5,307 28 1,105.72 36
$500 million to $1 billion
1,309 6 852.59 25
$1 billion or more 352 2 1,122.75 25Total 18,308 100 3,425.42 100
Source: PitchBook.
Middle-Market Capital Invested
Source: PitchBook.
Mid
dle
-Mar
ket C
apit
al In
vest
ed(B
illio
ns o
f Dol
lars
)
Dea
l Flo
w
Middle-Market Deal Flow
$84
$50
$58
$103
$147
$190
$273
$351
$173
$86
$244
$254
$230
521
327 408
648
945
1,149
1,438
1,792
1,129
628
1,051
1,190 1,092
0
200
400
600
800
1,000
1,200
1,400
1,600
1,800
2,000
$0
$50
$100
$150
$200
$250
$300
$350
$400
2000 2001 2002 2003 2004 2005 2006
Year2007 2008 2009 2010 2011 2012
Figure 5.1 Middle-Market Leveraged Buyout Deal Flow, by Year, 2000 to 2012
13583_05_Ch05_3rdPgs.indd 133 3/3/14 1:12 PM

134 Private Equity at Work
capital invested. At the other end of the spectrum, buyouts of companies valued at $500 million or more represented only 8 percent of deal-making activity but 50 percent of all capital invested by PE firms.
Figures 5.2 and 5.3 show the patterns of deal-making and capital invest-ment in different market segments on an annual basis. Activity in the bubble years of 2006 and 2007 was heightened in every market segment, in terms of both the number and value of leveraged buyouts. The relative propor-tion of investments, however, shifted from deals of less than $500 million to deals of higher value. Subsequently, in the immediate postcrisis years, the lower market segments recovered, while deal-making above $500 million or so fell off markedly and did not recover until later.
Some analysts have pointed out that deal-making in the postcrisis years shifted considerably to the middle market because megadeals were more difficult to complete. But it is important to look more closely at different segments of the middle market. In terms of total capital invested, deals of less than $500 million represented 59 percent of private equity invest-ments before the bubble years, fell to 32 percent during the bubble (2006 to 2007), and rose to an average of only 45 percent of activity between 2008 and 2012. Large deals and megadeals averaged 68 percent of the value of LBOs during the bubble years and 55 percent of the activity from 2008 to 2012. Thus, the majority of capital investment in the postcrisis
Source: PitchBook.
Num
ber
of L
BO
s
0
500
1,000
1,500
2,000
2,500
3,000
2000 2001 2002 2003 2004 2005 2006
Year2007 2008 2009 2010 2011 2012
$0 to $25 Million$25 Million to $100 Million$100 Million to $500 Million$500 Million to $1 Billion$1 Billion or More
Figure 5.2 Leveraged Buyouts by Market Segment, 2000 to 2012
13583_05_Ch05_3rdPgs.indd 134 3/3/14 1:12 PM

The Middle Market 135
years has continued to be in large enterprises. What has changed since the crisis is the relative distribution of capital invested in large deals as opposed to megadeals. In the bubble years, megadeals equaled about 47 percent of the value of all deals, but that fell to 26 percent in the period 2008 to 2012. Because megadeals were more difficult to negotiate after the crisis, large PE firms shifted some of their activity to the $500 million to $1 billion market: the percentage of capital invested in this segment rose from 21 percent of all activity in the bubble years to 29 percent since 2008.
In 2013 large deals continued to recover, while megadeals remained far below their bubble-year peaks, although they have not disappeared. A total of 489 PE deals closed in the third quarter of 2013, of which 70 percent—or about 325—were leveraged buyouts; 10 were deals of $1 billion or more.14
Changes in market conditions over the decade also affected the pattern of exit activity to some extent. For all deals for which exit data are avail-able between 2003 and 2012, over 50 percent of exits occurred through corporate acquisitions, while some 37 percent occurred via secondary buyouts and only 9 percent via IPOs. The patterns changed somewhat between the pre- and post-crisis periods, with a rise in the relative use of corporate acquisitions and secondary buyouts and a decline in IPOs (from 13 percent before the crisis to 7 percent afterward).
Source: PitchBook.
Cap
ital
Inve
sted
in L
BO
s(M
illio
ns o
f Dol
lars
)
$0
$100
$200
$300
$400
$500
$600
$700
$800
$900
2000 2001 2002 2003 2004 2005 2006Year
2007 2008 2009 2010 2011 2012
$0 to $25 Million$25 Million to $100 Million$100 Million to $500 Million$500 Million to $1 Billion$1 Billion or More
Figure 5.3 Capital Invested in Leveraged Buyouts by Market Segment, 2000 to 2012
13583_05_Ch05_3rdPgs.indd 135 3/3/14 1:12 PM

136 Private Equity at Work
Exit activity by market segment is shown in figure 5.4.15 In each seg-ment, corporate acquisitions represent the largest share of exits, followed by secondary buyouts and then IPOs. IPOs were the most successful for investments in the core middle market ($100 million to $500 mil-lion), followed by the lower middle market ($25 million to $100 million). Comparing exit activity in the pre- and post-crisis periods, it was lower in all market segments after the crisis—except, surprisingly, in the large- and mega-market segments. There, corporate acquisitions increased con-siderably, perhaps because large corporations had cash on hand to invest in proven enterprises but were unwilling to expand their own businesses given market uncertainties.
Pricing and Financing Deals in the Middle Market
The variation by market segment in the pricing and financing of deals is important because it influences the business models pursued by private equity firms in their portfolio companies. The pricing and financing of deals differs by segment in two primary respects. The first is the price paid to acquire the portfolio company, as measured by the multiple of the company’s earnings (EBITDA). Companies in the small and lower middle market generally are purchased at a lower multiple of the com-pany’s earnings compared to larger corporations. Second, the proportion of debt that PE firms lever on the companies they buy is lower for smaller
Figure 5.4 Exits by Market Segment, Pre- and Post-Crisis, 2003 to 2012
Source: PitchBook.
0
100
200
300
400
500
600
700
2003 to2007
2008 to2012
2003 to2007
2008 to2012
2003 to2007
2008 to2012
2003 to2007
2008 to2012
Under$25 Million
$25 Million to$100 Million
$100 Million to$500 Million
$500 Millionor More
Initial Public OfferingCorporate AcquisitionSecondary Buyout
Num
ber
of E
xits
13583_05_Ch05_3rdPgs.indd 136 3/3/14 1:12 PM

The Middle Market 137
companies than for larger ones. Both of these factors imply that large- and mega-market acquisitions are under more financial pressure to recoup their investment, since the debt load is greater and the higher price paid to purchase a company increases the difficulty of exiting the investment at a profit. These differences in financial factors shape, to some extent, the relative importance of operational versus financial strategies for making money in mega- versus middle-market deals.
The cost of acquiring the portfolio company—the multiple of a com-pany’s earnings (EBITDA)—depends on market conditions as well as the valuation of the company. Despite the fact that earnings multiples and the prices paid to buy portfolio companies reflect the volatility of the market, the multiples for large acquisitions are consistently higher than those for smaller companies. This pattern is illustrated in figure 5.5. First, for each market segment, the overall multiples paid to purchase companies were higher in the precrisis years of market growth compared to the postcrisis years. And second, the multiples paid on average increased by market segment. In the precrisis period, they averaged 5.40 times EBITDA for deals valued at under $100 million, 8.70 times in the core middle market ($100 million to $500 million), and 11.95 times for mega-market deals. In the postcrisis period, the multiples dropped in each segment, but the differ-ences across segments remained similar: 4.80 times EBITDA for deals under
Figure 5.5 Debt and Equity Multiples by Market Segment, Pre- and Post-Crisis
Source: PitchBook.
Equity/EBITDADebt/EBITDAValuation/EBITDA
2.45x 2.40x 3.28x 3.77x 3.62x 4.00x
2.95x 2.40x
5.42x 4.53x
8.33x6.00x
5.40x4.80x
8.70x 8.30x
11.95x
10.00x
x
2x
4x
6x
8x
10x
12x
14x
2003 to2007
2008 to2012
2003 to2007
2008 to2012
2003 to2007
2008 to2012
Under$100 Million
$100 Million to$500 Million
$500 Millionor More
Mul
tipl
es
13583_05_Ch05_3rdPgs.indd 137 3/3/14 1:12 PM

The Middle Market 133
Table 5.1 Total Number and Value of U.S. Leveraged Buyouts, by Market Segment, 2000 to 2012
Market SegmentTotal Number
of LBOsPercentage Deal Count
Total Capital Invested
Average Percentage
Capital Invested
$0 to $25 million 5,639 32% $56.67 2%$25 million to
$100 million5,701 32 287.70 11
$100 million to $500 million
5,307 28 1,105.72 36
$500 million to $1 billion
1,309 6 852.59 25
$1 billion or more 352 2 1,122.75 25Total 18,308 100 3,425.42 100
Source: PitchBook.
Middle-Market Capital Invested
Source: PitchBook.
Mid
dle
-Mar
ket C
apit
al In
vest
ed(B
illio
ns o
f Dol
lars
)
Dea
l Flo
w
Middle-Market Deal Flow
$84
$50
$58
$103
$147
$190
$273
$351
$173
$86
$244
$254
$230
521
327 408
648
945
1,149
1,438
1,792
1,129
628
1,051
1,190 1,092
0
200
400
600
800
1,000
1,200
1,400
1,600
1,800
2,000
$0
$50
$100
$150
$200
$250
$300
$350
$400
2000 2001 2002 2003 2004 2005 2006
Year2007 2008 2009 2010 2011 2012
Figure 5.1 Middle-Market Leveraged Buyout Deal Flow, by Year, 2000 to 2012
13583_05_Ch05_3rdPgs.indd 133 3/3/14 1:12 PM

How Well Do Private Equity Funds Perform? 169
of the distribution to paid-in capital is called the DPI. In this example, where the distribution equals $200 million ($150 million + $50 million) and the paid-in capital equals $100 million, DPI equals 200/100, or 2. The DPI is the investment multiple.
In this case, the procedure for computing the internal rate of return yields an annualized IRR of 68 percent. But that may not be the actual return that investors in the fund receive at the end of the third year when the fund is liquidated. In order for the partners in the fund to actually receive that high IRR, the $150 million distribution to the fund at the end of the first year would have to be reinvested in something that yields a 68 percent return in each of years two and three so that it grows to $420 million by the end of year three. If it is not feasible to get $150 million to grow to $420 million in just two years, then the actual rate of return received by investors in Fund X will be less than the annualized IRR of 68 percent. The spread between the IRR and the actual rate of return that investors in the fund receive will depend on the interest rate at which the money received by the PE fund and distributed to its limited partners can be reinvested.
Table 6.1 presents hypothetical cash flow data (in millions) for four funds—Fund X, Fund Y1, Fund Y2, and Fund Z. Private equity funds report investment multiples as well as IRR. It can be useful to know whether a fund doubled its investment (Funds X, Y1, and Y2) or returned less than was initially invested (Fund Z). But it is also important to know whether this occurred in three years (Fund X) or eight years (Funds Y1
Table 6.1 Hypothetical Net Cash Flow Data from Funds X, Y1, Y2, and Z
Year Fund X Fund Y1 Fund Y2 Fund Z Fund XYZ
0 -100 -100 -100 -100 -4001 150 0 0 0 1502 0 0 0 0 03 50 0 0 0 504 0 0 0 0 05 0 100 100 50 2506 0 0 0 0 07 0 0 0 0 08 0 100 100 0 2009 0 0 0 0 010 0 0 0 0 011 0 0 0 0 012 0 0 0 10 10Internal rate of return 68% 11% 11% -8% 12%Multiple (distribution
to paid-in capital)2.00 2.00 2.00 0.60 1.28
Source: Phalippou 2008, 18.
13583_06_Ch06_3rdPgs.indd 169 3/3/14 1:12 PM

PE-Owned Company PE Owners Unions
Company Economic Condition
Equity Invested Deal Value
Deal Year
Labor Relations
PE Outcomes, Returns
Company and Labor Outcomes
Spirit AeroSystems (Aerospace)
Onex Partners
IAM, SPEEA
Strong $464 $1,500 2005 Constructive 2007, 2001 IPOs yield $2.5 billion in returns; Onex still majority owner
2005–2012: Unions accept cuts in jobs wages and retiree benefits; com-pany IPO in 2006 yields large bonuses for work-ers; strong company per-formance; job growth; stable union relations
Five US Steel Legacy Companies (20 percent of industry)
Wilbur Ross & Co.
USWA Bankrupt $321 $1,285 2001–2003
Constructive Sold to Mittal Steel for $4.5 billion
Union drives work reorganization and accepts wage and job cuts with contract pro-tections; large cuts in managerial workforce; productivity gains immense; major cuts in retiree pensions of $4.5 billion, equal to pri-vate equity returns
(Appendix continues on p. 236.)
Table 7A.1 Case Summaries of Private Equity Labor Relations Strategies and Outcomes
13583_07_Ch07_3rdP
gs.indd 2353/3/14 1:12 P
M

PE-Owned Company PE Owners Unions
Company Economic Condition
Equity Invested Deal Value
Deal Year
Labor Relations
PE Outcomes, Returns
Company and Labor Outcomes
Dana Corporation (Auto supply)
Centerbridge UAW, USWA
Bankrupt $500 Undisclosed 2008 Constructive 2008; Company emerges from bankruptcy and remains profit-able thereafter
Union contract stipulates limits on debt liabilities to $1.5 billion, which saves company during recession; union agrees to reduced wages and benefits; retirees covered by new health and retire-ment fund
Delphi Corporation (Auto supply)
John Paulson & Co., Silver Point Capital
UAW Bankrupt Undisclosed Undisclosed 2009 Strongly anti-union
2011 IPO yields profit of 3,000 percent
25 of 29 plants shut down; 25,000 union jobs offshored; taxpayers pay $12.9 billion in subsidies
Hawker Beechcraft (Aerospace)
Goldman Sachs Capital, Onex Partners
IAM Strong Undisclosed $3,300 2007 Union marginaliza-tion
2012: Goldman Sachs writes down the com-pany’s value by 85 percent
3,500 workers (36 per-cent of total) lose jobs; union negotiates wage and benefit concessions; 2012 bankruptcy, with $2.6 billion debt; PBGC takes over pension plans
Archway & Mother’s Cookies (Food processing)
Catterton Partners
ICBWU Bankrupt Undisclosed Undisclosed 2005 Strongly anti-union
Management engages in fraud; company acquired by stra-tegic investor Lance, Inc. for $30 million
Substantial cost-cutting; product quality declines; 2008 bankruptcy; plants shutdown, 400 workers lose jobs; workers file lawsuit for violation of WARN Act; new owner re-opens as non-union plant with 60 workers.
Stella D’oro (Food processing)
Brynwood Partners
ICBWU Moderate Undisclosed $17.5 2006 Strongly anti-union
Company acquired by stra-tegic investor Lance, Inc. for $17.5 million
Brynwood found guilty of unfair labor practices in contract negotia-tions, shuts down plant in 2009; 134 workers lose jobs
Ormet Aluminum
Matlin Patterson
USWA Bankrupt Undisclosed $30.0 2004 Anti-union to constructive
2005 out of bankruptcy; 2013 back in bankruptcy; sold to Wayzata for $130 million
19-month union cam-paign leads to 2006 labor contract with decent wages and benefits for 1,500 workers; PGBC assumes $260 million in unfunded pension liabilities
US Foods (Food distribution)
Clayton, Dubilier, Rice; KKR; National City Equity Partners
Teamsters Strong Undisclosed $7,100 2007 Anti-union to constructive
2013: High debt of $4.6 billion viewed as high risk profile by S&P
Work intensification, job loss in union sites; expansion in non-union facilities
Table 7A.1 Continued
13583_07_Ch07_3rdP
gs.indd 2363/3/14 1:12 P
M

PE-Owned Company PE Owners Unions
Company Economic Condition
Equity Invested Deal Value
Deal Year
Labor Relations
PE Outcomes, Returns
Company and Labor Outcomes
Dana Corporation (Auto supply)
Centerbridge UAW, USWA
Bankrupt $500 Undisclosed 2008 Constructive 2008; Company emerges from bankruptcy and remains profit-able thereafter
Union contract stipulates limits on debt liabilities to $1.5 billion, which saves company during recession; union agrees to reduced wages and benefits; retirees covered by new health and retire-ment fund
Delphi Corporation (Auto supply)
John Paulson & Co., Silver Point Capital
UAW Bankrupt Undisclosed Undisclosed 2009 Strongly anti-union
2011 IPO yields profit of 3,000 percent
25 of 29 plants shut down; 25,000 union jobs offshored; taxpayers pay $12.9 billion in subsidies
Hawker Beechcraft (Aerospace)
Goldman Sachs Capital, Onex Partners
IAM Strong Undisclosed $3,300 2007 Union marginaliza-tion
2012: Goldman Sachs writes down the com-pany’s value by 85 percent
3,500 workers (36 per-cent of total) lose jobs; union negotiates wage and benefit concessions; 2012 bankruptcy, with $2.6 billion debt; PBGC takes over pension plans
Archway & Mother’s Cookies (Food processing)
Catterton Partners
ICBWU Bankrupt Undisclosed Undisclosed 2005 Strongly anti-union
Management engages in fraud; company acquired by stra-tegic investor Lance, Inc. for $30 million
Substantial cost-cutting; product quality declines; 2008 bankruptcy; plants shutdown, 400 workers lose jobs; workers file lawsuit for violation of WARN Act; new owner re-opens as non-union plant with 60 workers.
Stella D’oro (Food processing)
Brynwood Partners
ICBWU Moderate Undisclosed $17.5 2006 Strongly anti-union
Company acquired by stra-tegic investor Lance, Inc. for $17.5 million
Brynwood found guilty of unfair labor practices in contract negotia-tions, shuts down plant in 2009; 134 workers lose jobs
Ormet Aluminum
Matlin Patterson
USWA Bankrupt Undisclosed $30.0 2004 Anti-union to constructive
2005 out of bankruptcy; 2013 back in bankruptcy; sold to Wayzata for $130 million
19-month union cam-paign leads to 2006 labor contract with decent wages and benefits for 1,500 workers; PGBC assumes $260 million in unfunded pension liabilities
US Foods (Food distribution)
Clayton, Dubilier, Rice; KKR; National City Equity Partners
Teamsters Strong Undisclosed $7,100 2007 Anti-union to constructive
2013: High debt of $4.6 billion viewed as high risk profile by S&P
Work intensification, job loss in union sites; expansion in non-union facilities
(Appendix continues on p. 238.)
13583_07_Ch07_3rdP
gs.indd 2373/3/14 1:12 P
M

PE-Owned Company PE Owners Unions
Company Economic Condition
Equity Invested Deal Value
Deal Year
Labor Relations
PE Outcomes, Returns
Company and Labor Outcomes
Energy Futures Holding (Utilities)
TPG, Carlyle IBEW Strong $8,300 $48,100 2007 Constructive 2007–2012: Profit losses; no returns for investors; Carlyle writes off investment; PE gets $171 mil-lion in annual fees
2007–2012: 25% job growth; Positive labor relations; but $44 bil-lion in debt 2013 leads analysts to predict bankruptcy
Hospital Corporation of America (Health care providers)
Bain, KKR, Merrill Lynch, Frist
SEIU, NNU
Strong $4,500 $21,000 2006 Constructive 2010–2011: PE recoups two times its investment— $9 billion through dividend recaps and IPO
2012: Employment relatively stable but on-going union complaints of understaffing; PE negotiates neutrality agreements that bring in over 20,000 new union members; debt remains at $26 billion over assets of $14 billion
Table 7A.1 Continued
13583_07_Ch07_3rdP
gs.indd 2383/3/14 1:12 P
M

242 Private Equity at Work
funds, as the data for these pension funds are less reliable; but these are estimated to add $100 billion to the total of U.S. pension fund commit-ments to U.S. PE funds in this period. Although pension fund commit-ments tended to follow the more general boom-bust pattern of investment in private equity in this decade, public pension funds continued to make large commitments even after the crisis hit in 2007 and 2008. Figure 8.1 shows that pension fund investments were modest in the early 2000s, accelerated dramatically in the boom years of 2006 and 2007, and contin-ued to be large in 2008 and 2009, before dropping off to preboom levels thereafter. Notably, commitments to funds that closed in 2011 and 2012 were higher than commitments in any year from 2001 to 2005.
This substantial commitment to risky investments reflects several factors: the changing regulatory environment that has freed up pension fund managers to invest in a wider range of financial products and the increased availability of those products; decreasing Treasury yields; the changing guidelines for the Employee Retirement Income Security Act (ERISA) that have encouraged riskier investments; and the increasing demands for payouts of benefits to an aging membership. We discuss these patterns in more detail in the following section.
Estimates regarding the proportion of private equity funds that come from public pensions vary depending on the source of data and whether
Source: PitchBook.
$18.
2
$9.2
$11.
8
$6.9
$13.
9
$14.
2
$31.
2
$33.
2
$40.
3
$34.
4
$7.8
$15.
0
$16.
9
$0
$5
$10
$15
$20
$25
$30
$35
$40
$45
2000 2001 2002 2003 2004 2005 2006 2007 2008 2009 2010 2011 2012
Year of Fund Close
Publ
ic P
ensi
on C
omm
itm
ents
to P
E(B
illio
ns o
f Dol
lars
)
Figure 8.1 U.S. Public Pension Commitments to Private Equity, 2000 to 2012
13583_08_Ch08-3rdPgs.indd 242 3/3/14 1:11 PM

Dilemmas for Pension Funds as Limited Partners 243
national or international funds are considered. PitchBook estimates that U.S. public pension fund commitments to U.S. PE funds as a share of all committed funds averaged 18 percent annually from 2000 to 2012, with little variation except in 2009, when they averaged 26 percent (fig-ure 8.2). With respect to global fund-raising, a 2013 Bain Capital report using Preqin data estimated that public pension funds contributed about 25 percent of all capital committed to U.S. and international PE funds that closed in the 2009 to 2011 period.5 The different estimates may reflect the fact that the PitchBook data only cover U.S. PE funds whereas the Bain report covers international funds as well.
Recall that any individual private equity firm does not raise funds every year, but rather opens a new fund every several years (typically three to five years), undertakes fund-raising, and closes the fund when the target amount for the fund has been reached. Similarly, pension funds do not typically make a commitment to a fund every year; each commit-ment is for a ten-year period. Whether a public pension fund is able to invest in a new PE fund depends on how quickly it realizes returns from prior PE investments. Figure 8.3 shows the number of pension funds in each year from 2000 to 2012 that had committed to a PE fund that closed in the prior year, the prior three years, the prior five years, or the prior ten years. For the entire period, the number of funds that had invested in private equity in the prior ten years grew from 86 in 2000 to 126 in 2012—a 47 percent increase.
Source: PitchBook.
0
5
10
15
20
25
30
2000 2001 2002 2003 2004 2005 2006 2007 2008 2009 2010 2011 2012
Year of Fund Close
Perc
enta
ge
Figure 8.2 Public Pension Funds as a Percentage of Private Equity Fund-Raising, 2000 to 2012
13583_08_Ch08-3rdPgs.indd 243 3/3/14 1:11 PM

244 Private Equity at Work
Other measures of the relative importance of private equity to pension funds are the amount of total commitments to private equity and the pro-portion of total investments allocated to private equity. The pension funds with the largest amount of capital committed to private equity are shown in table 8.1. CalPERS is by far the largest contributor to PE investments, with almost twice the size of commitments by CalSTRS (the California State Teachers’ Retirement System). The states of Washington, New York, Oregon, and Texas are the next-largest contributors.
The states with the largest proportion of funds allocated to private equity are not necessarily the largest. Aggregate data on this measure are more difficult to come by, but according to one study by Wilshire Trust Universe Comparison Service, pensions with assets over $5 billion had an average allocation to private equity of 13 percent as of June 30, 2012, up from 9.5 percent in 2011.6 PitchBook data provide a more conserva-tive estimate of 8 percent for the fifty funds with assets over $5 billion for which data are available. For all eighty funds in the PitchBook data-base with at least 1 percent invested in private equity, the average and median percentage of PE investment is also 8 percent; the weighted average is 9.9 percent.7 According to PitchBook, at the end of 2013 the top ten funds with PE investments had an average allocation of 19 percent.8
Source: PitchBook.
Num
ber
of F
und
s
0
20
40
60
80
100
120
140
2000 2001 2002 2003 2004 2005 2006 2007 2008 2009 2010 2011 2012
Year of Fund Close
Made Commitment in Prior YearMade Commitment in Prior Three YearsMade Commitment in Prior Five YearsMade Commitment in Prior Ten Years
Figure 8.3 Public Pension Funds with Commitments to Private Equity, 2000 to 2012
13583_08_Ch08-3rdPgs.indd 244 3/3/14 1:11 PM

Dilemmas for Pension Funds as Limited Partners 253
the postcrisis period in particular, the returns on investment promised by PE funds often failed to meet expectations or to materialize at all because private equity could not exit portfolio companies, nor could GPs invest all of the money from a given fund, because opportunities for good invest-ments had fallen. Thus, LPs felt that they were overpaying on management fees when GPs were not able to use all of the funds they had committed or when GPs were not able to exit investments and return distributions to them in a timely fashion. Some PE managers accept the LP position. In the “SuperReturn 2012” conference in Boston, for example, Cerberus Capital Management cofounder and CEO Steve Feinberg admitted, “General part-ners make absurd amounts of money. We’re all overpaid. LPs asking for fee discounts are completely justified.”42
A comparison of limited partner contributions to private equity funds and distributions from those funds illustrates this point. As figure 8.4 shows, LP contributions have exceeded distributions in most years since 2000, but distributions particularly fell off during the crisis years of 2007 to 2009. They began to break even in the period 2010 to 2012, largely
Source: PitchBook.Note: 2012 figures as of September 30, 2012.
$(30)
$(25)
$(20)
$(15)
$(10)
$(5)
$0
$5
$10
$15
$20
$25
2000 2001 2002 2003 2004 2005 2006
Year2007 2008 2009 2010 2011 2012*
ContributionsDistributionsCash Flow
Bill
ions
of D
olla
rs
Figure 8.4 Contributions from and Distributions to Limited Partners, 2000 to 2012
13583_08_Ch08-3rdPgs.indd 253 3/3/14 1:11 PM

Dilemmas for Pension Funds as Limited Partners 245
Table 8.1 Public Pension Funds with the Largest Commitments to Private Equity, 2013
Limited Partner
Private Equity Allocation
(Millions of Dollars)
Private Equity
(Percentage)
Assets Under Management (Millions of
Dollars)
California Public Employees’ Retirement System (CalPERS)
$42,000 16% $269,100
California State Teachers’ Retirement System (CalSTRS)
21,759 13 170,000
Washington State Investment Board
16,170 18 91,360
New York State Common Retirement Fund
14,926 9 160,400
Oregon Investment Council 14,900 18 81,000Oregon Public Employees’
Retirement System13,550 21 63,240
Teacher Retirement System of Texas
13,145 10 134,454
Ontario Municipal Employees’ Retirement System
10,257 12 84,769
Pennsylvania Public School Employees’ Retirement System
8,040 22 50,500
New York State Teachers’ Retirement System
7,400 8 95,100
Florida State Board of Administration
6,500 5 169,200
Florida Retirement System 6,476 5 168,100New York City Employees’
Retirement System5,925 6 46,389
Massachusetts Pension Reserves Investment Trust
5,917 12 54,400
Ohio Public Employees’ Retirement System
5,271 6 82,600
Virginia Retirement System 5,000 9 58,300Teachers’ Retirement System
of the State of Illinois4,600 12 40,200
State Teachers’ Retirement System of Ohio
4,386 7 68,000
New York City Retirement Systems
4,157 4 139,200
(Table continues on p. 246.)
13583_08_Ch08-3rdPgs.indd 245 3/3/14 1:11 PM

246 Private Equity at Work
Pension Fund Fiduciary Duty and Private Equity Investments
Developments in law and economics since the 1970s have played a cen-tral role in shaping the allocation strategies of limited partners in general, and pension funds more specifically. As Steve Lydenberg, a top scholar on fiduciary responsibility, notes, “The concept of fiduciary duty sits at the confluence of two powerful streams of Western intellectual thought, the legal and the economic: the legal because fiduciaries are managing the assets of others whose interests the law seeks to protect; the economic because fiduciaries assume the role of investors in the marketplace in managing these assets.”9
These developments in law and economics have affected economic behavior at two interconnected levels: at the level of productive enterprises
Los Angeles County Employees’ Retirement Association
3,831 9 42,000
Indiana Public Retirement System
3,400 12 28,300
North Carolina Retirement Systems
2,960 4 81,100
Iowa Public Employees’ Retirement System
2,871 11 25,100
Maryland State Retirement Pension System
2,500 6 40,620
State of Connecticut Retirement and Trust Funds
2,265 9 26,600
Teachers’ Retirement System of the City of New York
2,100 6 32,775
Public School Retirement System of Missouri
1,943 6 34,600
Kentucky Retirement Systems
1,796 12 14,600
Arizona State Retirement System
1,754 6 28,400
Source: PitchBook, authors’ calculations.
Table 8.1 Continued
Limited Partner
Private Equity Allocation
(Millions of Dollars)
Private Equity
(Percentage)
Assets Under Management (Millions of
Dollars)
13583_08_Ch08-3rdPgs.indd 246 3/3/14 1:11 PM