INVESTOR UPDATE - ppbgroup.com · GSC also introduced the first D-BOX motion seats in Malaysia at...
40
INVESTOR UPDATE 2014 30 SEPTEMBER 2014 3 QUARTERLY REPORT RD
Transcript of INVESTOR UPDATE - ppbgroup.com · GSC also introduced the first D-BOX motion seats in Malaysia at...

INVESTOR UPDATE
2014
30 SEPTEMBER 2014
3QUARTERLY REPORT
RD

2
Dear Shareholders,
RESULTS FOR THE 9 MONTHS OF 2014We are pleased to announce that PPB Group revenue increased by 15% to RM2.77 billion for the nine months of 2014 primarily driven by higher revenue generated from the flour and feed milling and grains trading segment. Most of the other businesses also recorded growth in revenue.
The Group recorded 2% marginally lower profit before tax of RM732 million compared with RM748 million in the same period last year due mainly to lower profit contribution from PPB’s associate, Wilmar International Limited (Wilmar) of RM443 million against RM546 million previously.
Profit for the period under review reduced to RM658.1 million compared with RM711.2 million in 2013. Accordingly, earnings per share for the period ended 30 September 2014 declined to 53.59 sen compared with 59.21 sen achieved in the same period last year.
From The Desk Of
The Chairman

3
PROSPECTS FOR 2014In Malaysia and Asia generally, domestic demand will remain the key driver of economic growth for this financial year.
The Group’s flour and feed milling, consumer products, film exhibition, farm and bakery businesses are expected to perform well and will be supported by stronger domestic consumption during the year-end festive season. The environmental engineering division’s on-going projects together with finalisation of completed project accounts will contribute positively in the last financial quarter. The property development division is expected to maintain its contribution to the Group.
While the Group’s core businesses are expected to perform well in this financial year, its overall consolidated financial results will continue to be contingent on Wilmar’s business performance.
HAPPENINGSGolden Screen Cinemas Sdn Bhd (GSC), a wholly-owned subsidiary of PPB, opened its 10-screen cinema at Palm Mall, Seremban on 24 July 2014. With 1,659 seats, it is the largest cinema and has the first THX-certified hall in Negeri Sembilan. A THX-certified hall provides standards and best practices for architectural design, acoustics, sound isolation and audio-visual equipment performance to ensure that every seat in the hall is a good one.
GSC also introduced the first D-BOX motion seats in Malaysia at GSC 1 Utama (Hall 3) on 7 August 2014 which provide movie fans with a synchronized motion experience with movie scenes. To serve its customers better, GSC launched the GSC Mobile App for Windows Phone 8.1 on 25 September 2014 at GSC Signature. The GSC Mobile App enables users to book movie tickets and manage their bookings from their Windows smartphones, and supplements GSC’s existing mobile applications for iOS and Android phones.
PPB held its second Press and Analyst Briefing of PPB on 3 September 2014 to review the interim results for 2014 and other developments in the Group.
CSR ACTIVITIESIn conjunction with the Ramadan and Aidil Fitri celebration, PPB gave Rumah Anak Yatim Al-Nasuha, a new coat of paint for their home and met their pressing need for a washing machine. FFM Berhad, a 80%-subsidiary of PPB, contributed Massimo bakery products to the children of Yayasan Anak-anak Yatim Sultanah Haminah at a breaking of fast ceremony in Kedah hosted by Her Majesty the Raja Permaisuri Agong Tuanku Hajah Haminah on 15 July 2014.
Under the “Back to School” project, PPB gave away school uniforms, school shoes and socks to a total of 2,223 poor students from 19 primary schools in Bagan Serai, Perak.
Cheras Leisuremall (CLM), the shopping complex owned and managed by PPB, held its 2nd Children’s Lantern-making Contest in conjunction with the Mid-Autumn Promotion 2014 which attracted over 1,000 entries. Popular Malaysian artists entertained the CLM shoppers at a Mid-autumn Street Party held outside Cheras Leisuremall on 9 September 2014 to overwhelming response.
In conjunction with the “Program Merdeka-Membudayakan Perpaduan Meraikan Kepelbagaian” held on 9 September 2014, PPB was awarded “Rakan Perpaduan” by Jabatan Perpaduan Negara dan Integrasi Nasional for participating in the Merdeka celebration and organising programmes to encourage unity in the community.
GREETINGSAs the year is coming to a close, I wish to take this opportunity to wish all our shareholders, business associates and staff of PPB Group, HAPPY HOLIDAYS AND SEASON’S GREETINGS TO ALL!
Datuk Oh Siew Nam • CHAIRMAN3 December 2014
From The Desk Of The Chairman (Cont’d)

Opening of GSC Palm Mall, Seremban
GSC Palm Mall opened on 24 July 2014 as the largest cinema in Negeri Sembilan in terms of seating capacity, and also the FIRST THX-certified hall. The brand new cinema is equipped with all-digital halls – one (1) THX-certified hall and two (2) digital 3D halls. GSC Palm Mall has a total seating capacity of 1,659 including 20 wheel-chair spaces. GSC Palm Mall complements the 4-screen GSC Terminal 1, with a total 2,669-seating capacity in 14 screens in Negeri Sembilan.
(L-R) Mr Thomas Tay (Capitol Prosper), Ms Tan Ai Lin (Capitol Prosper), Ms Koh Mei Lee (GSC), Mr Irving Chee (GSC) and Mr Shamsul Kamar (Palm Mall Seremban Hotel)
First ticket purchase at GSC Palm Mall, Seremban
INVESTOR UPDATE
4
Happenings

Back (L-R) Mr. Heng Beng Fatt (GSC), Mr. Tung Yow Kong (GSC), Ms. Anita Mak (GSC)Front (L-R) Mr. Ken Knapp (Technology Specialist for D-BOX Technologies Inc.), Mr. Irving Chee (GSC) & Mr. Kelvin Chee (GSC)
GSC Premieres D-BOX Motion Seats in MalaysiaGolden Screen Cinemas premiered the first D-BOX motion seats in Malaysia at GSC 1 Utama (Hall 3) on 7 August 2014 and will be extending this unique feature to other GSC flagship cinemas soon.
D-BOX, as per its official tagline “Your Movie in Motion” offers movie fans perfectly synchronized motions with the movie scenes. Malaysian movie-goers will now have an unmatched immersive movie experience as they can enjoy an enhanced experience of the movie being featured on-screen.
QUARTERLY REPORT • 30 SEPTEMBER 2014
5
Happenings (Cont’d)
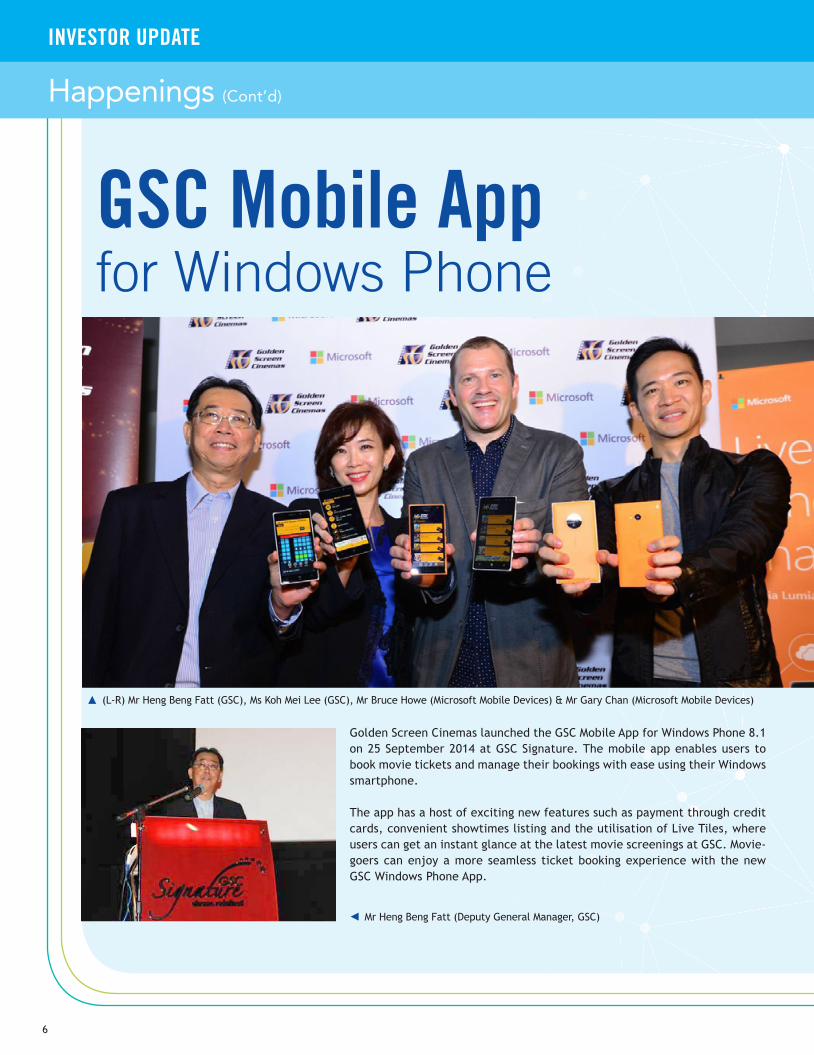
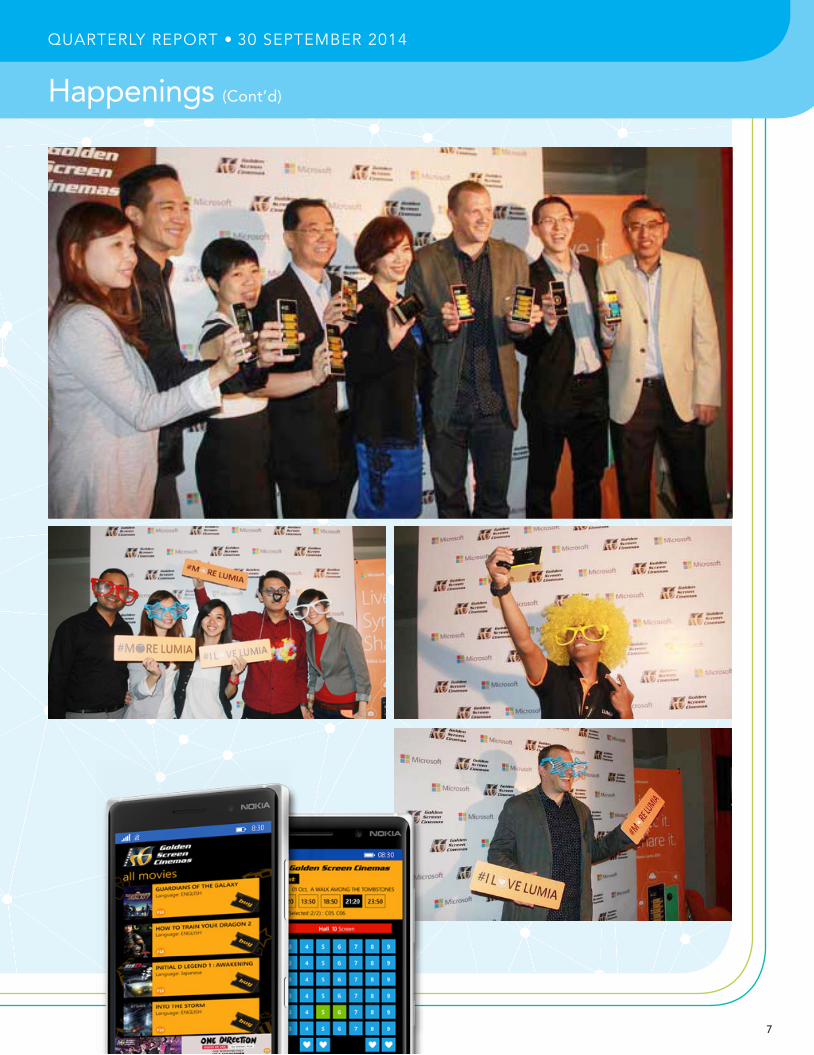
Golden Screen Cinemas launched the GSC Mobile App for Windows Phone 8.1 on 25 September 2014 at GSC Signature. The mobile app enables users to book movie tickets and manage their bookings with ease using their Windows smartphone.
The app has a host of exciting new features such as payment through credit cards, convenient showtimes listing and the utilisation of Live Tiles, where users can get an instant glance at the latest movie screenings at GSC. Movie-goers can enjoy a more seamless ticket booking experience with the new GSC Windows Phone App.
GSC Mobile App for Windows Phone
(L-R) Mr Heng Beng Fatt (GSC), Ms Koh Mei Lee (GSC), Mr Bruce Howe (Microsoft Mobile Devices) & Mr Gary Chan (Microsoft Mobile Devices)
Mr Heng Beng Fatt (Deputy General Manager, GSC)
6
Happenings (Cont’d)
INVESTOR UPDATE
7
Happenings (Cont’d)
QUARTERLY REPORT • 30 SEPTEMBER 2014

8
INVESTOR UPDATE
Happenings (Cont’d)
PRESS &ANALYST BRIEFING
L to R: Mr Chew Hwei Yeow, COO (Properties) of PPB; Ms Koh Mei Lee, CEO of GSC Group & Senior Manager (Corporate Affairs) of PPB; Datuk Ong Hung Hock, Director of PPB and MD of FFM Group; Mr Lim Soon Huat, MD of PPB; Ms Leong Choy Ying, CFO of PPB; and Mr Mah Teck Keong, Company Secretary of PPB.
9
Happenings (Cont’d)
QUARTERLY REPORT • 30 SEPTEMBER 2014
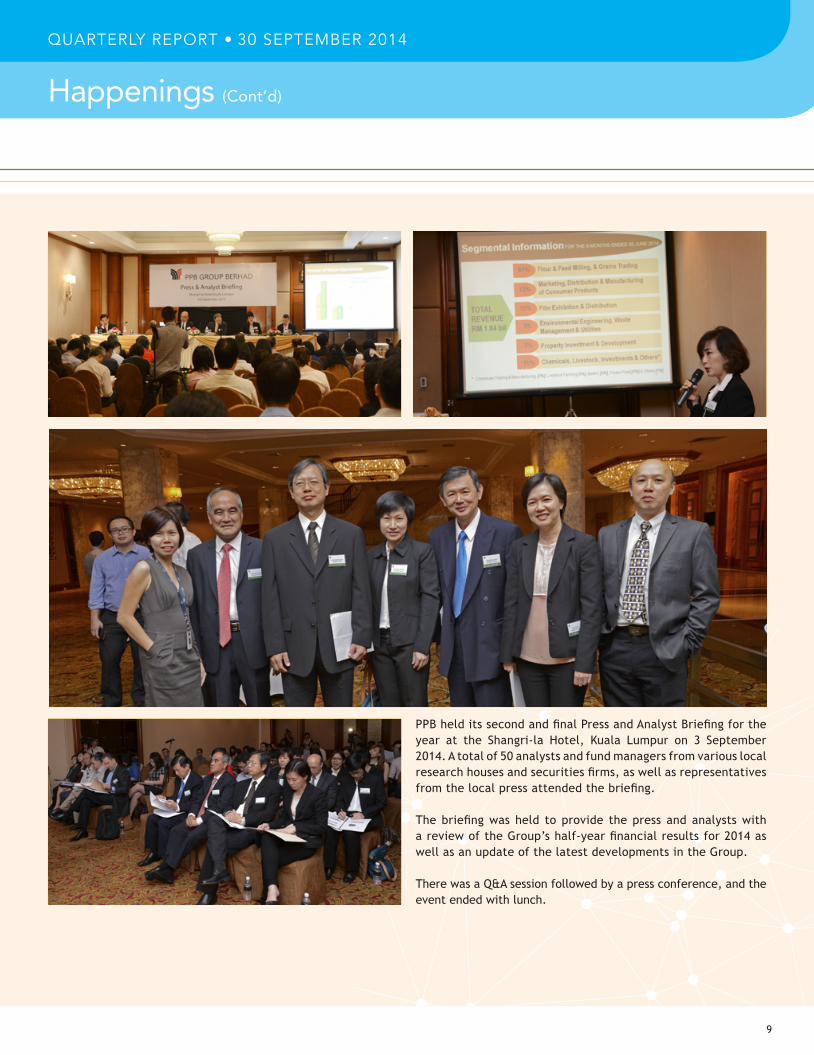
PPB held its second and final Press and Analyst Briefing for the year at the Shangri-la Hotel, Kuala Lumpur on 3 September 2014. A total of 50 analysts and fund managers from various local research houses and securities firms, as well as representatives from the local press attended the briefing.
The briefing was held to provide the press and analysts with a review of the Group’s half-year financial results for 2014 as well as an update of the latest developments in the Group.
There was a Q&A session followed by a press conference, and the event ended with lunch.

10
To add a cheerful touch to an orphanage in Gombak Permai for the Hari Raya celebration, PPB gave Rumah Anak Yatim Al-Nasuha a new coat of paint for their home. PPB also met their pressing need for a washing machine with a brand new Daewoo 14kg fully automated one and purchased some Hari Raya cookies for the children.
Rumah Anak Yatim Al-Nasuha is a home for orphans and poor children ages 1 to 19 years. Currently, the home has 70 children residing in 3 houses and 12 staff to care for them. The estimated monthly expenses of the home of RM30,000 are funded by the public.
A NEW COAT OF PAINT FOR RUMAH ANAK YATIM AL-NASUHA
INVESTOR UPDATE
CSR Activities

11
For the Ramadhan, FFM Berhad, a 80%-subsidiary of PPB, contributed Massimo White Sandwich loaves, Chiffon-in-a-Cup, Fun Buns, Wheat Germ Loaves and Whole Wheat Loaves as well as apples to the children of Yayasan Anak-Anak Yatim Sultanah Haminah (YAYSH) at a breaking of fast ceremony hosted by Her Majesty the Raja Permaisuri Agong Tuanku Hajah Haminah on 15 July 2014.
YAYSH is a foundation established by Her Majesty in 2011 in conjuction with her birthday. The aim of YAYSH is to source for funds to support orphans in Kedah. Todate, YAYSH has grown to cover the welfare of orphans, as well as the less fortunate such as children from poor families and single parent homes.
CSR Activities (Cont’d)
QUARTERLY REPORT • 30 SEPTEMBER 2014
FFM CONTRIBUTED MASSIMO BAKERY PRODUCTS TO UNDERPRIVILEGED CHILDREN

On 19 August 2014, 8 PPB staff travelled to Perak to distribute school uniforms, school shoes and socks to a total of 2,223 poor students from 19 primary schools in Bagan Serai, about an hour’s drive from Taiping, Perak.
PPB’s “Back To School” project seeks to meet the basic needs of underprivileged school-going children.
For many of the schools, this was the first time that their students had received such contribution from a corporate body.
“BACK TO SCHOOL” PROJECT
12
CSR Activities (Cont’d)
INVESTOR UPDATE

13
CSR Activities (Cont’d)
QUARTERLY REPORT • 30 SEPTEMBER 2014

Cheras Leisuremall, a shopping complex owned and operated by PPB, held its 2nd children’s Lantern-making Contest in conjunction with its Mid-Autumn Promotion 2014. The contest attracted over 1,000 entries from Tadika Mayter, SKJC Jalan Davidson and Global Art. Prizes were awarded to the Top 100 entries in each category together with the Top 10 People’s Choice Awards and 20 Special Judges Awards. The winners received cash vouchers and certificates.
The competition enabled the children to learn more about the Chinese lantern culture in a fun and interactive way and for the community at large, to enjoy and appreciate the varied cultures in Malaysia. Proud parents and friends of the young contestants gave their full support making it a very successful event.
A Mid-Autumn Street Party was held on 6 September 2014 outside Cheras Leisuremall which received overwhelming response. Popular Malaysian artists Orange, Danny, Kah Jun, Windy, Stephanie, Jie Ying Fuying and Sam entertained the crowd with their energetic performances.
MID-AUTUMN FESTIVAL AT CHERAS LEISUREMALL
INVESTOR UPDATE
14
CSR Activities (Cont’d)

QUARTERLY REPORT • 30 SEPTEMBER 2014
15
CSR Activities (Cont’d)

PPB was awarded “Rakan Perpaduan” by Jabatan Perpaduan Negara dan Integrasi National in conjunction with the “Program Merdeka-Membudayakan Perpaduan Meraikan Kepelbagaian” on 9 September 2014 at Stadium Titiwangsa, Kuala Lumpur.
A 1Malaysia ethnic wear photo opportunity was set up from 1 August to 16 September 2014 at Cheras Leisuremall. A Merdeka Unity Ride 2014 was organised in collaboration with the Road Safety Marshal Club where 157 big bikers distributed 5,000 Malaysian flags to the public at 31 locations within the Klang Valley including Cheras Leisuremall on 23 August 2014.
On 30 and 31 August 2014, a blood donation campaign was organised at the Mall in collaboration with Astro and National Blood Centre. A total of 443 pints of blood was collected to supplement the National Blood Centre blood bank.
MERDEKA DAY EVENTS
16
CSR Activities (Cont’d)
INVESTOR UPDATE

17
Share Analysis
QUARTERLY REPORT • 30 SEPTEMBER 2014
After registering a gain of 1.8% in 2Q 2014, the FBM KLCI declined by 1.9% in 3Q 2014 and closed at 1,846.3 points. The FBM KLCI commenced the third quarter of 2014 on a firm note and rose to a record intraday high of 1,896.2 points on 8 July 2014. However, lack of positive catalysts amid rising market valuations caused the FBM KLCI to ease to a 26-week intraday low of 1,829.2 points on 26 September 2014. The FBM KLCI subsequently moved in a trading range amid a lack of fresh leads before closing at 1,846.3 points for a quarterly loss of 1.9%.
[Source : Public Mutual website]
PPB’s share price closed lower at RM14.20 compared with RM15.14 in the preceding quarter and market capitalisation decreased to RM16,834.1 million. The average daily volume of PPB shares traded decreased by 15.63% to 365,872 shares.
FBM KLCI
Closed Lower in 3Q 2014 amid a Lack of Fresh Leads

18
INVESTOR UPDATE
Share Analysis (Cont’d)
PPB SHARE PRICE & FTSE BURSA MALAYSIA KUALA LUMPUR COMPOSITE INDEX (FBM KLCI) PERFORMANCE FOR 3RD Q 2014
3rd Q 2014 2nd Q 2014 % change
PPB share price (RM)
Closing price (high) 15.24 16.52 -7.75%
Closing price (low) 14.08 14.76 -4.61%
Month-end closing price 14.20 15.14 -6.21%
Weighted share price 14.68 15.86 -7.49%
Market capitalisation (RM' million) 16,834.10 17,948.47 -6.21%
PPB share trading volume (no. of shares)
Daily volume (high) 1,223,700 1,236,200 -1.01%
Daily volume (low) 44,200 43,600 1.38%
Average daily volume 365,872 433,663 -15.63%
FBM KLCI
FBM KLCI closing (high) 1,892.65 1,892.33 2.13%
FBM KLCI closing (low) 1,839.87 1,845.37 3.74%
FBM KLCI quarter end closing 1,846.31 1,882.71 1.81%
FBM KLCI volume (no. of shares)
Daily Volume (high) 206,340,200 477,552,300 -56.79%
Daily Volume (low) 71,808,400 50,634,500 41.82%
Average Daily Volume 110,935,062 127,433,027 -12.95%
Share Analysis (Cont’d)
Date

Financial period/year ended(All figures in RM million)
9 months 12 months
30.09.14 30.09.13 % change 31.12.13
INCOME STATEMENTRevenue 2,768 2,413 14.7 3,313 Profit before tax 732 748 (2.1) 1,063 Profit for the period/year 658 711 (7.5) 991 Profit attributable to owners of the parent 635 702 (9.5) 983
STATEMENT OF FINANCIAL POSITIONNon-current assets 14,930 14,475 3.1 14,851
Current assetsCash, bank balances, deposits and short-term fund
placements986 899 9.7 965
Others 1,489 1,206 23.5 1,249 Total current assets 2,475 2,105 17.6 2,214
Total assets 17,405 16,580 5.0 17,065
EquityShare capital 1,186 1,186 0.0 1,186 Reserves 14,638 14,086 3.9 14,467 Equity attributable to owners of the parent 15,824 15,272 3.6 15,653 Non-controlling interests 558 540 3.3 539 Total equity 16,382 15,812 3.6 16,192
Non-current liabilitiesBank borrowings 57 101 (43.6) 89 Deferred tax liabilities 87 73 19.2 80 Total non-current liabilities 144 174 (17.2) 169
Current liabilitiesBank borrowings 432 238 81.5 330 Others 447 356 25.6 374 Total current liabilities 879 594 48.0 704
Total liabilities 1,023 768 33.2 873
Total equity and liabilities 17,405 16,580 5.0 17,065
19
QUARTERLY REPORT • 30 SEPTEMBER 2014
FOR THE 3RD QUARTER OF 2014(The figures have not been audited)
Group Financial Highlights

Financial period/year ended 9 months 12 months
30.9.14 30.9.13 31.12.13
RATIOS
Return on equity attributable to owners of the parent (%) 4.0 4.6 6.3 Earnings per share (sen) 53.6 59.2 82.9 Interest coverage (times) 49.8 84.1 76.9 Current ratio (times) 2.8 3.5 3.1 Total borrowings/Equity (%) 3.0 2.1 2.6 Long-term borrowings/Equity (%) 0.3 0.6 0.6 Net assets per share attributable to owners of the parent (RM) 13.4 12.9 13.2 Net dividend per share (sen) 7.0 8.0 25.0
STOCK MARKET INFORMATIONShare price (RM) 14.20 14.22 16.14 Market capitalisation (RM million) 16,841 16,865 19,142 PE ratio (times) 19.9 18.0 19.5
FOR THE 3RD QUARTER OF 2014(The figures have not been audited )
20
Group Financial Highlights (Cont’d)
INVESTOR UPDATE

PPB announced the commencement of a members’ voluntary winding up of
Lamlewa Feedmill Sdn Bhd, an indirect 80%-owned dormant subsidiary of PPB.
PPB announced that the quarterly report for the 2nd quarter ended 30 June 2014 will be released on 27 August 2014.
Release of PPB’s quarterly report for the 2nd quarter ended 30 June 2014.
PPB Board declared the payment of an interim single tier dividend of 7 sen per share for the financial year ending 31 December 2014.
The interim dividend was paid on 26 September 2014 to shareholders appearing in the Record of Depositors at the close of business on 11 September 2014.
PPB announced the amount of financial assistance provided by subsidiaries of PPB for the 2nd quarter ended 30 June 2014.
ANNOUNCEMENTS
AUGUST 4
13
27
27
27
Announcements
21
4 December 2014
QUARTERLY REPORT • 30 SEPTEMBER 2014

Individual Quarter3 months ended30 September
Cumulative Quarter9 months ended30 September
2014RM’000
2013RM’000
2014RM’000
2013RM’000
Revenue 927,965 830,395 2,767,794 2,412,730 Operating expenses (866,980) (808,176) (2,578,918) (2,318,381)Other operating income 52,132 29,229 96,721 100,774 Share of net profits less losses of associates 256,336 243,631 458,918 559,608 Share of profit of joint venture 1,017 1,122 3,115 2,758 Finance costs (4,204) (3,221) (15,413) (9,341)Profit before tax 366,266 292,980 732,217 748,148 Income tax expense (33,702) (9,183) (74,142) (36,914)Profit for the period 332,564 283,797 658,075 711,234
Attributable to :Owners of the parent 324,698 286,058 635,345 701,881 Non-controlling interests 7,866 (2,261) 22,730 9,353 Profit for the period 332,564 283,797 658,075 711,234
Basic earnings per share (sen) 27.39 24.13 53.59 59.21
(The Condensed Consolidated Income Statements should be read in conjunction with the annual financial statements for the year ended 31 December 2013, and the accompanying explanatory notes attached to this report.)
22
INVESTOR UPDATE
Quarterly ReportCondensed Consolidated Income Statements For The Period Ended 30 September 2014(The figures have not been audited)

Individual Quarter3 months ended30 September
Cumulative Quarter9 months ended30 September
2014RM’000
2013RM’000
2014RM’000
2013RM’000
Profit for the period 332,564 283,797 658,075 711,234
Other comprehensive income/(loss), net of tax
Items that will be subsequently reclassified to profit or loss
Exchange differences on translation of foreign operations 231,768 302,798 (72,841) 726,379
Fair value of available-for-sale financial assets:-
- (Losses)/Gains arising during the period (25,521) 17,234 (94,059) 26,086 - Reclassification adjustments to profit or loss upon disposal — — — (15,179)
Share of associates’ other comprehensive loss (80,645) (68,758) (15,107) (186,106)Total comprehensive income 458,166 535,071 476,068 1,262,414
Attributable to :Owners of the parent 446,539 539,663 455,111 1,250,373 Non-controlling interests 11,627 (4,592) 20,957 12,041 Total comprehensive income 458,166 535,071 476,068 1,262,414
(The Condensed Consolidated Statement of Comprehensive Income should be read in conjunction with the annual financial statements for the year ended 31 December 2013, and the accompanying explanatory notes attached to this report.)
23
QUARTERLY REPORT • 30 SEPTEMBER 2014
Quarterly ReportCondensed Consolidated Statement Of Comprehensive IncomeFor The Period Ended 30 September 2014

Condensed Consolidated Statement Of Financial Position
As at30-Sep-14
RM’000
As at31-Dec-13
RM’000
ASSETSNon-current Assets
Property, plant and equipment 1,206,492 1,195,996 Investment properties 195,141 204,090 Biological assets 3,050 2,877 Goodwill 74,615 74,615 Other intangible assets 2,633 2,696 Land held for property development 19,281 17,176 Investments in associates 12,801,575 12,628,152 Investment in joint venture 55,519 57,368 Other investments 565,946 660,634 Deferred tax assets 5,562 7,683
14,929,814 14,851,287
Current AssetsInventories 610,271 508,493 Biological assets 19,398 17,370 Other intangible assets 10,777 11,957 Property development costs 10,391 23,165 Receivables 773,250 682,904 Derivative financial instruments 29,875 5,263 Cash, bank balances, deposits and short-term fund placements 985,517 964,991
2,439,479 2,214,143 Non-current assets classified as held for sale 35,811 —
2,475,290 2,214,143
TOTAL ASSETS 17,405,104 17,065,430
EQUITY AND LIABILITIESEquityShare capital 1,185,500 1,185,500 Reserves 14,638,371 14,467,780 Equity attributable to owners of the parent 15,823,871 15,653,280 Non-controlling interests 557,965 538,617 Total equity 16,381,836 16,191,897
Condensed Consolidated Statement Of Financial Position
24
INVESTOR UPDATE
Quarterly Report

Condensed Consolidated Statement Of Financial Position (Cont’d)
As at30-Sep-14
RM’000
As at31-Dec-13
RM’000
Non-current Liabilities
Long-term borrowings 56,701 89,698 Deferred tax liabilities 87,157 79,984
143,858 169,682
Current LiabilitiesPayables 411,392 352,739 Derivative financial instruments 5,695 6,348 Short-term borrowings 432,452 329,855 Current tax liabilities 29,871 14,909
879,410 703,851
Total liabilities 1,023,268 873,533
TOTAL EQUITY AND LIABILITIES 17,405,104 17,065,430
Net assets per share attributable to owners of the parent (RM) 13.35 13.20
(The Condensed Consolidated Statement of Financial Position should be read in conjunction with the annual financial statements for the year ended 31 December 2013, and the accompanying explanatory notes attached to this report.)
Condensed Consolidated Statement Of Financial Position (Cont’d)
25
QUARTERLY REPORT • 30 SEPTEMBER 2014
Quarterly Report

Non-distributable Distributable
Sharecapital
RM’000
Sharepremium
RM’000
RevaluationreserveRM’000
Exchangetranslation
reserveRM’000
Fairvalue
reserveRM’000
HedgereserveRM’000
CapitalreserveRM’000
RetainedearningsRM’000
Attributable toowners of
the parentRM’000
Non-controllinginterests
RM’000
Totalequity
RM’000
9 months ended 30 September 2014
At 1 January 2014 1,185,500 6,715 45,131 (294,411) 236,187 (23,923) 246,700 14,251,381 15,653,280 538,617 16,191,897
Total comprehensive income — — — (158,082) (94,048) 49,470 22,426 635,345 455,111 20,957 476,068
Transfer of reserves — — (356) — — — 2,561 (2,205) — — —
Dividends — — — — — — — (284,520) (284,520) (1,609) (286,129)
At 30 September 2014 1,185,500 6,715 44,775 (452,493) 142,139 25,547 271,687 14,600,001 15,823,871 557,965 16,381,836
9 months ended 30 September 2013
At 1 January 2013 1,185,500 6,715 60,532 (952,538) 198,192 36,044 248,964 13,487,966 14,271,375 493,996 14,765,371
Total comprehensive income — — — 576,696 10,847 (46,314) 7,263 701,881 1,250,373 12,041 1,262,414
Transfer of reserves — — (13,846) — — — 1,183 12,663 — — —
Issue of shares to non-controlling interests — — — — — — — — — 34,279 34,279
Dividends — — — — — — — (248,955) (248,955) (459) (249,414)
At 30 September 2013 1,185,500 6,715 46,686 (375,842) 209,039 (10,270) 257,410 13,953,555 15,272,793 539,857 15,812,650
(The Condensed Consolidated Statement of Changes in Equity should be read in conjunction with the annual financial statements for the year ended 31 December 2013, and the accompanying explanatory notes attached to this report.)
Condensed Consolidated Statement Of Changes In Equity For The Period Ended 30 September 2014
26 27
QUARTERLY REPORT • 30 SEPTEMBER 2014INVESTOR UPDATE
Quarterly Report
9 months ended30 September
2014RM’000
2013RM’000
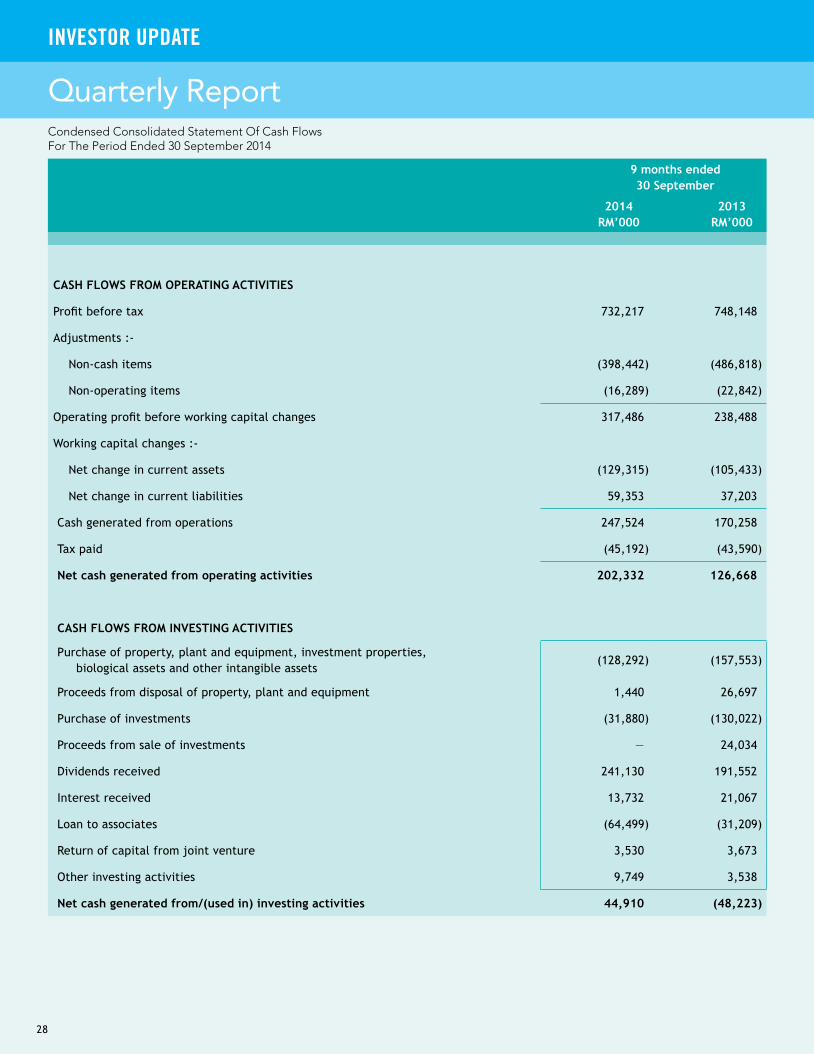
CASH FLOWS FROM OPERATING ACTIVITIES
Profit before tax 732,217 748,148
Adjustments :-
Non-cash items (398,442) (486,818)
Non-operating items (16,289) (22,842)
Operating profit before working capital changes 317,486 238,488
Working capital changes :-
Net change in current assets (129,315) (105,433)
Net change in current liabilities 59,353 37,203
Cash generated from operations 247,524 170,258
Tax paid (45,192) (43,590)
Net cash generated from operating activities 202,332 126,668
CASH FLOWS FROM INVESTING ACTIVITIES
Purchase of property, plant and equipment, investment properties,biological assets and other intangible assets
(128,292) (157,553)
Proceeds from disposal of property, plant and equipment 1,440 26,697
Purchase of investments (31,880) (130,022)
Proceeds from sale of investments — 24,034
Dividends received 241,130 191,552
Interest received 13,732 21,067
Loan to associates (64,499) (31,209)
Return of capital from joint venture 3,530 3,673
Other investing activities 9,749 3,538
Net cash generated from/(used in) investing activities 44,910 (48,223)
Condensed Consolidated Statement Of Cash FlowsFor The Period Ended 30 September 2014
28
INVESTOR UPDATE
Quarterly Report

9 months ended30 September
2014RM’000
2013RM’000
CASH FLOWS FROM FINANCING ACTIVITIES
Proceeds from issue of shares by a subsidiary — 10,932
Bank borrowings 61,376 (7,483)
Interest paid (15,185) (10,644)
Dividends paid (286,129) (249,415)
Advances from non-controlling interest of a subsidiary 11,206 23,947
Net cash used in financing activities (228,732) (232,663)
Net increase/(decrease) in cash and cash equivalents 18,510 (154,218)
Cash and cash equivalents brought forward 964,252 1,049,694
Effect of exchange rate changes (198) 3,585
Cash and cash equivalents carried forward 982,564 899,061
Cash and cash equivalents represented by :-
Cash and bank balances 218,574 131,484
Bank deposits 448,128 600,140
Short-term fund placements 318,815 167,827
Bank overdrafts (2,953) (390)
982,564 899,061
(The Condensed Consolidated Statement of Cash Flows should be read in conjunction with the annual financial statements for the year ended 31 December 2013, and the accompanying explanatory notes attached to this report.)
29
QUARTERLY REPORT • 30 SEPTEMBER 2014
Quarterly Report

A. Financial Reporting Standard (FRS) 134 - Paragraph 16A1. Accounting policies
The interim financial statements of the Group have been prepared in accordance with the requirements of Financial Reporting Standards (“FRS”) FRS 134 - Interim Financial Reporting and Chapter 9, Part K of the Main Market Listing Requirements of Bursa Malaysia Securities Berhad (“BMSB”).
The accounting policies and methods of computation used in the preparation of the interim financial statements are consistent with those used in the preparation of the audited financial statements for the financial year ended 31 December 2013 except for the adoption of the following Amendments to FRSs and Issues Committee Interpretations (“IC Interpretation”) that are effective for financial periods beginning on or after 1 January 2014 :-
Amendments to FRS 10, FRS 12 and FRS 127 Investment EntitiesAmendments to FRS 132 Offsetting Financial Assets and Financial LiabilitiesAmendments to FRS 136 Recoverable Amount Disclosures for Non-Financial Assets Amendments to FRS 139 Novation of Derivatives and Continuation of Hedge AccountingIC Interpretation 21 Levies
The adoption of the above Amendments to FRSs and IC Interpretation does not have any significant financial impact on the Group.
Malaysian Financial Reporting Standards (“MFRS”)
On 19 November 2011, the Malaysian Accounting Standards Board (“MASB”) issued a new approved accounting framework, Malaysian Financial Reporting Standards (“MFRS”).
The MFRS framework is to be applied by all entities other than private entities for annual periods beginning on or after 1 January 2012, with the exception of entities subject to the application of MFRS 141 - Agriculture and IC Interpretation 15 - Agreements for Construction of Real Estate, including the entities’ parent, significant investor and venturer (“Transitioning Entities”).
Transitioning Entities are allowed to defer adoption of the MFRS framework and continue to use the existing FRS framework until the MFRS framework is mandated by the MASB.
The Group falls within the definition of Transitioning Entities and has opted to defer adoption of the MFRS framework.
According to the announcement made by the MASB on 2 September 2014, all Transitioning Entities shall adopt the MFRS framework and prepare their first MFRS financial statements for annual periods beginning on or after 1 January 2017.
The Group will adopt the MFRS framework and will prepare its first set of MFRS financial statements for the financial year ending 31 December 2017. In presenting its first set of MFRS financial statements, the Group will quantify the financial effects arising from the differences between MFRS and the currently applied FRS. The majority of the adjustments required on transition are expected to be made retrospectively, against opening retained earnings of the Group. Accordingly, the financial performance and financial position of the Group as presented in the financial statements for the year ending 31 December 2014 could be different if prepared in accordance with MFRS.
Notes
30
INVESTOR UPDATE
Quarterly Report
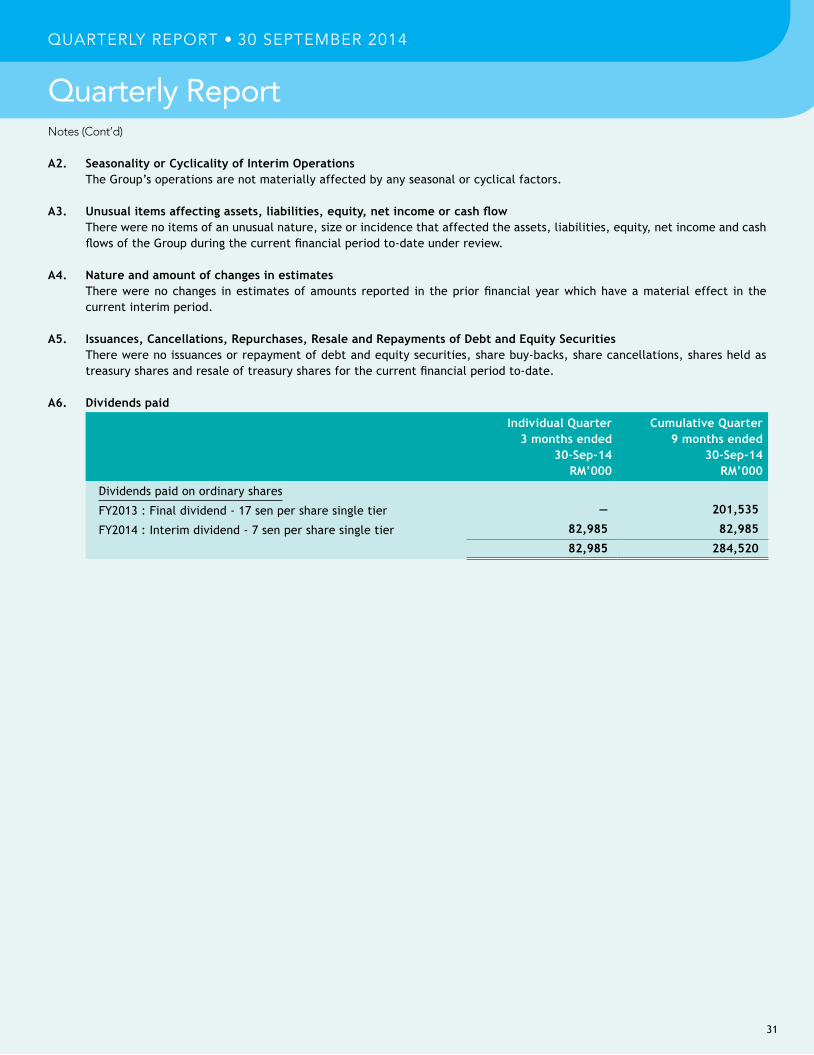
A2. Seasonality or Cyclicality of Interim Operations The Group’s operations are not materially affected by any seasonal or cyclical factors.
A3. Unusual items affecting assets, liabilities, equity, net income or cash flow There were no items of an unusual nature, size or incidence that affected the assets, liabilities, equity, net income and cash
flows of the Group during the current financial period to-date under review.
A4. Nature and amount of changes in estimates There were no changes in estimates of amounts reported in the prior financial year which have a material effect in the
current interim period.
A5. Issuances, Cancellations, Repurchases, Resale and Repayments of Debt and Equity Securities There were no issuances or repayment of debt and equity securities, share buy-backs, share cancellations, shares held as
treasury shares and resale of treasury shares for the current financial period to-date.
A6. Dividends paid
Individual Quarter3 months ended
30-Sep-14 RM’000
Cumulative Quarter9 months ended
30-Sep-14 RM’000
Dividends paid on ordinary shares
FY2013 : Final dividend - 17 sen per share single tier — 201,535
FY2014 : Interim dividend - 7 sen per share single tier 82,985 82,985
82,985 284,520
Notes (Cont’d)
31
QUARTERLY REPORT • 30 SEPTEMBER 2014
Quarterly Report

NOTES (CONT’D)
A7. Segmental reporting Segmental information in respect of the Group’s business segments for the period ended 30 September 2014
Business Segments:All figures in RM'000
Flour and feed milling, and grains
trading
Marketing, distribution and
manufacturing of consumer
productsFilm exhibition
and distribution
Environmental engineering,
waste management and
utilities
Property investment and
development
Chemicals trading and
manufacturingLivestock
farmingInvestments in
equitiesOther
operations Elimination Total
REVENUEExternal revenue 1,668,889 337,061 274,653 79,960 69,502 62,384 96,066 8,399 170,880 — 2,767,794 Inter-segment sales 81,189 — — 196 1,531 21,778 1,016 — 10,876 (116,586) —
Total revenue 1,750,078 337,061 274,653 80,156 71,033 84,162 97,082 8,399 181,756 (116,586) 2,767,794
RESULTSSegment results 163,594 22,800 46,839 794 23,942 1,896 13,348 7,175 (3,852) — 276,536 Share of associates' profits less losses 3,980 — 2,539 4,887 4,011 — — — 443,501 — 458,918 Share of joint venture's profit — — — 3,115 — — — — — — 3,115 Interest income 13,554 Income from short-term fund placements 7,181 Finance costs (15,413)Unallocated corporate expenses (11,674)Profit before tax 732,217
ASSETSSegment assets 1,735,548 239,665 264,076 84,609 288,966 55,476 118,363 565,946 398,715 (70) 3,751,294
Investments in associates 232,731 — 68,184 43,026 178,214 — — — 12,279,420 — 12,801,575
Investment in joint venture — — — 55,519 — — — — — — 55,519 Bank deposits and short-term fund placements
766,943
Tax assets 17,025 Other unallocated corporate assets 12,748 Total assets 17,405,104
A8. Material events subsequent to the end of the interim period There were no material events subsequent to the end of the interim period that have not been reflected in the financial
statements for the interim period.
A9. Changes in the composition of the Group There were no changes in the composition of the Group arising from business combinations, acquisition or disposal of subsidiaries
and long-term investments, restructurings, and discontinued operations for the current interim period and year to-date under review, except for the following :-
a) On 19 March 2014, Federal Flour Mills Holdings Sdn Bhd, a dormant wholly-owned subsidiary of PPB, was struck off from the Register of Companies pursuant to Section 308 of the Companies Act 1965, and has accordingly ceased to be a subsidiary of PPB.
b) On 4 August 2014, Lamlewa Feedmill Sdn Bhd, an indirect 80%-owned dormant subsidiary of PPB commenced a members’ voluntary winding up pursuant to Section 254(1)(b) of the Companies Act 1965. The winding up is in progress.
c) Cathay Enterprises Sdn Bhd, an indirect wholly-owned dormant subsidiary of PPB which commenced a members’ voluntary winding up on 12 August 2011 has been dissolved on 18 August 2014, and has accordingly ceased to be a subsidiary of PPB.
A10. Changes in contingent liabilities or contingent assets There were no changes in contingent assets and contingent liabilities since the end of the last annual reporting period.
Notes (Cont’d)
32 33
QUARTERLY REPORT • 30 SEPTEMBER 2014INVESTOR UPDATE
Quarterly Report
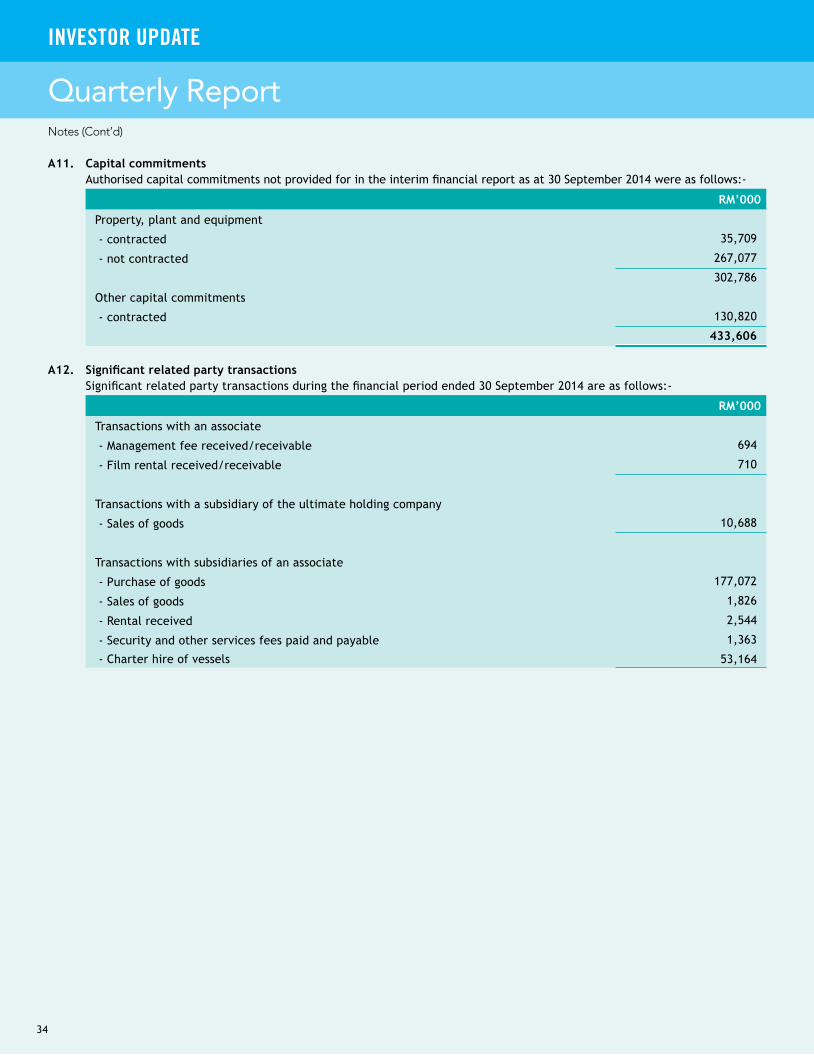
A11. Capital commitments Authorised capital commitments not provided for in the interim financial report as at 30 September 2014 were as follows:-
RM’000
Property, plant and equipment
- contracted 35,709
- not contracted 267,077
302,786
Other capital commitments
- contracted 130,820
433,606
A12. Significant related party transactions Significant related party transactions during the financial period ended 30 September 2014 are as follows:-
RM’000
Transactions with an associate
- Management fee received/receivable 694
- Film rental received/receivable 710
Transactions with a subsidiary of the ultimate holding company
- Sales of goods 10,688
Transactions with subsidiaries of an associate
- Purchase of goods 177,072
- Sales of goods 1,826
- Rental received 2,544
- Security and other services fees paid and payable 1,363
- Charter hire of vessels 53,164
Notes (Cont’d)
34
INVESTOR UPDATE
Quarterly Report

NOTES (CONT’D)
B. BMSB Listing Requirements (Part A of Appendix 9B)B1. Analysis of performance for the financial period to-date
Group revenue increased by 12% to RM928 million in 3Q2014 and 15% to RM2.77 billion for 9M2014 compared with RM830 million in 3Q2013 and RM2.41 billion for 9M2013 respectively. The increase was mainly from the flour and feed milling, and grains trading segment, most of the other segments also recorded growth in revenue.
The Group registered profit before tax of RM366 million in 3Q2014, 25% higher than the RM293 million in 3Q2013. Higher profits were mainly derived from the flour and feed milling, and grains trading segment. For 9M2014, the Group recorded 2% marginally lower profit before tax of RM732 million compared with RM748 million in the same period last year. This was due mainly to lower profit contribution from an associate, Wilmar International Limited (“Wilmar”).
Group financial performance by business segment
3Q2014 3Q2013 Variance
RM'000 RM'000 RM'000 %
Revenue
- Flour and feed milling, and grains trading 587,779 519,863 67,916 13%
- Marketing, distribution and manufacturing of consumer products
112,917 105,774 7,143 7%
- Film exhibition and distribution 89,226 82,024 7,202 9%
- Environmental engineering, waste management and utilities 26,883 19,364 7,519 39%
- Property investment and development 22,578 20,983 1,595 8%
- Chemicals, Livestock, Investments and Other operations 125,432 119,402 6,030 5%
- Elimination (36,850) (37,015) 165
Total revenue 927,965 830,395 97,570 12%
9M2014 9M2013 Variance
RM'000 RM'000 RM'000 %
Revenue
- Flour and feed milling, and grains trading 1,750,078 1,512,451 237,627 16%
- Marketing, distribution and manufacturing of consumer products
337,061 299,236 37,825 13%
- Film exhibition and distribution 274,653 254,422 20,231 8%
- Environmental engineering, waste management and utilities 80,156 65,059 15,097 23%
- Property investment and development 71,033 53,159 17,874 34%
- Chemicals, Livestock, Investments and Other operations 371,399 338,449 32,950 10%
- Elimination (116,586) (110,046) (6,540)
Total Revenue 2,767,794 2,412,730 355,064 15%
Notes (Cont’d)
35
QUARTERLY REPORT • 30 SEPTEMBER 2014
Quarterly Report

Notes (Cont’d)Notes (Cont’d)
3Q2014 3Q2013 Variance
RM'000 RM'000 RM'000 %
Segment results
- Flour and feed milling, and grains trading 76,294 16,786 59,508 >100%
- Marketing, distribution and manufacturing of consumer products
7,646 6,348 1,298 20%
- Film exhibition and distribution 14,758 11,148 3,610 32%
- Environmental engineering, waste management and utilities (203) 2,692 (2,895) >(100%)
- Property investment and development 7,134 7,869 (735) (9%)
- Chemicals, Livestock, Investments and Other operations 3,757 3,901 (144) (4%)
Total segment results 109,386 48,744 60,642 >100%
- Share of associates and joint venture’s profits less losses 257,353 244,753 12,600 5%
- Interest income, finance costs, income from short-term fund placements and unallocated expenses (473) (517) 44 9%
Total profit before tax 366,266 292,980 73,286 25%
9M2014 9M2013 Variance
RM'000 RM'000 RM'000 %
Segment results
- Flour and feed milling, and grains trading 163,594 85,784 77,810 91%
- Marketing, distribution and manufacturing of consumer products
22,800 17,185 5,615 33%
- Film exhibition and distribution 46,839 38,489 8,350 22%
- Environmental engineering, waste management and utilities 794 5,601 (4,807) (86%)
- Property investment and development 23,942 22,248 1,694 8%
- Chemicals, Livestock, Investments and Other operations 18,567 19,971 (1,404) (7%)
Total segment results 276,536 189,278 87,258 46%
- Share of associates and joint venture’s profits less losses 462,033 562,366 (100,333) (18%)
- Interest income, finance costs, income from short-term fund placements and unallocated expenses (6,352) (3,496) (2,856) (82%)
Total profit before tax 732,217 748,148 (15,931) (2%)
36
INVESTOR UPDATE
Quarterly Report
Notes (Cont’d)Notes (Cont’d)
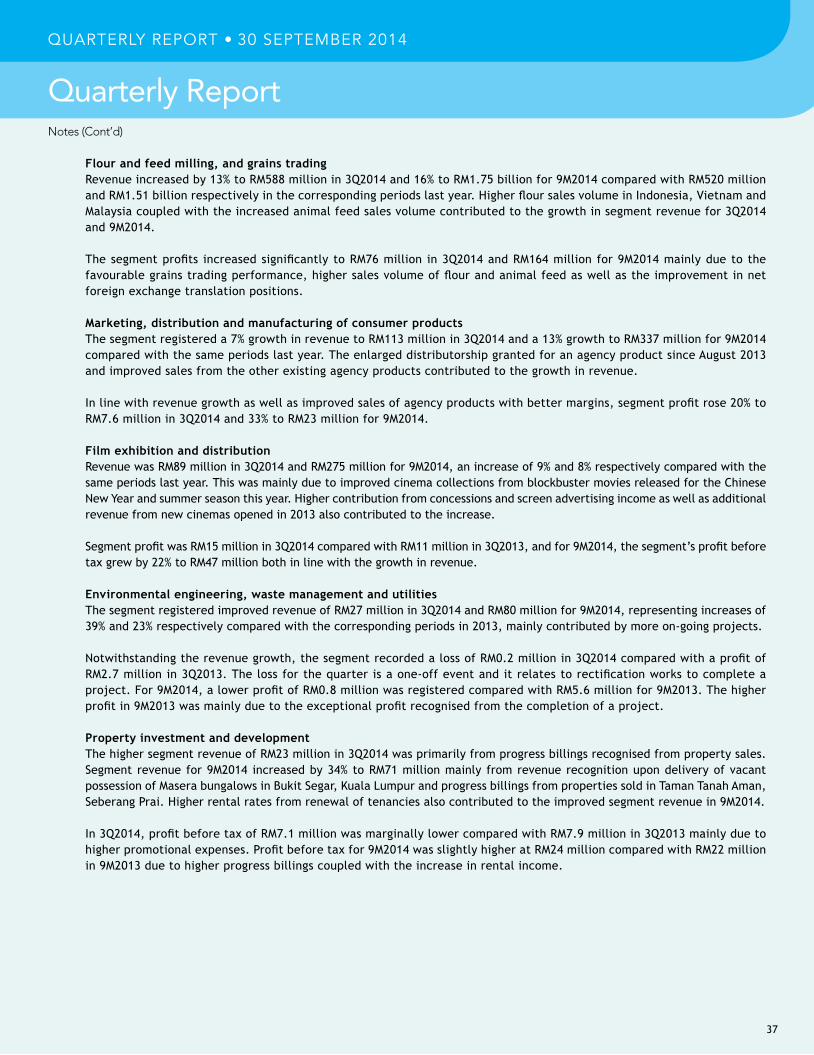
Flour and feed milling, and grains trading Revenue increased by 13% to RM588 million in 3Q2014 and 16% to RM1.75 billion for 9M2014 compared with RM520 million
and RM1.51 billion respectively in the corresponding periods last year. Higher flour sales volume in Indonesia, Vietnam and Malaysia coupled with the increased animal feed sales volume contributed to the growth in segment revenue for 3Q2014 and 9M2014.
The segment profits increased significantly to RM76 million in 3Q2014 and RM164 million for 9M2014 mainly due to the favourable grains trading performance, higher sales volume of flour and animal feed as well as the improvement in net foreign exchange translation positions.
Marketing, distribution and manufacturing of consumer products The segment registered a 7% growth in revenue to RM113 million in 3Q2014 and a 13% growth to RM337 million for 9M2014
compared with the same periods last year. The enlarged distributorship granted for an agency product since August 2013 and improved sales from the other existing agency products contributed to the growth in revenue.
In line with revenue growth as well as improved sales of agency products with better margins, segment profit rose 20% to RM7.6 million in 3Q2014 and 33% to RM23 million for 9M2014.
Film exhibition and distribution Revenue was RM89 million in 3Q2014 and RM275 million for 9M2014, an increase of 9% and 8% respectively compared with the
same periods last year. This was mainly due to improved cinema collections from blockbuster movies released for the Chinese New Year and summer season this year. Higher contribution from concessions and screen advertising income as well as additional revenue from new cinemas opened in 2013 also contributed to the increase.
Segment profit was RM15 million in 3Q2014 compared with RM11 million in 3Q2013, and for 9M2014, the segment’s profit before tax grew by 22% to RM47 million both in line with the growth in revenue.
Environmental engineering, waste management and utilities
The segment registered improved revenue of RM27 million in 3Q2014 and RM80 million for 9M2014, representing increases of 39% and 23% respectively compared with the corresponding periods in 2013, mainly contributed by more on-going projects.
Notwithstanding the revenue growth, the segment recorded a loss of RM0.2 million in 3Q2014 compared with a profit of RM2.7 million in 3Q2013. The loss for the quarter is a one-off event and it relates to rectification works to complete a project. For 9M2014, a lower profit of RM0.8 million was registered compared with RM5.6 million for 9M2013. The higher profit in 9M2013 was mainly due to the exceptional profit recognised from the completion of a project.
Property investment and development The higher segment revenue of RM23 million in 3Q2014 was primarily from progress billings recognised from property sales.
Segment revenue for 9M2014 increased by 34% to RM71 million mainly from revenue recognition upon delivery of vacant possession of Masera bungalows in Bukit Segar, Kuala Lumpur and progress billings from properties sold in Taman Tanah Aman, Seberang Prai. Higher rental rates from renewal of tenancies also contributed to the improved segment revenue in 9M2014.
In 3Q2014, profit before tax of RM7.1 million was marginally lower compared with RM7.9 million in 3Q2013 mainly due to higher promotional expenses. Profit before tax for 9M2014 was slightly higher at RM24 million compared with RM22 million in 9M2013 due to higher progress billings coupled with the increase in rental income.
37
QUARTERLY REPORT • 30 SEPTEMBER 2014
Quarterly Report
Notes (Cont’d)
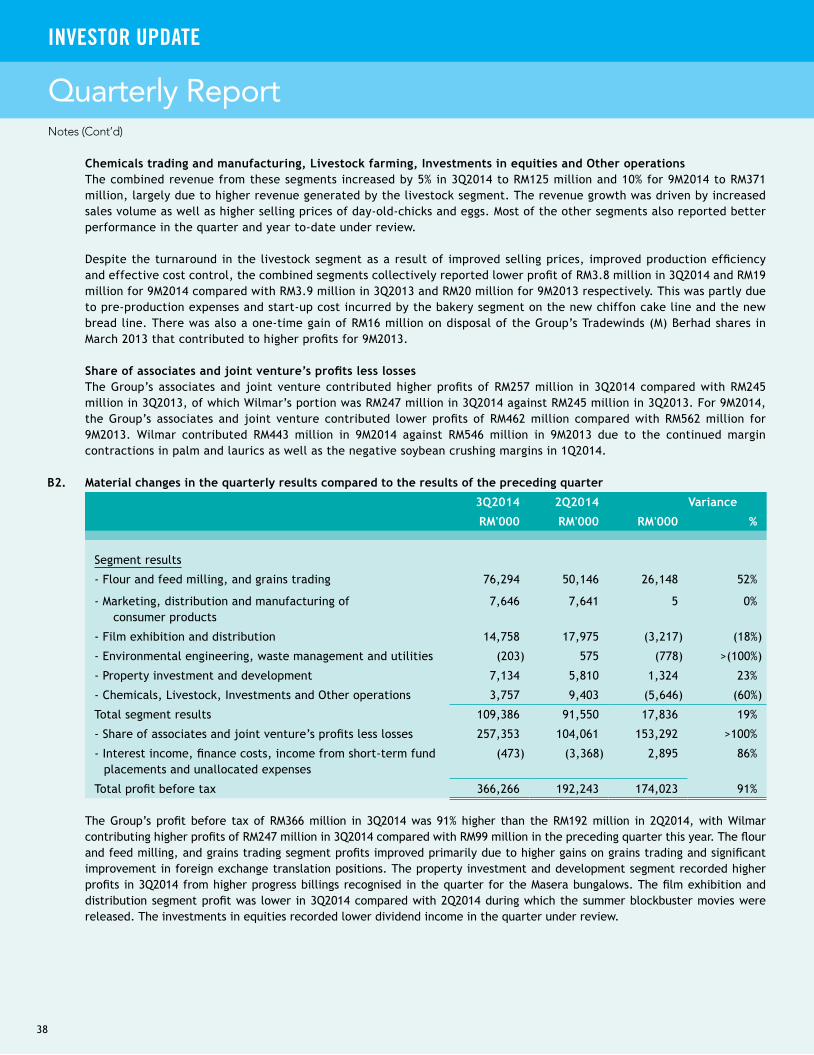
Chemicals trading and manufacturing, Livestock farming, Investments in equities and Other operations The combined revenue from these segments increased by 5% in 3Q2014 to RM125 million and 10% for 9M2014 to RM371
million, largely due to higher revenue generated by the livestock segment. The revenue growth was driven by increased sales volume as well as higher selling prices of day-old-chicks and eggs. Most of the other segments also reported better performance in the quarter and year to-date under review.
Despite the turnaround in the livestock segment as a result of improved selling prices, improved production efficiency and effective cost control, the combined segments collectively reported lower profit of RM3.8 million in 3Q2014 and RM19 million for 9M2014 compared with RM3.9 million in 3Q2013 and RM20 million for 9M2013 respectively. This was partly due to pre-production expenses and start-up cost incurred by the bakery segment on the new chiffon cake line and the new bread line. There was also a one-time gain of RM16 million on disposal of the Group’s Tradewinds (M) Berhad shares in March 2013 that contributed to higher profits for 9M2013.
Share of associates and joint venture’s profits less losses The Group’s associates and joint venture contributed higher profits of RM257 million in 3Q2014 compared with RM245
million in 3Q2013, of which Wilmar’s portion was RM247 million in 3Q2014 against RM245 million in 3Q2013. For 9M2014, the Group’s associates and joint venture contributed lower profits of RM462 million compared with RM562 million for 9M2013. Wilmar contributed RM443 million in 9M2014 against RM546 million in 9M2013 due to the continued margin contractions in palm and laurics as well as the negative soybean crushing margins in 1Q2014.
B2. Material changes in the quarterly results compared to the results of the preceding quarter
3Q2014 2Q2014 Variance
RM'000 RM'000 RM'000 %
Segment results
- Flour and feed milling, and grains trading 76,294 50,146 26,148 52%
- Marketing, distribution and manufacturing of consumer products
7,646 7,641 5 0%
- Film exhibition and distribution 14,758 17,975 (3,217) (18%)
- Environmental engineering, waste management and utilities (203) 575 (778) >(100%)
- Property investment and development 7,134 5,810 1,324 23%
- Chemicals, Livestock, Investments and Other operations 3,757 9,403 (5,646) (60%)
Total segment results 109,386 91,550 17,836 19%
- Share of associates and joint venture’s profits less losses 257,353 104,061 153,292 >100%
- Interest income, finance costs, income from short-term fund placements and unallocated expenses
(473) (3,368) 2,895 86%
Total profit before tax 366,266 192,243 174,023 91%
The Group’s profit before tax of RM366 million in 3Q2014 was 91% higher than the RM192 million in 2Q2014, with Wilmar contributing higher profits of RM247 million in 3Q2014 compared with RM99 million in the preceding quarter this year. The flour and feed milling, and grains trading segment profits improved primarily due to higher gains on grains trading and significant improvement in foreign exchange translation positions. The property investment and development segment recorded higher profits in 3Q2014 from higher progress billings recognised in the quarter for the Masera bungalows. The film exhibition and distribution segment profit was lower in 3Q2014 compared with 2Q2014 during which the summer blockbuster movies were released. The investments in equities recorded lower dividend income in the quarter under review.
Notes (Cont’d)
38
INVESTOR UPDATE
Quarterly Report

Notes (Cont’d)
B3. Prospects for current financial year In Malaysia and Asia generally, domestic demand will remain the key driver of economic growth for this financial year.
The Group’s flour and feed milling, consumer products, film exhibition, farm and bakery businesses are expected to perform well and will be supported by stronger domestic consumption during the year-end festive season. The environmental engineering division’s on-going projects together with finalisation of completed project accounts will contribute positively in the last financial quarter. The property development division is expected to maintain its contribution to the Group.
While the Group’s core businesses are expected to perform well in this financial year; its overall consolidated financial results will continue to be contingent on Wilmar’s business performance.
B4. Variance of actual profit from forecast profit Not applicable.
B5. Profit before taxIndividual Quarter
3 months endedCumulative Quarter
9 months ended30-Sep-14
RM’00030-Sep-14
RM’000
Profit before tax is stated after crediting :-
Dividend income 1,789 8,400
Fair value gain on derivatives 41,810 52,582
Foreign exchange (loss)/gain (2,019) 3,152
Interest income 4,575 13,554
Income from short-term fund placements 2,554 7,181
Rental income 866 2,568
Profit before tax is stated after charging :-
Allowance for doubtful debts and write off of receivables (748) (2,727)
Depreciation and amortisation (27,403) (80,341)
Fair value on derivatives (1,239) (5,553)
Foreign exchange gain/(loss) 2,736 (8,636)
Interest expense (4,204) (15,413)
Loss on liquidation of an associate (506) (506)
Loss on financial assets at fair value through profit or loss (845) (712)
Notes (Cont’d)
39
QUARTERLY REPORT • 30 SEPTEMBER 2014
Quarterly Report

Notes (Cont’d)
B6. TaxationIndividual Quarter
3 months endedCumulative Quarter
9 months ended
Taxation comprises :-30-Sep-14
RM’00030-Sep-14
RM’000
Malaysian taxation based on profit for the periodCurrent 24,515 63,261 Deferred 7,004 7,867
31,519 71,128 Foreign taxation
Current 323 1,493 Deferred 624 665
32,466 73,286 Underprovision
Current 1,043 662 Deferred 193 194
33,702 74,142
The effective tax rate is higher than the average statutory rate for the period mainly due to non-allowable expenses incurred.
B7. Status of corporate proposals There were no corporate proposals announced but not completed as at 19 November 2014.
B8. Group borrowings Total Group borrowings as at 30 September 2014 were as follows :-
Total Secured Unsecured
RM'000 RM'000 RM'000
Long-term bank borrowingsLong-term bank loans (USD) 87,244 87,244 — Hire purchase liabilities 49 49 — Hire purchase liabilities (SGD) 1 1 — Repayments due within the next 12 months (30,593) (30,593) —
56,701 56,701 —
Short-term bank borrowingsBills payable 151,665 — 151,665 Short-term loans 2,650 — 2,650 Short-term loans (USD) 154,016 — 154,016 Short-term loans (IDR) 90,575 — 90,575 Current portion of long-term loans 30,559 30,559 —Hire purchase liabilities 33 33 —Hire purchase liabilities (SGD) 1 1 —
429,499 30,593 398,906 Bank overdrafts 2,953 — 2,953
432,452 30,593 401,859
B9. Material litigation There was no material litigation as at 19 November 2014.
40
INVESTOR UPDATE
Quarterly Report

B10. Dividends The Directors do not recommend the payment of any dividend for the third quarter under review.
Dividends paid Dividends paid for the financial year 2013 and up to the date of this report are as follows :-
Financial Year TypeRate per share(all single tier)
Date paid
2013 Interim dividend 8 sen 27 September 20132013 Final dividend 17 sen 6 June 2014 2014 Interim dividend 7 sen 26 September 2014
B11. Earnings per share The basic earnings per share has been calculated by dividing the Group’s profit for the current financial period attributable
to owners of the parent by 1,185,499,882 ordinary shares in issue during the period.
There is no diluted earnings per share for the current quarter or financial period to-date as there were no dilutive potential ordinary shares.
B12. Disclosure of audit report qualification and status of matters raised There was no qualification in the audit report on the preceding annual financial statements.
B13. Realised and unrealised profits/losses The retained profits of the Group are analysed as follows :-
As at30-Sep-14
As at31-Dec-13
RM'000 RM'000
Total retained profits/(accumulated losses) of the Company and its subsidiaries :-- Realised 12,349,427 12,208,286 - Unrealised (71,136) (77,622)
12,278,291 12,130,664 Total share of retained profits/(accumulated losses) from associates :-
- Realised 129,085 121,849 - Unrealised (1,433) (1,675)- Wilmar International Limited ("Wilmar") * 4,362,752 4,142,851
Total share of retained profits from joint venture :-- Realised 7,643 6,849
16,776,338 16,400,538 Less : consolidation adjustments (2,176,337) (2,149,157)Total Group retained profits as per consolidated accounts 14,600,001 14,251,381
* Wilmar is not required to disclose the breakdown of realised and unrealised profits under the Singapore Financial Reporting Standards and the Singapore Companies Act, Cap 50. As the breakdown may be considered price-sensitive information, it would not be appropriate for Wilmar to selectively disclose such information to any particular shareholder.
Kuala Lumpur By Order of the Board 26 November 2014 Mah Teck Keong Company Secretary
Notes (Cont’d)
41
QUARTERLY REPORT • 30 SEPTEMBER 2014
Quarterly Report
REGISTERED OFFICE:
PPB GROUP BERHAD 8167-W
12th Floor, UBN Tower, 10, Jalan P. Ramlee, 50250 Kuala Lumpur, MalaysiaT 603 2726 0088 F 603 2726 0099 (General) / 603 2726 0198 (Corporate Affairs)E [email protected]
2014
www.ppbgroup.com