Investor Update - · Wells Fargo Retail Banking branches Strong U.S. distribution Retail banking...
25
Investor Update November 2017 © 2017 Wells Fargo & Company. All rights reserved.
Transcript of Investor Update - · Wells Fargo Retail Banking branches Strong U.S. distribution Retail banking...

Investor Update
November 2017
© 2017 Wells Fargo & Company. All rights reserved.

Wells Fargo Vision
“We want to satisfy our customers’
financial needs and help them succeed
financially.”
1
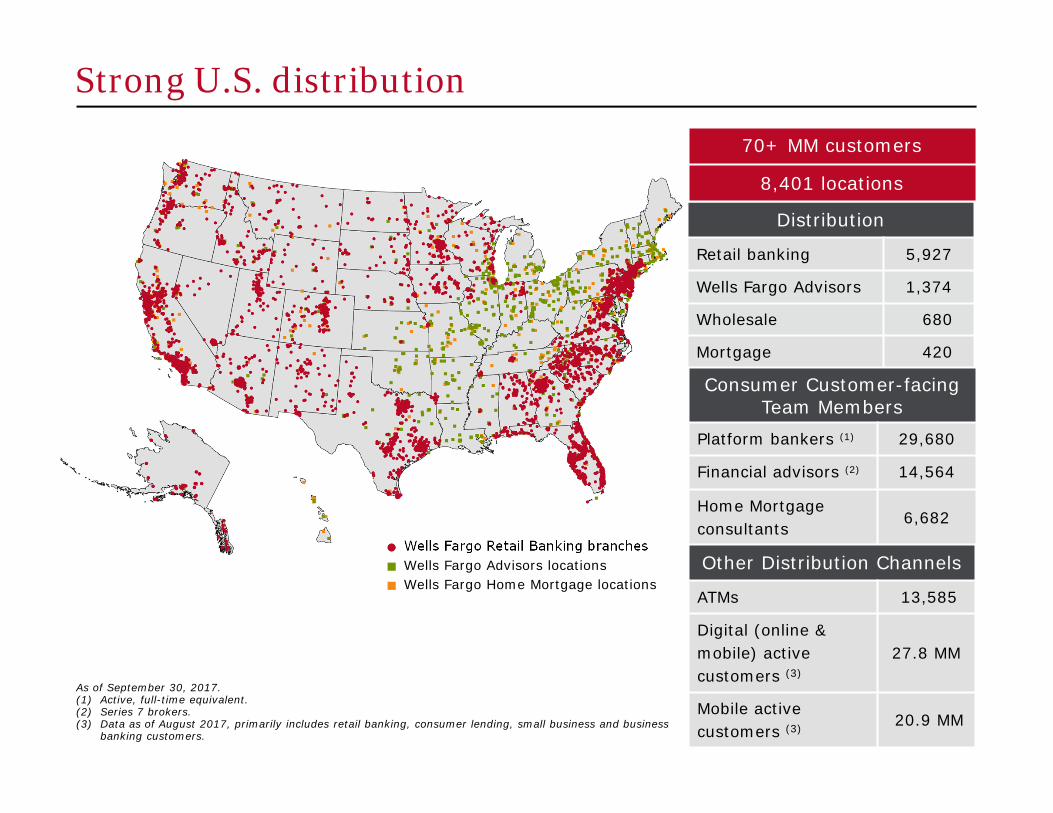
Wells Fargo Retail Banking branches
Strong U.S. distribution
Retail banking 5,927
Wells Fargo Advisors 1,374
Wholesale 680
Mortgage 420
Wells Fargo Advisors locations Wells Fargo Home Mortgage locations
As of September 30, 2017. (1) Active, full-time equivalent. (2) Series 7 brokers. (3) Data as of August 2017, primarily includes retail banking, consumer lending, small business and business
banking customers.
Consumer Customer-facing Team Members
Platform bankers (1) 29,680
Financial advisors (2) 14,564
Home Mortgage consultants
6,682
Other Distribution Channels
ATMs 13,585
Digital (online & mobile) active customers (3)
27.8 MM
Mobile active customers (3) 20.9 MM
Distribution
70+ MM customers
8,401 locations

Leading U.S. lending and deposit franchise
9th Top Company for Diversity (12)
#1 Largest National Workplace Employee Giving Campaign for 8th
consecutive year (13)
#2 in Total Deposits (7) with $1.3T #1 in Retail Deposits (8)
#1 Debit Card Issuer (9)
#3 Full-service Retail Brokerage (10)
#4 Wealth Management Provider (11)
Largest U.S. Lender (1) with $952B in loans #1 Commercial Real Estate Originator (2)
#1 Lead in Middle-market Banking Relationships in U.S. (3)
#1 Residential Mortgage Originator (4)
#1 Small Business Lender (5)
#3 Auto Lender (6)
(1) Financial Reports, based on period-end loans outstanding as of 9/30/2017. (2) Based on 2016 U.S. commercial real estate originations, MBA Commercial Real Estate/Multifamily Finance Firms, 12/31/16. (3) Barlow Research Middle Market Rolling 8 Quarter Data 4Q14-3Q16, showing Wells Fargo’s competitive market performance with companies $25MM-<$500MM in sales. (4) Inside Mortgage Finance, 3Q17 (5) U.S. in dollars per Community Reinvestment Act data, 2016. (6) Autocount, September 2016-August 2017. Based on annual fundings, excludes leases. (7) SNL Financial, based on period-end deposits as of 9/30/2017. (8) FDIC data, SNL Financial, June 2017. Retail deposit data is pro forma for acquisitions and caps deposits at $1 billion in single banking store and excludes credit union deposits. (9) Nilson report, April 2017; total 2016 debit and prepaid transaction volume for consumer and small business. (10) Based on Financial Advisors, internal and peer reports, 3Q17. (11) Based on AUM of accounts > $5 million, Barron’s, 2016. (12) 2017, DiversityInc. (13) In the U.S. based on 2016 donations, 2017, United Way Worldwide.
3

3Q17 Highlights
5,644 5,274 5,457
5,810
4,596
3Q16 4Q16 1Q17 2Q17 3Q17 Diluted earnings per common share
Wells Fargo Net Income($ in millions, except EPS)
$1.03 $0.96
$1.00 $1.07
$0.84
(1) Reserve build represents the amount by which the provision for credit losses exceeds net charge-offs, while reserve release represents the amount by which net charge-offs exceed the provision for credit losses.
(2) Fully phased-in capital ratios are calculated assuming the full phase-in of the Basel III capital rules. See page 22 for additional information regarding the Common Equity Tier 1 capital ratio.
Earnings of $4.6 billion included: - Higher operating losses linked quarter (LQ)
including a $1 billion discrete litigation accrual in the quarter (not tax deductible) for previously disclosed, pre-crisis mortgage-related regulatory investigations
- No reserve build or release (1) in the quarter; allowance for credit losses reflected $450 million of reserve coverage for potential hurricane-related losses based on our initial review of the portfolio
Diluted earnings per common share of $0.84 included a $(0.20) per share impact from the $1 billion discrete litigation accrual
Revenue down 2% year-over-year (YoY) and down 1% LQ reflecting lower noninterest income
Average loans down 1% YoY and stable LQ, and average deposits up 4% YoY and stable LQ
Solid credit quality - Net charge-offs of 30 bps of average loans
(annualized), down 3 bps YoY and up 3 bps LQ - Nonperforming assets down 22% YoY and 5% LQ
Strong capital position - Common Equity Tier 1 ratio (fully phased-in) of
11.82% at 9/30/17 (2)
- Returned $4.0 billion to shareholders through common stock dividends and net share repurchases in 3Q17, up from $3.4 billion in 2Q17
4
Credit quality
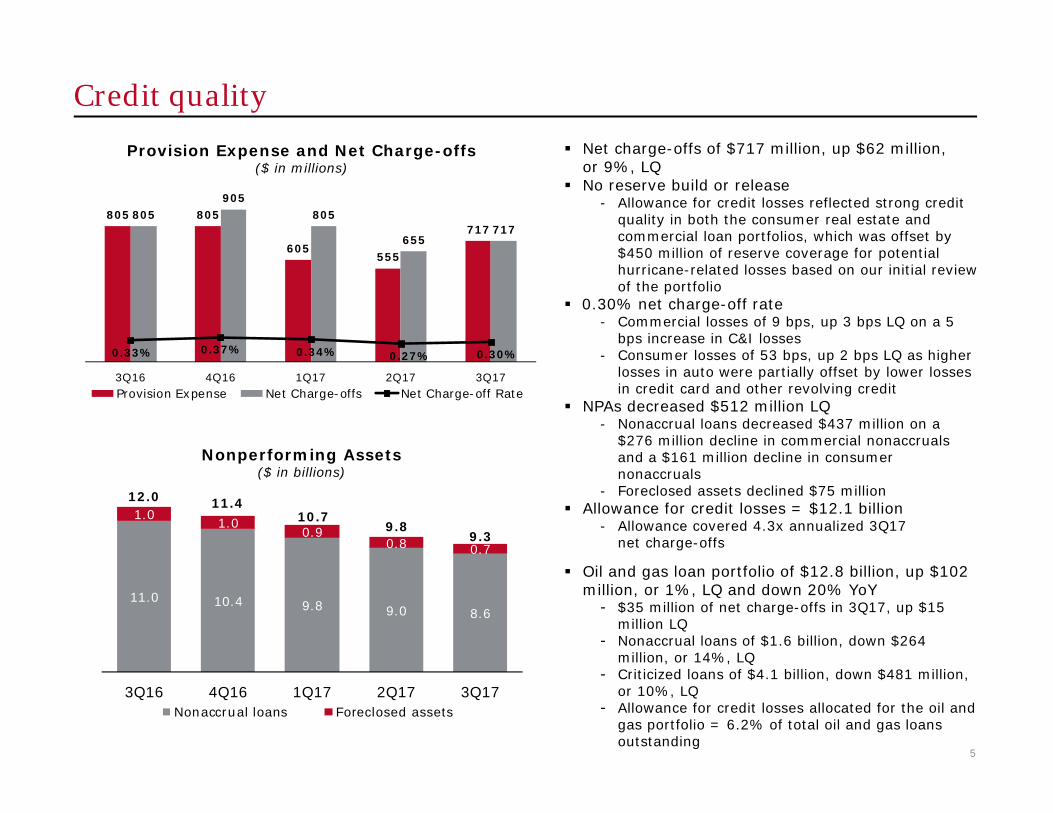
Provision Expense and Net Charge-offs ($ in millions)
905 805 805 805 805
717 717 655
605 555
3Q16 4Q16 1Q17 2Q17 3Q17 Provision Expense Net Charge-offs Net Charge-off Rate
0.33% 0.37% 0.34% 0.27% 0.30%
Nonperforming Assets ($ in billions)
12.0 11.4
11.0 10.4 9.8 9.0 8.6
1.0 1.0 0.9
0.8 0.7
10.7 9.8
9.3
3Q16 4Q16 1Q17 2Q17 3Q17 Nonaccrual loans Foreclosed assets
Net charge-offs of $717 million, up $62 million, or 9%, LQ
No reserve build or release - Allowance for credit losses reflected strong credit
quality in both the consumer real estate and commercial loan portfolios, which was offset by $450 million of reserve coverage for potential hurricane-related losses based on our initial review of the portfolio
0.30% net charge-off rate - Commercial losses of 9 bps, up 3 bps LQ on a 5
bps increase in C&I losses - Consumer losses of 53 bps, up 2 bps LQ as higher
losses in auto were partially offset by lower losses in credit card and other revolving credit
NPAs decreased $512 million LQ - Nonaccrual loans decreased $437 million on a
$276 million decline in commercial nonaccruals and a $161 million decline in consumer nonaccruals
- Foreclosed assets declined $75 million Allowance for credit losses = $12.1 billion
- Allowance covered 4.3x annualized 3Q17 net charge-offs
Oil and gas loan portfolio of $12.8 billion, up $102 million, or 1%, LQ and down 20% YoY
- $35 million of net charge-offs in 3Q17, up $15 million LQ
- Nonaccrual loans of $1.6 billion, down $264 million, or 14%, LQ
- Criticized loans of $4.1 billion, down $481 million, or 10%, LQ
- Allowance for credit losses allocated for the oil and gas portfolio = 6.2% of total oil and gas loans outstanding
5

Capital
Common Equity Tier 1 Ratio (Fully Phased-In) (1)
11.8% 11.6%
11.2% 10.8% 10.7%
3Q16 4Q16 1Q17 2Q17 3Q17
(1) Fully phased-in capital ratios are calculated assuming the full phase-in of the Basel III capital rules. See page 22 for additional information regarding capital ratios.
(2) Net payout ratio means the ratio of (i) common stock dividends and share repurchases less issuances and stock compensation-related items, divided by (ii) net income applicable to common stock.
Capital Position Common Equity Tier 1 ratio well above the
regulatory minimum and our internal target of 10%
- Common Equity Tier 1 ratio (fully phased-in) of 11.82% at 9/30/17 (1) increased LQ primarily due to lower risk-weighted assets (RWA) and higher Common Equity Tier 1
• Lower RWA reflected lower loan balances and commitments, as well as improved RWA efficiencies
Capital Return Period-end common shares outstanding down
38.9 million LQ - Settled 49.0 million common share repurchases - Issued 10.1 million common shares
Capital distributions increased in 3Q17 in line with our 2017 Capital Plan
- Returned $4.0 billion to shareholders in 3Q17, up 16% LQ
- Net share repurchases up 34% LQ - Net payout ratio (2) of 95% in 3Q17
Total Loss Absorbing Capacity (TLAC) Update As of 9/30/2017, we estimate that our eligible
external TLAC as a percentage of total risk-weighted assets was 23.8% compared with an expected 1/1/2019 required minimum of 22.0%
6

Balance Sheet Composition, Funding and Capital Position Balance Sheet Composition, Funding and Capital Position

Balance Sheet composition continues to evolve
Assets ($ in billions)
Liabilities & Equity ($ in billions)
1,935 1,788
15% Cash & Short-16% 5%
10%
21%
49%
term
4% 10%
19%
51%
Investments Trading Assets
1,423
11% & Loans Held 4% 13%
17%
55%
For Sale Other
Investment Securities
Net Loans (1)
4Q12 4Q15 3Q17
Cash & Short-term Investments = 15% of Total Assets, up from 11% in 4Q12
Net loans (1) = 49% of Total Assets, down from 55% in 4Q12
Period-end balances. (1) Net loans are total loans outstanding minus allowance for loan losses.
1,935 1,788
68%
Deposits
1,423 Short-term Borrowings
71%
All Other
Long-term Debt
Equity 5%
69%
4% 5%4%
5% 9%
11%
11%
11%
4%
12%
11%
4Q12 4Q15 3Q17
Funding structure is a source of strength
Deposits = 68% of Total Liabilities & Equity, down from 71% in 4Q12
Long-term Debt = 12% of Total Liabilities & Equity, up from 9% in 4Q12
8

Highly liquid Balance Sheet ($ in billions, period-end balances)
800
700
600
500
400
300
200
100
0
35% 31% 30%
15% 16%
19%
22% 25%
27%
442
29% 28% 28%
572 522
484503
379
326
609 584
30%
25%
20%
15%
29%
272 222
198 10%
5%
0%
Liqu
id a
sset
s to
tot
al a
sset
s
1Q12 3Q12 1Q13 3Q13 1Q14 3Q14 1Q15 3Q15 1Q16 3Q16 1Q17 3Q17
Government and Agency MBS Cash and Short-term Investments Liquid Assets to Total Assets (%)
Cash and short-term investments of $292.3 billion in 3Q17
3Q17 average Liquidity Coverage Ratio (LCR) = 128%, exceeds the regulatory minimum threshold of 100%
9

Rank #6
Deposits remain a competitive advantage
Total Deposits as a % of Total Assets 75%
69% 68%
56% 56% 51%
($ in billions)
261
343
964
1,284
1,307
PNC
USB
C
BAC
WFC
JPM
USB PNC WFC JPM BAC C
Total Deposits Deposits fund 68% of our assets
1,439
Grew deposits $265 billion in four years (3Q13 to 3Q17)
Average deposit cost = 26 bps in 3Q17
Period end data as of September 30, 2017. Source: SNL Financial.
10

Less reliance on market based funding sources than peers
Short-Term Borrowings as a % of Total Assets
23%
4% 3%
7%
14% 15%
5%
1%
7%
11% 13%
20%
5%
1% 3%
12% 12%
21%
5%
1% 3%
12% 14%
21%
WFC PNC USB JPM BAC C
2014 2015 2016 3Q17
As of 9/30/17 ($ in millions) WFC PNC USB JPM BAC C Short-term borrowings 94 5 16 312 309 401 Total assets 1,935 375 459 2,563 2,284 1,889
Period-end balances. Source: SNL Financial.
11

Future non-bank debt maturities are well distributed
Non-Bank Debt Maturities Notional as of September 30, 2017
($ in billions)
$19
$15 $15 $14
$13
$10 $9
$8
$5 $3
2017 2020 2021 2022 2023 2024 2025 20262018 2019
1Q18 5.8 $ 1Q19 2.0$ 2Q18 1.4 $ 2Q19 3.5 $ 3Q18 1.2 $ 3Q19 2.5 $ 4Q18 1.6 $ 4Q19 0.0$
12

External TLAC LTD Requirement
($ in billions) 9/30/17
Actual % of RWA 9/30/17
Actual % of RWA
Updated TLAC requirement
Final Total Loss Absorbing Capacity (TLAC) rule issued on 12/15/16 and effective on January 1, 2019
Total Risk Weighted Assets $ 1,292.8 $ 1,292.8
Common Equity Tier 1 152.8 11.8 % Qualifying Tier 1 instruments 23.8 1.8 Qualifying Tier 2 instruments 25.9 2.0 25.6 2.0 % Senior unsecured debt 102.3 7.9 Total TLAC 127.9 9.9
Required TLAC / LTD 8.0
Estimated Excess / (Shortfall) 24.5 1.9 %
We continue to issue eligible TLAC to fund maturities, RWA growth, and the expected migration of our CET1 level to our internal target level over time
105.5 8.2 308.0 23.8
22.0
$ 23.6 1.8 %
13

Strong capital position
Basel III Capital, Fully Phased-In (1)
Target Structure (2) As of 9/30/17 16.8%16.7%
(Standardized (Advanced Approach) Approach)
13.5%
2.5% 3.1%
2.0% 1.9%
1.6%
1.5%
CET1 Internal Target =
10%
4.5%
2.5%
2.0%
1.0% Internal Buffer
GSIB Surcharge (3)
Capital Conservation
Buffer
Minimum Capital Ratio 4.5%
2.5%
2.0%
3.3%
4.5%
2.5%
2.0%
2.8%
CET1 of 11.82%
(Standardized Approach) exceeded internal
target by 182 bps at
9/30/17
Common Equity Tier 1 (CET1) Tier 1 Capital Tier 2 Capital
Our targets are established through a robust Internal Capital Adequacy Process (ICAAP).
Deployment of accumulated excess capital above our internal target will occur over time and consider the following key factors:
Current and projected risk profile
Operating environment
Regulatory environment including likelihood of changes to regulatory capital requirements and/or stress testing (i.e. Stress capital buffer)
OCI risk in a rising rate environment
Current expected credit loss (CECL) reserve accounting effective 1/1/2020
(1) Capital ratios are calculated assuming the full phase-in of the Basel III capital rules. Under the Basel III capital rules, we are subject to the lower of each of our capital ratios calculated under the Standardized Approach and under the Advanced Approach in the assessment of our capital adequacy. See page 23 for additional information regarding our capital ratios. See the Capital Management section in our Third Quarter 2017 Form 10-Q for additional information on our capital requirements. (2) Estimated long-term targets; subject to change. (3) Reflects Method 2 GSIB surcharge.
14

Update on Actions Taken to Assist Customers and Strengthen Operations and Governance Over the Last Year

Expanded third party review of retail bank accounts
In 3Q17 we announced the completion of a previously announced expanded third party review of retail banking accounts dating back to 2009 - Original account analysis reviewed 93.5 million accounts and covered the time period of May 2011
through mid-2015 - Expanded analysis almost doubled the initial time period and covered back to January 2009 and
forward to September 2016 and reviewed more than 165 million accounts
Original Review Expanded Review Review Period ~4.5 years ~8 years Total Accounts Reviewed 93.5 million 165 million Potentially Unauthorized Accounts Identified ~2.1 million ~3.5 million Accounts that Incurred Fees 130,000 ~190,000 Refunds Paid $3.3 million Additional Refunds to be Paid $2.9 million
As required by the consent orders, the expanded analysis also included a review of online bill pay services - Over the almost 8-year period the analysis identified ~528k potentially unauthorized bill pay
enrollments due to one minimal payment and no further use of the service; Wells Fargo will refund $910k to customers who incurred fees or charges
Wells Fargo has agreed to a $142 million preliminary class action settlement for claims dating back to 2002; customers will be compensated through a third-party process and the final approval hearing is scheduled for 1Q18
With the expanded account analysis complete, the focus will be on remediation and making things right for customers
16

Changes in our retail bank
Changed leadership of the Community Bank
Eliminated product sales goals for retail bank team members who serve customers in our retail branches and in our retail banking contact centers effective October 1, 2016.
Introduced new compensation and performance management programs in the Community Bank in January 2017 that emphasize customer experience and risk management.
Expanded training for retail bank managers and bankers on acceptable sales practices and how to report unethical behavior.
Eliminated a layer of management in the Community Bank in order to bring senior management closer to our customers.
Strengthened oversight and risk controls, including branch audits and branch mystery shopping, as well as targeted conduct risk reviews. Eliminated 24 hour notice on branch control reviews.
Rolling out transformational changes to processes, coaching and customer interaction to take customer experience to a new level.
17

Enterprise-wide actions Strengthened our risk framework and organization by centralizing core functions like Risk,
Compliance and Human Resources to provide greater role clarity, increased coordination and stronger oversight
Formed a new Conduct Management Office that reports to the Chief Risk Officer and centralizes the handling of internal investigations, EthicsLine and ethics oversight, complaints oversight, and sales practice oversight
We engaged outside culture experts to help us understand where we have cultural weaknesses that need to be strengthened or fixed
With the help of an outside academic who specializes in corporate culture, we conducted a confidential culture assessment involving all team members
We made enhancements to the EthicsLine intake process and hired an outside expert to help identify possibilities for additional improvements to make sure team members have a trusted and confidential way to report ethics concerns
We expanded our “Raise Your Hand” initiative encouraging team members to speak up when they see something unethical, and updated and strengthened our non-retaliation policy
We established a process enabling former team members to request a review of their termination or resignation allegedly due to sales performance/culture reasons. Those who are eligible for re-employment have an opportunity to work with a special recruiting team to identify and explore opportunities for re-employment with Wells Fargo
We are surveying team members to understand their views on our approach to ethics and integrity and getting their feedback more generally through “pulse” surveys
18

Board has taken a broad range of decisive actions
Separated the roles of Chairman and CEO and amended By-Laws to require that the Chairman be independent
Promoted executive accountability through executive compensation decisions with a total impact of more than $180 million
Independent directors launched a comprehensive investigation of retail banking sales practices and related matters and released a thorough report of the findings from that investigation
Conducted its 2017 Board self-evaluation, which was facilitated by Mary Jo White, former Chair of the Securities and Exchange Commission, following the 2017 Annual Meeting and in advance of typical year-end timing
Named Elizabeth A. (“Betsy”) Duke, a former member of the Federal Reserve Board of Governors, to succeed Stephen W. Sanger as independent Chair, effective 1/1/18
Elected three new independent directors (Karen B. Peetz, Ronald L. Sargent, and Juan A. Pujadas) in 2017 and refreshed the composition and leadership of various Board committees, including by appointing new chairs of the Risk Committee and Governance and Nominating Committee, effective 9/1/17
- The Board has added 6 new independent directors since 2013 with financial services, regulatory, risk management, financial reporting and accounting, cybersecurity, finance, technology, client services, consumer retail, marketing, and large workforce management experience
Three long-serving directors scheduled to retire from the Board on 12/31/17
Expects to elect up to three additional independent directors before the 2018 Annual Meeting
19

20

Appendix Appendix

Common Equity Tier 1 (Fully Phased-In)
Wells Fargo & Company and Subsidiaries COMMON EQUITY TIER 1 UNDER BASEL III (FULLY PHASED-IN) (1)
(in billions, except ratio) Sep 30,
2017 Jun 30,
2017 Mar 31,
2017 Dec 31,
2016 Sep 30,
2016 Total equity $ 206.8 206.1 202.5 200.5 204.0
Adjustments: Preferred stock (25.6) (25.8) (25.5) (24.6) (24.6) Additional paid-in capital on ESOP
preferred stock (0.1) (0.1) (0.2) (0.1) (0.1)
Unearned ESOP shares 1.9 2.1 2.5 1.6 1.6 Noncontrolling interests (0.9) (0.9) (1.0) (0.9) (1.0)
Total common stockholders' equity 182.1 181.4 178.3 176.5 179.9
Adjustments: Goodwill (26.6) (26.6) (26.7) (26.7) (26.7) Certain identifiable intangible assets (other than
MSRs) (1.9) (2.1) (2.4) (2.7) (3.0)
Other assets (2) (2.3) (2.2) (2.1) (2.1) (2.2) Applicable deferred taxes (3) 1.6 1.6 1.7 1.8 1.8 Investment in certain subsidiaries and other (0.1) (0.2) (0.1) (0.4) (2.0)
Common Equity Tier 1 (Fully Phased-In) under Basel III (A) 152.8 151.9 148.7 146.4 147.8
Total risk-weighted assets (RWAs) under Basel III (4) (B) $ 1,292.8 1,310.5 1,324.5 1,358.9 1,380.0
Common Equity Tier 1 to total RWAs under Basel III (Fully Phased-In) (A)/(B) 11.8% 11.6 11.2 10.8 10.7
(1) Basel III capital rules, adopted by the Federal Reserve Board on July 2, 2013, revised the definition of capital, increased minimum capital ratios, and introduced a minimum Common Equity Tier 1 (CET1) ratio. These rules established a new comprehensive capital framework for U.S. banking organizations that implements the Basel III capital framework and certain provisions of the Dodd-Frank Act. The rules are being phased in through the end of 2021. Fully phased-in capital amounts, ratios and RWAs are calculated assuming the full phase-in of the Basel III capital rules. Fully phased-in regulatory capital amounts, ratios and RWAs are considered non-GAAP financial measures that are used by management, bank regulatory agencies, investors and analysts to assess and monitor the Company’s capital position.
(2) Represents goodwill and other intangibles on nonmarketable equity investments, which are included in other assets. (3) Applicable deferred taxes relate to goodwill and other intangible assets. They were determined by applying the combined federal statutory rate and composite state income
tax rates to the difference between book and tax basis of the respective goodwill and intangible assets at period end. (4) The final Basel III capital rules provide for two capital frameworks: the Standardized Approach, which replaced Basel I, and the Advanced Approach applicable to certain
institutions. Under the final rules, we are subject to the lower of our CET1 ratio calculated under the Standardized Approach and under the Advanced Approach in the assessment of our capital adequacy, which for September 30, June 30 and March 31, 2017, and December 31 and September 30, 2016, was calculated under the Basel III Standardized Approach RWAs.
22

Basel III capital components and ratios (Fully phased-in) Wells Fargo & Company and Subsidiaries Risk-Based Capital Calculation, Components and Ratios (Fully Phased-In) (1)
September 30, 2017
(in billions, except ratios) Advanced Approach Standardized
Approach Total equity $ 206.8 206.8 Adjustments:
Preferred stock (25.6) (25.6) Additional paid-in capital on ESOP preferred stock (0.1) (0.1) Unearned ESOP shares 1.9 1.9 Noncontrolling interests (0.9) (0.9)
Total common stockholders' equity 182.1 182.1 Adjustments:
Goodwill (26.6) (26.6) Certain identifiable intangible assets (other than MSRs) (1.9) (1.9) Other assets (2) (2.3) (2.3) Applicable deferred taxes (3) 1.6 1.6 Investment in certain subsidiaries and other (0.1) (0.1)
Common Equity Tier 1 (Fully Phased-In) (A) $ 152.8 152.8 Adjustments:
Preferred stock 25.6 25.6 Additional paid-in capital on ESOP preferred stock 0.1 0.1 Unearned ESOP shares (1.9) (1.9) Other (0.3) (0.3)
Total Tier 1 capital (Fully Phased-In) (B) $ 176.3 176.3 Adjustments:
Long-term debt and other instruments qualifying as Tier 2 29.2 29.2 Qualifying allowance for credit losses (4) 2.4 12.1 Other (0.3) (0.3)
Total Tier 2 capital (Fully Phased-In) (C) 31.3 41.0 Total qualifying capital (Fully Phased-In) (B)+(C) $ 207.6 217.3
Risk-Weighted Assets (RWAs) (5)(6):
Total RWAs (Fully Phased-In) (D) $ 1,243.4 1,292.8
Common Equity Tier 1 Capital Ratio (A)/(D) 12.29% 11.82 Tier 1 Capital Ratio (B)/(D) 14.18 13.63 Total Capital Ratio (B)+(C)/(D) 16.70 16.81
(1) Fully phased-in regulatory capital amounts, ratios and RWAs are considered non-GAAP financial measures that are used by management, bank regulatory agencies, investors and analysts to assess and monitor the Company’s capital position. (2) Represents goodwill and other intangibles on nonmarketable equity investments, which are included in other assets. (3) Applicable deferred taxes relate to goodwill and other intangible assets. They were determined by applying the combined federal statutory rate and composite state income tax rates to the difference between book and tax basis of the respective goodwill and intangible assets at period end. (4) Under the Advanced Approach the allowance for credit losses that exceeds expected credit losses is eligible for inclusion in Tier 2 Capital, to the extent the excess allowance does not exceed 0.6% of Advanced credit RWAs, and under the Standardized Approach, the allowance for credit losses is includable in Tier 2 Capital up to 1.25% of Standardized credit RWAs, with any excess allowance for credit losses being deducted from total RWAs. (5) RWAs calculated under the Advanced Approach utilize a risk-sensitive methodology, which relies upon the use of internal credit models based upon our experience with internal rating grades. Advanced Approach also includes an operational risk component, which reflects the risk of operating loss resulting from inadequate or failed internal processes or systems. (6) Under the regulatory guidelines for risk-based capital, on-balance sheet assets and credit equivalent amounts of derivatives and off-balance sheet items are assigned to one of several broad risk categories according to the obligor, or, if relevant, the guarantor or the nature of any collateral. The aggregate dollar amount in each risk category is then multiplied by the risk weight associated with that category. The resulting weighted values from each of the risk categories are aggregated for determining total RWAs.
23

Forward-looking statements and additional information
Forward-looking statements: This document contains “forward-looking statements” within the meaning of the Private Securities Litigation Reform Act of 1995. In addition, we may make forward-looking statements in our other documents filed or furnished with the SEC, and our management may make forward-looking statements orally to analysts, investors, representatives of the media and others. Forward-looking statements can be identified by words such as “anticipates,” “intends,” “plans,” “seeks,” “believes,” “estimates,” “expects,” “target,” “projects,” “outlook,” “forecast,” “will,” “may,” “could,” “should,” “can” and similar references to future periods. In particular, forward-looking statements include, but are not limited to, statements we make about: (i) the future operating or financial performance of the Company, including our outlook for future growth; (ii) our noninterest expense and efficiency ratio; (iii) future credit quality and performance, including our expectations regarding future loan losses and allowance levels; (iv) the appropriateness of the allowance for credit losses; (v) our expectations regarding net interest income and net interest margin; (vi) loan growth or the reduction or mitigation of risk in our loan portfolios; (vii) future capital or liquidity levels or targets and our estimated Common Equity Tier 1 ratio under Basel III capital standards; (viii) the performance of our mortgage business and any related exposures; (ix) the expected outcome and impact of legal, regulatory and legislative developments, as well as our expectations regarding compliance therewith; (x) future common stock dividends, common share repurchases and other uses of capital; (xi) our targeted range for return on assets and return on equity; (xii) the outcome of contingencies, such as legal proceedings; and (xiii) the Company’s plans, objectives and strategies. Forward-looking statements are not based on historical facts but instead represent our current expectations and assumptions regarding our business, the economy and other future conditions. Investors are urged to not unduly rely on forward-looking statements as actual results could differ materially from expectations. Forward-looking statements speak only as of the date made, and we do not undertake to update them to reflect changes or events that occur after that date. For more information about factors that could cause actual results to differ materially from expectations, refer to the “Forward-Looking Statements” discussion in Wells Fargo’s press release announcing our third quarter 2017 results and in our most recent Quarterly Report on Form 10-Q, as well as to Wells Fargo’s other reports filed with the Securities and Exchange Commission, including the discussion under “Risk Factors” in our Annual Report on Form 10-K for the year ended December 31, 2016.
Purchased credit-impaired loan portfolios: Loans acquired that were considered credit impaired at acquisition were written down at that date in purchase accounting to an amount estimated to be collectible and the related allowance for loan losses was not carried over to Wells Fargo’s allowance. In addition, such purchased credit-impaired loans are not classified as nonaccrual or nonperforming, and are not included in loans that were contractually 90+ days past due and still accruing. Any losses on such loans are charged against the nonaccretable difference established in purchase accounting and are not reported as charge-offs (until such difference is fully utilized). As a result of accounting for purchased loans with evidence of credit deterioration, certain ratios of Wells Fargo are not comparable to a portfolio that does not include purchased credit-impaired loans. In certain cases, the purchased credit-impaired loans may affect portfolio credit ratios and trends. Management believes that the presentation of information adjusted to exclude the purchased credit-impaired loans provides useful disclosure regarding the credit quality of the non-impaired loan portfolio. Accordingly, certain of the loan balances and credit ratios in this document have been adjusted to exclude the purchased credit-impaired loans. References in this document to impaired loans mean the purchased credit-impaired loans. Please see page 31 of the press release announcing our 3Q17 results for additional information regarding the purchased credit-impaired loans.
24