Investor Update - Ashiana Housing 9 Quarterwise Performance INR Crores Lacs Sqft Lacs Sqft Lacs Sqft...
31
BSE: 523716 | NSE: ASHIANA | Bloomberg: ASFI:IN| Reuters: AHFN.NS www.ashianahousing.com © 2014, Ashiana Housing Limited. All Rights Reserved. Investor Update For the quarter ended 31 st Dec, 2016
Transcript of Investor Update - Ashiana Housing 9 Quarterwise Performance INR Crores Lacs Sqft Lacs Sqft Lacs Sqft...

BSE: 523716 | NSE: ASHIANA | Bloomberg: ASFI:IN| Reuters: AHFN.NS
www.ashianahousing.com
© 2014, Ashiana Housing Limited. All Rights Reserved.
Investor Update
For the quarter ended 31st Dec, 2016

Except for the historical information contained herein, statements in this presentation
and the subsequent discussions, which include words or phrases such as "will", "aim",
"will likely result", "would", "believe", "may", "expect", "will continue", "anticipate",
"estimate", "intend", "plan", "contemplate", "seek to", "future", "objective", "goal", "likely",
"project", "should", "potential", "will pursue", and similar expressions of such expressions
may constitute "forward-looking statements", These forward looking statements involve a
number of risks, uncertainties and other factors that could cause actual results to differ
materially from those suggested by the forward-looking statements. These risks and
uncertainties include, but are not limited to our ability to successfully implement our
strategy, our growth and expansion plans, obtain regulatory approvals, our provisioning
policies, technological changes, investment and business income, cash flow projections,
our exposure to market risks as well as other risks. The Company does not undertake
any obligation to update forward-looking statements to reflect events or circumstances
after the date thereof.
FY2017 2
Safe Harbor
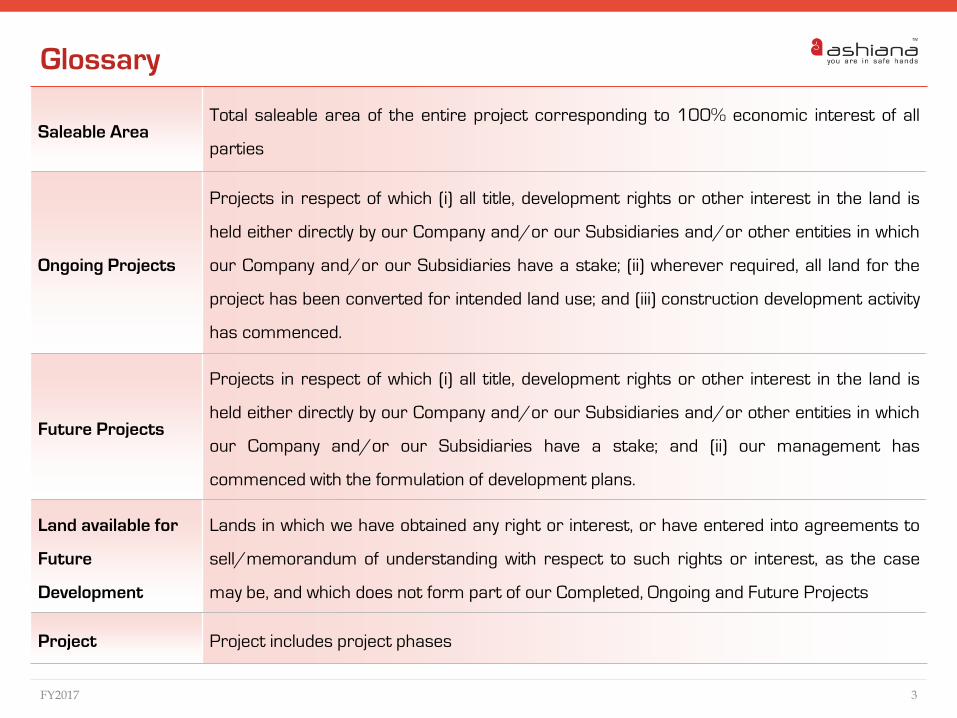
Glossary
FY2017 3
Saleable AreaTotal saleable area of the entire project corresponding to 100% economic interest of all
parties
Ongoing Projects
Projects in respect of which (i) all title, development rights or other interest in the land is
held either directly by our Company and/or our Subsidiaries and/or other entities in which
our Company and/or our Subsidiaries have a stake; (ii) wherever required, all land for the
project has been converted for intended land use; and (iii) construction development activity
has commenced.
Future Projects
Projects in respect of which (i) all title, development rights or other interest in the land is
held either directly by our Company and/or our Subsidiaries and/or other entities in which
our Company and/or our Subsidiaries have a stake; and (ii) our management has
commenced with the formulation of development plans.
Land available for
Future
Development
Lands in which we have obtained any right or interest, or have entered into agreements to
sell/memorandum of understanding with respect to such rights or interest, as the case
may be, and which does not form part of our Completed, Ongoing and Future Projects
Project Project includes project phases

Annexures05
4
Future Outlook04
Financials 03
Ongoing Projects02
Highlights and Overview01
FY2017
Contents
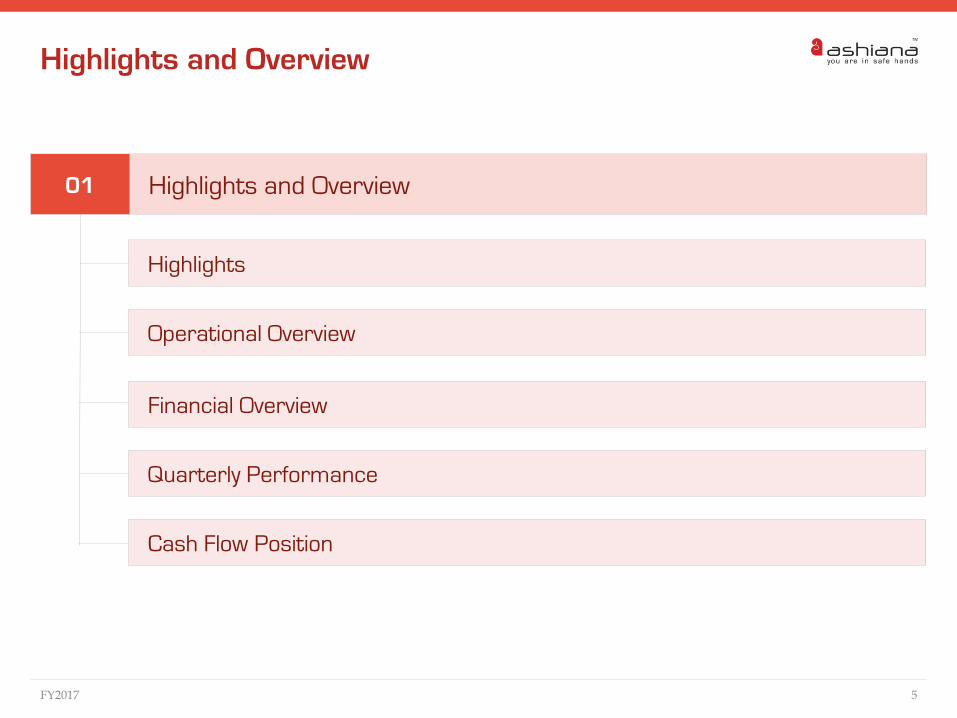
Highlights and Overview01
Highlights
Operational Overview
Financial Overview
FY2017 5
Quarterly Performance
Cash Flow Position
Highlights and Overview
FY2017 6
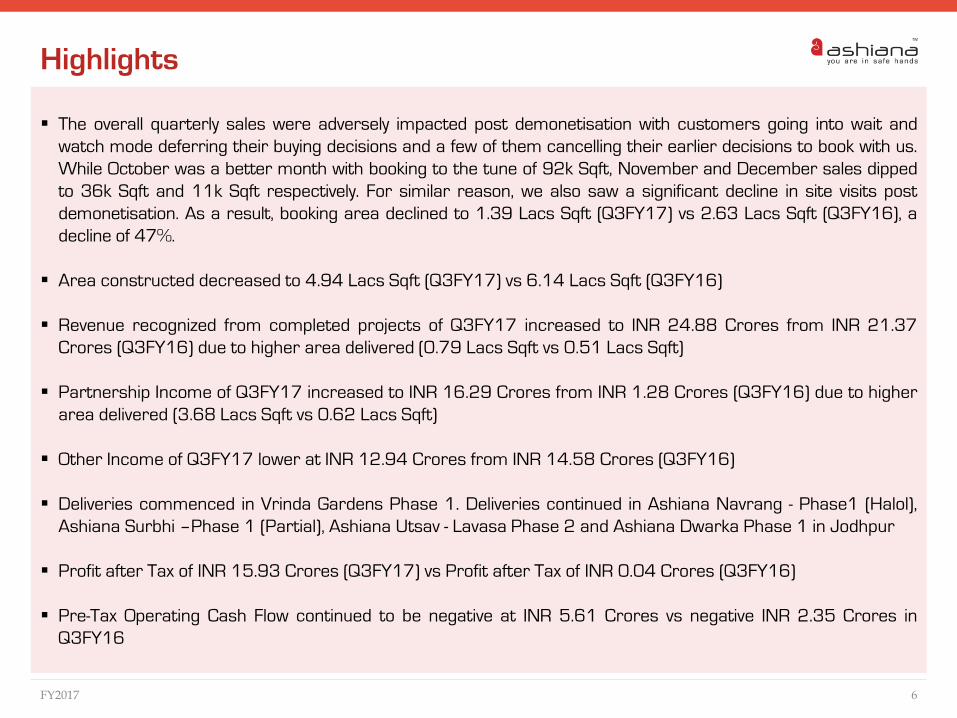
Highlights
The overall quarterly sales were adversely impacted post demonetisation with customers going into wait and
watch mode deferring their buying decisions and a few of them cancelling their earlier decisions to book with us.
While October was a better month with booking to the tune of 92k Sqft, November and December sales dipped
to 36k Sqft and 11k Sqft respectively. For similar reason, we also saw a significant decline in site visits post
demonetisation. As a result, booking area declined to 1.39 Lacs Sqft (Q3FY17) vs 2.63 Lacs Sqft (Q3FY16), a
decline of 47%.
Area constructed decreased to 4.94 Lacs Sqft (Q3FY17) vs 6.14 Lacs Sqft (Q3FY16)
Revenue recognized from completed projects of Q3FY17 increased to INR 24.88 Crores from INR 21.37
Crores (Q3FY16) due to higher area delivered (0.79 Lacs Sqft vs 0.51 Lacs Sqft)
Partnership Income of Q3FY17 increased to INR 16.29 Crores from INR 1.28 Crores (Q3FY16) due to higher
area delivered (3.68 Lacs Sqft vs 0.62 Lacs Sqft)
Other Income of Q3FY17 lower at INR 12.94 Crores from INR 14.58 Crores (Q3FY16)
Deliveries commenced in Vrinda Gardens Phase 1. Deliveries continued in Ashiana Navrang - Phase1 (Halol),
Ashiana Surbhi –Phase 1 (Partial), Ashiana Utsav - Lavasa Phase 2 and Ashiana Dwarka Phase 1 in Jodhpur
Profit after Tax of INR 15.93 Crores (Q3FY17) vs Profit after Tax of INR 0.04 Crores (Q3FY16)
Pre-Tax Operating Cash Flow continued to be negative at INR 5.61 Crores vs negative INR 2.35 Crores in
Q3FY16

Area Booking decreased by 34%
compared to previous quarter and
decreased by 47% compared to
corresponding quarter of previous year
Area Constructed increased by 3%
compared to previous quarter.
FY2017 7
Operational Overview
6.14
2.63
4.81
2.11
4.94
1.39
-
1.00
2.00
3.00
4.00
5.00
6.00
7.00
Equivalent AreaConstructed
Area Booked
La
cs S
qft
Q3FY16 Q2FY17 Q3FY17
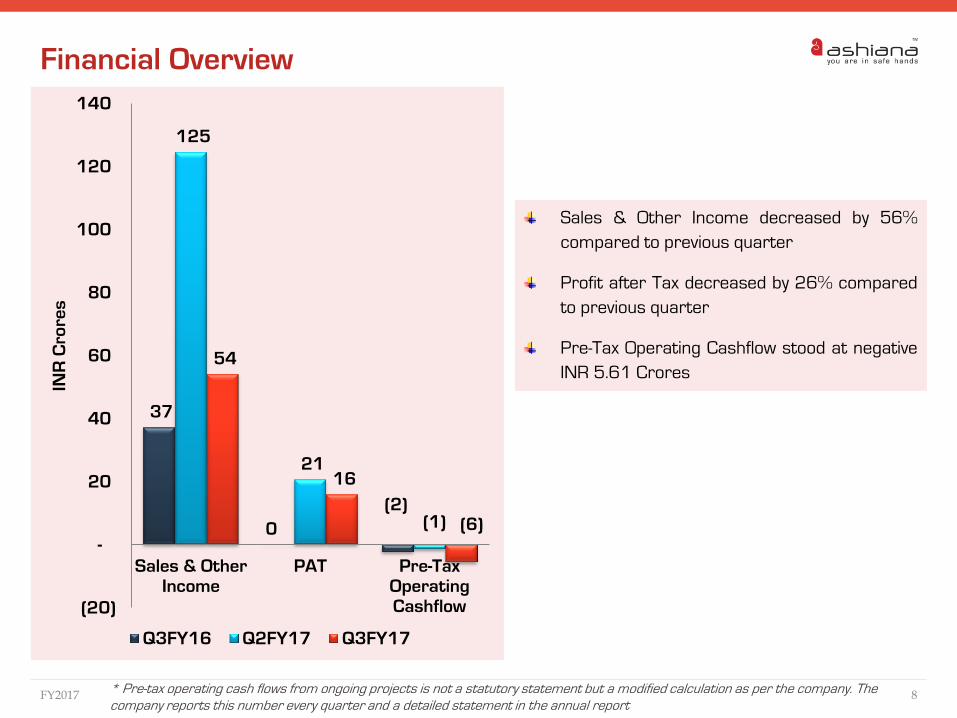
Sales & Other Income decreased by 56%
compared to previous quarter
Profit after Tax decreased by 26% compared
to previous quarter
Pre-Tax Operating Cashflow stood at negative
INR 5.61 Crores
* Pre-tax operating cash flows from ongoing projects is not a statutory statement but a modified calculation as per the company. The
company reports this number every quarter and a detailed statement in the annual report FY2017 8
Financial Overview
37
0
(2)
125
21
(1)
54
16
(6)
(20)
-
20
40
60
80
100
120
140
Sales & OtherIncome
PAT Pre-TaxOperatingCashflow
INR
Cro
res
Q3FY16 Q2FY17 Q3FY17

FY2017 9
Quarterwise Performance
INR Crores Lacs Sqft Lacs Sqft Lacs Sqft
Value of Area
BookedArea Booked
Equivalent Area
Constructed
Area Delivered &
Recognised for
Revenue
AHL 36.60 1.10 3.90 0.79
Partnership 9.19 0.29 1.04 3.68
Total 45.79 1.39 4.94 4.46
AHL 39.81 1.19 3.88 3.69
Partnership 27.61 0.91 0.93 0.07
Total 67.42 2.11 4.81 3.76
AHL 50.83 1.48 3.45 0.40
Partnership 28.54 0.92 0.69 0.16
Total 79.37 2.41 4.15 0.56
AHL 201.41 5.94 17.21 15.07
Partnership 82.80 2.69 6.23 8.53
Total 284.21 8.63 23.44 23.60
AHL 46.29 1.43 4.62 12.45
Partnership 24.33 0.78 1.48 4.30
Total 70.61 2.21 6.10 16.75
AHL 69.31 2.14 4.40 0.51
Partnership 14.41 0.48 1.74 0.62
Total 83.73 2.63 6.14 1.13
AHL 50.14 1.33 4.18 2.10
Partnership 24.98 0.82 1.69 1.28
Total 75.11 2.16 5.87 3.38
AHL 35.67 1.04 4.01 0.02
Partnership 19.08 0.61 1.32 2.34
Total 54.76 1.65 5.33 2.36
FY16 Quarter 2
FY16 Quarter 3
FY16 Quarter 4
FY 16
Particulars
FY17 Quarter 2
FY17 Quarter 1
FY16 Quarter 1
FY17 Quarter 3

10FY2017
Quarterly Sales Trend
Sqft
Project Location FY16 Q1 FY16 Q2 FY16 Q3 FY16 Q4 FY17 Q1 FY17 Q2 FY17 Q3
Ashiana Aangan Neemrana - (1,450) 1,450 - -
Ashiana Aangan Plaza Neemrana 1,026 (251) 251 (1,450)
Ashiana Anantara Jamshedpur 7,560 5,900 37,685 13,540 7,815 1,180 11,940
Ashiana Anmol South of Gurgaon (Sohna) 1,960 19,075 7,505 11,680 14,530 8,190 7,745
Ashiana Tarang Bhiwadi - - 89,530 28,139 6,122 15,332 3,886
Ashiana Town Beta Bhiwadi 16,750 23,364 5,655 4,390 6,395 5,665 6,930
Ashiana Surbhi Bhiwadi 11,670 11,590 3,300 1,100 1,180 3,635 -
Ashiana Nirmay Bhiwadi 12,392 8,595 13,836 9,722 4,393 10,253 25,422
Ashiana - Utsav Bhiwadi 1,480
Ashiana Dwarka Jodhpur 1,390 2,990 3,760 4,140 23,130 5,360 6,910
Ashiana Umang Jaipur 35,615 43,515 37,675 42,870 44,015 44,730 21,740
Ashiana Navrang Halol 4,605 (1,470) 4,155 5,370 1,215 2,685 10,740
Ashiana Shubham Chennai - - - 12,243 25,699 19,075 12,251
Ashiana - Utsav Lavasa (Pune) 7,750 19,735 11,000 10,995 12,430 3,140 2,710
1,04,025 1,33,043 2,14,101 1,42,739 1,48,374 1,19,496 1,10,304
Vrinda Gardens Jaipur 25,955 28,455 19,255 17,250 49,073 47,938 15,862
Gulmohar Gardens Jaipur 34,596 46,481 24,148 49,335 41,560 43,220 12,810
Gulmohar Gardens - Studio
Apartment (GG Plaza) Jaipur - 3,006 3,302 605 (1,210)
Rangoli Gardens Jaipur (1,590) - 4,060 5,700 2,420 - -
Rangoli Gardens Plaza Jaipur 1,557 4,537 (2,283) 4,948 435 - -
60,518 82,479 48,482 77,838 92,278 91,158 28,672
1,64,543 2,15,522 2,62,583 2,20,577 2,40,652 2,10,654 1,38,976
Total - Ashiana Housing Limited
Total - Partnership
Grand Total
Ashiana Housing Limited
Partnership
11FY2017
Projectwise Cash Flow Position in Ongoing ProjectsLacs Sqft Lacs Sqft INR Crores INR Crores Lacs Sqft
Location Project PhasesSaleable
AreaArea Booked
Sale Value of
Area Booked
Amount
Received
Equivalent
Area
Constructed
Bhiwadi Ashiana Town - Beta 3 5.19 2.40 78.65 68.33 4.28
Bhiwadi Surbhi 1 (Partial) & 2 2.80 1.48 41.35 17.72 0.91
Bhiwadi Tarang 1 2.28 1.43 38.45 18.24 0.85
Bhiwadi Nirmay 1 2.18 1.16 41.90 26.61 0.95
Jaipur Umang 1, 2 & 3 9.87 7.66 212.15 192.57 8.13
Jodhpur Dwarka 2 0.96 0.25 6.44 2.31 0.33
Jamshedpur Anantara Aries 0.59 0.59 20.42 13.74 0.49
Pune UTSAV - Lavasa 4 0.63 - - - 0.38
Gujarat Navrang 2 1.40 1.09 20.07 16.68 1.26
Gurgaon Anmol 1 4.16 1.41 68.91 35.11 1.15
Chennai Shubham 1 1.63 0.69 24.32 11.13 0.82
Total - Ashiana Housing Limited 31.69 18.18 552.66 402.44 19.56
Jaipur Gulmohar Gardens 3, 5 & 7 4.41 3.36 87.63 62.39 2.68
JaipurGulmohar Gardens - Studio
Apartment (GG Plaza)6 0.45 0.32 10.28 8.11 0.36
Jaipur Vrinda Gardens 2 & 3 2.65 1.53 50.95 28.78 1.88
Total - Partnership 7.51 5.21 148.86 99.29 4.93
Grand Total 39.21 23.39 701.52 501.73 24.49
Ashiana Housing Limited
Partnership

FY2017 12
Out of a total saleable area of 39.21 Lacs Sqft, 24.49 Lacs Sqft (62%) has already been constructed
Out of the total area booked so far, an amount of around INR 200 Crores is to be received in due course in future
Cash Flow Position in Ongoing Projects
Lacs Sqft Lacs Sqft INR Crores INR Crores Lacs Sqft
EntitySaleable
AreaArea Booked
Sale Value of
Area Booked
Amount
Received
Equivalent
Area
Constructed
Ashiana Housing Limited 31.69 18.18 552.66 402.44 19.56
Partnership 7.51 5.21 148.86 99.29 4.93
Grand Total 39.21 23.39 701.52 501.73 24.49
Ongoing Projects02
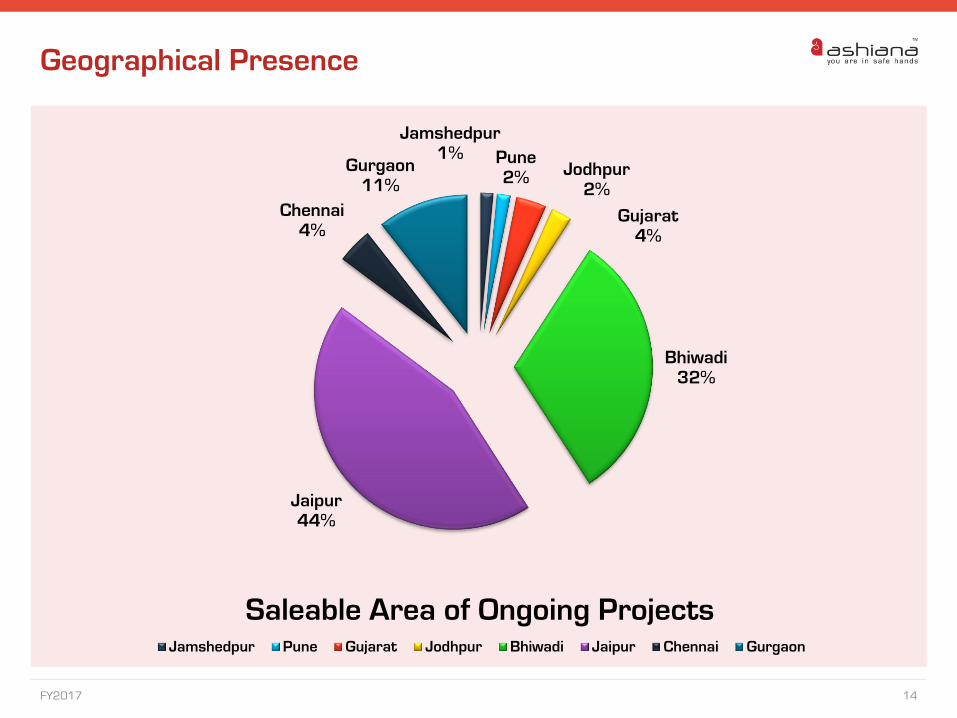
Geographical Presence
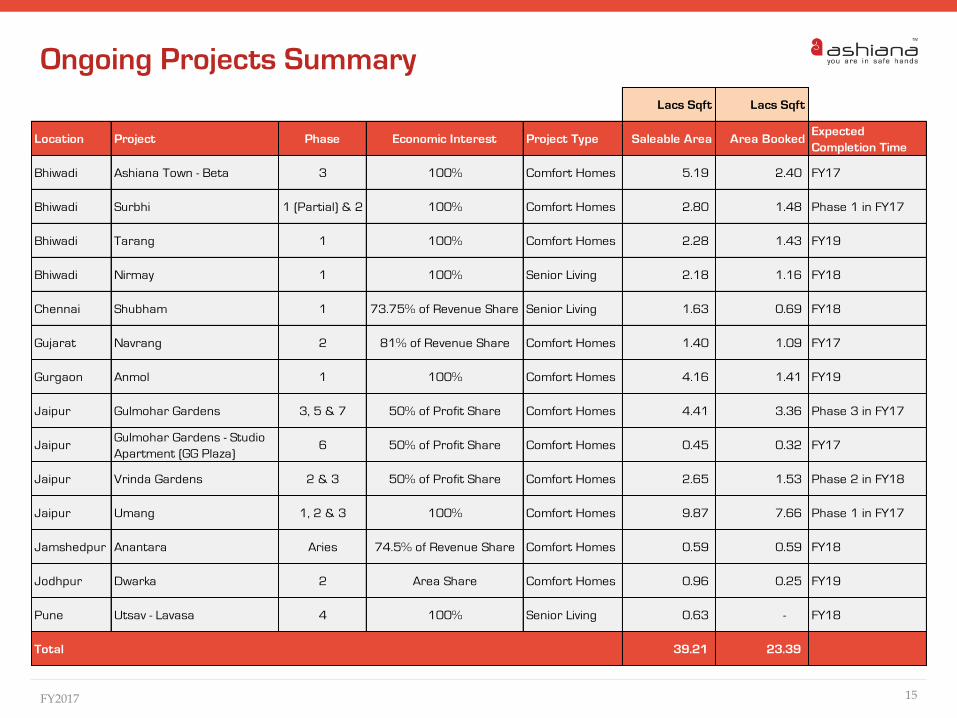
Ongoing Projects Summary
Break up of Area Booked
FY2017 13
Yearly Data and Projections
Quarterly Data
FY2017 14
Geographical Presence
Jamshedpur1% Pune
2%
Gujarat4%
Jodhpur2%
Bhiwadi32%
Jaipur44%
Chennai4%
Gurgaon11%
Saleable Area of Ongoing ProjectsJamshedpur Pune Gujarat Jodhpur Bhiwadi Jaipur Chennai Gurgaon
FY2017 15
Ongoing Projects Summary
Lacs Sqft Lacs Sqft
Location Project Phase Economic Interest Project Type Saleable Area Area BookedExpected
Completion Time
Bhiwadi Ashiana Town - Beta 3 100% Comfort Homes 5.19 2.40 FY17
Bhiwadi Surbhi 1 (Partial) & 2 100% Comfort Homes 2.80 1.48 Phase 1 in FY17
Bhiwadi Tarang 1 100% Comfort Homes 2.28 1.43 FY19
Bhiwadi Nirmay 1 100% Senior Living 2.18 1.16 FY18
Chennai Shubham 1 73.75% of Revenue Share Senior Living 1.63 0.69 FY18
Gujarat Navrang 2 81% of Revenue Share Comfort Homes 1.40 1.09 FY17
Gurgaon Anmol 1 100% Comfort Homes 4.16 1.41 FY19
Jaipur Gulmohar Gardens 3, 5 & 7 50% of Profit Share Comfort Homes 4.41 3.36 Phase 3 in FY17
JaipurGulmohar Gardens - Studio
Apartment (GG Plaza)6 50% of Profit Share Comfort Homes 0.45 0.32 FY17
Jaipur Vrinda Gardens 2 & 3 50% of Profit Share Comfort Homes 2.65 1.53 Phase 2 in FY18
Jaipur Umang 1, 2 & 3 100% Comfort Homes 9.87 7.66 Phase 1 in FY17
Jamshedpur Anantara Aries 74.5% of Revenue Share Comfort Homes 0.59 0.59 FY18
Jodhpur Dwarka 2 Area Share Comfort Homes 0.96 0.25 FY19
Pune Utsav - Lavasa 4 100% Senior Living 0.63 - FY18
Total 39.21 23.39

FY2017 16
Break-Up of Area Booked (QoQ)
Jamshedpur8%
Pune2%
Neemrana-1%
Gujarat8%
Jodhpur5%
Bhiwadi27%
Jaipur35%
Chennai9%
Gurgaon5%
Q3 FY17
Jamshedpur1%
Pune1%
Neemrana0% Gujarat
1%
Jodhpur3%
Bhiwadi17%
Jaipur64%
Chennai9%
Gurgaon4%
Q2 FY17
Jamshedpur3% Pune
5%
Neemrana1%
Gujarat0%
Jodhpur10%
Bhiwadi7%
Jaipur57%
Chennai11%
Gurgaon6%
Q1 FY17
Jamshedpur6% Pune
5%
Neemrana-1%
Gujarat2%
Jodhpur2%
Bhiwadi19%
Jaipur54%
Chennai6%
Gurgaon5%
Q4 FY16

FY2017 17
Improvement in average realization YoY
Yearly Operational Data
Particulars Unit FY 12 FY 13 FY 14 FY 15 FY 16
Equivalent Area Constructed Lacs Sqft 14.62 12.27 17.87 22.8 23.44
Area Booked Lacs Sqft 17.83 18.65 22.13 18.12 8.63
Value of Area Booked INR Lacs 39,038 50,335 64,756 54,772 28,421
Average Realizations INR/ Sqft 2,190 2,699 2,926 3,022 3,293

FY2017 18
Quarterly Operational Data
Particulars Unit Q2 FY16 Q3 FY16 Q4 FY16 Q1 FY17 Q2 FY17 Q3 FY17
Equivalent Area Constructed Lacs Sqft 5.87 6.14 6.10 4.15 4.81 4.94
Area Booked Lacs Sqft 2.16 2.63 2.21 2.41 2.11 1.39
Value of Area Booked INR Lacs 7,511 8,373 7,061 7,937 6,742 4,579
Average Realizations INR/ Sqft 3,477 3,184 3,195 3,293 3,195 3,294

Financials03
Financial Summary YoY
Financial Summary QoQ
FY2017 19

FY2017 20
*Weighted average net worth, considering raising of Rs. 200 crs. QIP funds on 9th Feb, 2015.
Highest ever topline & bottom line in FY 15-16
Financial Summary YoY (Consolidated)
Particulars Unit FY 12 FY 13 FY 14 FY 15 FY 16
Sales and Other Income INR Crores 248.98 161.42 122.80 164.44 536.05
Operating Expenditure INR Crores 159.30 113.75 90.91 105.42 385.47
EBITDA INR Crores 89.67 47.67 31.89 59.02 150.58
Profit After Tax INR Crores 69.55 33.15 21.86 46.49 129.39
Pre - Tax Operating Cash Flows
generated from Ongoing Projects INR Crores 109.67 83.81 125.90 72.58 (10.89)
EBITDA Margin % 36.02% 29.53% 25.97% 35.46% 28.09%
Net Profit /(Net Loss) Margin % 27.94% 20.53% 17.80% 27.99% 24.14%
Return on Average Net Worth % 34.00% 13.00% 7.91% 14.03% 22.15%
Debt to Equity Ratio* 0.04 0.04 0.03 0.06 0.09

FY2017 21
Note : Q1, Q2 & Q3 of FY17 data are after IND - AS adjustment
Decrease in topline & bottom line due to lower area delivered vis a vis previous quarter
Financial Summary QoQ (Consolidated)
Particulars Unit Q2FY16 Q3FY16 Q4FY16 Q1FY17 Q2FY17 Q3FY17
Sales and Other Income INR Crores 83.84 37.23 389.41 24.32 124.60 54.12
Operating Expenditure INR Crores 66.06 33.64 268.06 27.07 88.33 34.54
EBITDA INR Crores 17.78 3.59 121.35 (2.75) 35.38 19.58
Profit/(Loss) After Tax INR Crores 13.35 0.04 109.29 (3.71) 20.69 15.93
Pre - Tax Operating Cash Flows
generated from Ongoing Projects INR Crores (1.49) (2.35) (5.94) (17.47) (1.44) (5.61)
EBITDA Margin % 21.21% 9.64% 31.16% -11.32% 28.39% 36.18%
Net Profit /(Net Loss) Margin % 15.92% 0.11% 28.06% -15.25% 16.61% 29.44%

Future Outlook04
Future Projects Summary
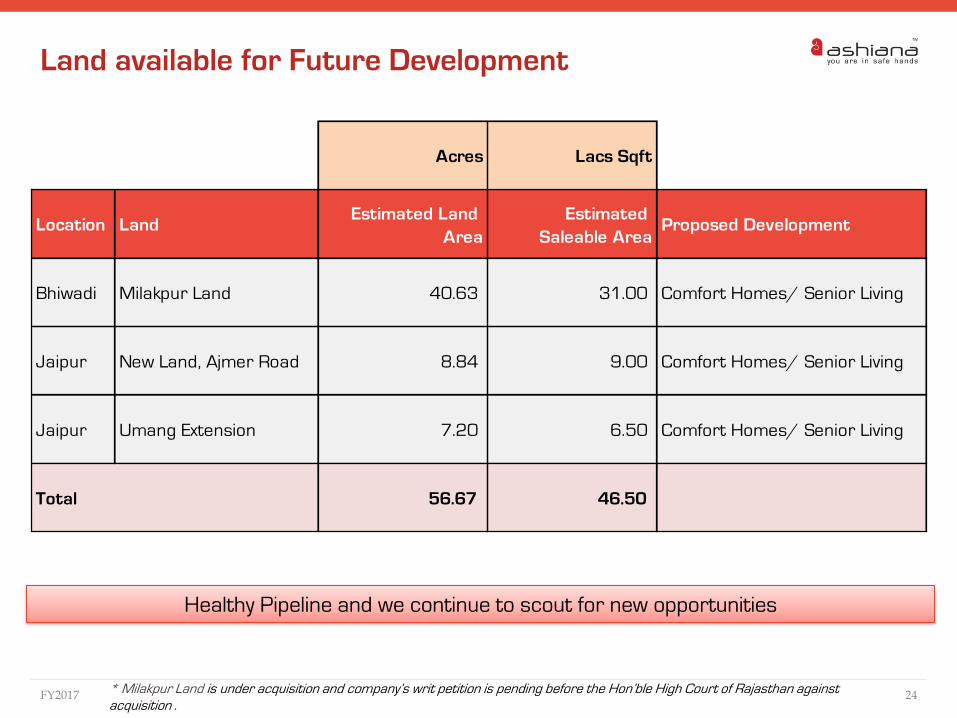
Land available for Future Development
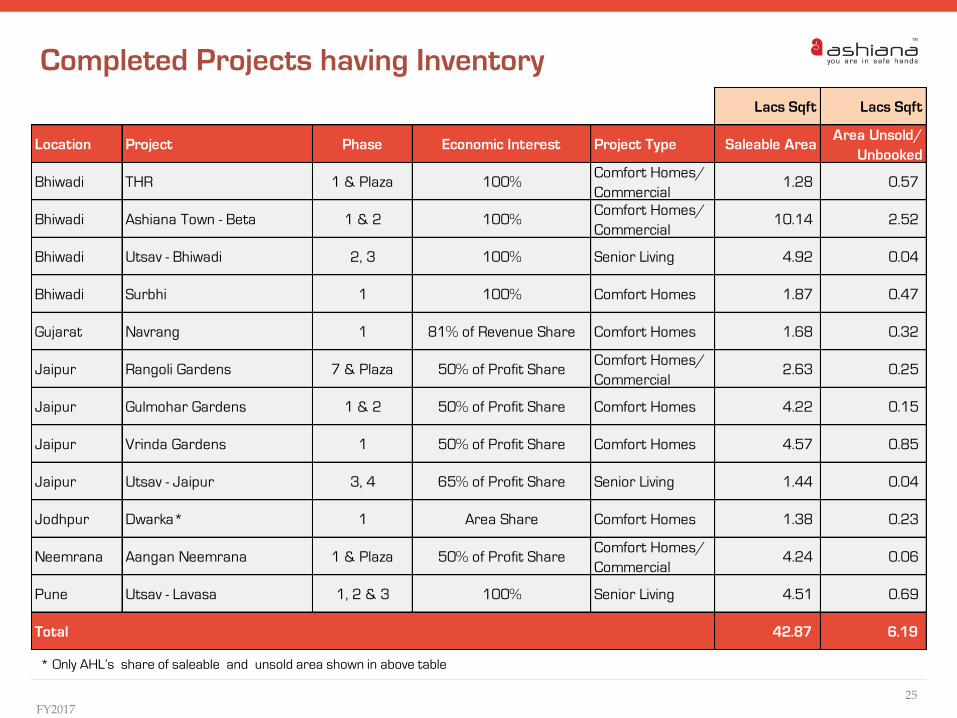
Completed Projects having Inventory
FY2017 22

FY201723
* Only AHL’s share of saleable and sold area shown in above table
Future Projects Summary
Lacs Sqft Lacs Sqft
Location Project Phase Economic Interest Project Type Saleable Area Area Booked
Bhiwadi Ashiana Town - Gamma 1 100% Comfort Homes 18.45 -
Bhiwadi Tarang 2, 3 & 4 100% Comfort Homes 9.32 -
Bhiwadi Nirmay 2 & 3 100% Senior Living 5.68 -
Chennai Shubham 2, 3, 4 & 5 73.75% of Revenue Share Senior Living 8.06 -
Gujarat Navrang 3 & 4 81% of Revenue Share Comfort Homes 3.63 -
Gurgaon Anmol 2 & 3 100% Comfort Homes 7.33 -
Jaipur Gulmohar Gardens 4, & 8 50% of Profit Share Comfort Homes 2.17 -
Jaipur Vrinda Gardens 4 & 5 50% of Profit Share Comfort Homes 7.87 -
Jaipur Umang 4 100% Comfort Homes 2.56 -
Jamshedpur Anand 1, 2 & 3 74% of Revenue Share Comfort Homes 6.83 -
Jodhpur Dwarka* 3, 4 & 5 Area Share Comfort Homes 3.74 -
Kolkata Maitri 1, 2, 3 & 4 85% of Revenue Share Senior Living 8.24 -
Kolkata Nitya 1, 2, 3 & 4 85% of Revenue Share Comfort Homes 6.64 -
Neemrana Aangan Neemrana 2 100% Comfort Homes 4.00 -
Pune Utsav - Lavasa 5 100% Senior Living 0.84 -
Total 95.36 -
FY2017 24* Milakpur Land is under acquisition and company’s writ petition is pending before the Hon’ble High Court of Rajasthan against
acquisition .
Healthy Pipeline and we continue to scout for new opportunities
Land available for Future Development
Acres Lacs Sqft
Location LandEstimated Land
Area
Estimated
Saleable AreaProposed Development
Bhiwadi Milakpur Land 40.63 31.00 Comfort Homes/ Senior Living
Jaipur New Land, Ajmer Road 8.84 9.00 Comfort Homes/ Senior Living
Jaipur Umang Extension 7.20 6.50 Comfort Homes/ Senior Living
Total 56.67 46.50
FY201725
* Only AHL’s share of saleable and unsold area shown in above table
Completed Projects having Inventory
Lacs Sqft Lacs Sqft
Location Project Phase Economic Interest Project Type Saleable AreaArea Unsold/
Unbooked
Bhiwadi THR 1 & Plaza 100%Comfort Homes/
Commercial1.28 0.57
Bhiwadi Ashiana Town - Beta 1 & 2 100%Comfort Homes/
Commercial10.14 2.52
Bhiwadi Utsav - Bhiwadi 2, 3 100% Senior Living 4.92 0.04
Bhiwadi Surbhi 1 100% Comfort Homes 1.87 0.47
Gujarat Navrang 1 81% of Revenue Share Comfort Homes 1.68 0.32
Jaipur Rangoli Gardens 7 & Plaza 50% of Profit ShareComfort Homes/
Commercial2.63 0.25
Jaipur Gulmohar Gardens 1 & 2 50% of Profit Share Comfort Homes 4.22 0.15
Jaipur Vrinda Gardens 1 50% of Profit Share Comfort Homes 4.57 0.85
Jaipur Utsav - Jaipur 3, 4 65% of Profit Share Senior Living 1.44 0.04
Jodhpur Dwarka* 1 Area Share Comfort Homes 1.38 0.23
Neemrana Aangan Neemrana 1 & Plaza 50% of Profit ShareComfort Homes/
Commercial4.24 0.06
Pune Utsav - Lavasa 1, 2 & 3 100% Senior Living 4.51 0.69
Total 42.87 6.19

For Any Queries, Contact
Mr. Rishikesh
(Manager Finance)
Ashiana Housing Ltd.
T: (+91) 11 4265 4265
FY2017 26
Contact Information

Annexure05
About Ashiana
Business Model
Accolades
FY2017 27
Abbreviations

Comfort
Homes
FY201728
Senior
Living
Key Statistics
Networth
Till Dec’16 - INR 684 Crores
FY 16 - INR 646 Crores
Market Cap (As per NSE)
(31st Dec 2016) – INR 1366 Crores
(30th Sep 2016) – INR 1441 Crores
5.487.2
9.4 10.22 10.74
14.6212.27
17.87
22.8 23.4
4.23
6.53 5.26 7.07
13.5
17.83 18.65
22.13
18.12
8.63
FY07 FY08 FY09 FY10 FY11 FY12 FY13 FY14 FY15 FY16
La
cs S
qft
Equivalent Area Constructed (EAC) Area Booked
Promoter & Promoter
Group61%
Individual & Others
21%
Non Institutions
5% FII13%
Shareholding Pattern
About Ashiana

FY2017 29
Business Model
High quality in-
house construction
In house end-to-end construction capabilities – Ensure higher control over cost and
quality and flexibility in execution
Focus on use of high quality and efficient construction methodologies & techniques to
help reduce time and cost
In-house sales and
marketing
Instead of broker-driven model, Ashiana has in-house sales and marketing team
Ensures greater ownership of customers and helps in selling projects to them in future
High proportion of customer referral sales to overall sales due to established brand and
high customer satisfaction level
In-house Facility
Management
Services
Services provided to some of the projects of Ashiana through its wholly owned
subsidiary
Other than facility management and maintenance facilities, resale and renting services
also provided
This acts as a continuous direct customer feedback channel
Land is Raw
Material
Execution based model instead of land banking model
Target land inventory of 5-7 times of current year execution plan

FY2017
Accolades
Sqft: Square Feet
EAC: Equivalent Area Constructed
PAT : Profit after Tax
31FY2017
Abbreviations