Investor Sentiment and Seasoned Equity Offerings · PDF fileInvestor Sentiment and Seasoned...
62
1 Investor Sentiment and Seasoned Equity Offerings Xiaoying Deng a , Emir Hrnjić b and Seow Eng Ong c a,c Department of Real Estate, National University of Singapore, Singapore, 117566 b NUS Business School, National University of Singapore, Singapore, 119245 Preliminary draft: October 29, 2011 First draft: December 14, 2011 This draft: April 16, 2012 Abstract We document that investor sentiment is positively related with pre-SEO overpricing and plays an important role in managers’ equity issuance decisions. Further, we provide evidence that investor sentiment impacts the SEO discounting and underpricing. High sentiment periods are followed by low long run returns suggesting that sentiment does not proxy for unobservable fundamentals. Overall, our findings are consistent with market timing and behavioral explanations for equity offerings. Keywords: Investor Sentiment, Seasoned equity offerings, Market Timing, Behavioral finance, Underwriters, Real Estate Investment Trust Authors’ contact information: a Department of Real Estate, National University of Singapore, 4 Architecture Dr.,Singapore, 117566 E-mail: [email protected] b NUS Business School, National University of Singapore, 15 Kent Ridge Dr, Singapore, 119245 E-mail: [email protected] c Department of Real Estate, National University of Singapore, 4 Architecture Dr.,Singapore, 117566 E-mail: [email protected]
-
Upload
truonghuong -
Category
Documents
-
view
214 -
download
0
Transcript of Investor Sentiment and Seasoned Equity Offerings · PDF fileInvestor Sentiment and Seasoned...
1
Investor Sentiment and Seasoned Equity Offerings
Xiaoying Denga, Emir Hrnjićb and Seow Eng Ongc
a,c Department of Real Estate, National University of Singapore, Singapore, 117566
b NUS Business School, National University of Singapore, Singapore, 119245
Preliminary draft: October 29, 2011
First draft: December 14, 2011 This draft: April 16, 2012
Abstract
We document that investor sentiment is positively related with pre-SEO overpricing and plays an important role in managers’ equity issuance decisions. Further, we provide evidence that investor sentiment impacts the SEO discounting and underpricing. High sentiment periods are followed by low long run returns suggesting that sentiment does not proxy for unobservable fundamentals. Overall, our findings are consistent with market timing and behavioral explanations for equity offerings. Keywords: Investor Sentiment, Seasoned equity offerings, Market Timing, Behavioral finance,
Underwriters, Real Estate Investment Trust
Authors’ contact information: a Department of Real Estate, National University of Singapore, 4 Architecture Dr.,Singapore, 117566 E-mail: [email protected] b NUS Business School, National University of Singapore, 15 Kent Ridge Dr, Singapore, 119245 E-mail: [email protected] c Department of Real Estate, National University of Singapore, 4 Architecture Dr.,Singapore, 117566 E-mail: [email protected]
2
Abstract
We document that investor sentiment is positively related with pre-SEO
overpricing and plays an important role in managers’ equity issuance decisions.
Further, we provide evidence that investor sentiment impacts the SEO
discounting and underpricing. High sentiment periods are followed by low long
run returns suggesting that sentiment does not proxy for unobservable
fundamentals. Overall, our findings are consistent with market timing and
behavioral explanations for equity offerings.
Keywords: Investor Sentiment, Seasoned equity offerings, Market Timing,
Behavioral finance, Underwriters, Real Estate Investment Trust
3
Introduction
Firm’s decision to issue equity is sensitive to fundamental and behavioral market
conditions at the time of issuance. In this paper, we examine the relationship between
investor sentiment and the firm’s seasoned equity offerings (SEO, thereafter). More
specifically, we examine the probability of SEO issuance, SEO pricing, and market
reactions.
It is well documented that firms conduct equity issuance when the shares are
overvalued. In the Graham and Harvey (2001)’s survey, two-thirds public
corporations’ CFOs asserted that“the amount by which our stock is undervalued or
overvalued was an important or very important consideration” in equity issuance
decision. The positive relation between equity issuance and its ex ante indicators of
overvaluation is hard to reconcile with the predictions of trade-off theory and
pecking-order theory (Myers and Majluf 1984) of capital structure. Baker and
Wurgler (2002) propose a market timing theory that managers attempt to sell
overpriced shares to investors if market permits, but leave the question why shares
are mispriced at issuance unanswered. Our paper extends this strain of literature by
answering how firm managers time the market.
Recent advances in behavioral finance suggest that investor sentiment contributes to
stock mispricing. Brown and Cliff (2004) provide the evidence that market pricing
errors are positively related to sentiment. Lemmon and Portniaguina (2006) argue that
investor sentiment explains size premium. Studies in equity offerings document
positive relationship between investor sentiment and IPO underpricing , and negative
4
relationship between sentiment and long run returns (Cornelli, Goldreich and
Ljungqvist 2006; Derrien 2005). While these studies provide the evidence of the
sentiment’s impact on unseasoned equity issues, it remains an open question if these
effects could be generalized to seasoned equity markets since, unlike IPOs, seasoned
firms’ value is established and easily observable in the secondary market. Altinkiliç
and Hansen (2003) and Corwin (2003) empirically examine determinants of SEO
discounting and underpricing. Altinkiliç and Hansen (2003) find that unexpected
underpricing is related to information gathering and marketing activities, whereas
Corwin (2003) documents that underpricing is related to price pressure and
uncertainty. However, none of these papers examine the impact of investor sentiment
-- the main variable in our analysis.1 Finally, Baker and Wurgler (2006) document
that the aggregate fraction of equity issues is higher during high sentiment periods and
high sentiment periods are followed by lower long run returns. While Baker and
Wurgler (2006) focus on the equity issuance at the aggregate level, they do not
examine the impact of investor sentiment on seasoned issues at the individual level.
Our paper fills the gap in the literature.
As a laboratory for our analysis, we use seasoned equity issuance activities of Real
Estate Investment Trusts (REITs, thereafter), which are typically excluded in
corporate finance studies. Created in United States, REITs offer individuals the
opportunities to invest in real properties. REITs are ideal setting for our analysis for
several reasons. First, since REITs do not have to pay corporate tax, there is no tax
benefit for debt issuance. Second, the tax exempt feature requires REITs to distribute
a minimum 90% of their taxable income to investors as dividends, thus, limiting the 1 Corwin (2003) also reports that SEO underpricing is related to the concurrent level of underpricing in IPO market, recognizing that there is a common underlying factor influencing both markets. However, he does not pursue this enquiry further.
5
possibility of free cash flow. Restricted with investment options on real estate assets
and dividend pay-out regulation, REITs rely primarily on external financing to fund
investments and at a higher frequency than general firms. Third, REITs are highly
leveraged firms and as a result, REIT managers have enough incentives to monitor the
equity capital market to balance the costs of different capital. Thus REITs' seasoned
equity issuance decisions and pricing are more likely to be market driven. Fourth,
REITs capital structure is more consistent with market timing theory since the key
drivers behind the traditional capital structure theories are partially silent in REITs
(Ooi, Ong and Li 2010). Also, the similar leverage across REITs enables us to
circumvent capital structure issues that may contaminate equity issuance studies.
Finally, REITs provide us with a unique opportunity to separate sentiment into supply
and demand component.
To the best of our knowledge, this is the first paper to analyze the impact of investor
sentiment on seasoned equity activities and SEO pricing process. The study sample
covers all US listed REITs firms and spans a twenty-four-year period from 1986 to
2009. The empirical results suggest that the equity offerings are strongly influenced
by sentiment investors. Consistent with the market timing and behavioral finance
hypothesis, we observe a strong positive relation between the decision to issue equity
and the investor sentiment. By decomposing pre-SEO market-to-book ratio, we find
that pre-SEO mispricing is positively related with the level of investor sentiment.
Further, we document that investor sentiment is positively related with the SEO
discounting and underpricing, whereas it is negatively related with long run stock
returns. Overall, investor sentiment seems to play an important role in seasoned equity
offerings.

6
Our contributions are manifold. First, we provide evidence that equity offering
decision is influenced by market-wide sentiment. Second, we provide evidence that
sentiment is positively related to pre-SEO mispricing levels, supporting the market
timing setting with investor sentiment. Third, we document evidence that pricing of
SEOs is influenced by sentiment in the short run and the long run. Overall, we
contribute to the existing equity offering literature by providing evidence that
sentiment plays a nontrivial role in market timing and price formation.
This paper proceeds as follows. We review the relevant literature in Section II and
construct our hypotheses in Section III. Section IV describes the data. Section V
discusses the empirical results. Section VI presents the robustness test. Section VII
concludes.
Literature Review
1. investor sentiment and equity offering
Abundance of evidence suggests that overvaluation is a motive for equity issuance
(Graham and Harvey 2001). For example, equity issuance is positively associated
with ex ante indicators of overvaluation like market-to-book ratio and market indices.
(Loughran, Ritter and Rydqvist 1994) find that cumulative IPO volumes are highly
correlated with stock market valuations and this strong relationship is also identified
in seasoned equity issuance (Jung, Kim and Stulz 1996). The evidence of earning
management before equity issuance (Teoh, Welch and Wong 1997) and post-issue
7
long run underperformance (Loughran and Ritter 1997) indicate that managers
attempt to sell overpriced shares to investors if market permits (Baker and Wurgler
2002).
Stein (1996) suggests that managers try to 1) maximize fundamental value by
financing projects to increase the present value of future cash flow, 2) maximize the
current price of the firm’s securities by catering to sentiment investors to capture the
demand side surplus, and 3) exploit the current mispricing for the benefit of current
investors by allowing them to sell the overvalued stocks to over-confident investors.
The solution to this problem indicates that the marginal cost from issuing equity,
deviating from current capital structure, is balanced with marginal issuance benefit,
i.e. the direct market timing gains from over-confident investors and stock mispricing.
The impact of sentiment investors has been examined in the IPO market. (Ljungqvist,
Nanda and Singh 2006) propose that sentiment investors are over-optimistic about the
future prospects for the issuance firms. Rational managers are assumed to make
decisions responding to mispricing by sentiment investors. While their decisions may
maximize the short-run value of the firm, they may also result in lower long-run
values as prices correct. Using ‘grey market’ pre-IPO trading as proxies for investor
sentiment, Cornelli, Goldreich and Ljungqvist (2006) and Dorn (2009) find
correlation with high initial returns and low long-run returns (Derrien 2005).
In the context of REITs, empirical results show that target leverage plays a secondary
role in REITs corporate financing decisions. Ooi, Ong and Li (2010) examine the
public offerings timing attempts in REITs and targeted debt ratios. They point out that
8
REITs time market within a general targeted debt ratio environment. Boudry,
Kallberg and Liu (2010) also recorded strong evidence supporting the market timing
theory in explaining the issuance decisions of REITs.
However, there is no study examining whether investor sentiment influence
managers’ issuance decisions and market reaction to SEO decision. Our paper
provides a detailed examination on the effects of investor sentiment and equity
offerings on REITs.
2. Investor sentiment and equity pricing
In behavioral finance, sentiment investors who trade on “noisy” information drive
temporary price away from intrinsic values(De Long, Shleifer, Summers and
Waldmann 1990). Also, risk exposure and financing constraints limit rational
arbitrageurs’ ability to offsetting against sentiment investors, making price deviate
from fundamental value over time(Shleifer and Vishny 1997). Baker and Wurgler
(2007) interpret investor sentiment as a misguided belief about firm’s risks or future
cash flows growth based on the current information.
Prior literature utilizes several proxies for the investor sentiment. Direct measures of
investor sentiment are derived from surveys like Index of Consumer Sentiment
constructed by Thomson Reuters/University of Michigan, (henceforth, ICS) and
Conference Board Consumer Confidence Index constructed by the Conference Board
(henceforth, CBIND) and survey values from American Association of Individual
Investors. Michigan Consumer Sentiment Index and Conference Board Consumer
9
Confidence Index are used to represent the sentiment in overall market (Lemmon and
Portniaguina 2006), while survey values of American Association of Individual
Investors focus on the perception of retail traders, which are often viewed to be
sentiment investors (Brown and Cliff 2004). Qiu and Welch (2004) compare different
sentiment measures with small firm performance, suggesting that Conference Board
Consumer Confidence Index and Michigan Consumer Sentiment Index better
represent the behavior of sentiment investors. The most prominent indirect measure is
Baker and Wurgler (2006) index (B-W, thereafter) which utilizes several market
variables known to be indicative of sentiment. B-W is calculated as the principal
component from closed end fund discount, dividend premium, NYSE turnover, first
day IPO returns, number of IPOs, and proportion of equity offerings(Campbell, Rhee,
Du and Tang 2008; Sankaraguruswamy and Mian 2008).
Prior studies use different measures of investor sentiment to examine the role of
investor sentiment in asset pricing. Pronounced effect of investor sentiment has been
identified in public stock market over different horizons (Brown and Cliff 2004;
Baker and Wurgler 2007) and cross sectional stock returns (Baker and Wurgler 2006).
In real estate market, existing evidence indicates that investor sentiment also
influences acquisition prices in both private and public commercial real estate
market(Clayton, Ling and Naranjo 2009).
Empirical Implications
The existing behavioral models in literature (Cornelli, Goldreich and Ljungqvist
2006; Ljungqvist, Nanda and Singh 2006; Stein 1996) allow us to make predictions
10
about the relationship between the investor sentiment on one side and firms’ seasoned
equity offering activities, SEO price dynamics, and long run returns.
Managers issue equity in order to take advantage of the inflated share price. Investors
in the market realize that managers are opportunistic and revise firm’s valuation
downwards in response to SEO announcement which leads to the negative effect on
the share price; i.e., negative returns at the announcement day. During high sentiment
periods, which are dominated by overoptimistic sentiment investors, managers have
higher incentive to act opportunistically. Hence, we conjecture that above behavior is
more pronounced during high sentiment periods. So, during high sentiment, we expect
higher overpricing of SEO issuing firms and higher probability of SEO decision. At
the same time, investors adjust for this behavior and, therefore, during high sentiment
periods, SEO announcement is even more negative news. Hence, we conjecture that
this results in more negative returns at the announcement. In sum, this reasoning leads
to following hypotheses:
Hypothesis 1: Pre-SEO stock mispricing is positively related with investor sentiment.
Hypothesis 2: Probability of SEO issuance is positively related to investor sentiment.
Hypothesis 3: SEO announcement return is negatively related with investor
sentiment.
11
Investor sentiment contributes to the marginal benefits of equity issuance, hence
influencing the amount of equity issued. Firms tend to issue more equity at higher
investor sentiment periods. Hence:
Hypothesis 4: Investor sentiment is positively related to the amount issued.
Hypothesis 5: Investor sentiment is positively related to the offer price revision.
In the preceding discussion, we hypothesized that SEO firms act opportunistically and
issue equity when investor sentiment is high and shares are overpriced. However, it is
not obvious how this will influence pricing of the new issue. Managers and
underwriters are aware that market is dominated with sentiment investors and they
may take advantage of their overoptimism and set SEO offer price higher; i.e. at a
smaller discount from previous day closing price. At the same time, new SEO shares
are usually placed with regular investors and underwriter is interested in nurturing
long term relationship with these investors since they will have repeated interactions
in future issues. Since underwriters know that shares are overpriced and will revert to
the true value in the long run, underwriter may decide to protect their regular
investors from long run decline in share price. In that case, they will price SEO shares
lower; i.e. at a larger discount. Ultimately, the impact of investor sentiment on
discounting and first day return is an empirical issue. This reasoning leads us to
following hypotheses.
Hypothesis 6A: Investor sentiment is positively correlated with SEO discounting.
Hypothesis 6B: Investor sentiment is negatively correlated with SEO discounting.
12
Hypothesis 7A: Investor sentiment is positively correlated with SEO first day return.
Hypothesis 7B: Investor sentiment is negatively correlated with SEO first day return.
During high sentiment periods, markets are dominated with overoptimistic investors
and SEO firms are overpriced. Since sentiment investors arrive and leave market
together, valuations will revert to the fundamental value over the long run. This
implies that long run return will be negative. Hence:
Hypothesis 8: Long-run return is negatively correlated with investor sentiment.
Research Design
1. Sample Selection
We analyze the SEOs conducted by REITs firms (SIC code=6798) during January 1,
1986 and December 31, 2009, as reported in the Securities Data Company (SDC)
database. The study period begins from 1986, after the introduction of the Tax
Reform Act, which allows REITs to engage in a variety of real estate activities,
making REITs resort to external financing more frequently. Accounting information
and stock price data are retrieved from COMPUSTAT and the Center for Research in
Security Prices (CRSP). We further restrict the SEO sample to common shares. Our
final sample consists of 994 US REITs SEOs. As we impose other data availability
conditions on SDC, COMPUSTAT and CRSP, some of our findings are based on
samples fewer than 994 SEOs.
13
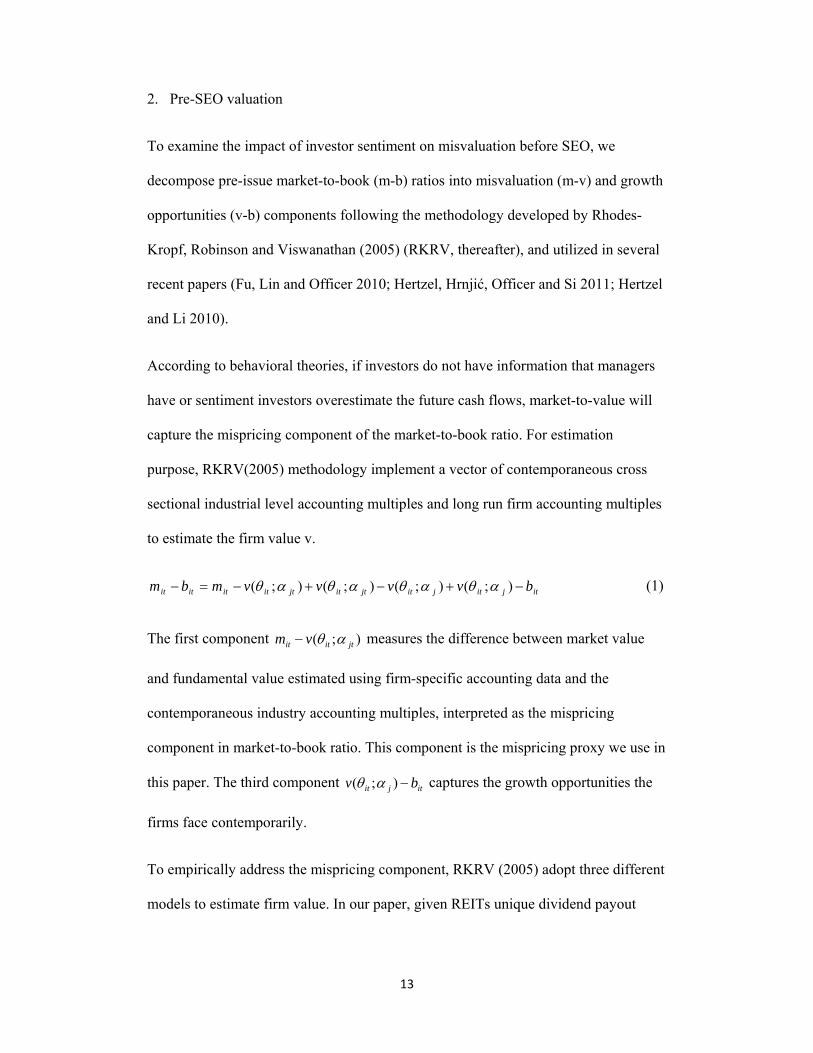
2. Pre-SEO valuation
To examine the impact of investor sentiment on misvaluation before SEO, we
decompose pre-issue market-to-book (m-b) ratios into misvaluation (m-v) and growth
opportunities (v-b) components following the methodology developed by Rhodes-
Kropf, Robinson and Viswanathan (2005) (RKRV, thereafter), and utilized in several
recent papers (Fu, Lin and Officer 2010; Hertzel, Hrnjić, Officer and Si 2011; Hertzel
and Li 2010).
According to behavioral theories, if investors do not have information that managers
have or sentiment investors overestimate the future cash flows, market-to-value will
capture the mispricing component of the market-to-book ratio. For estimation
purpose, RKRV(2005) methodology implement a vector of contemporaneous cross
sectional industrial level accounting multiples and long run firm accounting multiples
to estimate the firm value v.
itjitjitjtitjtitititit bvvvvmbm );();();();( (1)
The first component );( jtitit vm measures the difference between market value
and fundamental value estimated using firm-specific accounting data and the
contemporaneous industry accounting multiples, interpreted as the mispricing
component in market-to-book ratio. This component is the mispricing proxy we use in
this paper. The third component itjit bv );( captures the growth opportunities the
firms face contemporarily.
To empirically address the mispricing component, RKRV (2005) adopt three different
models to estimate firm value. In our paper, given REITs unique dividend payout
14
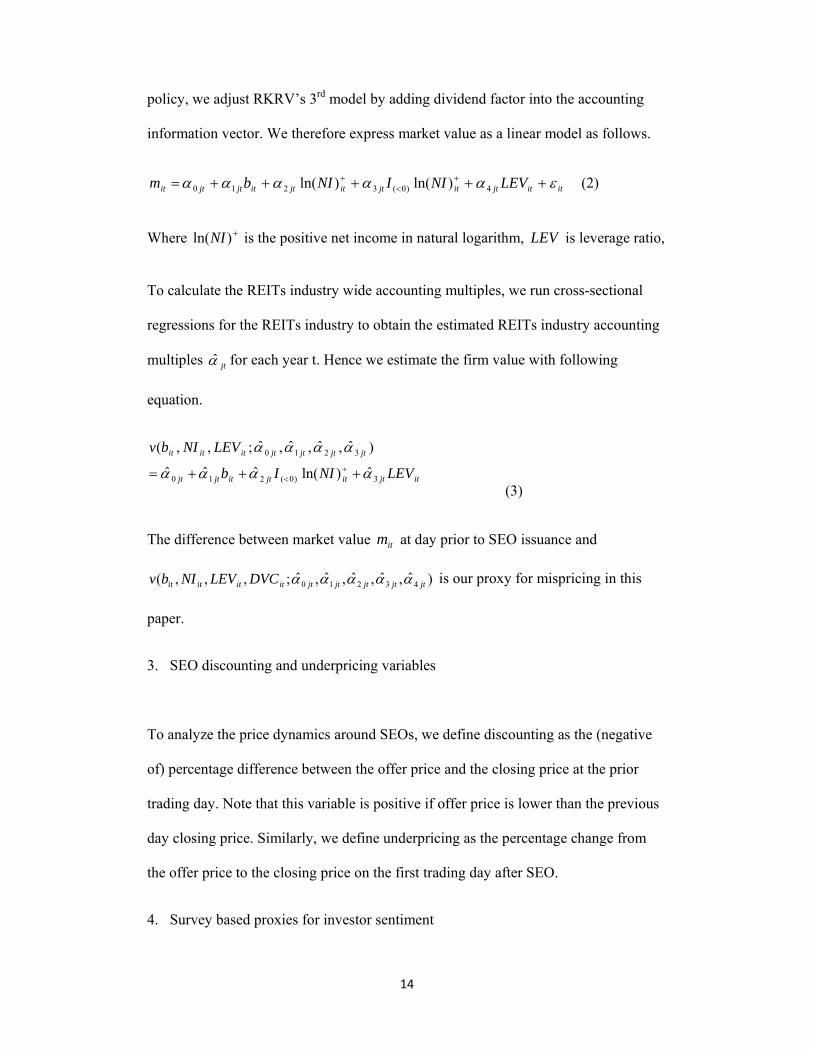
policy, we adjust RKRV’s 3rd model by adding dividend factor into the accounting
information vector. We therefore express market value as a linear model as follows.
ititjtitjtitjtitjtjtit LEVNIINIbm
4)0(3210 )ln()ln( (2)
Where )ln(NI is the positive net income in natural logarithm, LEV is leverage ratio,
To calculate the REITs industry wide accounting multiples, we run cross-sectional
regressions for the REITs industry to obtain the estimated REITs industry accounting
multiples jt̂ for each year t. Hence we estimate the firm value with following
equation.
itjtitjtitjtjt
jtjtjtjtititit
LEVNIIb
LEVNIbv
3)0(210
3210
ˆ)ln(ˆˆˆ
)ˆ,ˆ,ˆ,ˆ;,,(
(3)
The difference between market value itm at day prior to SEO issuance and
)ˆ,ˆ,ˆ,ˆ,ˆ;,,,( 43210 jtjtjtjtjtitititit DVCLEVNIbv is our proxy for mispricing in this
paper.
3. SEO discounting and underpricing variables
To analyze the price dynamics around SEOs, we define discounting as the (negative
of) percentage difference between the offer price and the closing price at the prior
trading day. Note that this variable is positive if offer price is lower than the previous
day closing price. Similarly, we define underpricing as the percentage change from
the offer price to the closing price on the first trading day after SEO.
4. Survey based proxies for investor sentiment

15
Researchers adopt both direct and indirect approaches to quantify investor sentiment.
In this paper, we adopt the survey based indices as proxies to capture the investor
sentiment. In robustness test, we implement indirect measure of investor sentiment to
verify the results.
Investor sentiment is addressed in the Survey of Consumers constructed by Thomson
Reuters/University of Michigan and Research Centre and Consumer Confidence
Survey constructed by the Conference Board, both of which are shown to be valid
measure of investor sentiment in Qiu and Welch (2004) and Lemmon and
Portniaguina (2006). The monthly surveys conducted by Thomson Reuters/University
of Michigan use around fifty core questions that reflect respondents’ attitudes and
expectations about overall economic conditions and personal finances. Based on the
interviews from at least 500 households across the States, the Index of Consumer
Sentiment is developed. Likewise, the Index of Consumer Confidence of the
Conference Board is constructed monthly based interviews about customers’
perceptions of economic conditions in the States. And the sample size is around five
thousand households, larger compared with the sample size used in the Index of
Consumer Sentiment.
As REITs bridge both financial market and real estate, it is plausible that REITs
equity issuance is influenced by real estate market sentiment as well. The survey data
allow us to further differentiate real estate market sentiment into investor sentiment of
real estate market (the demand side) and the supplier sentiment of the real estate
market (the supply side). Investor sentiment of real estate market (the demand side) is
also addressed in the buying condition survey conducted by Thomson
Reuters/University of Michigan. The survey is conducted on a sample of 500
households about their opinion to purchase a property: good, bad and uncertain, and
16
labels these responses with ten different reasons. The examples of reasons are that
prices will increase, it is a good investment and it is good time, etc. Those responses
are used to calculate the relative value of buyers’ perception of real estate market.
And to measure supplier sentiment of real estate market (the supply side), we use the
NAHB/Wells Fargo Housing Market Index constructed by the National Association
of Home Builders. The survey is conducted monthly on a sample of four hundred
builders about their attitudes toward house sales and potential buyers. The
NAHB/Wells Fargo Housing Market Index is developed as a weighted average of
those responses, reflecting builders’ perceptions of sales conditions in real estate
market.
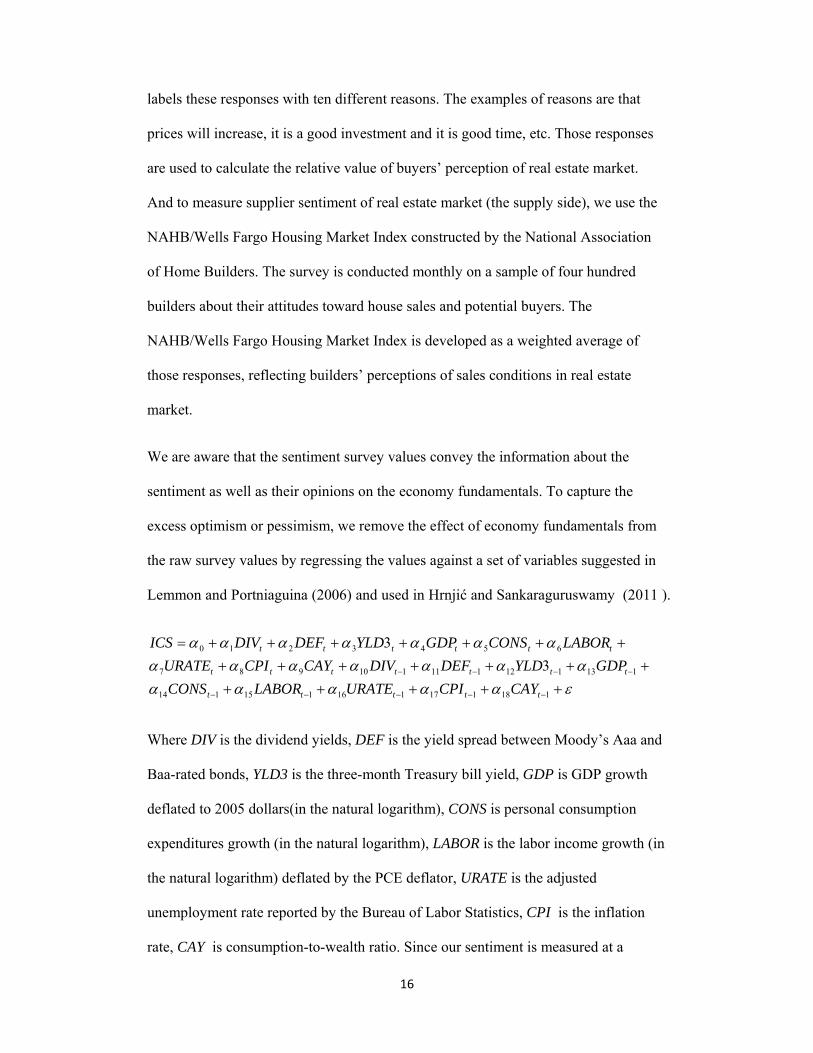
We are aware that the sentiment survey values convey the information about the
sentiment as well as their opinions on the economy fundamentals. To capture the
excess optimism or pessimism, we remove the effect of economy fundamentals from
the raw survey values by regressing the values against a set of variables suggested in
Lemmon and Portniaguina (2006) and used in Hrnjić and Sankaraguruswamy (2011 ).
118117116115114
113112111110987
6543210
3
3
ttttt
ttttttt
tttttt
CAYCPIURATELABORCONS
GDPYLDDEFDIVCAYCPIURATE
LABORCONSGDPYLDDEFDIVICS
Where DIV is the dividend yields, DEF is the yield spread between Moody’s Aaa and
Baa-rated bonds, YLD3 is the three-month Treasury bill yield, GDP is GDP growth
deflated to 2005 dollars(in the natural logarithm), CONS is personal consumption
expenditures growth (in the natural logarithm), LABOR is the labor income growth (in
the natural logarithm) deflated by the PCE deflator, URATE is the adjusted
unemployment rate reported by the Bureau of Labor Statistics, CPI is the inflation
rate, CAY is consumption-to-wealth ratio. Since our sentiment is measured at a
17
monthly frequency, for some macro data which are reported on a quarterly basis, we
take the same value for all months in a certain quarter.
The residual from the above equation is labeled ICSR. If we use CBIND, BC, and
HMI as a proxy for sentiment residual are labeled CBINDR , BCR, and HMIR,
respectively. ICSR and CBINDR denote the excess optimism or pessimism of
consumers and is our proxy for investor sentiment. BCR denote the excess optimism
or pessimism of housing buyers and is our proxy for real estate sentiment from
demand side, while HMIR is our proxy for real estate sentiment from the supply side.
5. Control variables
To analyze the impact of investor sentiment on SEO price dynamics, we also control
for other determinants of price dynamics that have been documented in prior studies.
Offer size (Size) is the relative SEO offer size (number of shares offered multiplied by
offer price) scaled by market capitalization of the issuing firm (Altinkiliç and Hansen
2003; Brounen and Eichholtz 2001). Uranking is the underwriter
reputation(Safieddine and Wilhelm Jr 1996). We also add total assets (Asset) and sale
(Sale) to control for firm size. Leverage (Lev) and leverage change from the previous
period (Clev) allow us to further capture the impact of leverage as recorded in the
literature (Brounen and Eichholtz 2001). SeqREIT is constructed as the current SEO
sequence regarding the REIT itself to account for the clustering and frequency of SEO
(Ghosh, Nag and Sirmans 2000). Yearslisted is the number of years between the SEO
year and the IPO year to measure the growth level of the firm as suggested in
(DeAngelo, DeAngelo and Stulz 2010).
We are mindful that market conditions influence price dynamics around SEOs.
Specifically, instead of using past stock returns, we compute the risk premium
18
(Rpremia) over the past 1 month prior to issue date. Also we use the 6 month
government bond yield (Byield) to measure the attractiveness of the equity offering.
We are aware that the time-varying growth opportunities might also be responsible for
some of our analysis(Yung, Çolak and Wei 2008). Hence we use the third component
(Growth) of RKRV(2005) market-to-book decomposition as described previously to
control for the market reaction associated with growth/ investment opportunities. We
use the abnormal return around earning announcement releases (Infoas) as a measure
of information asymmetry suggested for stock mispricing (Lowry, 2003)
Dummy variables are also included. EQUI equals to one if the firm is an equity REIT,
zero otherwise. MORT equals to one if the firm is a mortgage REIT, zero otherwise.
NASDAQ equals to one if the firm is listed on NASDAQ, zero otherwise(Mola and
Loughran 2004).
Results Interpretation
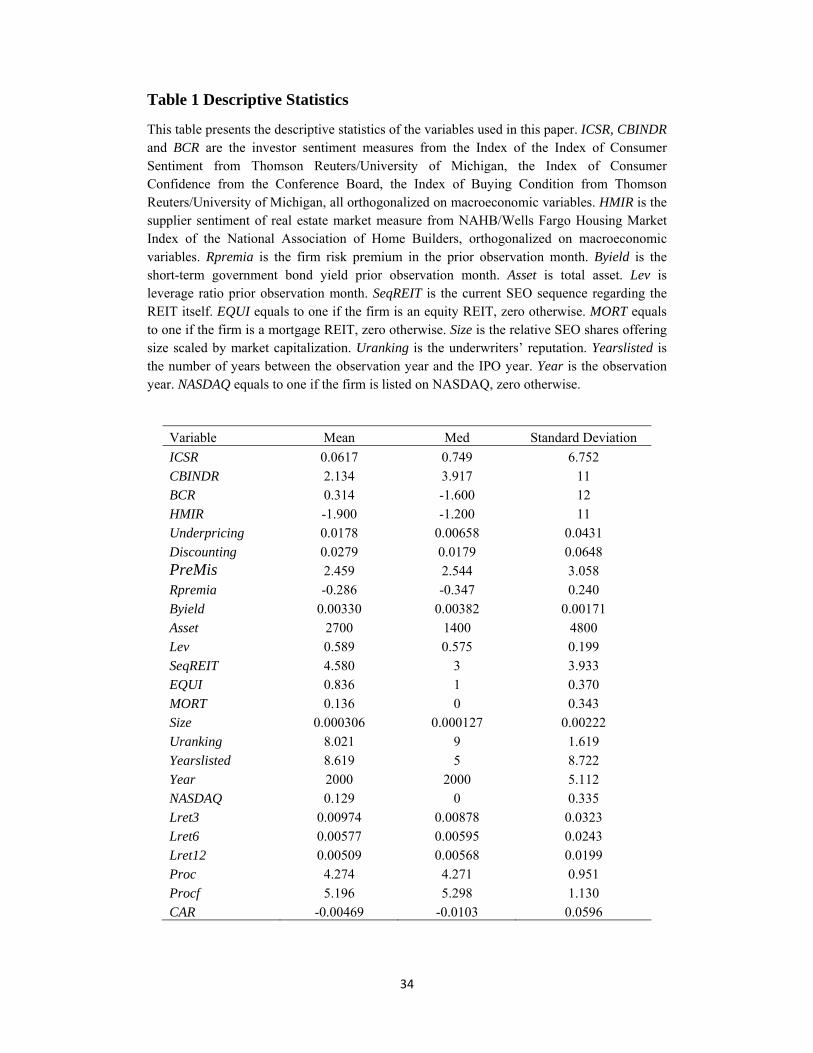
Descriptive Statistics
19
Table 1 shows the summary statistics for all the variables used in this paper. In
general, mean pre-SEO mispricing level is 2.459, which shows that SEO stocks are on
average overvalued before issuance compared to the peers. The median accumulative
abnormal return around announcements is -1.03%. In comparison, the average
abnormal return is -2% for SEOs by US general firms (Altinkiliç and Hansen 2003;
Asquith and Mullins Jr 1986; Eckbo and Masulis 1992). The mean Discounting and
Underpricing are 2.89% and 1.78% respectively. In comparison, the average
underpricing level is 2.92% in 1990s and 1.3% 1980s for SEOs by US general
firms(Corwin 2003). The mean past stock return is 1.56%, indicating a price run-up
prior issuance on average. Given the high payout ratio, it is not surprising that REITs
firms conduct equity offering at a higher frequency (mean SeqREIT is 4.58). Also,
SEOs firms have a relatively high leverage ratio (mean 58.9%). The mean Yearlisted
is 8.619 years, suggesting that SEO firms are on average in their pre-natural stage.
Equity offering tend to be made shortly after financial results are announced.
[Insert Table 1]
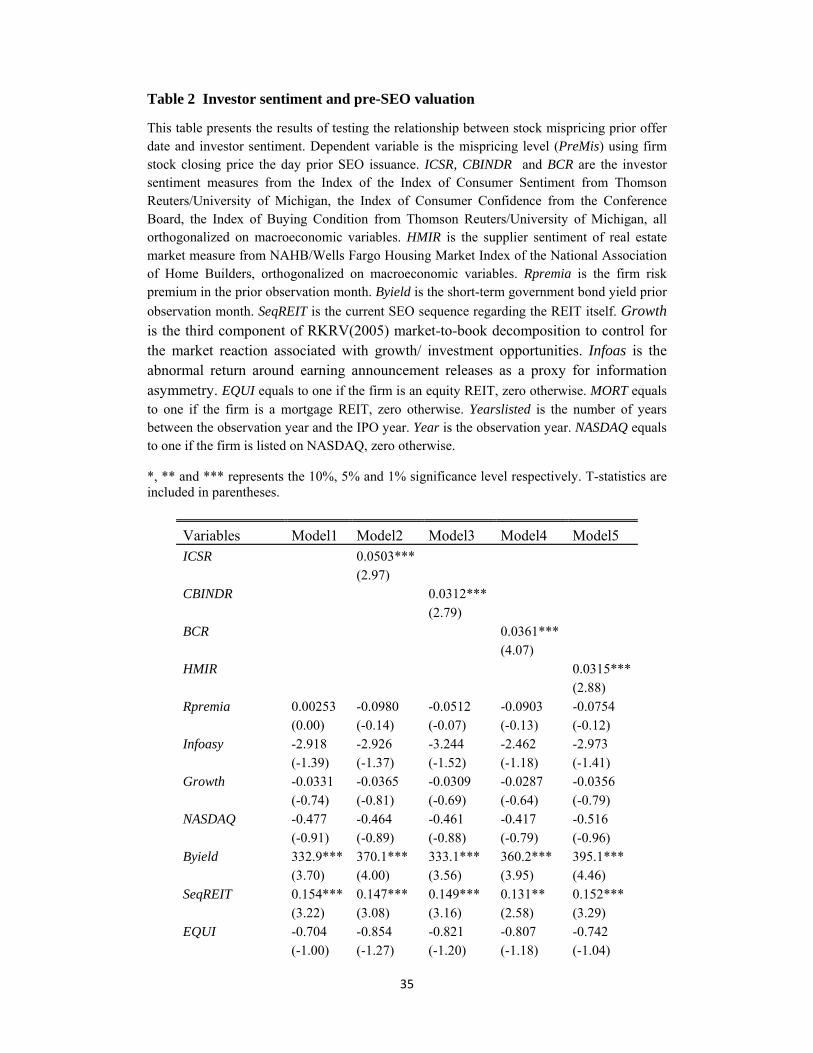
Sentiment and pre-SEO valuation
Theoretical models in behavioral finance assume that rational managers make
decisions in response to sentiment investors which suggests that pre-SEO
overvaluation or mispricing is increasing in sentiment. This enables us to test whether
managers take advantage of prevailing sentiment by examining the relation between
sentiment and market valuation prior to the SEO issuance.
As described in previous section, we adopt the RKRV(2005) methodology to
calculate the mispricing (PreMis) using firm stock closing price the day prior SEO
20
issuance. We analyze the relation between sentiment and pre-issuance mispricing of
SEO firms in the following multivariate model.
NASDAQYear
dYearslisteMORTEQUIInfoasSeqREIT
GrowthByieldRpremiaSentimenteMis
1101
98765
43210Pr
(4)
Where Sentiment are ICSR, CBINDR , BCR and HIMR.
Table 2 shows the results. The coefficients for investor sentiment proxies are
significant and positive (coefficient for ICSR=0.0503, t-stat=2.97). This shows that
mispricing magnifies as sentiment increases, indicating that managers tend to exploit
prevailing sentiment in equity issuance. We also notice that model’s explanatory
power (adjusted R square) substantially increases after incorporating sentiment
variables.
For other control variables, we see a negative relation between mispricing level and
past market return. Mispricing level is likely to be higher for older, more frequent
equity issuance firms, in crisis period when the whole market is in panic.
[Insert Table 2]
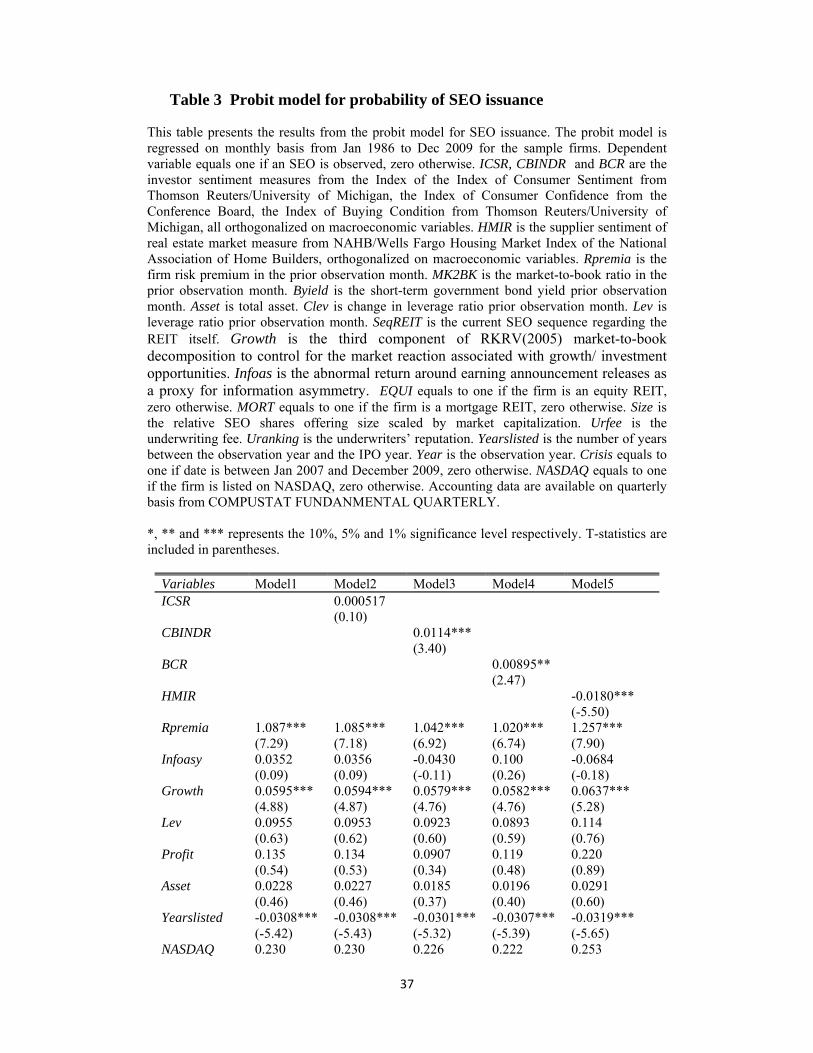
Sentiment and SEO probability
We specify a discrete choice probability model to analyze the impact of sentiment on
SEO timing. The probit model identifies an equity issuance for every REIT in our
sample on a monthly basis2. Dependent variable equals one if an SEO is observed,
zero otherwise. Accounting data are at a quarterly frequency retrieved from
COMPUSTAT FUNDAMENTAL QUARTERLY.
2 We also run the probit model quarterly and annually, and the results remain robust.
21
Table 3 reports the results from the probit model for SEO issuance. All coefficients
have predicted signs. The coefficients for investor sentiment proxies are positive. A
higher level of investor sentiment tends to increase the probability of SEO issuance,
consistent with prior market-timing analysis of SEO (Loughran and Ritter 1997).
And it is interesting to see that real estate sentiment of suppliers is negatively related
with SEO issuance probability.
Equity offerings are also more likely for young firms who are in their early stage of
growth. Yearslisted, which proxies for corporate life stage cycle, is significant and
negatively related with SEO issuance probability. This lends support to the lifecycle
theory that predicts young firms sell stock to fund investment (DeAngelo, DeAngelo
and Stulz 2010). And about the effect of growth opportunities, an increase in the
growth opportunities significantly increases the likelihood of SEO, in line with the
investment-based explanation for SEO issuance which argues that managers issue
equity by timing the investment(Carlson, Fisher and Giammarino 2006). Also, risk
premia is positively related to the equity issuance, supporting that managers time the
market by exploiting equity cost fluctuations.
[Insert Table 3]
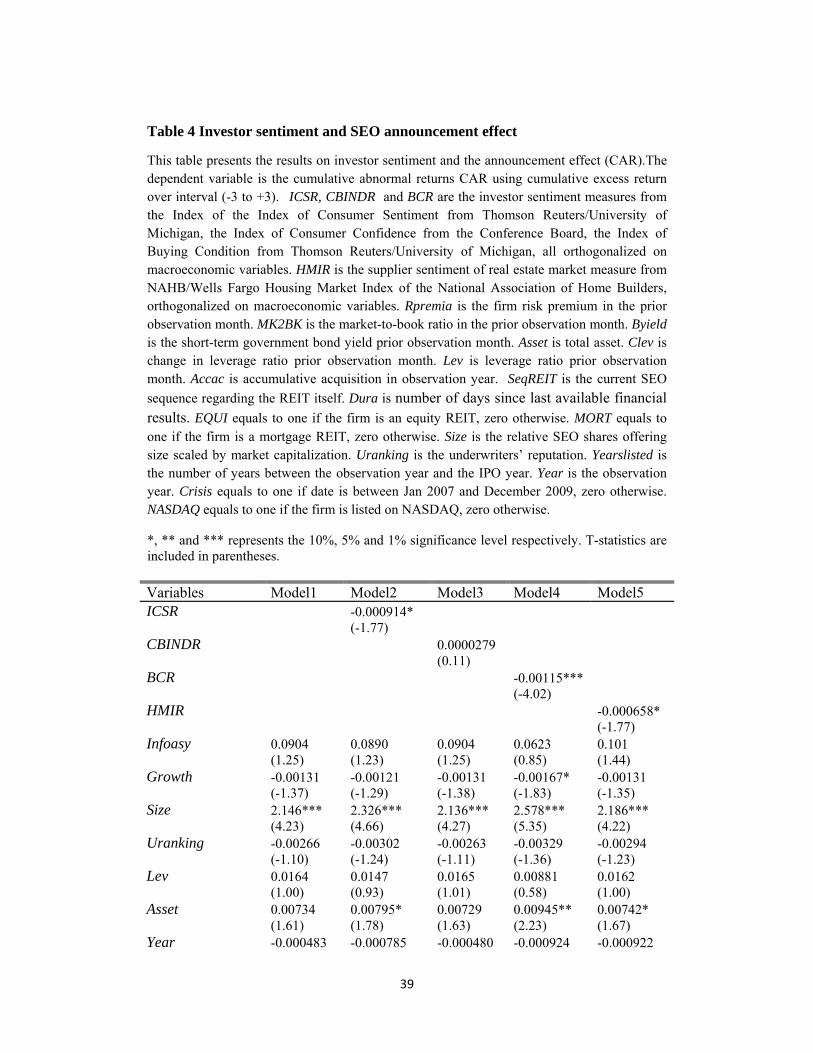
Sentiment and SEO announcement effect
Our SEO sample includes 814 events with announcement date reported in SDC. We
calculate the cumulative abnormal returns CAR using cumulative excess return over
interval (-3 to +3). We observe a statistically significant decline of 0.5% in the
22
cumulative abnormal returns (CAR) associated with the SEO announcements. This
evidence is consistent with the negative price reaction documented by previous
studies and Myers and Majluf (1984)’s pecking order hypothesis.
If the negative price reaction around announcement reflects the overvaluation, this
announcement effect tends to be affected by sentiment as sentiment contributes to
mispricing argued in prior literature. We examine the impact of investor sentiment on
the announcement effect (CAR) in a multivariate regression specified below.
Year
dYearslisteSeqREITMORTEQUIYearByield
LevSizeInfoasGrowthAssetSentimentCAR
31
121110987
6543210
(5)
Reported in Table 4 we note that sentiment proxies are all significantly negatively
related to cumulative abnormal return. Since investors interpret an equity issuance
announcement as an indicator of stock overvaluation, the stock price declines. Higher
level of investor sentiment exacerbates managers’ incentives and price decline is more
pronounced. For control variables, we observe SEO size have a positive impact on
abnormal return, which is quite different from general industry where to expect a
negative effect. And market tends to assign a positive effect on announcements of
REITs with higher leverage, which is in accordance with the prior findings in REITs.
Last, the yield of short-term bond has a negative effect on equity offering
announcements as expected.
[Insert Table 4]
Sentiment and SEO discounting
23
In order to examine the investor sentiment impact on SEO underpricing we estimate
the following regression.
NASDAQYeardYearsliste
SizeMORTEQUIInfoasSeqREITGrowthLev
UrankingAssetByieldRpremiaSentimentgDiscountin
514131
2111109876
543210
(6)
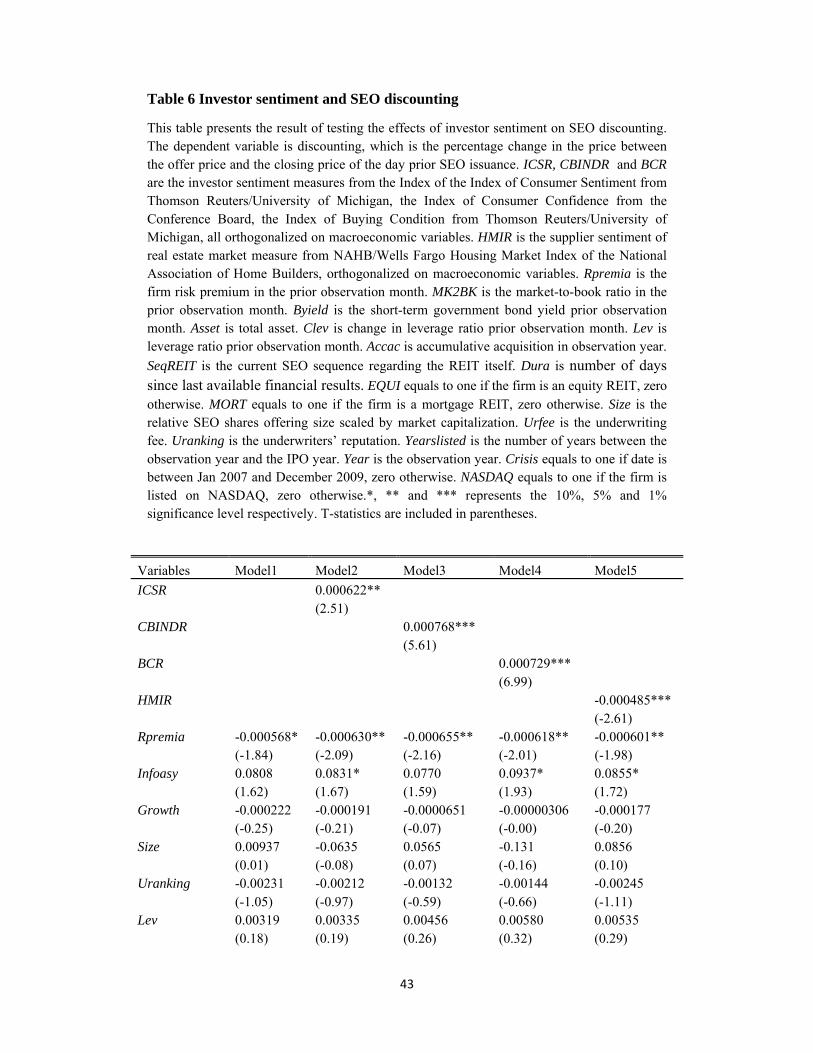
Table 6 reports the results of sentiment on SEO discounting. We note that ICSR and
CBINDR are all significant and positive indicating that investor sentiment positively
impacts the discounting level. This further suggests that firms do not fully incorporate
the effect of prevailing sentiment when setting the offer price. The interesting part is
that we observe a positive effect of BCR on discounting, but a negative effect of
HMIR. This difference indicates that investor sentiment from demand side of real
estate market influences the offer price.
For other control variables, discounting is likely to be lower for firms with higher risk
premia. Short-term bond yield has a negative effect on discounting level.
[Insert Table 6]
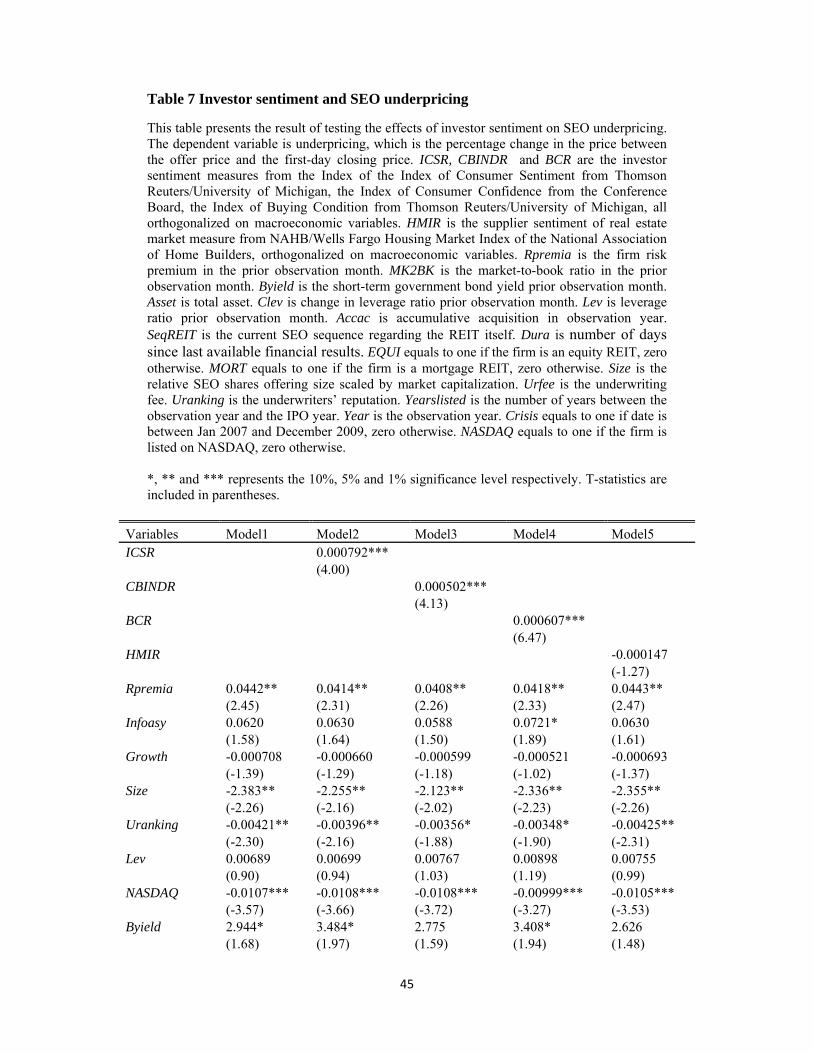
Sentiment and SEO underpricing
Next, we estimate the following regression to implement the investor sentiment
impact on SEO underpricing after controlling for other determinants of SEO
underpricing like what we do in discounting.
24
YeardYearslisteUrankingNASDAQ
SizeMORTEQUIInfoasSeqREITGrowthLev
ClevAssetByieldRpremiaSentimentngUnderprici
61514131
2111109876
543210
(7)
Table 7 shows the results from estimating a multivariate regression of SEO under-
pricing on investor sentiment. We observe that ICSR and CBINDR are significant and
positive, implying that an increase in investor sentiment leads to increase in the
underpricing. As sentiment investors would bid up the stock price, under-pricing is
positively related to the size of the sentiment investor, which is consistent with
previous finding in IPO market that interprets underpricing as a compensation to
regular investors(Ljungqvist, Nanda and Singh 2006). Also, we note that underpricing
is positively related with investor sentiment of real estate market, while there is no
effect on supplier sentiment.
For control variables, variables have a similar effect on underpricing like discounting.
Firms listed on NASDAQ, with a higher underwriting fee and higher past return seem
to have a lower underpricing. And firms tend to underprice more in a depressed
market.
[Insert Table 7]
Sentiment on REITs SEO activity
In the context of equity offerings, market timing theory implies that firms are more
likely to issue equity when managers perceive that the market condition is favorable.
As previous section argues, investor sentiment indicates whether the market condition
for equity issuance is good or bad. Further, for firms who conduct equity offerings in
25
a favorable market, they are likely to sell more equity than a depressed market(Alti
2006). If investor sentiment is the key determinants of market timing as proposed, the
amount of equity issued should be affected by the sentiment investors.
We measure the amount of equity issued by REITs firms at the SEO using the total
proceeds filed (Procf). We address the sentiment effect using following regression
that controls for various SEO determinants.
dYearslisteSeqREITMORT
EQUIByieldYearUrankingLevNASDAQInfoas
GrowthAssetBKMKRpremiaSentimentocf
121113
1211019876
543210 2Pr
(8)
Table 8 reports the main results for sentiment on proceeds filed. The first column is
estimated without sentiment variables. Sentiment variables are added to regressions
respectively. All investor sentiment proxies are significantly positive, suggesting that
firms issue more equity at high sentiment period.
We are mindful that firms might revise their target proceeds to capture the time
varying sentiment investors.
It is possible that firms revise their target proceeds to account for the time variant
sentiment. We achieve this by analyzing the sentiment impact on proceeds generated
at issue date (Proc) with following regression.
26
dYearslisteSeqREITMORT
EQUIByieldYearUrankingLevNASDAQof
GrowthAssetInfoasRpremiaSentimentoc
121113
1211019876
543210
Pr
Pr
(9)
As reported in Table 9 , all sentiment variables are significantly negative related to
proceeds generated, suggesting that firms do not fully incorporate the impact of
sentiment at time of issuance(Cornelli, Goldreich and Ljungqvist 2006).
In general, SEO market volume is a significant indicator of firms’ market timing
attempts. Firms issue more stock in high sentiment periods in the market.
Sentiment and SEO long run return
Finally, we examine the impact of sentiment investors on long term stock
performance.
So far, although we have controlled for fundamentals in SEO decision and pricing, it
is not impossible that our sentiment variables may proxy for some underlying
unobservable fundamentals besides the behavioral component. If managers time the
market for mispricing, the long-run relative underperformance of stocks after
seasoned equity offerings should be identified (Loughran and Ritter 1995) as the
sentiment investors leave the market. If our sentiment proxies for the unobservable
fundamentals, SEO prices will stay at the new level and its future performance is
unrelated with the sentiment at issuance. Otherwise, if we observe long run
27
underperformance after SEO, i.e. SEO prices is mean-reverting, our proxies are
behavioral(Ljungqvist, Nanda and Singh 2006).
We calculate the SEO long-term risk adjusted return using Fama French four factor
model for 3, 6 and 12 months3. We specify a multivariate regression to test the impact
of investor sentiment as follows. The control variables are those shown to be
significant in explaining discounting and underpricing.
NASDAQCrisis
UrankingGrowthSizeInfoasLevSentimentLret
87
6543210
(10)
Reported in Table 10, all sentiment variables are significant at 5% level, supporting
that sentiment-oriented stock mispricing matters the equity performance in the long
run. We find that the SEO long-term risk adjusted return are negatively related to
sentiment, suggesting that SEOs revert to their fundamental values as market corrects
the misevaluation.
Robustness Test
In this section, we conduct the robustness tests of results by analyzing the SEO offer
price revision , the hot market effect, doing clustering analysis and using alternative
measure of investor sentiment.
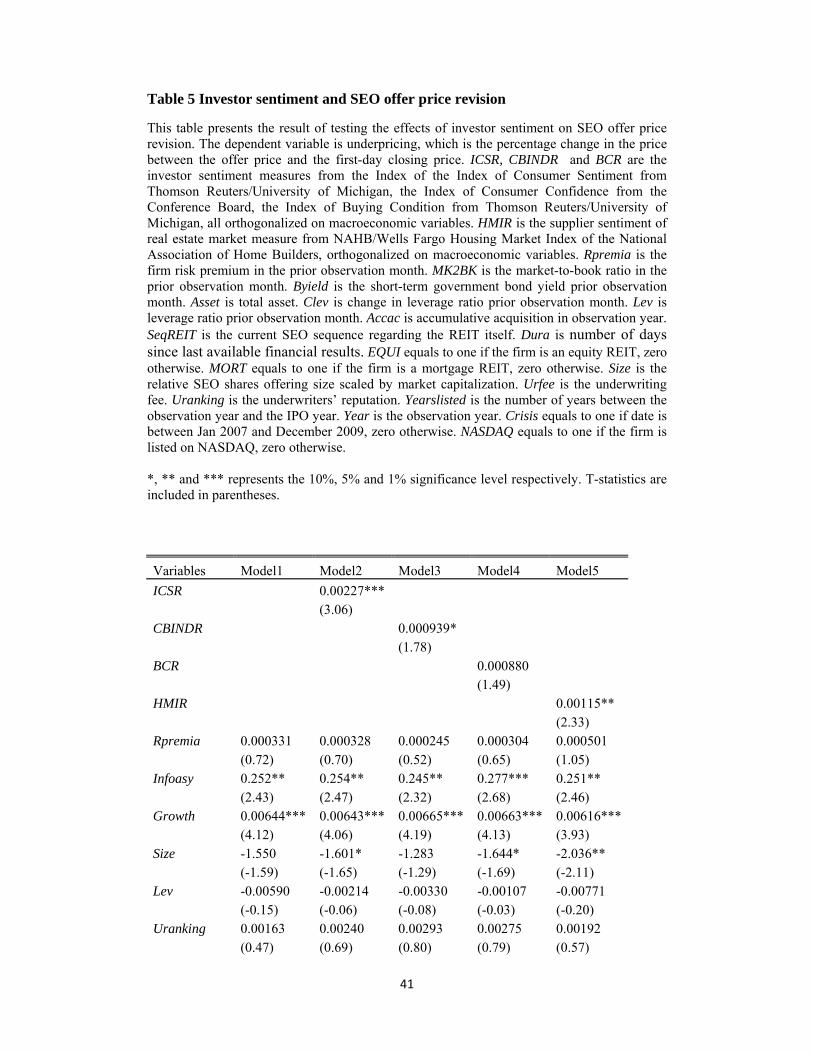
1. Sentiment and SEO offer price revision
We further look at impact of investor sentiment on SEO offer price revision. If
managers perceive the prevailing sentiment investors, they are inclined to incorporate
3 We also calculated long run risk adjusted return applying Fama-French three factor model in the unreported regressions.
28
the sentiment effect through revising the offer price. We achieve this by analyzing the
following regression on price revision, which is defined as the price adjustment
between mid-file price and the SEO offer price.
SeqREITMORT
EQUIByieldYearUrankingLevNASDAQdYearsliste
GrowthAssetInfoasRpremiaSentimentvice
1113
1211019876
543210RePr
(11)
Table 5 reports the results. A higher level of investor sentiment tends to increase the
price revision magnitude, consistent with the hypothesis that that managers time the
prevailing sentiment investors in the market.
[Insert Table 5]
2. Hot market effect
IPO literature suggests that the impact of sentiment on stock price is asymmetric
between high and low sentiment periods(Hrnjić and Sankaraguruswamy 2011 ;
Ljungqvist, Nanda and Singh 2006). Firms discount more during the high sentiment
period. We further test the asymmetric relationship between sentiment and SEO
pricing by interacting CBINDR with CBINDR –AB66 and CBINDR –BL33, where
CBINDR –AB66 proxies for high sentiment periods and CBINDR –BL33 proxies for
low sentiment periods . Reported in Table 111, the coefficient on interaction variable
HighSentiment is positive and significant for both discounting and underpricing,
suggesting that the relationship between sentiment and SEO pricing is asymmetric.
[Insert Table 11]
We also compare SEOs over high sentiment periods and low sentiment periods by
estimating the possibility that firms conduct SEOs during high or low sentiment
periods. From Table 12, we observe that high sentiment and low sentiment periods
do not differ in much in SEO activities, consistent with the findings in IPO market
cycles(Helwege and Liang 2004).
29
[Insert Table 12]
3. Clustering analysis
We are mindful that the equity issuance clustering effect might bias our estimates. We
address this issue by clustering error terms (Petersen 2009). We reestimate Eq. (4),
Eq. (5), Eq. (6), Eq. (7), Eq. (8), Eq. (9), and Eq. (10) after clustering standard errors
by month. The coefficients of our sentiment proxies remain significant and robust.
4. Alternative measure of sentiment
So far, we use direct measure of investor sentiment to quantify the effect of sentiment
on seasonal equity offerings. Another widely used measure of sentiment is Baker-
Wurgler investor sentiment index(Baker and Wurgler 2006; Baker and Wurgler 2007;
Campbell, Rhee, Du and Tang 2008; Sankaraguruswamy and Mian 2008). Baker-
Wurgler investor sentiment index is calculated by applying principle component
analysis to capture the principle component from closed end fund discount, dividend
premium, turnover, first day IPO returns, IPOs number and proportion of equity
offering.
We substitute the Baker-Wurgler index with our sentiment proxies and reestimate
Eq.(4), Eq. (5), Eq. (6), Eq. (7), Eq. (8), Eq. (9), and Eq. (10). Table 13 describes the
results. We see that most coefficients on Baker-Wurgler index are significant and all
the signs are consistent with our sentiment proxies in previous testing.
[Insert Table 13]
Conclusion

30
To the best of our knowledge, this is the first paper to analyze the impact of investor
sentiment on seasoned equity offerings. Our empirical results suggest that the level of
investor sentiment impacts pre-SEO mispricing and the decision to issue SEO.
Consistent with the notion that market interprets SEO announcement in high
sentiment periods as more negative signal, we find that announcement returns are
negatively related to sentiment. Further, we document that investor sentiment is
positively related with the SEO discounting; i.e., the higher the sentiment, the larger
the discount from the previous day closing price. Similarly, higher sentiment periods
are characterized with higher first day returns. Sentiment doesn’t seem to proxy for
unobservable risk characteristic as we find that post-SEO long run returns are more
negative in high sentiment periods.
Our paper contributes to several strands of literature. First, market timing theory
predicts that firms conduct equity issuance when the shares are overvalued. In this
paper, we examine the extent to which investors’ sentiment contributes to equity
decisions and SEO price dynamics and report that managers issue more often when
sentiment is high and shares are overpriced. Second, while empirical studies
document positive effect of investor sentiment on IPO underpricing and negative
effect on long run returns, this is the first paper to examine the impact of sentiment on
seasoned equity offerings. Third, our paper contributes to the determinants of SEO
discounting and underpricing. Altinkilic and Hansen (2003), Corwin (2003), and
Mola and Lughran (2004) empirically examine determinants of SEO discounting and
underpricing, but none of these papers examine the impact of investor sentiment. This
is the first paper to document significant impact of investor sentiment on SEO pricing
process.

31
Overall, investor sentiment seems to play an important role in seasoned equity
offerings. Our findings are consistent with market timing and behavioral explanations
for equity offering. .
Despite our best efforts to control for fundamentals like time-varying growth
opportunities and risk premia which can also explain SEO decision and pricing, it is
not impossible that there is other underlying unobservable fundamental factor
responsible for some of our results. Future work may focus on identifying these
factors and integrating them in the analysis.
32
References
Alti, A., 2006. How Persistent Is the Impact of Market Timing on Capital Structure?, Journal of Finance 61, 1681-1710.
Altinkiliç, O., and R. S. Hansen, 2003. Discounting and underpricing in seasoned equity offers, Journal of Financial Economics 69, 285-323.
Asquith, P., and D. W. Mullins Jr, 1986. Equity issues and offering dilution, Journal of Financial Economics 15, 61-89.
Baker, M., and J. Wurgler, 2002. Market Timing and Capital Structure, Journal of Finance 57, 1-32.
Baker, M., and J. Wurgler, 2006. Investor sentiment and the cross-section of stock returns, Journal of Finance 61, 1645-1680.
Baker, M., and J. Wurgler, 2007. Investor sentiment in the stock market, Journal of Economic Perspectives 21, 129-151.
Boudry, W. I., J. G. Kallberg, and C. H. Liu, 2010. An analysis of REIT security issuance decisions, Real Estate Economics 38, 91-120.
Brounen, D., and P. M. A. Eichholtz, 2001. Capital structure theory: Evidence from European property companies' capital offerings, Real Estate Economics 29, 615-632.
Brown, G. W., and M. T. Cliff, 2004. Investor sentiment and the near-term stock market, Journal of Empirical Finance 11, 1-27.
Campbell, C. J., S. G. Rhee, Y. Du, and N. Tang, 2008. Market Sentiment, IPO Underpricing, and Valuation, SSRN eLibrary.
Carlson, M., A. Fisher, and R. Giammarino, 2006. Corporate investment and asset price dynamics: Implications for SEO event studies and long-run performance, Journal of Finance 61, 1009-1034.
Clayton, J., D. C. Ling, and A. Naranjo, 2009. Commercial real estate valuation: Fundamentals versus investor sentiment, Journal of Real Estate Finance and Economics 38, 5-37.
Cornelli, F., D. Goldreich, and A. Ljungqvist, 2006. Investor Sentiment and Pre-IPO Markets, Journal of Finance 61, 1187-1216.
Corwin, S. A., 2003. The Determinants of Underpricing for Seasoned Equity Offers, Journal of Finance 58, 2249-2279.
De Long, J. B., A. Shleifer, L. H. Summers, and R. J. Waldmann, 1990. Noise Trader Risk in Financial Markets, Journal of Political Economy 98, 703.
DeAngelo, H., L. DeAngelo, and R. M. Stulz, 2010. Seasoned equity offerings, market timing, and the corporate lifecycle, Journal of Financial Economics 95, 275-295.
Derrien, F., 2005. IPO Pricing in“Hot” Market Conditions: Who Leaves Money on the Table?, Journal of Finance 60, 487-521.
Dorn, D., 2009. Does sentiment drive the retail demand for IPOs?, Journal of Financial and Quantitative Analysis 44, 85-108.
Eckbo, B. E., and R. W. Masulis, 1992. Adverse selection and the rights offer paradox, Journal of Financial Economics 32, 293-332.
Fu, F., L. Lin, and M. S. Officer, 2010. Acquisitions Driven by Stock Overvaluation: Are They Good Deals?, SSRN eLibrary.
Ghosh, C., R. Nag, and C. F. Sirmans, 2000. The pricing of seasoned equity offerings: Evidence from REITs, Real Estate Economics 28, 363-384.
Graham, J. R., and C. R. Harvey, 2001. The theory and practice of corporate finance: evidence from the field, Journal of Financial Economics 60, 187-243.
Helwege, J., and N. Liang, 2004. Initial public offerings in hot and cold markets, Journal of Financial and Quantitative Analysis 39, 541-569.
Hertzel, M., E. Hrnjić, M. Officer, and C. Si, 2011. Why Do Firms Go Public? Evidence from the Decomposition of M/B ratio, Working paper.
Hertzel, M. G., and Z. Li, 2010. Behavioral and rational explanations of stock price performance around SEOs: Evidence from a decomposition of market-to-book ratios, Journal of Financial and Quantitative Analysis 45, 935-958.
33
Hrnjić, E., and S. Sankaraguruswamy, 2011 Market-wide Sentiment, Firm-level Sentiment, and IPO Pricing Process, EFA.
Jung, K., Y. C. Kim, and R. M. Stulz, 1996. Timing, investment opportunities, managerial discretion, and the security issue decision, Journal of Financial Economics 42, 159-185.
Korajczyk, R., D. Lucas, and R. McDonald, 1991. The effect of information releases on the pricing and timing of equity issues, Review of Financial Studies 4, 685-708.
Lemmon, M., and E. Portniaguina, 2006. Consumer confidence and asset prices: Some empirical evidence, Review of Financial Studies 19, 1499-1529.
Ljungqvist, A., V. Nanda, and R. Singh, 2006. Hot markets, investor sentiment, and IPO pricing, Journal of Business 79, 1667-1702.
Loughran, T., and J. R. Ritter, 1995. The new issues puzzle, Journal of Finance 50, 23-51. Loughran, T., and J. R. Ritter, 1997. The operating performance of firms conducting seasoned
equity offerings, Journal of Finance 52, 1823-1850. Loughran, T., J. R. Ritter, and K. Rydqvist, 1994. Initial public offerings: International
insights, Pacific-Basin Finance Journal 2, 165-199. Mola, S., and T. Loughran, 2004. Discounting and Clustering in Seasoned Equity Offering
Prices, Journal of Financial and Quantitative Analysis 39, 1-23. Myers, S. C., and N. S. Majluf, 1984. Corporate financing and investment decisions when
firms have information that investors do not have, Journal of Financial Economics 13, 187-221.
Ong, S., J. Ooi, and Y. Kawaguichi, 2011. Seasoned Equity Issuance by Japan and Singapore REITs, The Journal of Real Estate Finance and Economics 43, 205-220.
Ooi, J., S.-E. Ong, and L. Li, 2010. An Analysis of the Financing Decisions of REITs: The Role of Market Timing and Target Leverage, The Journal of Real Estate Finance and Economics 40, 130-160.
Petersen, M., 2009. Estimating standard errors in finance panel data sets: Comparing approaches, Review of Financial Studies 22, 435-480.
Qiu, L. X., and I. Welch, 2004. Investor Sentiment Measures, SSRN eLibrary. Rhodes-Kropf, M., D. T. Robinson, and S. Viswanathan, 2005. Valuation waves and merger
activity: The empirical evidence, Journal of Financial Economics 77, 561-603. Safieddine, A., and W. J. Wilhelm Jr, 1996. An empirical investigation of short-selling
activity prior to seasoned equity offerings, Journal of Finance 51, 729-749. Sankaraguruswamy, S., and G. M. Mian, 2008. Investor Sentiment and Stock Market
Response to Corporate News, SSRN eLibrary. Shleifer, A., and R. W. Vishny, 1997. The limits of arbitrage, Journal of Finance 52, 35-55. Stein, J. C., 1996. Rational capital budgeting in an irrational world, Journal of Business 69,
429-455. Teoh, S. H., I. Welch, and T. J. Wong, 1997. Earnings management and the
underperformance of seasoned equity offerings, Journal of Financial Economics. Yung, C., G. Çolak, and W. Wei, 2008. Cycles in the IPO market, Journal of Financial
Economics 89, 192-208.
34
Table 1 Descriptive Statistics
This table presents the descriptive statistics of the variables used in this paper. ICSR, CBINDR and BCR are the investor sentiment measures from the Index of the Index of Consumer Sentiment from Thomson Reuters/University of Michigan, the Index of Consumer Confidence from the Conference Board, the Index of Buying Condition from Thomson Reuters/University of Michigan, all orthogonalized on macroeconomic variables. HMIR is the supplier sentiment of real estate market measure from NAHB/Wells Fargo Housing Market Index of the National Association of Home Builders, orthogonalized on macroeconomic variables. Rpremia is the firm risk premium in the prior observation month. Byield is the short-term government bond yield prior observation month. Asset is total asset. Lev is leverage ratio prior observation month. SeqREIT is the current SEO sequence regarding the REIT itself. EQUI equals to one if the firm is an equity REIT, zero otherwise. MORT equals to one if the firm is a mortgage REIT, zero otherwise. Size is the relative SEO shares offering size scaled by market capitalization. Uranking is the underwriters’ reputation. Yearslisted is the number of years between the observation year and the IPO year. Year is the observation year. NASDAQ equals to one if the firm is listed on NASDAQ, zero otherwise.
Variable Mean Med Standard Deviation
ICSR 0.0617 0.749 6.752 CBINDR 2.134 3.917 11 BCR 0.314 -1.600 12 HMIR -1.900 -1.200 11 Underpricing 0.0178 0.00658 0.0431 Discounting 0.0279 0.0179 0.0648 PreMis 2.459 2.544 3.058 Rpremia -0.286 -0.347 0.240 Byield 0.00330 0.00382 0.00171 Asset 2700 1400 4800 Lev 0.589 0.575 0.199 SeqREIT 4.580 3 3.933 EQUI 0.836 1 0.370 MORT 0.136 0 0.343 Size 0.000306 0.000127 0.00222 Uranking 8.021 9 1.619 Yearslisted 8.619 5 8.722 Year 2000 2000 5.112 NASDAQ 0.129 0 0.335 Lret3 0.00974 0.00878 0.0323 Lret6 0.00577 0.00595 0.0243 Lret12 0.00509 0.00568 0.0199 Proc 4.274 4.271 0.951 Procf 5.196 5.298 1.130 CAR -0.00469 -0.0103 0.0596
35
Table 2 Investor sentiment and pre-SEO valuation
This table presents the results of testing the relationship between stock mispricing prior offer date and investor sentiment. Dependent variable is the mispricing level (PreMis) using firm stock closing price the day prior SEO issuance. ICSR, CBINDR and BCR are the investor sentiment measures from the Index of the Index of Consumer Sentiment from Thomson Reuters/University of Michigan, the Index of Consumer Confidence from the Conference Board, the Index of Buying Condition from Thomson Reuters/University of Michigan, all orthogonalized on macroeconomic variables. HMIR is the supplier sentiment of real estate market measure from NAHB/Wells Fargo Housing Market Index of the National Association of Home Builders, orthogonalized on macroeconomic variables. Rpremia is the firm risk premium in the prior observation month. Byield is the short-term government bond yield prior
observation month. SeqREIT is the current SEO sequence regarding the REIT itself. Growth is the third component of RKRV(2005) market-to-book decomposition to control for the market reaction associated with growth/ investment opportunities. Infoas is the abnormal return around earning announcement releases as a proxy for information asymmetry. EQUI equals to one if the firm is an equity REIT, zero otherwise. MORT equals to one if the firm is a mortgage REIT, zero otherwise. Yearslisted is the number of years between the observation year and the IPO year. Year is the observation year. NASDAQ equals to one if the firm is listed on NASDAQ, zero otherwise.
*, ** and *** represents the 10%, 5% and 1% significance level respectively. T-statistics are included in parentheses.
Variables Model1 Model2 Model3 Model4 Model5 ICSR 0.0503***
(2.97) CBINDR 0.0312***
(2.79) BCR 0.0361***
(4.07) HMIR 0.0315***
(2.88) Rpremia 0.00253 -0.0980 -0.0512 -0.0903 -0.0754
(0.00) (-0.14) (-0.07) (-0.13) (-0.12) Infoasy -2.918 -2.926 -3.244 -2.462 -2.973
(-1.39) (-1.37) (-1.52) (-1.18) (-1.41) Growth -0.0331 -0.0365 -0.0309 -0.0287 -0.0356
(-0.74) (-0.81) (-0.69) (-0.64) (-0.79) NASDAQ -0.477 -0.464 -0.461 -0.417 -0.516
(-0.91) (-0.89) (-0.88) (-0.79) (-0.96) Byield 332.9*** 370.1*** 333.1*** 360.2*** 395.1***
(3.70) (4.00) (3.56) (3.95) (4.46) SeqREIT 0.154*** 0.147*** 0.149*** 0.131** 0.152***
(3.22) (3.08) (3.16) (2.58) (3.29) EQUI -0.704 -0.854 -0.821 -0.807 -0.742
(-1.00) (-1.27) (-1.20) (-1.18) (-1.04)

36
MORT -0.875 -0.959 -0.910 -0.896 -0.897 (-1.12) (-1.28) (-1.19) (-1.18) (-1.14)
Yearslisted 0.0288 0.0317* 0.0297* 0.0303* 0.0286 (1.60) (1.82) (1.67) (1.72) (1.63)
Year 0.0122 0.0350 0.0137 0.0402 0.0445 (0.33) (0.91) (0.37) (1.05) (1.17)
Constant -22.39 -67.96 -25.38 -78.35 -87.03 (-0.30) (-0.89) (-0.34) (-1.02) (-1.15)
Number of Obs 994 994 994 994 994 Adjusted R2 0.0650 0.0756 0.0761 0.0827 0.0750 F stat 3.955 5.809 6.001 6.330 5.022
37
Table 3 Probit model for probability of SEO issuance
This table presents the results from the probit model for SEO issuance. The probit model is regressed on monthly basis from Jan 1986 to Dec 2009 for the sample firms. Dependent variable equals one if an SEO is observed, zero otherwise. ICSR, CBINDR and BCR are the investor sentiment measures from the Index of the Index of Consumer Sentiment from Thomson Reuters/University of Michigan, the Index of Consumer Confidence from the Conference Board, the Index of Buying Condition from Thomson Reuters/University of Michigan, all orthogonalized on macroeconomic variables. HMIR is the supplier sentiment of real estate market measure from NAHB/Wells Fargo Housing Market Index of the National Association of Home Builders, orthogonalized on macroeconomic variables. Rpremia is the firm risk premium in the prior observation month. MK2BK is the market-to-book ratio in the prior observation month. Byield is the short-term government bond yield prior observation month. Asset is total asset. Clev is change in leverage ratio prior observation month. Lev is leverage ratio prior observation month. SeqREIT is the current SEO sequence regarding the REIT itself. Growth is the third component of RKRV(2005) market-to-book decomposition to control for the market reaction associated with growth/ investment opportunities. Infoas is the abnormal return around earning announcement releases as a proxy for information asymmetry. EQUI equals to one if the firm is an equity REIT, zero otherwise. MORT equals to one if the firm is a mortgage REIT, zero otherwise. Size is the relative SEO shares offering size scaled by market capitalization. Urfee is the underwriting fee. Uranking is the underwriters’ reputation. Yearslisted is the number of years between the observation year and the IPO year. Year is the observation year. Crisis equals to one if date is between Jan 2007 and December 2009, zero otherwise. NASDAQ equals to one if the firm is listed on NASDAQ, zero otherwise. Accounting data are available on quarterly basis from COMPUSTAT FUNDANMENTAL QUARTERLY. *, ** and *** represents the 10%, 5% and 1% significance level respectively. T-statistics are included in parentheses.
Variables Model1 Model2 Model3 Model4 Model5 ICSR 0.000517
(0.10) CBINDR 0.0114***
(3.40) BCR 0.00895**
(2.47) HMIR -0.0180***
(-5.50) Rpremia 1.087*** 1.085*** 1.042*** 1.020*** 1.257***
(7.29) (7.18) (6.92) (6.74) (7.90) Infoasy 0.0352 0.0356 -0.0430 0.100 -0.0684
(0.09) (0.09) (-0.11) (0.26) (-0.18) Growth 0.0595*** 0.0594*** 0.0579*** 0.0582*** 0.0637***
(4.88) (4.87) (4.76) (4.76) (5.28) Lev 0.0955 0.0953 0.0923 0.0893 0.114
(0.63) (0.62) (0.60) (0.59) (0.76) Profit 0.135 0.134 0.0907 0.119 0.220
(0.54) (0.53) (0.34) (0.48) (0.89) Asset 0.0228 0.0227 0.0185 0.0196 0.0291
(0.46) (0.46) (0.37) (0.40) (0.60) Yearslisted -0.0308*** -0.0308*** -0.0301*** -0.0307*** -0.0319***
(-5.42) (-5.43) (-5.32) (-5.39) (-5.65) NASDAQ 0.230 0.230 0.226 0.222 0.253
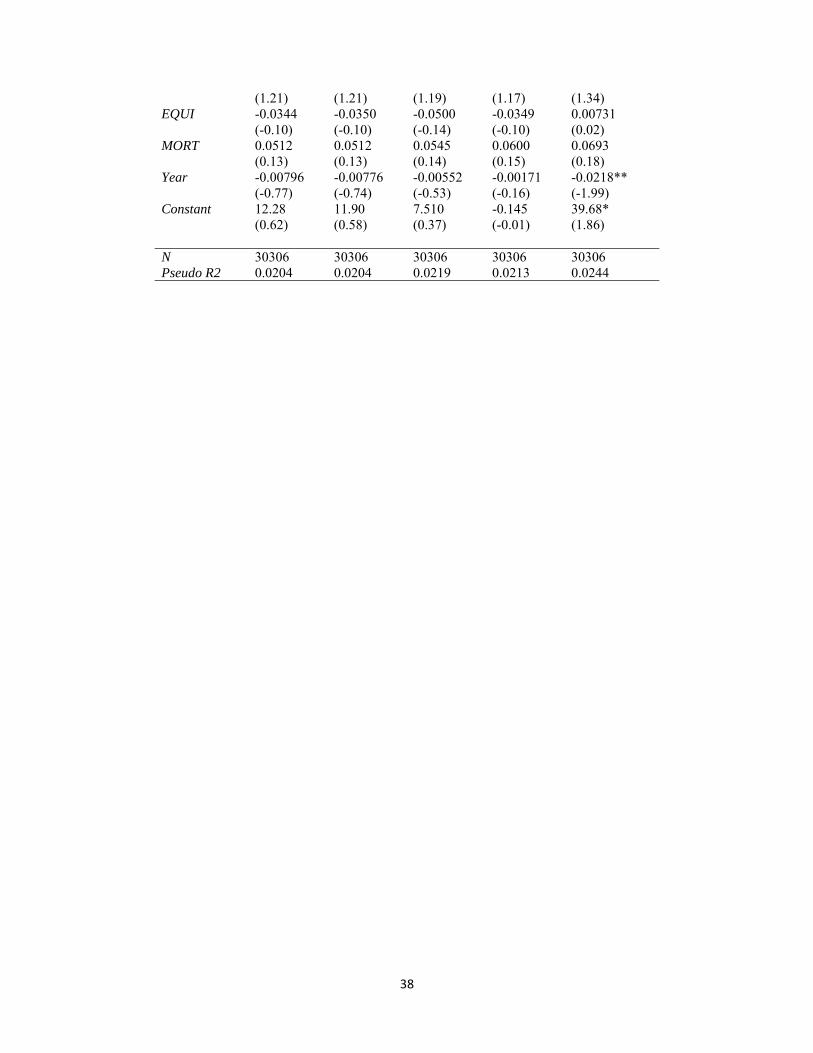
38
(1.21) (1.21) (1.19) (1.17) (1.34) EQUI -0.0344 -0.0350 -0.0500 -0.0349 0.00731
(-0.10) (-0.10) (-0.14) (-0.10) (0.02) MORT 0.0512 0.0512 0.0545 0.0600 0.0693
(0.13) (0.13) (0.14) (0.15) (0.18) Year -0.00796 -0.00776 -0.00552 -0.00171 -0.0218**
(-0.77) (-0.74) (-0.53) (-0.16) (-1.99) Constant 12.28 11.90 7.510 -0.145 39.68*
(0.62) (0.58) (0.37) (-0.01) (1.86) N 30306 30306 30306 30306 30306 Pseudo R2 0.0204 0.0204 0.0219 0.0213 0.0244
39
Table 4 Investor sentiment and SEO announcement effect
This table presents the results on investor sentiment and the announcement effect (CAR).The dependent variable is the cumulative abnormal returns CAR using cumulative excess return over interval (-3 to +3). ICSR, CBINDR and BCR are the investor sentiment measures from the Index of the Index of Consumer Sentiment from Thomson Reuters/University of Michigan, the Index of Consumer Confidence from the Conference Board, the Index of Buying Condition from Thomson Reuters/University of Michigan, all orthogonalized on macroeconomic variables. HMIR is the supplier sentiment of real estate market measure from NAHB/Wells Fargo Housing Market Index of the National Association of Home Builders, orthogonalized on macroeconomic variables. Rpremia is the firm risk premium in the prior observation month. MK2BK is the market-to-book ratio in the prior observation month. Byield is the short-term government bond yield prior observation month. Asset is total asset. Clev is change in leverage ratio prior observation month. Lev is leverage ratio prior observation month. Accac is accumulative acquisition in observation year. SeqREIT is the current SEO
sequence regarding the REIT itself. Dura is number of days since last available financial results. EQUI equals to one if the firm is an equity REIT, zero otherwise. MORT equals to one if the firm is a mortgage REIT, zero otherwise. Size is the relative SEO shares offering size scaled by market capitalization. Uranking is the underwriters’ reputation. Yearslisted is the number of years between the observation year and the IPO year. Year is the observation year. Crisis equals to one if date is between Jan 2007 and December 2009, zero otherwise. NASDAQ equals to one if the firm is listed on NASDAQ, zero otherwise.
*, ** and *** represents the 10%, 5% and 1% significance level respectively. T-statistics are included in parentheses. Variables Model1 Model2 Model3 Model4 Model5 ICSR -0.000914*
(-1.77) CBINDR 0.0000279
(0.11) BCR -0.00115***
(-4.02) HMIR -0.000658*
(-1.77) Infoasy 0.0904 0.0890 0.0904 0.0623 0.101
(1.25) (1.23) (1.25) (0.85) (1.44) Growth -0.00131 -0.00121 -0.00131 -0.00167* -0.00131
(-1.37) (-1.29) (-1.38) (-1.83) (-1.35) Size 2.146*** 2.326*** 2.136*** 2.578*** 2.186***
(4.23) (4.66) (4.27) (5.35) (4.22) Uranking -0.00266 -0.00302 -0.00263 -0.00329 -0.00294
(-1.10) (-1.24) (-1.11) (-1.36) (-1.23) Lev 0.0164 0.0147 0.0165 0.00881 0.0162
(1.00) (0.93) (1.01) (0.58) (1.00) Asset 0.00734 0.00795* 0.00729 0.00945** 0.00742*
(1.61) (1.78) (1.63) (2.23) (1.67) Year -0.000483 -0.000785 -0.000480 -0.000924 -0.000922
40
(-0.46) (-0.79) (-0.46) (-0.91) (-0.95) NASDAQ 0.00440 0.00442 0.00436 0.00285 0.00438
(0.54) (0.54) (0.53) (0.39) (0.54) Byield -2.061 -2.926 -2.064 -3.318 -4.360*
(-0.99) (-1.48) (-0.98) (-1.62) (-1.97) SeqREIT 0.000603 0.000561 0.000606 0.000383 0.000566
(0.85) (0.82) (0.86) (0.58) (0.84) EQUI -0.00470 -0.000243 -0.00489 0.000623 -0.00373
(-0.49) (-0.02) (-0.50) (0.07) (-0.39) MORT -0.0130 -0.0100 -0.0131 -0.00890 -0.0123
(-0.80) (-0.61) (-0.80) (-0.57) (-0.77) Yearslisted 0.0000158 -0.0000420 0.0000183 0.0000453 0.00000150
(0.05) (-0.14) (0.06) (0.16) (0.01) Constant 0.785 1.375 0.780 1.618 1.669
(0.38) (0.71) (0.38) (0.82) (0.88) Number of Obs 832 832 832 832 832 Adjusted R2 0.0254 0.0323 0.0243 0.0560 0.0332 F stat 3.275 3.351 3.117 5.009 3.217
41
Table 5 Investor sentiment and SEO offer price revision
This table presents the result of testing the effects of investor sentiment on SEO offer price revision. The dependent variable is underpricing, which is the percentage change in the price between the offer price and the first-day closing price. ICSR, CBINDR and BCR are the investor sentiment measures from the Index of the Index of Consumer Sentiment from Thomson Reuters/University of Michigan, the Index of Consumer Confidence from the Conference Board, the Index of Buying Condition from Thomson Reuters/University of Michigan, all orthogonalized on macroeconomic variables. HMIR is the supplier sentiment of real estate market measure from NAHB/Wells Fargo Housing Market Index of the National Association of Home Builders, orthogonalized on macroeconomic variables. Rpremia is the firm risk premium in the prior observation month. MK2BK is the market-to-book ratio in the prior observation month. Byield is the short-term government bond yield prior observation month. Asset is total asset. Clev is change in leverage ratio prior observation month. Lev is leverage ratio prior observation month. Accac is accumulative acquisition in observation year. SeqREIT is the current SEO sequence regarding the REIT itself. Dura is number of days since last available financial results. EQUI equals to one if the firm is an equity REIT, zero otherwise. MORT equals to one if the firm is a mortgage REIT, zero otherwise. Size is the relative SEO shares offering size scaled by market capitalization. Urfee is the underwriting fee. Uranking is the underwriters’ reputation. Yearslisted is the number of years between the observation year and the IPO year. Year is the observation year. Crisis equals to one if date is between Jan 2007 and December 2009, zero otherwise. NASDAQ equals to one if the firm is listed on NASDAQ, zero otherwise. *, ** and *** represents the 10%, 5% and 1% significance level respectively. T-statistics are included in parentheses.
Variables Model1 Model2 Model3 Model4 Model5
ICSR 0.00227***(3.06)
CBINDR 0.000939* (1.78)
BCR 0.000880 (1.49)
HMIR 0.00115** (2.33)
Rpremia 0.000331 0.000328 0.000245 0.000304 0.000501 (0.72) (0.70) (0.52) (0.65) (1.05)
Infoasy 0.252** 0.254** 0.245** 0.277*** 0.251** (2.43) (2.47) (2.32) (2.68) (2.46)
Growth 0.00644*** 0.00643*** 0.00665*** 0.00663*** 0.00616*** (4.12) (4.06) (4.19) (4.13) (3.93)
Size -1.550 -1.601* -1.283 -1.644* -2.036** (-1.59) (-1.65) (-1.29) (-1.69) (-2.11)
Lev -0.00590 -0.00214 -0.00330 -0.00107 -0.00771 (-0.15) (-0.06) (-0.08) (-0.03) (-0.20)
Uranking 0.00163 0.00240 0.00293 0.00275 0.00192 (0.47) (0.69) (0.80) (0.79) (0.57)
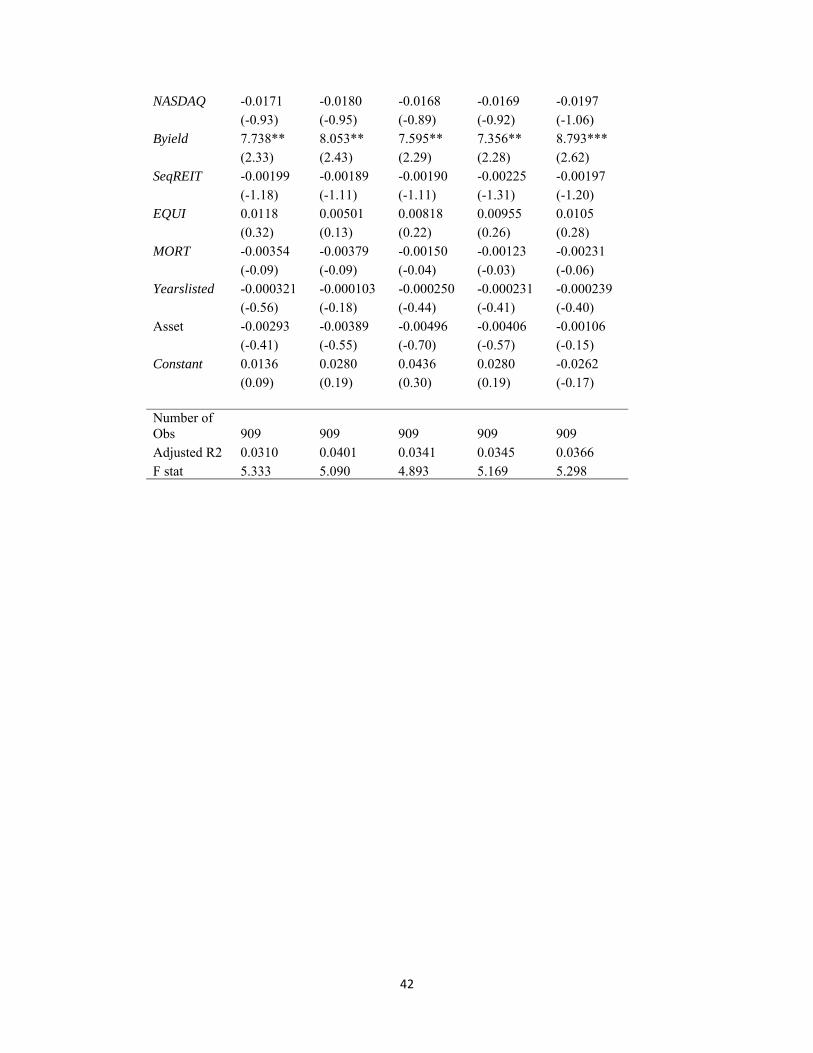
42
NASDAQ -0.0171 -0.0180 -0.0168 -0.0169 -0.0197 (-0.93) (-0.95) (-0.89) (-0.92) (-1.06)
Byield 7.738** 8.053** 7.595** 7.356** 8.793*** (2.33) (2.43) (2.29) (2.28) (2.62)
SeqREIT -0.00199 -0.00189 -0.00190 -0.00225 -0.00197 (-1.18) (-1.11) (-1.11) (-1.31) (-1.20)
EQUI 0.0118 0.00501 0.00818 0.00955 0.0105 (0.32) (0.13) (0.22) (0.26) (0.28)
MORT -0.00354 -0.00379 -0.00150 -0.00123 -0.00231 (-0.09) (-0.09) (-0.04) (-0.03) (-0.06)
Yearslisted -0.000321 -0.000103 -0.000250 -0.000231 -0.000239 (-0.56) (-0.18) (-0.44) (-0.41) (-0.40)
Asset -0.00293 -0.00389 -0.00496 -0.00406 -0.00106 (-0.41) (-0.55) (-0.70) (-0.57) (-0.15)
Constant 0.0136 0.0280 0.0436 0.0280 -0.0262 (0.09) (0.19) (0.30) (0.19) (-0.17)
Number of Obs 909 909 909 909 909 Adjusted R2 0.0310 0.0401 0.0341 0.0345 0.0366 F stat 5.333 5.090 4.893 5.169 5.298
43
Table 6 Investor sentiment and SEO discounting
This table presents the result of testing the effects of investor sentiment on SEO discounting. The dependent variable is discounting, which is the percentage change in the price between the offer price and the closing price of the day prior SEO issuance. ICSR, CBINDR and BCR are the investor sentiment measures from the Index of the Index of Consumer Sentiment from Thomson Reuters/University of Michigan, the Index of Consumer Confidence from the Conference Board, the Index of Buying Condition from Thomson Reuters/University of Michigan, all orthogonalized on macroeconomic variables. HMIR is the supplier sentiment of real estate market measure from NAHB/Wells Fargo Housing Market Index of the National Association of Home Builders, orthogonalized on macroeconomic variables. Rpremia is the firm risk premium in the prior observation month. MK2BK is the market-to-book ratio in the prior observation month. Byield is the short-term government bond yield prior observation month. Asset is total asset. Clev is change in leverage ratio prior observation month. Lev is leverage ratio prior observation month. Accac is accumulative acquisition in observation year.
SeqREIT is the current SEO sequence regarding the REIT itself. Dura is number of days since last available financial results. EQUI equals to one if the firm is an equity REIT, zero otherwise. MORT equals to one if the firm is a mortgage REIT, zero otherwise. Size is the relative SEO shares offering size scaled by market capitalization. Urfee is the underwriting fee. Uranking is the underwriters’ reputation. Yearslisted is the number of years between the observation year and the IPO year. Year is the observation year. Crisis equals to one if date is between Jan 2007 and December 2009, zero otherwise. NASDAQ equals to one if the firm is listed on NASDAQ, zero otherwise.*, ** and *** represents the 10%, 5% and 1% significance level respectively. T-statistics are included in parentheses.
Variables Model1 Model2 Model3 Model4 Model5
ICSR 0.000622** (2.51)
CBINDR 0.000768*** (5.61)
BCR 0.000729*** (6.99)
HMIR -0.000485*** (-2.61)
Rpremia -0.000568* -0.000630** -0.000655** -0.000618** -0.000601** (-1.84) (-2.09) (-2.16) (-2.01) (-1.98)
Infoasy 0.0808 0.0831* 0.0770 0.0937* 0.0855* (1.62) (1.67) (1.59) (1.93) (1.72)
Growth -0.000222 -0.000191 -0.0000651 -0.00000306 -0.000177 (-0.25) (-0.21) (-0.07) (-0.00) (-0.20)
Size 0.00937 -0.0635 0.0565 -0.131 0.0856 (0.01) (-0.08) (0.07) (-0.16) (0.10)
Uranking -0.00231 -0.00212 -0.00132 -0.00144 -0.00245 (-1.05) (-0.97) (-0.59) (-0.66) (-1.11)
Lev 0.00319 0.00335 0.00456 0.00580 0.00535 (0.18) (0.19) (0.26) (0.32) (0.29)
44
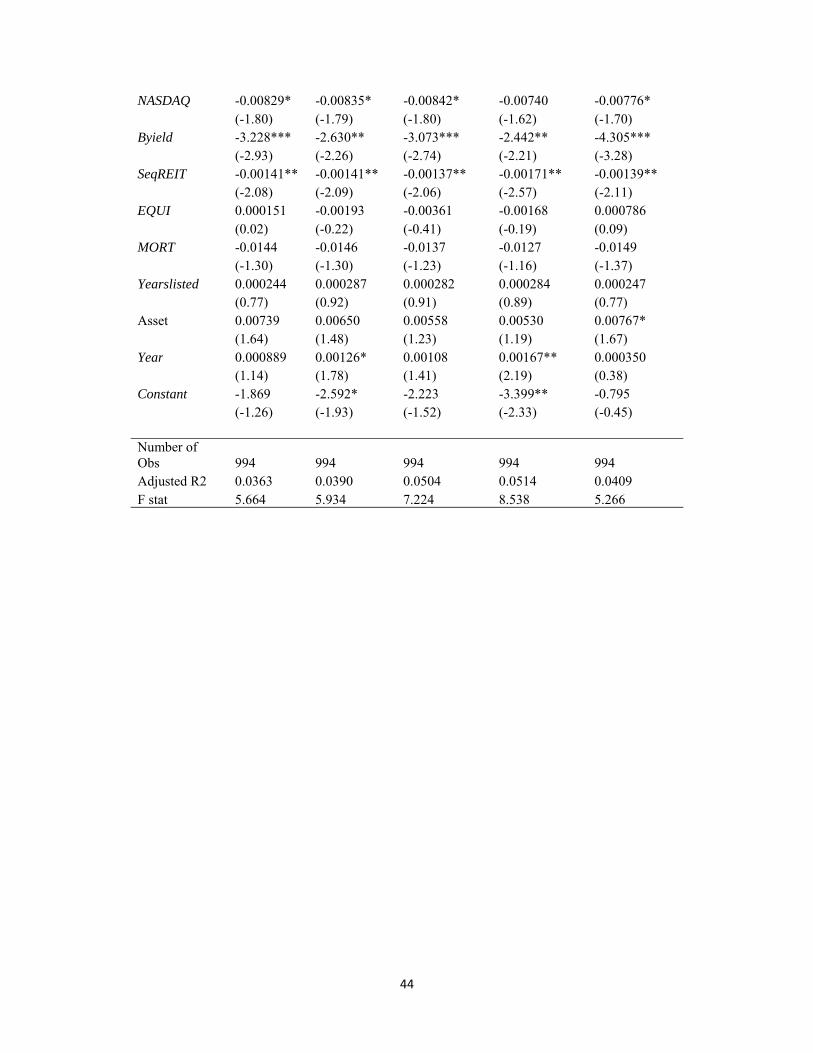
NASDAQ -0.00829* -0.00835* -0.00842* -0.00740 -0.00776* (-1.80) (-1.79) (-1.80) (-1.62) (-1.70)
Byield -3.228*** -2.630** -3.073*** -2.442** -4.305*** (-2.93) (-2.26) (-2.74) (-2.21) (-3.28)
SeqREIT -0.00141** -0.00141** -0.00137** -0.00171** -0.00139** (-2.08) (-2.09) (-2.06) (-2.57) (-2.11)
EQUI 0.000151 -0.00193 -0.00361 -0.00168 0.000786 (0.02) (-0.22) (-0.41) (-0.19) (0.09)
MORT -0.0144 -0.0146 -0.0137 -0.0127 -0.0149 (-1.30) (-1.30) (-1.23) (-1.16) (-1.37)
Yearslisted 0.000244 0.000287 0.000282 0.000284 0.000247 (0.77) (0.92) (0.91) (0.89) (0.77)
Asset 0.00739 0.00650 0.00558 0.00530 0.00767* (1.64) (1.48) (1.23) (1.19) (1.67)
Year 0.000889 0.00126* 0.00108 0.00167** 0.000350 (1.14) (1.78) (1.41) (2.19) (0.38)
Constant -1.869 -2.592* -2.223 -3.399** -0.795 (-1.26) (-1.93) (-1.52) (-2.33) (-0.45)
Number of Obs 994 994 994 994 994 Adjusted R2 0.0363 0.0390 0.0504 0.0514 0.0409 F stat 5.664 5.934 7.224 8.538 5.266
45
Table 7 Investor sentiment and SEO underpricing
This table presents the result of testing the effects of investor sentiment on SEO underpricing. The dependent variable is underpricing, which is the percentage change in the price between the offer price and the first-day closing price. ICSR, CBINDR and BCR are the investor sentiment measures from the Index of the Index of Consumer Sentiment from Thomson Reuters/University of Michigan, the Index of Consumer Confidence from the Conference Board, the Index of Buying Condition from Thomson Reuters/University of Michigan, all orthogonalized on macroeconomic variables. HMIR is the supplier sentiment of real estate market measure from NAHB/Wells Fargo Housing Market Index of the National Association of Home Builders, orthogonalized on macroeconomic variables. Rpremia is the firm risk premium in the prior observation month. MK2BK is the market-to-book ratio in the prior observation month. Byield is the short-term government bond yield prior observation month. Asset is total asset. Clev is change in leverage ratio prior observation month. Lev is leverage ratio prior observation month. Accac is accumulative acquisition in observation year. SeqREIT is the current SEO sequence regarding the REIT itself. Dura is number of days since last available financial results. EQUI equals to one if the firm is an equity REIT, zero otherwise. MORT equals to one if the firm is a mortgage REIT, zero otherwise. Size is the relative SEO shares offering size scaled by market capitalization. Urfee is the underwriting fee. Uranking is the underwriters’ reputation. Yearslisted is the number of years between the observation year and the IPO year. Year is the observation year. Crisis equals to one if date is between Jan 2007 and December 2009, zero otherwise. NASDAQ equals to one if the firm is listed on NASDAQ, zero otherwise. *, ** and *** represents the 10%, 5% and 1% significance level respectively. T-statistics are included in parentheses.
Variables Model1 Model2 Model3 Model4 Model5 ICSR 0.000792***
(4.00) CBINDR 0.000502***
(4.13) BCR 0.000607***
(6.47)HMIR -0.000147
(-1.27) Rpremia 0.0442** 0.0414** 0.0408** 0.0418** 0.0443**
(2.45) (2.31) (2.26) (2.33) (2.47) Infoasy 0.0620 0.0630 0.0588 0.0721* 0.0630
(1.58) (1.64) (1.50) (1.89) (1.61) Growth -0.000708 -0.000660 -0.000599 -0.000521 -0.000693
(-1.39) (-1.29) (-1.18) (-1.02) (-1.37) Size -2.383** -2.255** -2.123** -2.336** -2.355**
(-2.26) (-2.16) (-2.02) (-2.23) (-2.26) Uranking -0.00421** -0.00396** -0.00356* -0.00348* -0.00425**
(-2.30) (-2.16) (-1.88) (-1.90) (-2.31) Lev 0.00689 0.00699 0.00767 0.00898 0.00755
(0.90) (0.94) (1.03) (1.19) (0.99) NASDAQ -0.0107*** -0.0108*** -0.0108*** -0.00999*** -0.0105***
(-3.57) (-3.66) (-3.72) (-3.27) (-3.53) Byield 2.944* 3.484* 2.775 3.408* 2.626
(1.68) (1.97) (1.59) (1.94) (1.48)
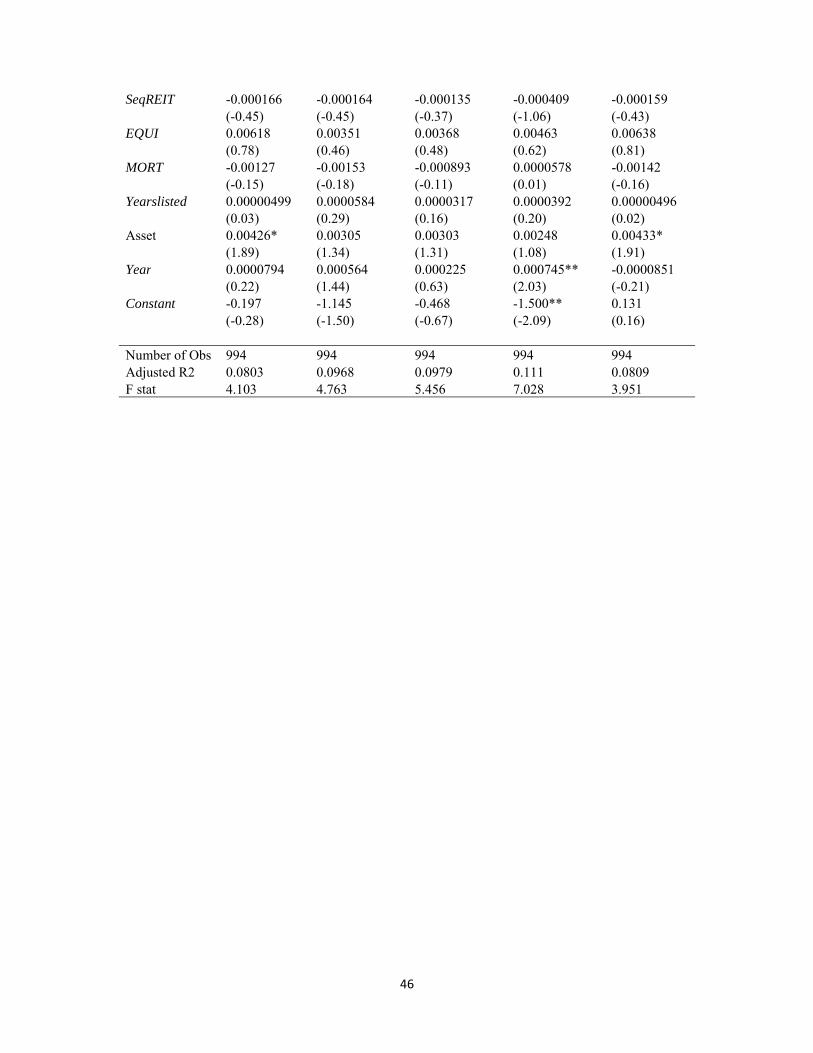
46
SeqREIT -0.000166 -0.000164 -0.000135 -0.000409 -0.000159 (-0.45) (-0.45) (-0.37) (-1.06) (-0.43)
EQUI 0.00618 0.00351 0.00368 0.00463 0.00638 (0.78) (0.46) (0.48) (0.62) (0.81)
MORT -0.00127 -0.00153 -0.000893 0.0000578 -0.00142 (-0.15) (-0.18) (-0.11) (0.01) (-0.16)
Yearslisted 0.00000499 0.0000584 0.0000317 0.0000392 0.00000496 (0.03) (0.29) (0.16) (0.20) (0.02)
Asset 0.00426* 0.00305 0.00303 0.00248 0.00433* (1.89) (1.34) (1.31) (1.08) (1.91)
Year 0.0000794 0.000564 0.000225 0.000745** -0.0000851(0.22) (1.44) (0.63) (2.03) (-0.21)
Constant -0.197 -1.145 -0.468 -1.500** 0.131 (-0.28) (-1.50) (-0.67) (-2.09) (0.16)
Number of Obs 994 994 994 994 994 Adjusted R2 0.0803 0.0968 0.0979 0.111 0.0809 F stat 4.103 4.763 5.456 7.028 3.951
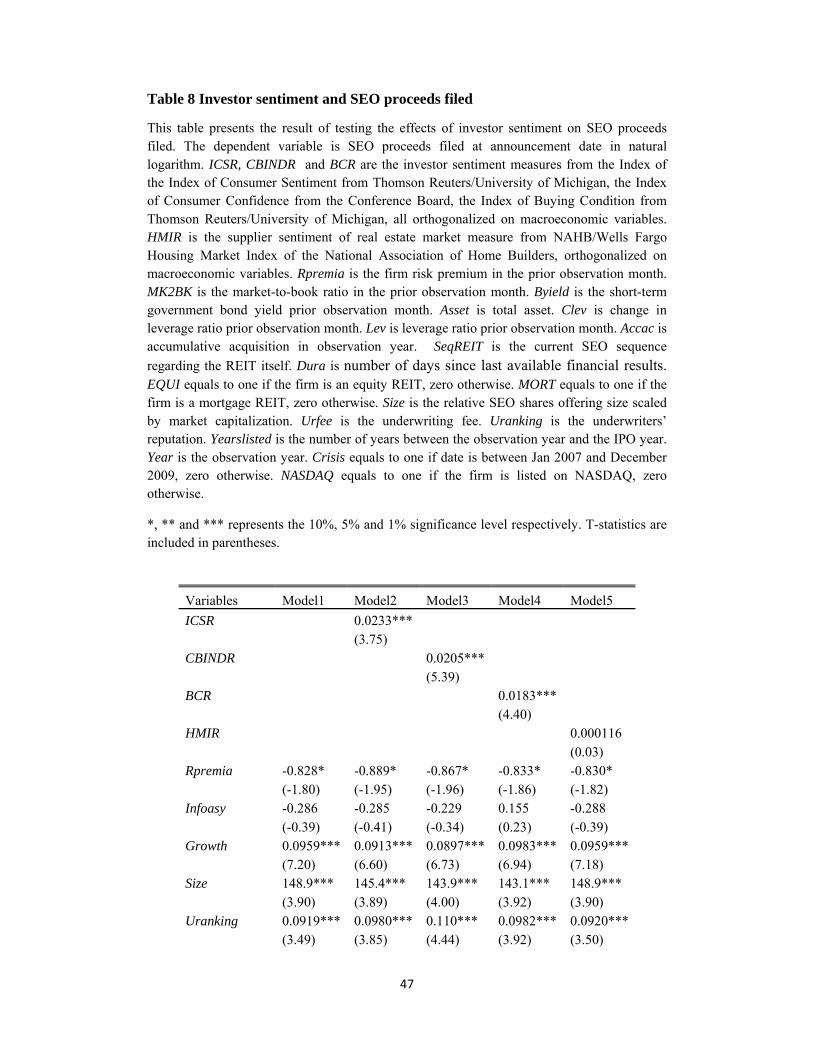
47
Table 8 Investor sentiment and SEO proceeds filed
This table presents the result of testing the effects of investor sentiment on SEO proceeds filed. The dependent variable is SEO proceeds filed at announcement date in natural logarithm. ICSR, CBINDR and BCR are the investor sentiment measures from the Index of the Index of Consumer Sentiment from Thomson Reuters/University of Michigan, the Index of Consumer Confidence from the Conference Board, the Index of Buying Condition from Thomson Reuters/University of Michigan, all orthogonalized on macroeconomic variables. HMIR is the supplier sentiment of real estate market measure from NAHB/Wells Fargo Housing Market Index of the National Association of Home Builders, orthogonalized on macroeconomic variables. Rpremia is the firm risk premium in the prior observation month. MK2BK is the market-to-book ratio in the prior observation month. Byield is the short-term government bond yield prior observation month. Asset is total asset. Clev is change in leverage ratio prior observation month. Lev is leverage ratio prior observation month. Accac is accumulative acquisition in observation year. SeqREIT is the current SEO sequence
regarding the REIT itself. Dura is number of days since last available financial results. EQUI equals to one if the firm is an equity REIT, zero otherwise. MORT equals to one if the firm is a mortgage REIT, zero otherwise. Size is the relative SEO shares offering size scaled by market capitalization. Urfee is the underwriting fee. Uranking is the underwriters’ reputation. Yearslisted is the number of years between the observation year and the IPO year. Year is the observation year. Crisis equals to one if date is between Jan 2007 and December 2009, zero otherwise. NASDAQ equals to one if the firm is listed on NASDAQ, zero otherwise.
*, ** and *** represents the 10%, 5% and 1% significance level respectively. T-statistics are included in parentheses.
Variables Model1 Model2 Model3 Model4 Model5
ICSR 0.0233*** (3.75)
CBINDR 0.0205***(5.39)
BCR 0.0183***(4.40)
HMIR 0.000116 (0.03)
Rpremia -0.828* -0.889* -0.867* -0.833* -0.830* (-1.80) (-1.95) (-1.96) (-1.86) (-1.82)
Infoasy -0.286 -0.285 -0.229 0.155 -0.288 (-0.39) (-0.41) (-0.34) (0.23) (-0.39)
Growth 0.0959*** 0.0913*** 0.0897*** 0.0983*** 0.0959*** (7.20) (6.60) (6.73) (6.94) (7.18)
Size 148.9*** 145.4*** 143.9*** 143.1*** 148.9*** (3.90) (3.89) (4.00) (3.92) (3.90)
Uranking 0.0919*** 0.0980*** 0.110*** 0.0982*** 0.0920*** (3.49) (3.85) (4.44) (3.92) (3.50)
48
Lev -0.253 -0.233 -0.220 -0.171 -0.253 (-0.97) (-0.89) (-0.87) (-0.65) (-0.96)
Year -0.00497 0.00229 -0.00654 -0.000645 -0.00491 (-0.44) (0.21) (-0.65) (-0.06) (-0.41)
NASDAQ 0.575*** 0.605*** 0.650*** 0.568*** 0.575*** (5.05) (5.20) (5.48) (4.69) (5.04)
Byield 118.0** 140.4*** 106.3** 139.3*** 118.2** (2.40) (2.83) (2.29) (2.82) (2.34)
SeqREIT 0.0448*** 0.0438*** 0.0436*** 0.0455*** 0.0448*** (3.63) (3.60) (3.66) (3.84) (3.62)
EQUI 0.196 0.0855 0.0534 0.114 0.195 (1.11) (0.43) (0.28) (0.60) (1.12)
MORT 0.00714 -0.0648 -0.0792 -0.0723 0.00696 (0.03) (-0.26) (-0.34) (-0.30) (0.03)
Yearslisted -0.00519 -0.00378 -0.00388 -0.00587 -0.00519 (-0.57) (-0.45) (-0.48) (-0.70) (-0.57)
Constant 12.46 -2.098 15.56 3.760 12.34 (0.55) (-0.10) (0.77) (0.17) (0.52)
Number of Obs 833 833 833 833 833 Adjusted R2 0.393 0.407 0.422 0.415 0.392 F stat 26.28 25.12 31.99 25.79 24.49
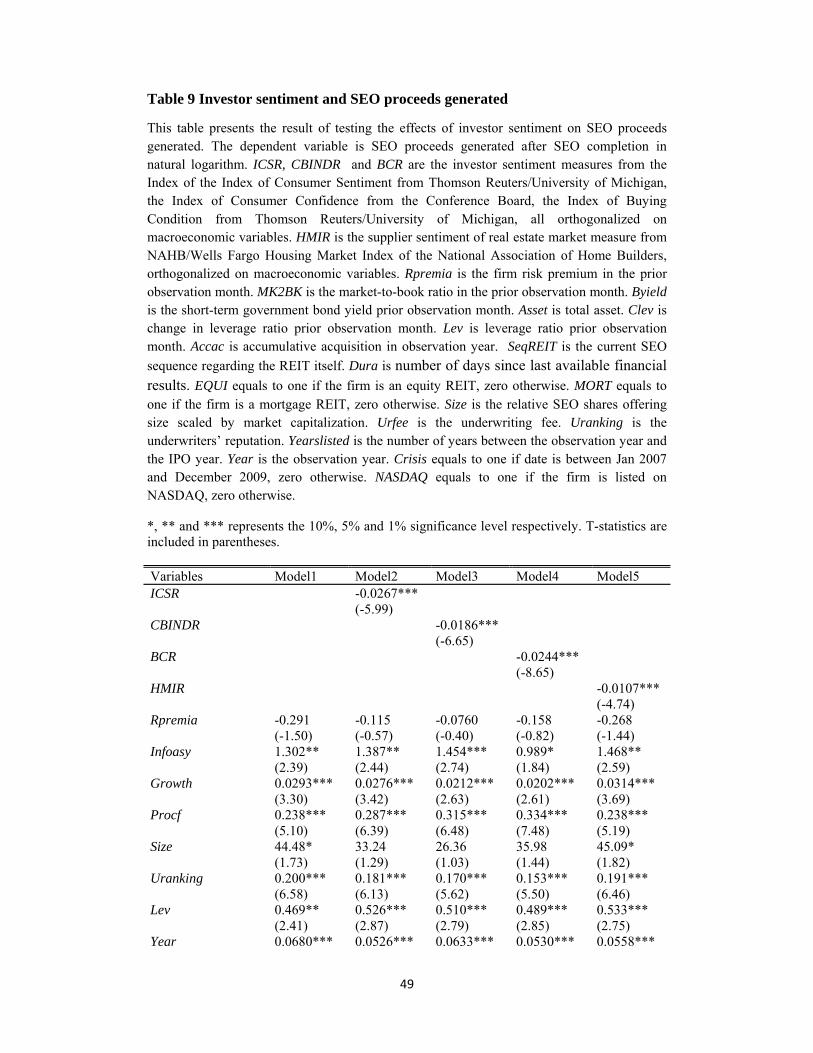
49
Table 9 Investor sentiment and SEO proceeds generated
This table presents the result of testing the effects of investor sentiment on SEO proceeds generated. The dependent variable is SEO proceeds generated after SEO completion in natural logarithm. ICSR, CBINDR and BCR are the investor sentiment measures from the Index of the Index of Consumer Sentiment from Thomson Reuters/University of Michigan, the Index of Consumer Confidence from the Conference Board, the Index of Buying Condition from Thomson Reuters/University of Michigan, all orthogonalized on macroeconomic variables. HMIR is the supplier sentiment of real estate market measure from NAHB/Wells Fargo Housing Market Index of the National Association of Home Builders, orthogonalized on macroeconomic variables. Rpremia is the firm risk premium in the prior observation month. MK2BK is the market-to-book ratio in the prior observation month. Byield is the short-term government bond yield prior observation month. Asset is total asset. Clev is change in leverage ratio prior observation month. Lev is leverage ratio prior observation month. Accac is accumulative acquisition in observation year. SeqREIT is the current SEO
sequence regarding the REIT itself. Dura is number of days since last available financial results. EQUI equals to one if the firm is an equity REIT, zero otherwise. MORT equals to one if the firm is a mortgage REIT, zero otherwise. Size is the relative SEO shares offering size scaled by market capitalization. Urfee is the underwriting fee. Uranking is the underwriters’ reputation. Yearslisted is the number of years between the observation year and the IPO year. Year is the observation year. Crisis equals to one if date is between Jan 2007 and December 2009, zero otherwise. NASDAQ equals to one if the firm is listed on NASDAQ, zero otherwise.
*, ** and *** represents the 10%, 5% and 1% significance level respectively. T-statistics are included in parentheses. Variables Model1 Model2 Model3 Model4 Model5 ICSR -0.0267***
(-5.99) CBINDR -0.0186***
(-6.65) BCR -0.0244***
(-8.65) HMIR -0.0107***
(-4.74) Rpremia -0.291 -0.115 -0.0760 -0.158 -0.268
(-1.50) (-0.57) (-0.40) (-0.82) (-1.44) Infoasy 1.302** 1.387** 1.454*** 0.989* 1.468**
(2.39) (2.44) (2.74) (1.84) (2.59) Growth 0.0293*** 0.0276*** 0.0212*** 0.0202*** 0.0314***
(3.30) (3.42) (2.63) (2.61) (3.69) Procf 0.238*** 0.287*** 0.315*** 0.334*** 0.238***
(5.10) (6.39) (6.48) (7.48) (5.19) Size 44.48* 33.24 26.36 35.98 45.09*
(1.73) (1.29) (1.03) (1.44) (1.82) Uranking 0.200*** 0.181*** 0.170*** 0.153*** 0.191***
(6.58) (6.13) (5.62) (5.50) (6.46) Lev 0.469** 0.526*** 0.510*** 0.489*** 0.533***
(2.41) (2.87) (2.79) (2.85) (2.75) Year 0.0680*** 0.0526*** 0.0633*** 0.0530*** 0.0558***

50
(8.15) (6.49) (8.40) (6.65) (6.62) NASDAQ 0.0202 0.0203 0.0296 -0.0144 0.0235
(0.19) (0.20) (0.30) (-0.15) (0.22) Byield -76.01*** -99.84*** -77.48*** -100.8*** -101.5***
(-3.40) (-4.36) (-3.56) (-4.58) (-4.50) SeqREIT -0.0200** -0.0196** -0.0220** -0.0114 -0.0192**
(-2.13) (-2.26) (-2.52) (-1.48) (-2.08) EQUI -0.262** -0.197** -0.219** -0.210** -0.247***
(-2.56) (-2.11) (-2.18) (-2.43) (-2.73) MORT -0.141 -0.122 -0.159 -0.166 -0.156
(-0.75) (-0.68) (-0.87) (-0.98) (-0.87) Yearslisted 0.00271 0.00113 0.00202 0.00220 0.00246
(0.70) (0.28) (0.53) (0.59) (0.58) Constant -134.5*** -103.8*** -125.3*** -104.6*** -110.1***
(-8.04) (-6.39) (-8.29) (-6.55) (-6.51) Number of Obs 796 796 796 796 796 Adjusted R2 0.403 0.431 0.439 0.477 0.415 F stat 24.15 23.63 23.24 23.10 27.47
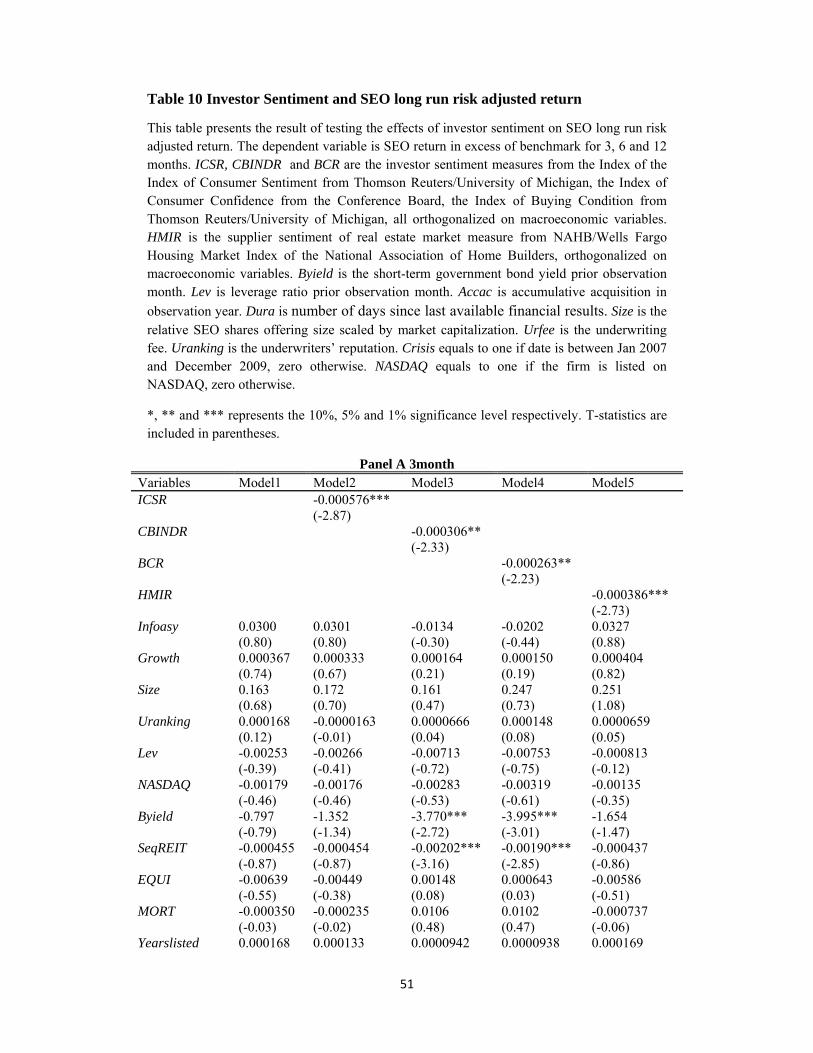
51
Table 10 Investor Sentiment and SEO long run risk adjusted return
This table presents the result of testing the effects of investor sentiment on SEO long run risk adjusted return. The dependent variable is SEO return in excess of benchmark for 3, 6 and 12 months. ICSR, CBINDR and BCR are the investor sentiment measures from the Index of the Index of Consumer Sentiment from Thomson Reuters/University of Michigan, the Index of Consumer Confidence from the Conference Board, the Index of Buying Condition from Thomson Reuters/University of Michigan, all orthogonalized on macroeconomic variables. HMIR is the supplier sentiment of real estate market measure from NAHB/Wells Fargo Housing Market Index of the National Association of Home Builders, orthogonalized on macroeconomic variables. Byield is the short-term government bond yield prior observation month. Lev is leverage ratio prior observation month. Accac is accumulative acquisition in
observation year. Dura is number of days since last available financial results. Size is the relative SEO shares offering size scaled by market capitalization. Urfee is the underwriting fee. Uranking is the underwriters’ reputation. Crisis equals to one if date is between Jan 2007 and December 2009, zero otherwise. NASDAQ equals to one if the firm is listed on NASDAQ, zero otherwise.
*, ** and *** represents the 10%, 5% and 1% significance level respectively. T-statistics are included in parentheses.
Panel A 3month Variables Model1 Model2 Model3 Model4 Model5 ICSR -0.000576***
(-2.87) CBINDR -0.000306**
(-2.33) BCR -0.000263**
(-2.23) HMIR -0.000386***
(-2.73) Infoasy 0.0300 0.0301 -0.0134 -0.0202 0.0327
(0.80) (0.80) (-0.30) (-0.44) (0.88) Growth 0.000367 0.000333 0.000164 0.000150 0.000404
(0.74) (0.67) (0.21) (0.19) (0.82) Size 0.163 0.172 0.161 0.247 0.251
(0.68) (0.70) (0.47) (0.73) (1.08) Uranking 0.000168 -0.0000163 0.0000666 0.000148 0.0000659
(0.12) (-0.01) (0.04) (0.08) (0.05) Lev -0.00253 -0.00266 -0.00713 -0.00753 -0.000813
(-0.39) (-0.41) (-0.72) (-0.75) (-0.12) NASDAQ -0.00179 -0.00176 -0.00283 -0.00319 -0.00135
(-0.46) (-0.46) (-0.53) (-0.61) (-0.35) Byield -0.797 -1.352 -3.770*** -3.995*** -1.654
(-0.79) (-1.34) (-2.72) (-3.01) (-1.47) SeqREIT -0.000455 -0.000454 -0.00202*** -0.00190*** -0.000437
(-0.87) (-0.87) (-3.16) (-2.85) (-0.86) EQUI -0.00639 -0.00449 0.00148 0.000643 -0.00586
(-0.55) (-0.38) (0.08) (0.03) (-0.51) MORT -0.000350 -0.000235 0.0106 0.0102 -0.000737
(-0.03) (-0.02) (0.48) (0.47) (-0.06) Yearslisted 0.000168 0.000133 0.0000942 0.0000938 0.000169
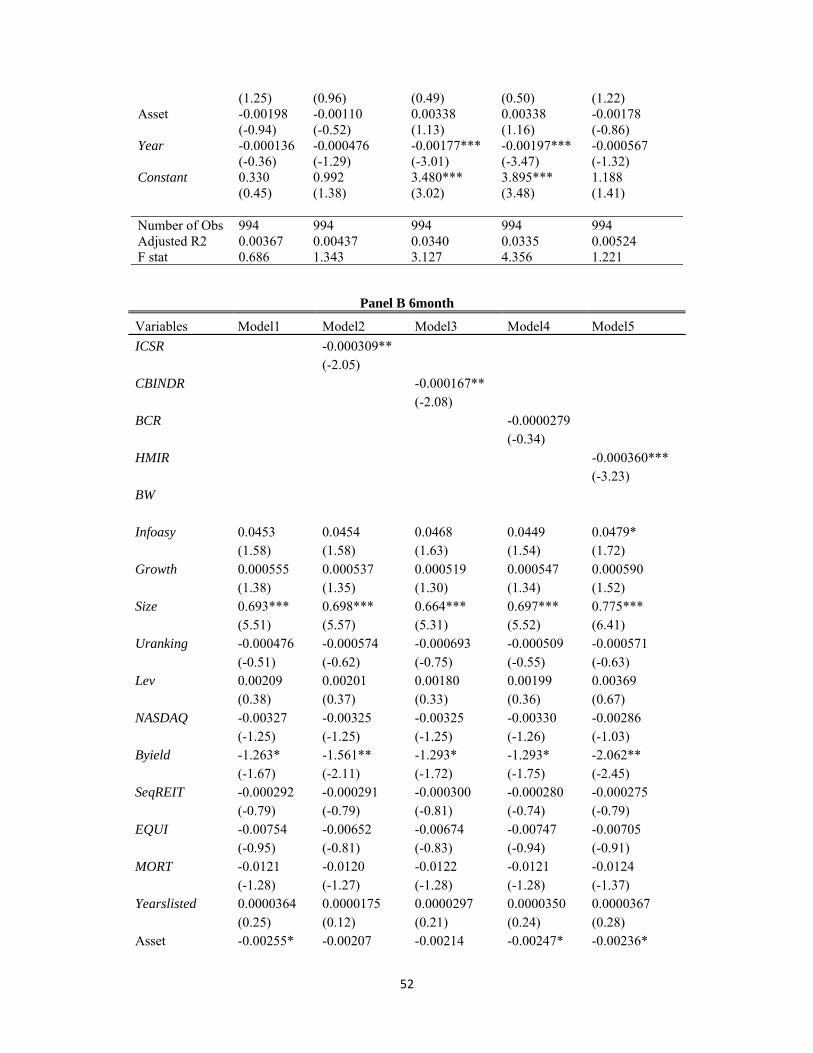
52
(1.25) (0.96) (0.49) (0.50) (1.22) Asset -0.00198 -0.00110 0.00338 0.00338 -0.00178
(-0.94) (-0.52) (1.13) (1.16) (-0.86) Year -0.000136 -0.000476 -0.00177*** -0.00197*** -0.000567
(-0.36) (-1.29) (-3.01) (-3.47) (-1.32) Constant 0.330 0.992 3.480*** 3.895*** 1.188
(0.45) (1.38) (3.02) (3.48) (1.41) Number of Obs 994 994 994 994 994 Adjusted R2 0.00367 0.00437 0.0340 0.0335 0.00524 F stat 0.686 1.343 3.127 4.356 1.221
Panel B 6month
Variables Model1 Model2 Model3 Model4 Model5
ICSR -0.000309** (-2.05)
CBINDR -0.000167** (-2.08)
BCR -0.0000279 (-0.34)
HMIR -0.000360*** (-3.23)
BW
Infoasy 0.0453 0.0454 0.0468 0.0449 0.0479* (1.58) (1.58) (1.63) (1.54) (1.72)
Growth 0.000555 0.000537 0.000519 0.000547 0.000590 (1.38) (1.35) (1.30) (1.34) (1.52)
Size 0.693*** 0.698*** 0.664*** 0.697*** 0.775*** (5.51) (5.57) (5.31) (5.52) (6.41)
Uranking -0.000476 -0.000574 -0.000693 -0.000509 -0.000571 (-0.51) (-0.62) (-0.75) (-0.55) (-0.63)
Lev 0.00209 0.00201 0.00180 0.00199 0.00369 (0.38) (0.37) (0.33) (0.36) (0.67)
NASDAQ -0.00327 -0.00325 -0.00325 -0.00330 -0.00286 (-1.25) (-1.25) (-1.25) (-1.26) (-1.03)
Byield -1.263* -1.561** -1.293* -1.293* -2.062** (-1.67) (-2.11) (-1.72) (-1.75) (-2.45)
SeqREIT -0.000292 -0.000291 -0.000300 -0.000280 -0.000275 (-0.79) (-0.79) (-0.81) (-0.74) (-0.79)
EQUI -0.00754 -0.00652 -0.00674 -0.00747 -0.00705 (-0.95) (-0.81) (-0.83) (-0.94) (-0.91)
MORT -0.0121 -0.0120 -0.0122 -0.0121 -0.0124 (-1.28) (-1.27) (-1.28) (-1.28) (-1.37)
Yearslisted 0.0000364 0.0000175 0.0000297 0.0000350 0.0000367 (0.25) (0.12) (0.21) (0.24) (0.28)
Asset -0.00255* -0.00207 -0.00214 -0.00247* -0.00236*
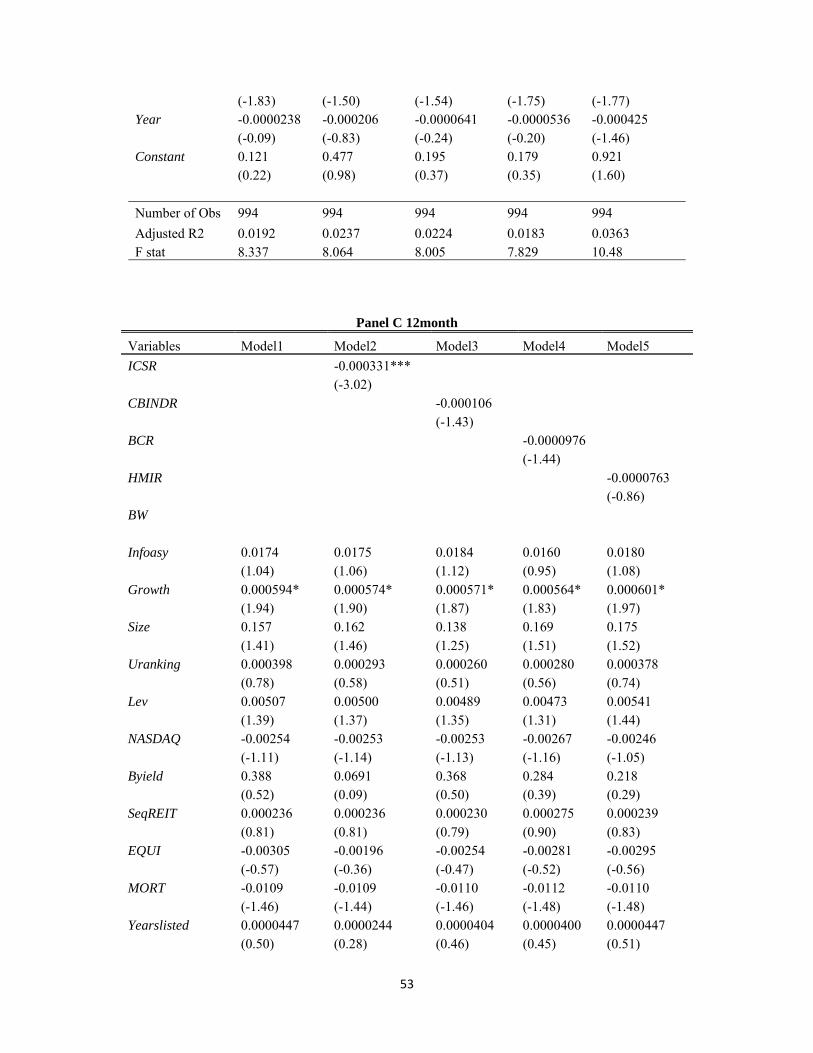
53
(-1.83) (-1.50) (-1.54) (-1.75) (-1.77) Year -0.0000238 -0.000206 -0.0000641 -0.0000536 -0.000425
(-0.09) (-0.83) (-0.24) (-0.20) (-1.46) Constant 0.121 0.477 0.195 0.179 0.921
(0.22) (0.98) (0.37) (0.35) (1.60)
Number of Obs 994 994 994 994 994
Adjusted R2 0.0192 0.0237 0.0224 0.0183 0.0363 F stat 8.337 8.064 8.005 7.829 10.48
Panel C 12month
Variables Model1 Model2 Model3 Model4 Model5
ICSR -0.000331*** (-3.02)
CBINDR -0.000106 (-1.43)
BCR -0.0000976 (-1.44)
HMIR -0.0000763(-0.86)
BW
Infoasy 0.0174 0.0175 0.0184 0.0160 0.0180 (1.04) (1.06) (1.12) (0.95) (1.08)
Growth 0.000594* 0.000574* 0.000571* 0.000564* 0.000601*(1.94) (1.90) (1.87) (1.83) (1.97)
Size 0.157 0.162 0.138 0.169 0.175 (1.41) (1.46) (1.25) (1.51) (1.52)
Uranking 0.000398 0.000293 0.000260 0.000280 0.000378 (0.78) (0.58) (0.51) (0.56) (0.74)
Lev 0.00507 0.00500 0.00489 0.00473 0.00541 (1.39) (1.37) (1.35) (1.31) (1.44)
NASDAQ -0.00254 -0.00253 -0.00253 -0.00267 -0.00246 (-1.11) (-1.14) (-1.13) (-1.16) (-1.05)
Byield 0.388 0.0691 0.368 0.284 0.218 (0.52) (0.09) (0.50) (0.39) (0.29)
SeqREIT 0.000236 0.000236 0.000230 0.000275 0.000239 (0.81) (0.81) (0.79) (0.90) (0.83)
EQUI -0.00305 -0.00196 -0.00254 -0.00281 -0.00295 (-0.57) (-0.36) (-0.47) (-0.52) (-0.56)
MORT -0.0109 -0.0109 -0.0110 -0.0112 -0.0110 (-1.46) (-1.44) (-1.46) (-1.48) (-1.48)
Yearslisted 0.0000447 0.0000244 0.0000404 0.0000400 0.0000447 (0.50) (0.28) (0.46) (0.45) (0.51)

54
Asset -0.00304*** -0.00254** -0.00278** -0.00276** -0.00300***(-2.77) (-2.25) (-2.45) (-2.44) (-2.73)
Year 0.000529** 0.000334 0.000504** 0.000425* 0.000444* (2.23) (1.49) (2.18) (1.80) (1.78)
Constant -0.998** -0.618 -0.951** -0.794* -0.828* (-2.12) (-1.39) (-2.08) (-1.70) (-1.68)
Number of Obs 994 994 994 994 994 Adjusted R2 0.0267 0.0364 0.0286 0.0285 0.0271 F stat 2.544 3.025 2.508 2.548 2.473
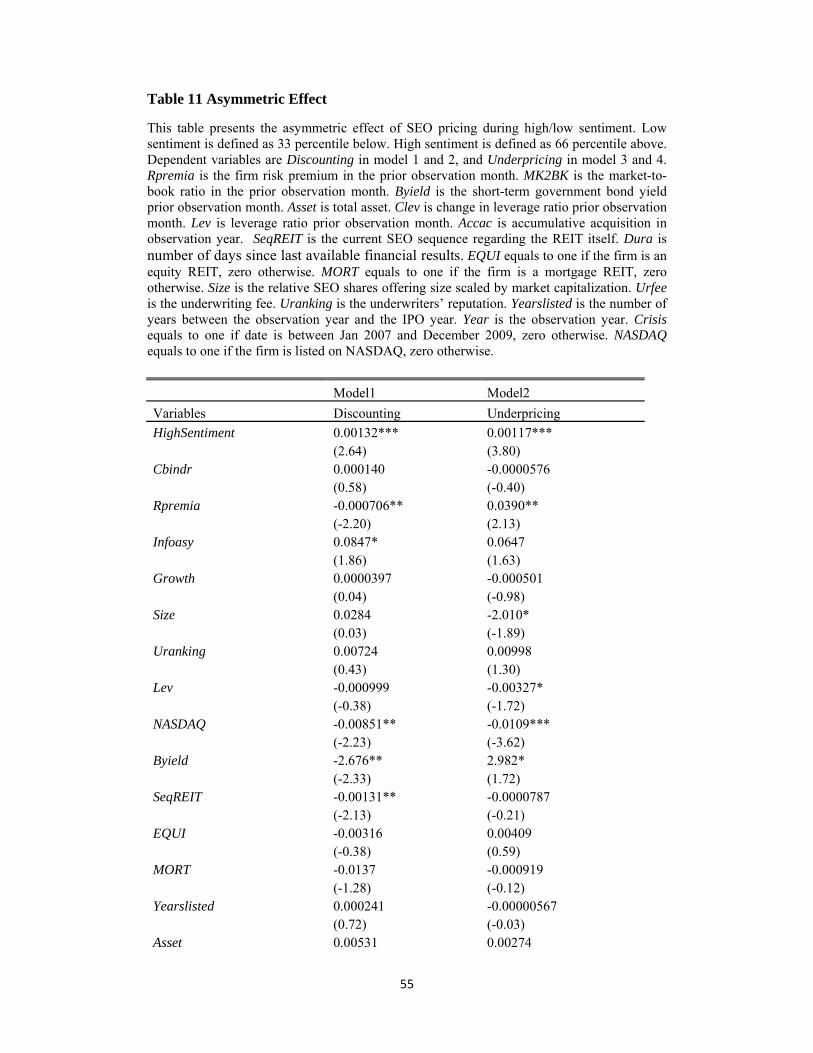
55
Table 11 Asymmetric Effect
This table presents the asymmetric effect of SEO pricing during high/low sentiment. Low sentiment is defined as 33 percentile below. High sentiment is defined as 66 percentile above. Dependent variables are Discounting in model 1 and 2, and Underpricing in model 3 and 4. Rpremia is the firm risk premium in the prior observation month. MK2BK is the market-to-book ratio in the prior observation month. Byield is the short-term government bond yield prior observation month. Asset is total asset. Clev is change in leverage ratio prior observation month. Lev is leverage ratio prior observation month. Accac is accumulative acquisition in observation year. SeqREIT is the current SEO sequence regarding the REIT itself. Dura is number of days since last available financial results. EQUI equals to one if the firm is an equity REIT, zero otherwise. MORT equals to one if the firm is a mortgage REIT, zero otherwise. Size is the relative SEO shares offering size scaled by market capitalization. Urfee is the underwriting fee. Uranking is the underwriters’ reputation. Yearslisted is the number of years between the observation year and the IPO year. Year is the observation year. Crisis equals to one if date is between Jan 2007 and December 2009, zero otherwise. NASDAQ equals to one if the firm is listed on NASDAQ, zero otherwise.
Model1 Model2
Variables Discounting Underpricing
HighSentiment 0.00132*** 0.00117*** (2.64) (3.80)
Cbindr 0.000140 -0.0000576 (0.58) (-0.40)
Rpremia -0.000706** 0.0390** (-2.20) (2.13)
Infoasy 0.0847* 0.0647 (1.86) (1.63)
Growth 0.0000397 -0.000501 (0.04) (-0.98)
Size 0.0284 -2.010* (0.03) (-1.89)
Uranking 0.00724 0.00998 (0.43) (1.30)
Lev -0.000999 -0.00327* (-0.38) (-1.72)
NASDAQ -0.00851** -0.0109*** (-2.23) (-3.62)
Byield -2.676** 2.982* (-2.33) (1.72)
SeqREIT -0.00131** -0.0000787 (-2.13) (-0.21)
EQUI -0.00316 0.00409 (-0.38) (0.59)
MORT -0.0137 -0.000919 (-1.28) (-0.12)
Yearslisted 0.000241 -0.00000567 (0.72) (-0.03)
Asset 0.00531 0.00274
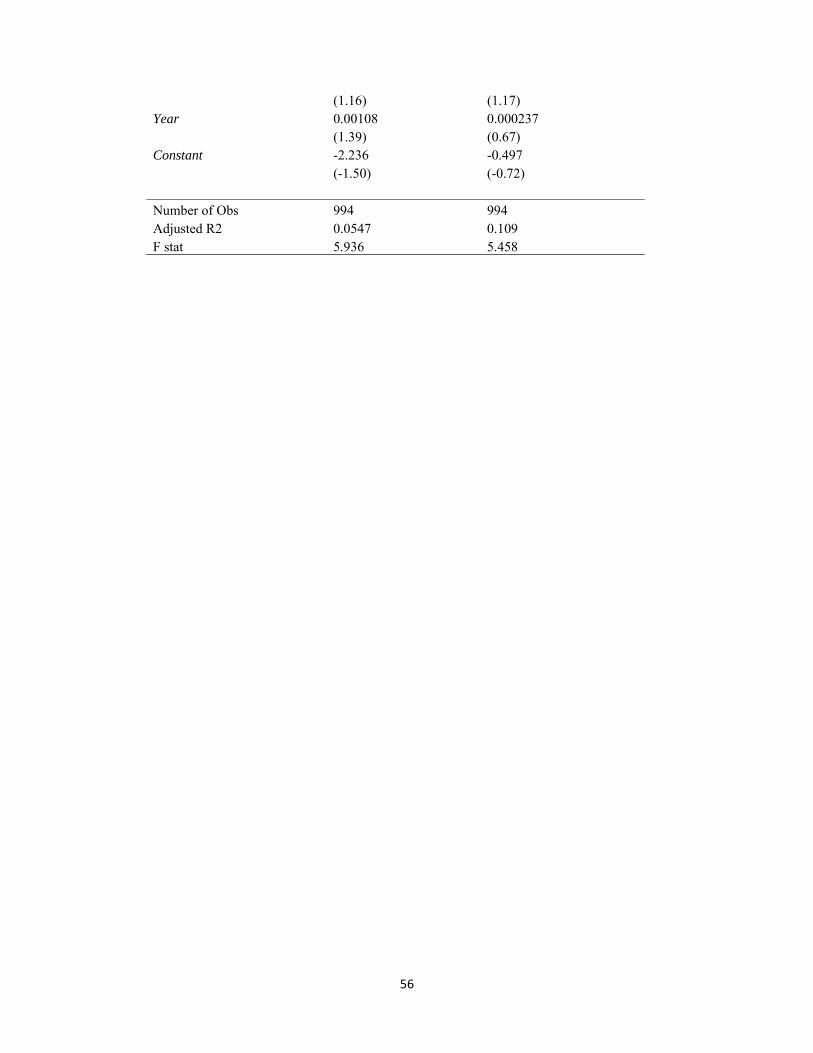
56
(1.16) (1.17) Year 0.00108 0.000237
(1.39) (0.67) Constant -2.236 -0.497
(-1.50) (-0.72) Number of Obs 994 994 Adjusted R2 0.0547 0.109 F stat 5.936 5.458
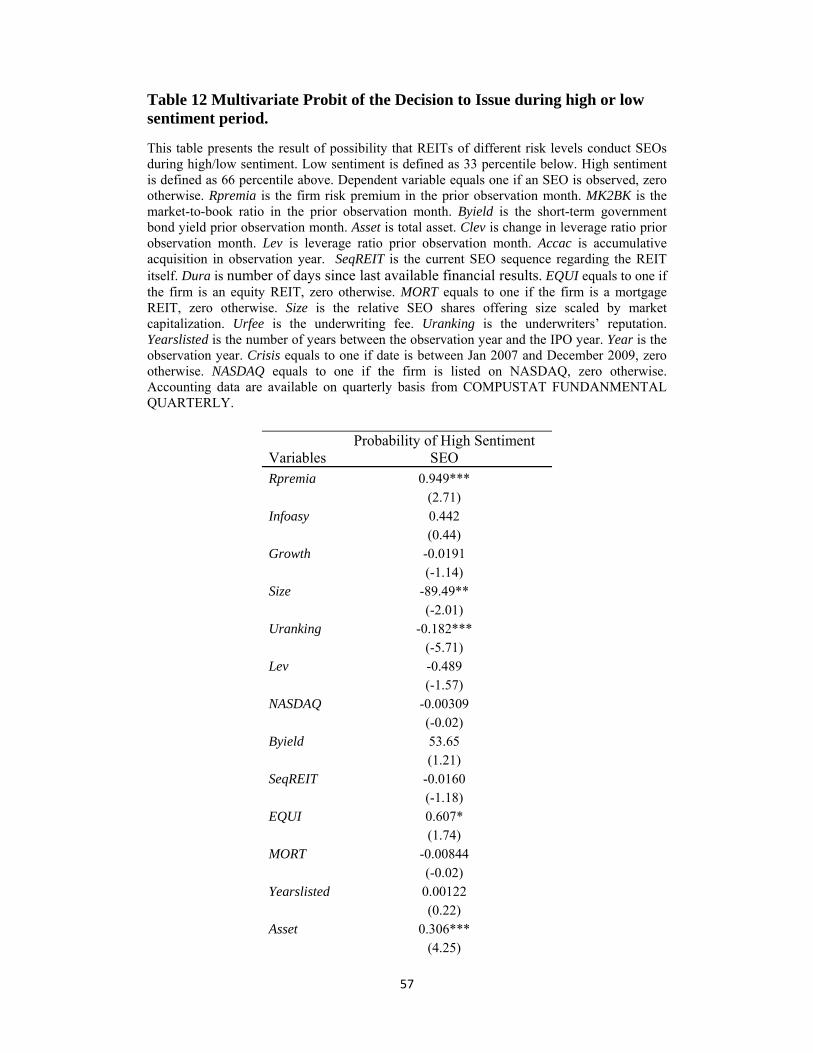
57
Table 12 Multivariate Probit of the Decision to Issue during high or low sentiment period.
This table presents the result of possibility that REITs of different risk levels conduct SEOs during high/low sentiment. Low sentiment is defined as 33 percentile below. High sentiment is defined as 66 percentile above. Dependent variable equals one if an SEO is observed, zero otherwise. Rpremia is the firm risk premium in the prior observation month. MK2BK is the market-to-book ratio in the prior observation month. Byield is the short-term government bond yield prior observation month. Asset is total asset. Clev is change in leverage ratio prior observation month. Lev is leverage ratio prior observation month. Accac is accumulative acquisition in observation year. SeqREIT is the current SEO sequence regarding the REIT itself. Dura is number of days since last available financial results. EQUI equals to one if the firm is an equity REIT, zero otherwise. MORT equals to one if the firm is a mortgage REIT, zero otherwise. Size is the relative SEO shares offering size scaled by market capitalization. Urfee is the underwriting fee. Uranking is the underwriters’ reputation. Yearslisted is the number of years between the observation year and the IPO year. Year is the observation year. Crisis equals to one if date is between Jan 2007 and December 2009, zero otherwise. NASDAQ equals to one if the firm is listed on NASDAQ, zero otherwise. Accounting data are available on quarterly basis from COMPUSTAT FUNDANMENTAL QUARTERLY.
Variables Probability of High Sentiment
SEO Rpremia 0.949***
(2.71) Infoasy 0.442
(0.44) Growth -0.0191
(-1.14) Size -89.49**
(-2.01) Uranking -0.182***
(-5.71) Lev -0.489
(-1.57) NASDAQ -0.00309
(-0.02) Byield 53.65
(1.21) SeqREIT -0.0160
(-1.18) EQUI 0.607*
(1.74) MORT -0.00844
(-0.02) Yearslisted 0.00122
(0.22) Asset 0.306***
(4.25)

58
Constant 87.99*** (2.99)
N 994Pseudo R2 0.0596
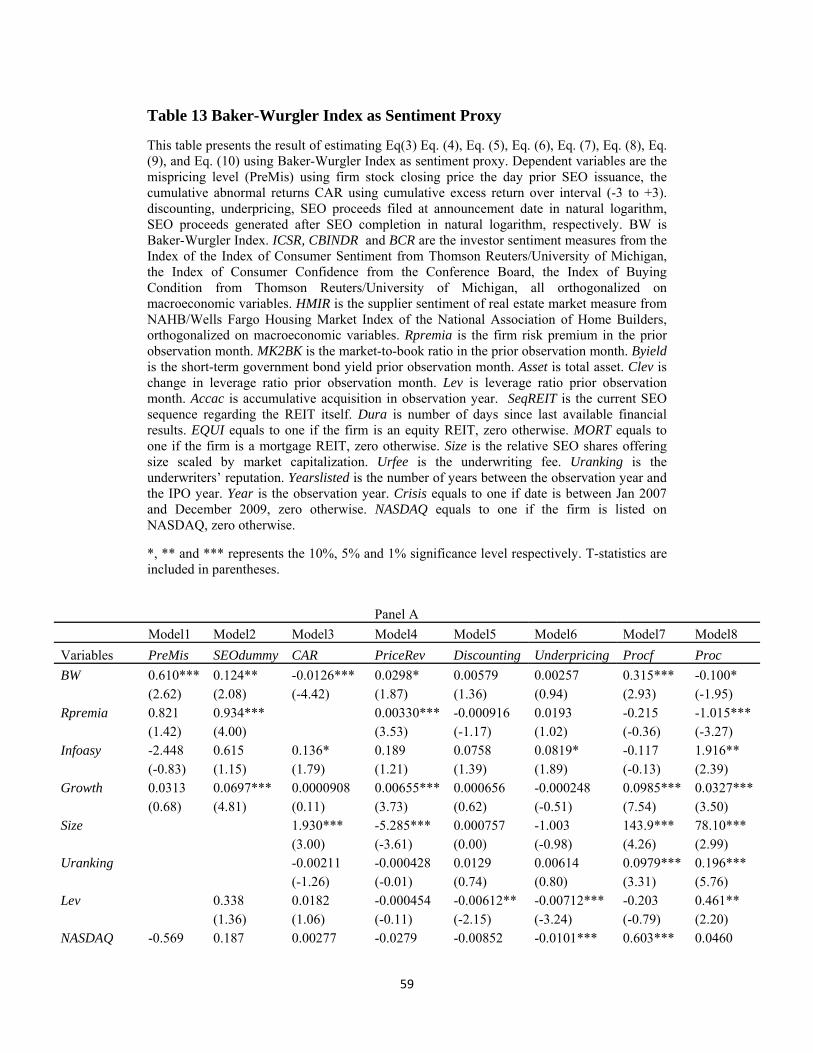
59
Table 13 Baker-Wurgler Index as Sentiment Proxy
This table presents the result of estimating Eq(3) Eq. (4), Eq. (5), Eq. (6), Eq. (7), Eq. (8), Eq. (9), and Eq. (10) using Baker-Wurgler Index as sentiment proxy. Dependent variables are the mispricing level (PreMis) using firm stock closing price the day prior SEO issuance, the cumulative abnormal returns CAR using cumulative excess return over interval (-3 to +3). discounting, underpricing, SEO proceeds filed at announcement date in natural logarithm, SEO proceeds generated after SEO completion in natural logarithm, respectively. BW is Baker-Wurgler Index. ICSR, CBINDR and BCR are the investor sentiment measures from the Index of the Index of Consumer Sentiment from Thomson Reuters/University of Michigan, the Index of Consumer Confidence from the Conference Board, the Index of Buying Condition from Thomson Reuters/University of Michigan, all orthogonalized on macroeconomic variables. HMIR is the supplier sentiment of real estate market measure from NAHB/Wells Fargo Housing Market Index of the National Association of Home Builders, orthogonalized on macroeconomic variables. Rpremia is the firm risk premium in the prior observation month. MK2BK is the market-to-book ratio in the prior observation month. Byield is the short-term government bond yield prior observation month. Asset is total asset. Clev is change in leverage ratio prior observation month. Lev is leverage ratio prior observation month. Accac is accumulative acquisition in observation year. SeqREIT is the current SEO sequence regarding the REIT itself. Dura is number of days since last available financial results. EQUI equals to one if the firm is an equity REIT, zero otherwise. MORT equals to one if the firm is a mortgage REIT, zero otherwise. Size is the relative SEO shares offering size scaled by market capitalization. Urfee is the underwriting fee. Uranking is the underwriters’ reputation. Yearslisted is the number of years between the observation year and the IPO year. Year is the observation year. Crisis equals to one if date is between Jan 2007 and December 2009, zero otherwise. NASDAQ equals to one if the firm is listed on NASDAQ, zero otherwise.
*, ** and *** represents the 10%, 5% and 1% significance level respectively. T-statistics are included in parentheses.
Panel A
Model1 Model2 Model3 Model4 Model5 Model6 Model7 Model8
Variables PreMis SEOdummy CAR PriceRev Discounting Underpricing Procf Proc
BW 0.610*** 0.124** -0.0126*** 0.0298* 0.00579 0.00257 0.315*** -0.100* (2.62) (2.08) (-4.42) (1.87) (1.36) (0.94) (2.93) (-1.95)
Rpremia 0.821 0.934*** 0.00330*** -0.000916 0.0193 -0.215 -1.015*** (1.42) (4.00) (3.53) (-1.17) (1.02) (-0.36) (-3.27)
Infoasy -2.448 0.615 0.136* 0.189 0.0758 0.0819* -0.117 1.916** (-0.83) (1.15) (1.79) (1.21) (1.39) (1.89) (-0.13) (2.39)
Growth 0.0313 0.0697*** 0.0000908 0.00655*** 0.000656 -0.000248 0.0985*** 0.0327***(0.68) (4.81) (0.11) (3.73) (0.62) (-0.51) (7.54) (3.50)
Size 1.930*** -5.285*** 0.000757 -1.003 143.9*** 78.10*** (3.00) (-3.61) (0.00) (-0.98) (4.26) (2.99)
Uranking -0.00211 -0.000428 0.0129 0.00614 0.0979*** 0.196*** (-1.26) (-0.01) (0.74) (0.80) (3.31) (5.76)
Lev 0.338 0.0182 -0.000454 -0.00612** -0.00712*** -0.203 0.461** (1.36) (1.06) (-0.11) (-2.15) (-3.24) (-0.79) (2.20)
NASDAQ -0.569 0.187 0.00277 -0.0279 -0.00852 -0.0101*** 0.603*** 0.0460
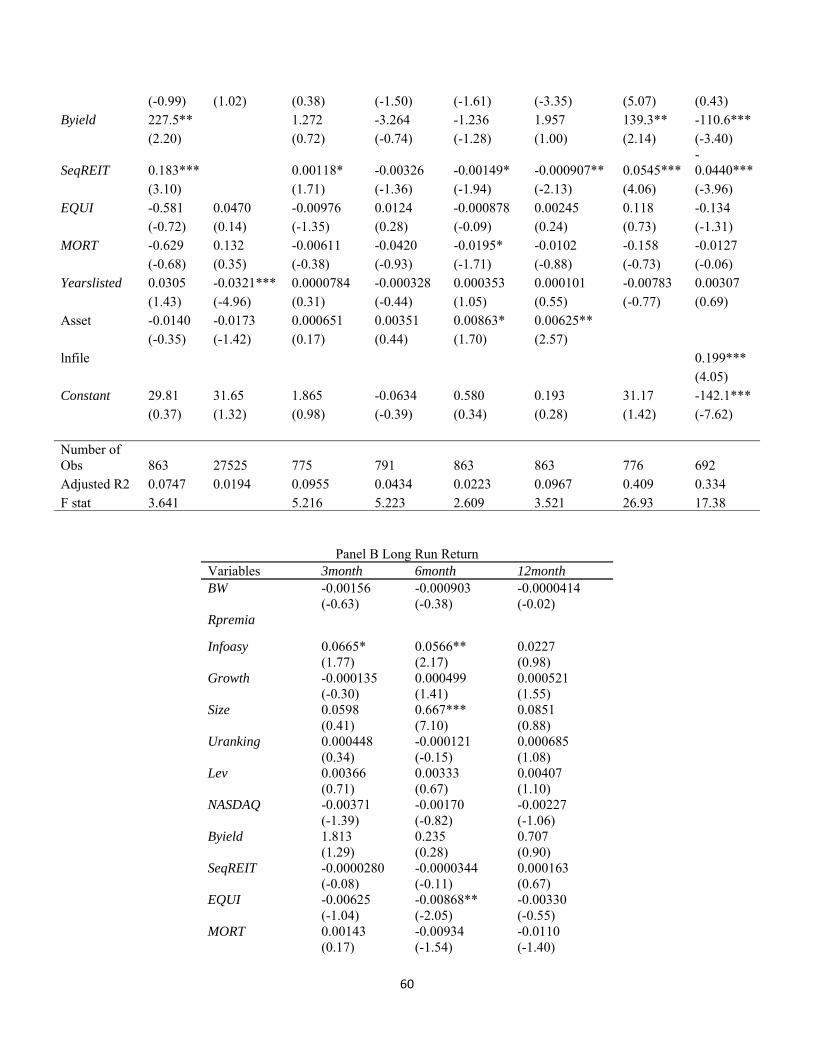
60
(-0.99) (1.02) (0.38) (-1.50) (-1.61) (-3.35) (5.07) (0.43) Byield 227.5** 1.272 -3.264 -1.236 1.957 139.3** -110.6***
(2.20) (0.72) (-0.74) (-1.28) (1.00) (2.14) (-3.40)
SeqREIT 0.183*** 0.00118* -0.00326 -0.00149* -0.000907** 0.0545***-0.0440***
(3.10) (1.71) (-1.36) (-1.94) (-2.13) (4.06) (-3.96) EQUI -0.581 0.0470 -0.00976 0.0124 -0.000878 0.00245 0.118 -0.134
(-0.72) (0.14) (-1.35) (0.28) (-0.09) (0.24) (0.73) (-1.31) MORT -0.629 0.132 -0.00611 -0.0420 -0.0195* -0.0102 -0.158 -0.0127
(-0.68) (0.35) (-0.38) (-0.93) (-1.71) (-0.88) (-0.73) (-0.06) Yearslisted 0.0305 -0.0321*** 0.0000784 -0.000328 0.000353 0.000101 -0.00783 0.00307
(1.43) (-4.96) (0.31) (-0.44) (1.05) (0.55) (-0.77) (0.69) Asset -0.0140 -0.0173 0.000651 0.00351 0.00863* 0.00625**
(-0.35) (-1.42) (0.17) (0.44) (1.70) (2.57) lnfile 0.199***
(4.05) Constant 29.81 31.65 1.865 -0.0634 0.580 0.193 31.17 -142.1***
(0.37) (1.32) (0.98) (-0.39) (0.34) (0.28) (1.42) (-7.62) Number of Obs 863 27525 775 791 863 863 776 692 Adjusted R2 0.0747 0.0194 0.0955 0.0434 0.0223 0.0967 0.409 0.334 F stat 3.641 5.216 5.223 2.609 3.521 26.93 17.38
Panel B Long Run Return
Variables 3month 6month 12month BW -0.00156 -0.000903 -0.0000414
(-0.63) (-0.38) (-0.02) Rpremia
Infoasy 0.0665* 0.0566** 0.0227 (1.77) (2.17) (0.98)
Growth -0.000135 0.000499 0.000521 (-0.30) (1.41) (1.55)
Size 0.0598 0.667*** 0.0851 (0.41) (7.10) (0.88)
Uranking 0.000448 -0.000121 0.000685 (0.34) (-0.15) (1.08)
Lev 0.00366 0.00333 0.00407 (0.71) (0.67) (1.10)
NASDAQ -0.00371 -0.00170 -0.00227 (-1.39) (-0.82) (-1.06)
Byield 1.813 0.235 0.707 (1.29) (0.28) (0.90)
SeqREIT -0.0000280 -0.0000344 0.000163 (-0.08) (-0.11) (0.67)
EQUI -0.00625 -0.00868** -0.00330 (-1.04) (-2.05) (-0.55)
MORT 0.00143 -0.00934 -0.0110 (0.17) (-1.54) (-1.40)
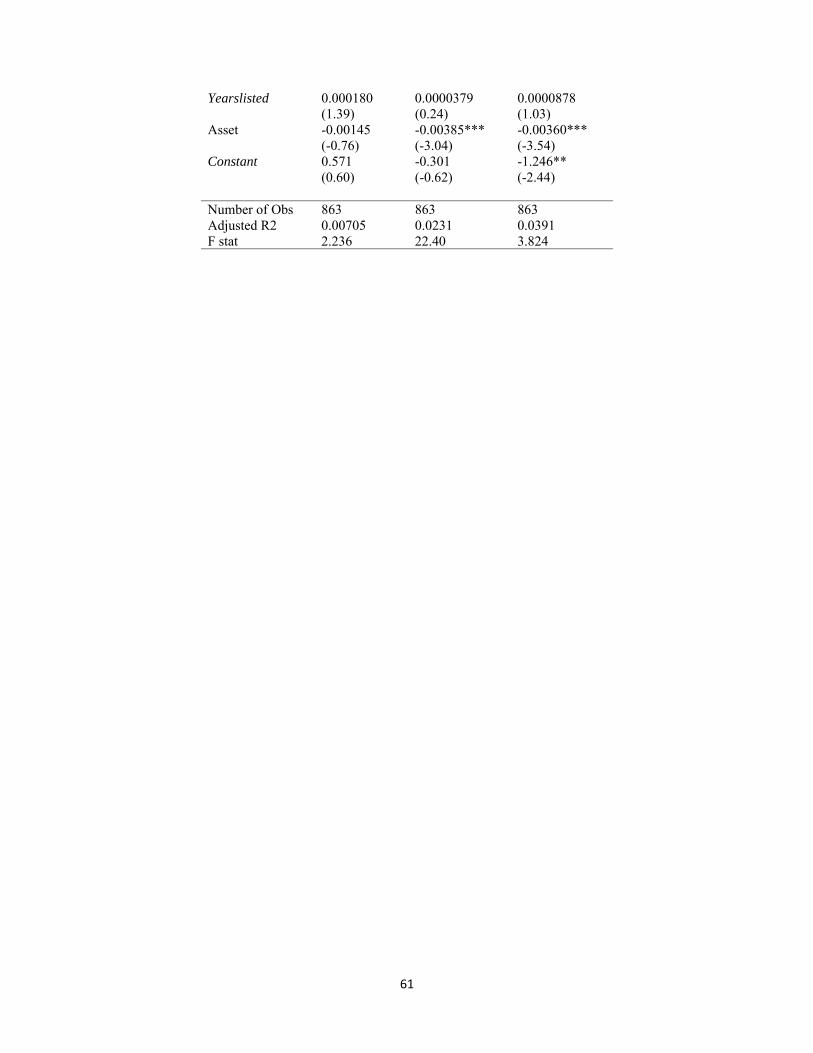
61
Yearslisted 0.000180 0.0000379 0.0000878 (1.39) (0.24) (1.03)
Asset -0.00145 -0.00385*** -0.00360*** (-0.76) (-3.04) (-3.54)
Constant 0.571 -0.301 -1.246** (0.60) (-0.62) (-2.44)
Number of Obs 863 863 863 Adjusted R2 0.00705 0.0231 0.0391 F stat 2.236 22.40 3.824

62