Investor roadshow presentation
16
-
Upload
trueblueinc -
Category
Investor Relations
-
view
46.978 -
download
0
Transcript of Investor roadshow presentation

www.TrueBlue.com
www.TrueBlue.com
Forward-Looking Statements
October 19, 2016
www.TrueBlue.com
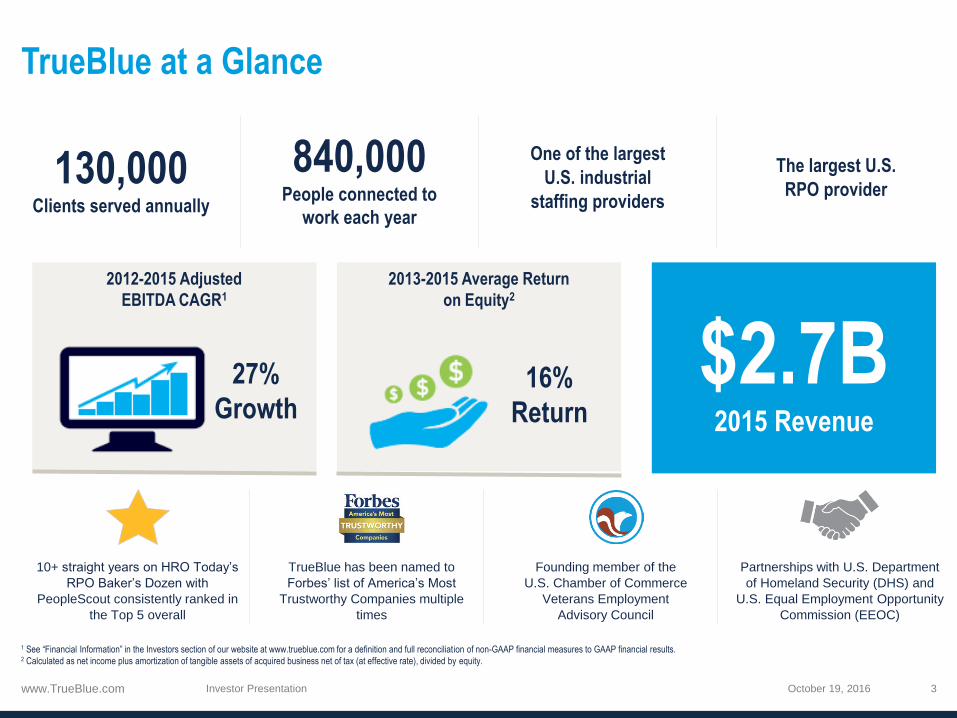
TrueBlue at a Glance
October 19, 2016Investor Presentation 3
130,000Clients served annually
840,000People connected to
work each year
One of the largest
U.S. industrial
staffing providers
The largest U.S.
RPO provider
2013-2015 Average Return
on Equity2
2012-2015 Adjusted
EBITDA CAGR1
$2.7B2015 Revenue
27%
Growth16%
Return
10+ straight years on HRO Today’s
RPO Baker’s Dozen with
PeopleScout consistently ranked in
the Top 5 overall
TrueBlue has been named to
Forbes’ list of America’s Most
Trustworthy Companies multiple
times
Founding member of the
U.S. Chamber of Commerce
Veterans Employment
Advisory Council
Partnerships with U.S. Department
of Homeland Security (DHS) and
U.S. Equal Employment Opportunity
Commission (EEOC)
1 See “Financial Information” in the Investors section of our website at www.trueblue.com for a definition and full reconciliat ion of non-GAAP financial measures to GAAP financial results. 2 Calculated as net income plus amortization of tangible assets of acquired business net of tax (at effective rate), divided by equity.

www.TrueBlue.com
The TrueBlue Growth Story
October 19, 2016
www.TrueBlue.com
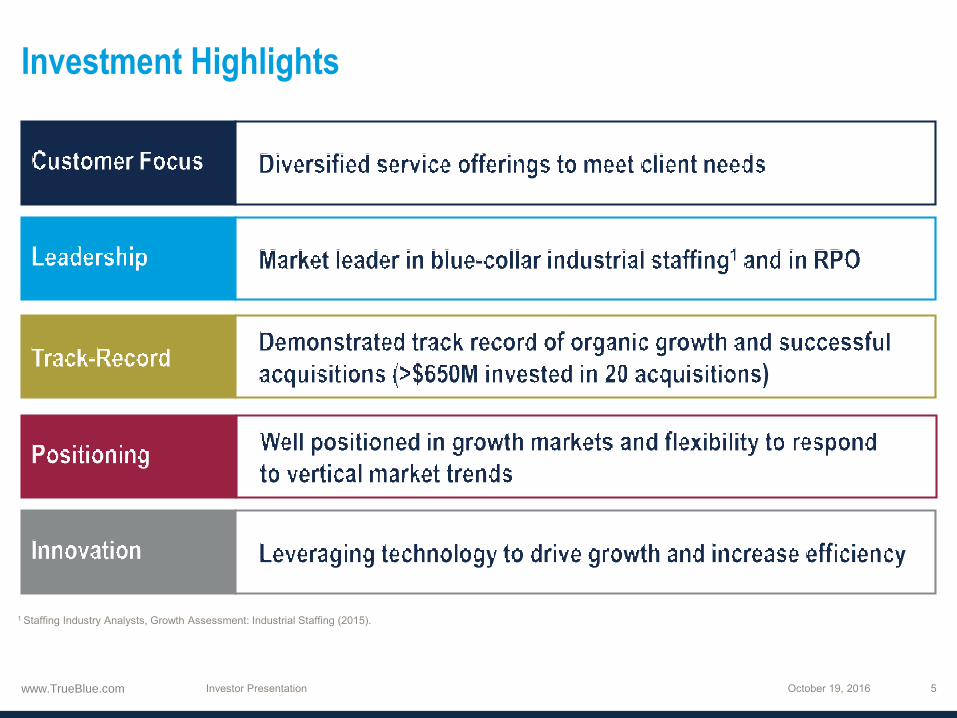
Investment Highlights
www.TrueBlue.com
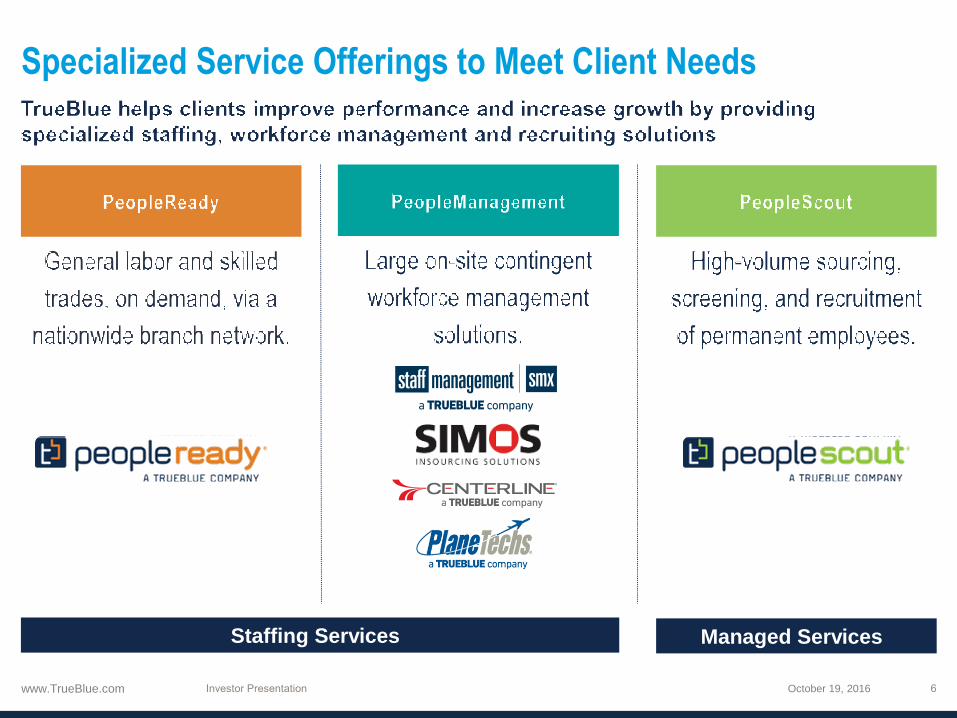
Specialized Service Offerings to Meet Client Needs
October 19, 2016
Staffing Services Managed Services
www.TrueBlue.com
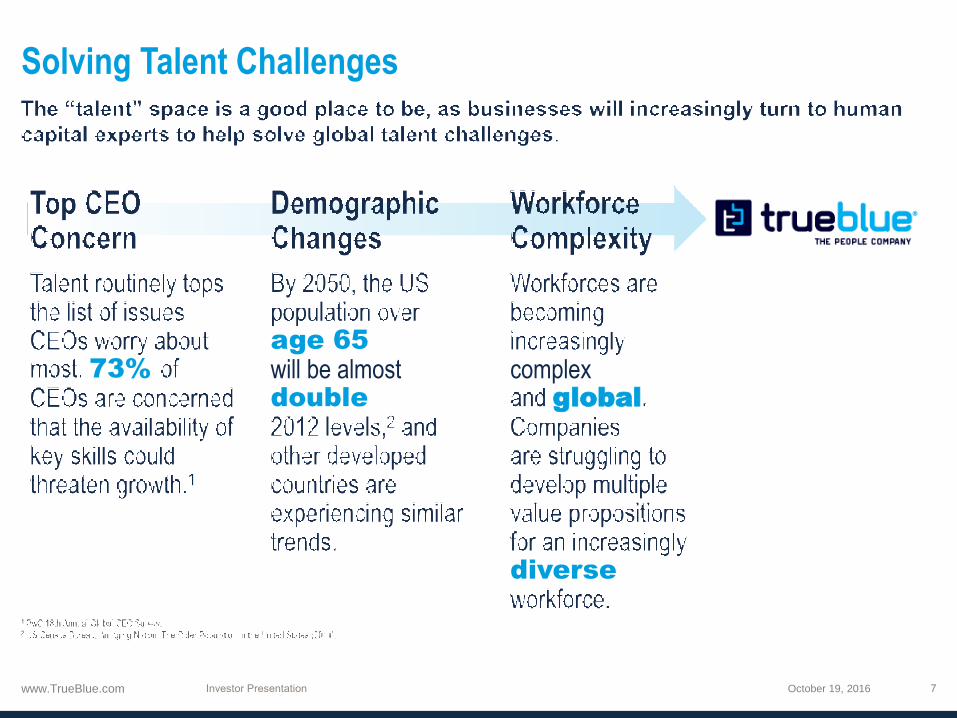
Solving Talent Challenges
October 19, 2016
complex global
diverse
age 65
will be almost double
73%
www.TrueBlue.com
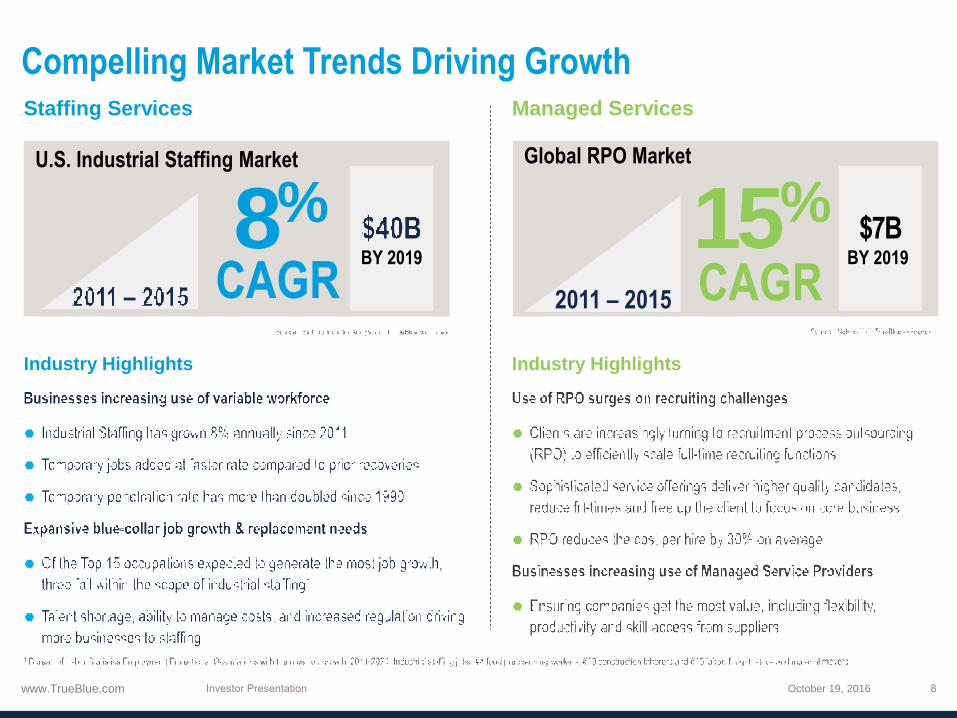
Compelling Market Trends Driving Growth
October 19, 2016
CAGR8%
Industry Highlights
Industry Highlights
Staffing Services Managed Services
CAGR15%
2011 – 2015
www.TrueBlue.com
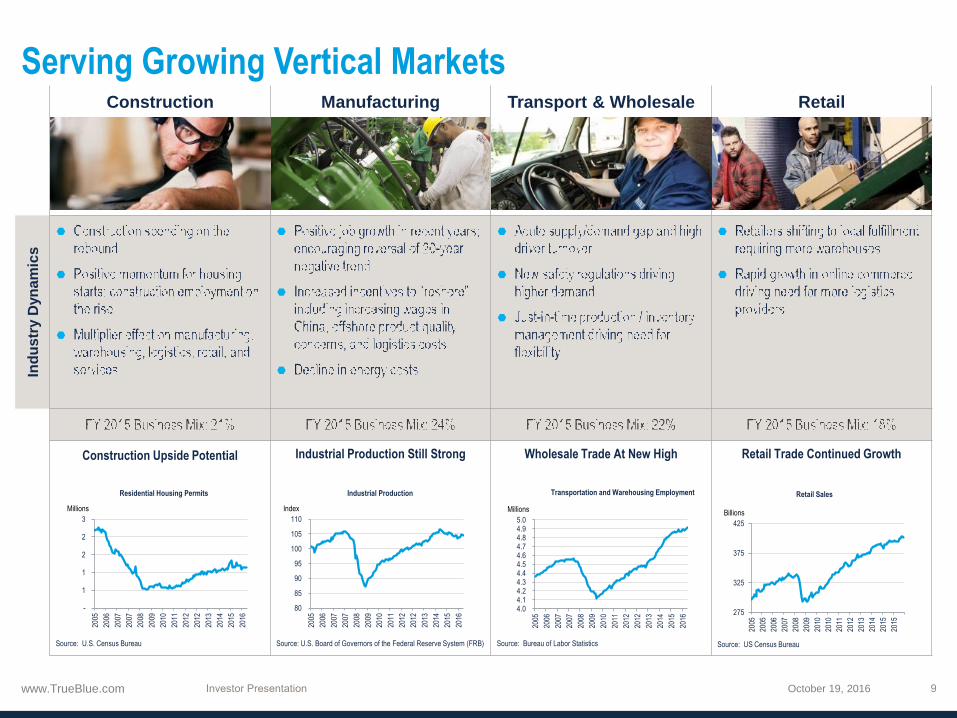
Construction Manufacturing Transport & Wholesale Retail
Ind
ustr
y D
yn
am
ics
Construction Upside Potential Industrial Production Still Strong Wholesale Trade At New High Retail Trade Continued Growth
Source: U.S. Census Bureau Source: U.S. Board of Governors of the Federal Reserve System (FRB) Source: Bureau of Labor Statistics Source: US Census Bureau
-
1
1
2
2
3
2005
2006
2007
2007
2008
2009
2010
2011
2012
2012
2013
2014
2015
2016
Residential Housing Permits
Millions
80
85
90
95
100
105
110
2005
2006
2007
2007
2008
2009
2010
2011
2012
2012
2013
2014
2015
2016
Industrial Production
Index
275
325
375
425
2005
2005
2006
2007
2008
2009
2010
2010
2011
2012
2013
2014
2015
2015
Retail Sales
Billions
4.0 4.1 4.2 4.3 4.4 4.5 4.6 4.7 4.8 4.9 5.0
2005
2006
2007
2007
2008
2009
2010
2011
2012
2012
2013
2014
2015
2016
Transportation and Warehousing Employment
Millions
Serving Growing Vertical Markets
October 19, 2016
www.TrueBlue.com
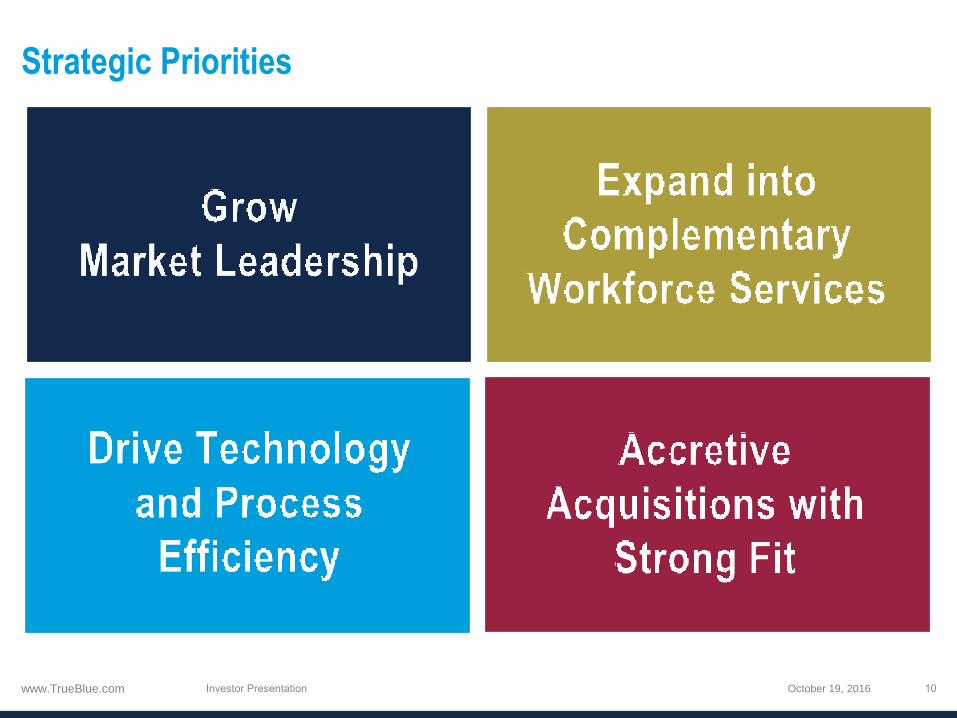
Strategic Priorities
October 19, 2016
www.TrueBlue.com
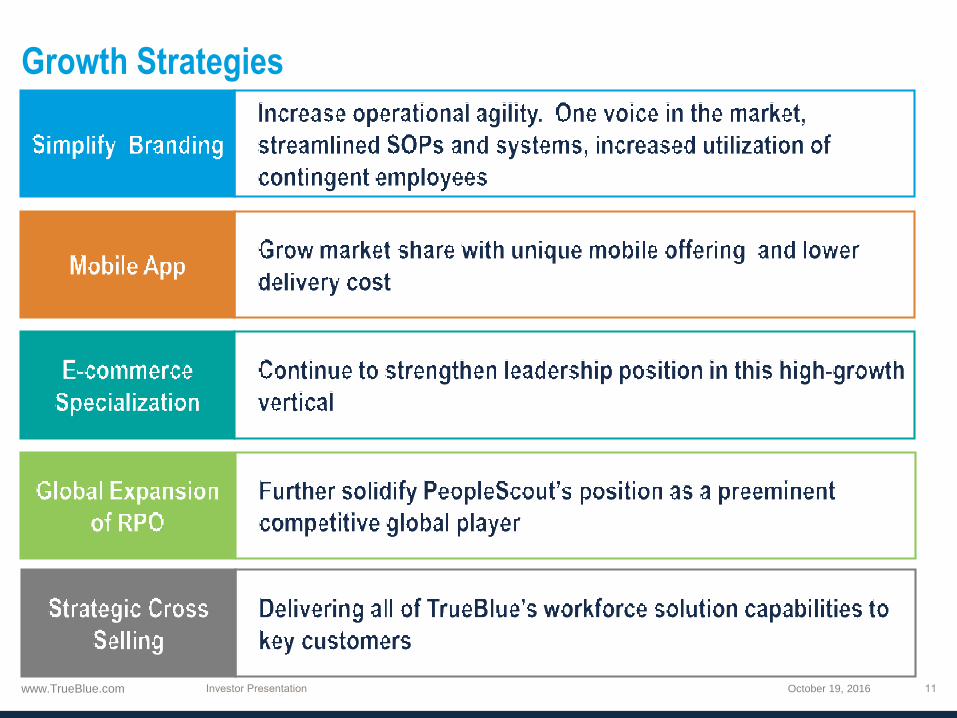
Growth Strategies
October 19, 2016

www.TrueBlue.com
www.TrueBlue.com
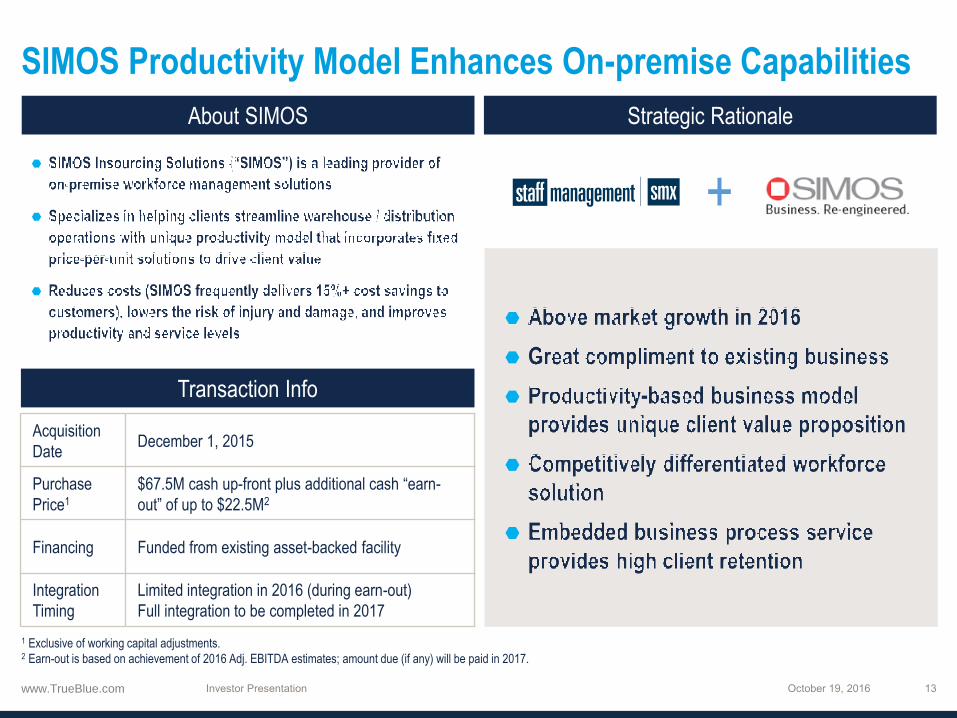
SIMOS Productivity Model Enhances On-premise Capabilities
Transaction Info
Acquisition
DateDecember 1, 2015
Purchase
Price1
$67.5M cash up-front plus additional cash “earn-
out” of up to $22.5M2
Financing Funded from existing asset-backed facility
Integration
Timing
Limited integration in 2016 (during earn-out)
Full integration to be completed in 2017
1 Exclusive of working capital adjustments.2 Earn-out is based on achievement of 2016 Adj. EBITDA estimates; amount due (if any) will be paid in 2017.
+
About SIMOS Strategic Rationale
www.TrueBlue.com
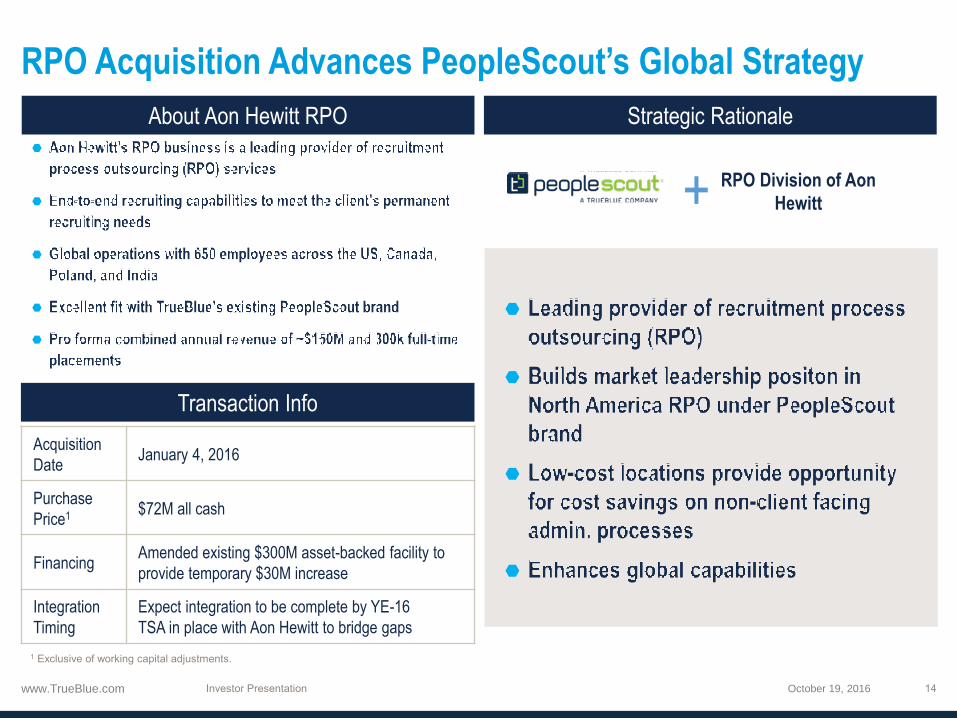
RPO Acquisition Advances PeopleScout’s Global Strategy
October 19, 2016
+
Acquisition
DateJanuary 4, 2016
Purchase
Price1 $72M all cash
FinancingAmended existing $300M asset-backed facility to
provide temporary $30M increase
Integration
Timing
Expect integration to be complete by YE-16
TSA in place with Aon Hewitt to bridge gaps
RPO Division of Aon
Hewitt
Transaction Info
About Aon Hewitt RPO Strategic Rationale

www.TrueBlue.com
www.TrueBlue.com
Non-GAAP Terms and Definitions
October 19, 2016
EBITDA and Adjusted EBITDA are non-GAAP financial measures. EBITDA excludes interest, taxes, depreciation and amortization.
Adjusted EBITDA further excludes from EBITDA, costs related to acquisition and integration, goodwill and intangible asset impairment
charges, other charges, and Work Opportunity Tax Credit third-party processing fees. EBITDA and Adjusted EBITDA are key measures
used by management to assess performance and, in our opinion, enhance comparability and provide investors with useful insight into
the underlying trends of the business. EBITDA and Adjusted EBITDA should not be considered measures of financial performance in
isolation or as an alternative to Income from operations in the Consolidated Statements of Operations in accordance with U.S. GAAP,
and may not be comparable to similarly titled measures of other companies.
Adjusted net income and adjusted net income per diluted share are non-GAAP financial measures which exclude from net income and
net income on a per diluted share basis costs related to acquisition and integration, goodwill and intangible asset impairment charges,
other charges, Work Opportunity Tax Credit third-party processing fees, amortization of intangibles of acquired businesses as well as
accretion expense related to acquisition earn-out, tax effect of each adjustment to U.S. GAAP net income, and adjusts income taxes to
the expected ongoing effective tax rate. Adjusted net income and adjusted net income per diluted share are key measures used by
management to assess performance and, in our opinion, enhance comparability and provide investors with useful insight into the
underlying trends of the business. Adjusted net income and adjusted net income per diluted share should not be considered measures
of financial performance in isolation or as an alternative to net income or net income per diluted share in the Consolidated Statements
of Operations in accordance with U.S. GAAP, and may not be comparable to similarly titled measures of other companies.
See “Financials” in the Investors section of our web site at www.trueblue.com for a full reconciliation of non-GAAP financial measures
to U.S. GAAP financial results.