Investor Presentations21.q4cdn.com/603071597/files/doc_presentations/2018/05/Anixter... · other...
33
Products. Technology. Services. Delivered Globally. Investor Presentation May and June 2018
Transcript of Investor Presentations21.q4cdn.com/603071597/files/doc_presentations/2018/05/Anixter... · other...

Products.
Technology.
Services.
Delivered Globally.
Investor PresentationMay and June 2018

SAFE HARBOR STATEMENT AND
NON-GAAP FINANCIAL MEASURES
Safe Harbor Statement
The statements in this release other than historical facts are forward-looking statements made in reliance upon the safe harbor of the Private Securities Litigation Reform Act of 1995. These
forward-looking statements are subject to a number of factors that could cause our actual results to differ materially from what is indicated here. These factors include but are not limited to
general economic conditions, the level of customer demand particularly for capital projects in the markets we serve, changes in supplier relationships or in supplier sales strategies or financial
viability, risks associated with the sale of nonconforming products and services, political, economic or currency risks related to foreign operations, inventory obsolescence, copper price
fluctuations, customer viability, risks associated with accounts receivable, the impact of regulation and regulatory, investigative and legal proceedings and legal compliance risks, information
security risks, risks associated with substantial debt and restrictions contained in financial and operating covenants in our debt agreements, the impact and the uncertainty concerning the timing
and terms of the withdrawal by the United Kingdom from the European Union, and risks associated with integration of acquired companies, including, but not limited to, the risk that the
acquisitions may not provide us with the synergies or other benefits that were anticipated. These uncertainties may cause our actual results to be materially different than those expressed in
any forward looking statements. We do not undertake to update any forward looking statements. Please see our Securities and Exchange Commission (“SEC”) filings for more information.
Non-GAAP Financial Measures
In addition to the results provided in accordance with U.S. Generally Accepted Accounting Principles (“GAAP”) above, this release includes certain financial measures computed using non-
GAAP components as defined by the SEC. Specifically, net sales comparisons to the prior corresponding period, both worldwide and in relevant segments, are discussed in this release both on
a GAAP and non-GAAP basis. We believe that by providing non-GAAP organic growth, which adjusts for the impact of acquisitions (when applicable), foreign exchange fluctuations, copper
prices and the number of billing days, both management and investors are provided with meaningful supplemental sales information to understand and analyze our underlying trends and other
aspects of our financial performance. We calculate the year-over-year organic sales growth and operating expenses impact relating to the Power Solutions acquisition by including its 2015
comparable period results prior to the acquisition with our results (on a "pro forma" basis) as we believe this represents the most accurate representation of organic growth, considering the
nature of the company we acquired and the synergistic revenues that have been or will be achieved. Historically and from time to time, we may also exclude other items from reported financial
results (e.g., impairment charges, inventory adjustments, restructuring charges, tax items, currency devaluations, pension settlements, etc.) in presenting adjusted operating expense, adjusted
operating income, adjusted income taxes and adjusted net income so that both management and financial statement users can use these non-GAAP financial measures to better understand
and evaluate our performance period over period and to analyze the underlying trends of our business. As a result of the recent acquisitions we have also excluded amortization of intangible
assets associated with purchase accounting from acquisitions from the adjusted amounts for comparison of the non-GAAP financial measures period over period.
EBITDA is defined as net income from continuing operations before interest, income taxes, depreciation and amortization. Adjusted EBITDA is defined as EBITDA before foreign exchange and
other non-operating expense and non-cash stock-based compensation, excluding the other items from reported financial results, as defined above. Adjusted EBITDA leverage is defined as the
percentage change in Adjusted EBITDA divided by the percentage change in net sales. We believe that adjusted operating income, EBITDA, Adjusted EBITDA, and Adjusted EBITDA leverage
provide relevant and useful information, which is widely used by analysts, investors and competitors in our industry as well as by our management in assessing both consolidated and business
segment performance. Adjusted operating income provides an understanding of the results from the primary operations of our business by excluding the effects of certain items that do not
reflect the ordinary earnings of our operations. We use adjusted operating income to evaluate our period-over-period operating performance because we believe this provides a more
comparable measure of our continuing business excluding certain items that are not reflective of expected ongoing operations. This measure may be useful to an investor in evaluating the
underlying performance of our business. EBITDA provides us with an understanding of earnings before the impact of investing and financing charges and income taxes. Adjusted EBITDA
further excludes the effects of foreign exchange and other non-cash stock-based compensation, and certain items that do not reflect the ordinary earnings of our operations and that are also
excluded for purposes of calculating adjusted net income, adjusted earnings per share and adjusted operating income. EBITDA and Adjusted EBITDA are used by our management for various
purposes including as measures of performance of our operating entities and as a basis for strategic planning and forecasting. Adjusted EBITDA and Adjusted EBITDA leverage may be useful
to an investor because this measure is widely used to evaluate a company’s operating performance without regard to items excluded from the calculation of such measure, which can vary
substantially from company to company depending on the accounting methods, book value of assets, capital structure and the method by which the assets were acquired, among other factors.
They are not, however, intended as an alternative measure of operating results or cash flow from operations as determined in accordance with generally accepted accounting principles.
Non-GAAP financial measures provide insight into selected financial information and should be evaluated in the context in which they are presented. These non-GAAP financial measures have
limitations as analytical tools, and should not be considered in isolation from, or as a substitute for, financial information presented in compliance with GAAP, and non-GAAP financial measures
as reported by us may not be comparable to similarly titled amounts reported by other companies. The non-GAAP financial measures should be considered in conjunction with the Condensed
Consolidated Financial Statements, including the related notes, and Management’s Discussion and Analysis of Financial Condition and Results of Operations included in this release.
Management does not use these non-GAAP financial measures for any purpose other than the reasons stated above.
© 2018 Anixter Inc.

Key Metrics
Anixter at a Glance
2017
Sales $7.9B
Adjusted EBITDA $404M
Adjusted EBITDA margin 5.1%
Countries ~50
Cities >300
SKUs >600k
Inventory >$1.0B
Warehouses/Branches >300
52%
28%
20%
NSS EES UPS
Anixter 2017 Segment Mix
3© 2018 Anixter Inc.

Key Platform Strengths
1. Leading positions in attractive businesses
2. Strong, diverse and global suppliers and customers
3. Competitive advantages and barriers to entry
4. Digital marketing capabilities enhance our value proposition
4© 2018 Anixter Inc.

Leading Positions in Attractive Businesses
Network & Security
Solutions
Electrical & Electronic
Solutions
Utility Power
Solutions
Leading Position Global #1 Global Top 3 North America #1
Large ~$55B TAM ~$450B TAM ~$31B TAM
Growing 3 - 4% CAGR 2 - 3% CAGR ~4% CAGR
Fragmented ~7% Share <1% Share <4% Share
Diverse
and Global
END USERS
Commercial, Data Center, Defense, Education,
Electronics, Government, Healthcare, Industrial, Oil and Gas,
Retail, Semi-conductor, Transportation, Utility
CHANNELS
Contractors, Integrators, EPCs
$ Billions
5© 2018 Anixter Inc.

NSS
Our Products are Critical Components of the Connected, Controlled & Powered Infrastructure
EES UPS• Infrastructure
• Video surveillance
• Access control
• Fire/intrusion
• Data centers
• Power
• Wireless
• Professional A/V
• Electrical/electronic wire and cable
• Gear, controls, transformers, power generation
• Industrial automation products
• Indoor/outdoor lighting
• Support and supplies
• Generation, transmission and distribution
• MRO supplies
• Smart grid infrastructure
• Outdoor lighting
• Security
6© 2018 Anixter Inc.

We have Strong, Diverse and Global Suppliers and Customers
CUSTOMERSSUPPLIERS
7© 2018 Anixter Inc.

Competitive Advantages and Barriers to Entry
Network & Security Solutions
Electrical & Electronic Solutions
Utility PowerSolutions
Three Primary Differentiators
Customized and Scalable
Supply Chain Solutions
Global Capabilities
with Local PresenceTechnical
Expertise
8© 2018 Anixter Inc.

Global Capabilities with Local Presence
3,600+TECHNICAL SALES
SPECIALISTS, MULTI-LEVEL
TECHNICAL SUPPORT
135,000+CUSTOMERS
$1.0 BILLION+ INVENTORY
600,000+PRODUCTS
50 COUNTRIES
35+ CURRENCIES
20+ LANGUAGES
APPROXIMATELY 310WAREHOUSES
AND BRANCHES
WORLDWIDE
9© 2018 Anixter Inc.

EESNSS UPS
We Reduce Cost, Complexity and Risk of our Customers’ Supply Chains
Integrated supply
Kitting
eCommerceStrategic project
services
Pre-assembly
JIT
ParaspinSM
Electronic integration
Electronic integration
Electronic integration
Cable Management
Critical Spares
Management
Automated
Inventory Solutions
Automated
metering service
TrakrSMVendingLaydown yardsParapullSMSpeedPull® Tri-Ed branch pick-up
SpeedPull®
TrakrSM
IP configuration Kitting
10© 2018 Anixter Inc.

World-Class Demonstration Facilities and Expertise in Emerging Technologies
Anixter Infrastructure Solutions LabSM
• Certified by Underwriters Laboratories®
• Located at our headquarters in Glenview, IL
– Proof of concept testing
and solutions building
– Data infrastructure product testing
– Independent testing
– Physical security testing
– Industrial Communications
and Control module
• Equipped to provide virtual tours
around the globe
Leadership Roles in Industry Associations
• Telecommunications Industry Association (TIA)
• International Organization for Standardization (ISO)
• Institute of Electrical and Electronics Engineers (IEEE)
• Open Network Video Interface Forum (ONVIF)
• Building Industry Consulting Services International
(BICSI)
• Security Industry Association (SIA)
• Control System Integrators Association (CSIA)
• National Electrical Manufacturers Association (NEMA)
• National Association of Electrical Distributors (NAED)
• Edison Electric Institute (EEI)
• National Rural Electric Cooperative (NRECA)
Building
Technologies
Data Center
and Enterprise
Networks
Physical
SecurityGear, Lighting
and Controls
We stay current on the latest products, trends, standards and emerging technologies.
Technical Certifications
• ASIS CPP (Certified Protection Professional)
• More than 90 Registered BICSI RCDDs
• PSPs (Physical Security Professional Certification)
• CCNAs (Cisco Certified Network Associate)
• QSSP
SOLUTIONS
BRIEFING CENTERS
• Woburn, MA
• Indianapolis, IN
• Atlanta, GA
• Sao Paulo, Brazil
• Bracknell, U.K.
11© 2018 Anixter Inc.
Capitalize on All Available Growth Levers
• Security products• Low voltage electrical
products• Industrial Communication
and Control• Wireless• Professional audio/visual
• Data and mobility usage• Physical security• Non-residential construction• Residential construction• Electrical grid infrastructure• Oil and gas headwinds• Deflationary pressures
• One Anixter• Synergistic cross-selling• Multi-tenant data centers• Small and mid-sized
customers• Digital marketing and
eCommerce
Core Market Growth
Product Line & Service
Offering Expansion
Market Share Gains
• Expansion of security and low voltage products into Canada, Mexico and EMEA
• Expansion of utility products into Western Canada and Mexico
Geographic Growth
Organic Growth Goals:
150 - 250 bps above market
4 - 6% CAGR
12© 2018 Anixter Inc.

Long Term Financial Goals
Long TermGoal
Organic Sales Growth 4 - 6%
Adjusted EBITDA Margin 6.5 – 7.0%
Adjusted EBITDA Leverage 1.5 - 2.0X
Working Capital as a % of Sales <20%
Adjusted ROTC >28%
Debt / Adjusted EBITDA 2.5 - 3.0X
Debt-to-total Capital 45 - 50%
13© 2018 Anixter Inc.

Compelling Customer and Investor Value Proposition
Customer value proposition
– Reduce cost, complexity and risk in our customers’ supply chains
– Key Competitive Differentiators:• Global capabilities with local presence• Customized and scalable supply chain solutions• Technical expertise
Investor value proposition
– Leading positions in attractive businesses
– Competitive advantage and barriers to entry
– Globally scalable business model
– Financial strength and capital efficiency
– Visibility to growth, ability to deliver synergies
– Committed to delivering shareholder value
14© 2018 Anixter Inc.

Announced Agreements to Acquire
Australia and New Zealand Security Businesses
Transaction Summary for Combined Businesses
Purchase price* ~$151 million
*Purchase prices are in local currency; represents estimated price at current exchange rates
Trailing 12-month revenues ~$114 million
Trailing 12-month adjusted EBITDA ~$20 million
Consideration 100% cash
Financing Available cash and borrowing capacity
Expected closing Before the end of 2Q18
Strategic Rationale
Enhances our competitive position, bringing new, innovative products and solutions to Anixter that we believe will be valued by both new and existing customers
Acquired businesses gross and operating margins are higher than Anixter's
Acquisition rate of return is above Anixter's risk-adjusted average cost of capital
15© 2018 Anixter Inc.

• Record first quarter sales of $2.0B, up 3.6%, with growth in all segments and all geographies
• Excluding the favorable impacts from higher average copper prices and currency fluctuations, organic
sales increased 1.6%
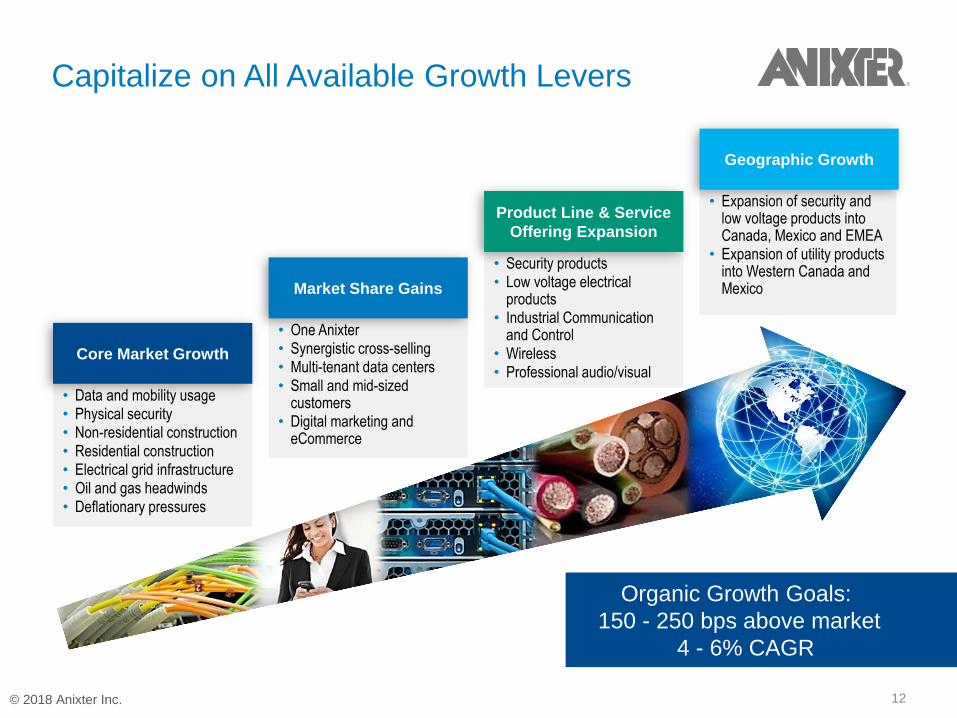
Sales Overview
1Q18 Sales
% of total sales
YOY Sales Growth
GAAP Organic
North America 82% 2.9% 1.7%
EMEA 9% 8.5% (2.1)%
Emerging Markets 9% 6.1% 3.4%
Anixter International 3.6% 1.6%
Reported organic
sales growth:
16© 2018 Anixter Inc.
Sales Overview
1Q18 Segment and Geographic Sales Mix
NSS
EES
UPS
17© 2018 Anixter Inc.

Sales Overview
Network & Security Solutions Sales
• NSS sales of $994.8M increased 1.0% on a GAAP basis and were approximately flat on an organic basis
• With the exception of large project business, sales momentum across NSS is solid, driven by growth in
day-to-day business, mid-sized project activity, professional audio/video initiative and large service
provider programs
• As disclosed in 4Q17, a new 5-year integrated supply agreement with an existing large customer will
begin to ship during Q2 and is expected to total over $50 million on an annualized basis
• NSS security sales of $415.6M increased 3.4%, which was 1.9% on an organic basis
% of NSS Sales
YOY Sales Growth
GAAP Organic
North America 77% 0.1% (0.4)%
EMEA 10% 5.8% (3.6)%
Emerging Markets 13% 3.2% 1.0%
Total NSS 1.0% (0.5)%
Reported organic
sales growth:
18© 2018 Anixter Inc.

Sales Overview
Electrical & Electronic Solutions Sales
% of EES Sales
YOY Sales Growth
GAAP Organic
North America 78% 12.4% 3.6%
EMEA 12% 15.9% 0.1%
Emerging Markets 10% 13.2% 9.3%
Total EES 7.8% 3.7%
• EES sales of $568.4M increased 7.8% on a GAAP basis and 3.7% on an organic basis
• We continue to experience strong growth on the OEM side of the business, in Canada and Latin America,
and with synergistic sales of low voltage electrical products. We have also experienced a strong recovery
on the industrial side of the business, offset by sluggish trends in our commercial construction business.
Reported organic
sales growth:
19© 2018 Anixter Inc.

• UPS sales of $401.0M increased 4.0% on an organic basis, reflecting growth with new and existing IOU
and public power customers
• As disclosed in 3Q17, awarded a 5-year agreement with an existing customer, estimated at over $30
million in incremental annual business, to begin shipping by mid-year 2018
Sales Overview
Utility Power Solutions Sales
Reported organic
sales growth:
YOY Sales Growth
GAAP Organic
Total UPS 4.6% 4.0%
20© 2018 Anixter Inc.

Financial Performance Trends
Gross Margin
• The year-over-year increase in gross profit dollars was driven by volume growth in EES and UPS
• The change in gross margin percentage is due to customer and product mix, lower vendor rebates and
competitive pressure
Q2 Gross Margin
Q2 vs. Q1
NSS
(0.20)
EES
(0.50)
UPS
-
AXE
(0.20)
21© 2018 Anixter Inc.
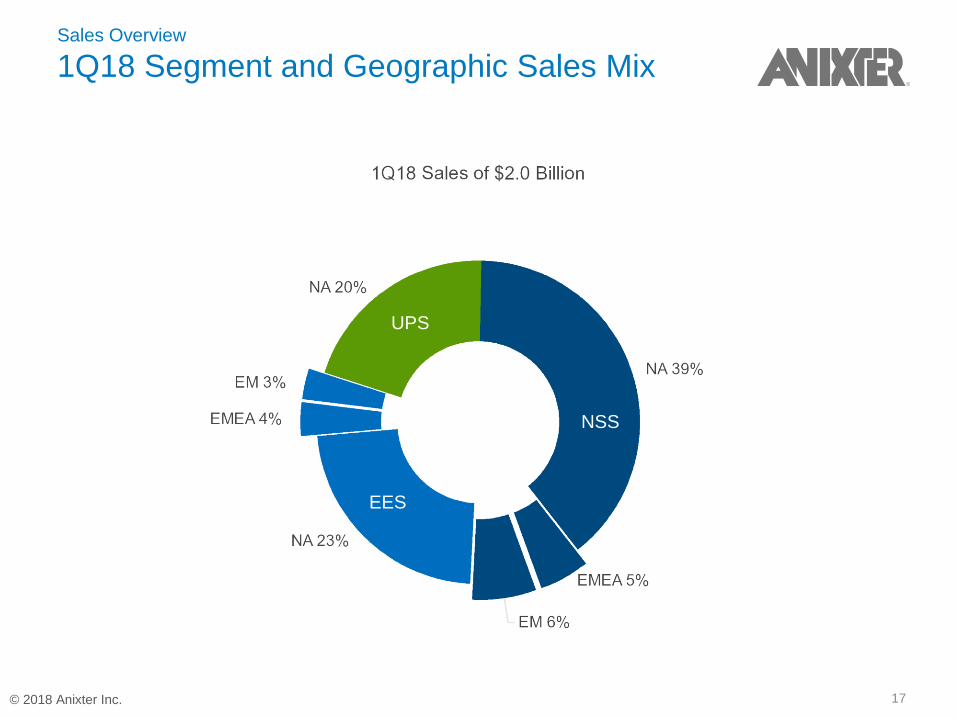
Financial Performance Trends
Operating Expense
Operating Expense (GAAP)
• 1Q18 operating expense of $323.2M includes $9.8M, primarily related to amortization of intangible assets
and acquisition and integration costs
• 1Q17 operating expense of $310.8M included $9.0M of amortization of intangible assets and acquisition
and integration costs
Adjusted Operating Expense
• Adjusted operating expense increased 3.9% to $313.4M, driven by inflationary pressures, primarily in
freight expense and employee benefits
22© 2018 Anixter Inc.

Financial Performance Trends
Net Income and Adjusted EBITDA
Net Income (GAAP)
• Net income of $32.1M includes a $9.8M pre-tax and a $7.6M after-tax impact, primarily amortization of
intangible assets and acquisition and integration costs. Prior year net income of $30.9M included a $9.0M
pre-tax and a $6.1M after-tax impact, primarily amortization of intangible assets
• On a sequential basis, the increase in net income was primarily caused by higher tax expense of $35.6M
in 4Q17 related to the impact of tax legislation
Adjusted EBITDA
• Adjusted EBITDA of $83.4M compares to $89.4M. The corresponding adjusted EBITDA margin of 4.2%
compares to 4.7%, caused by lower gross margin and higher operating expense as a percent of sales
• On a sequential basis, the decline in adjusted EBITDA and adjusted EBITDA margin was caused by lower
gross margin and higher operating expense23© 2018 Anixter Inc.

Financial Performance Trends
NSS Operating Income and Adjusted EBITDA
Operating Income (GAAP)
• Operating income of $53.5M includes $3.8M of expense, primarily intangible asset amortization; prior year
operating income of $61.8M included $3.6M of expense, primarily intangible asset amortization
Adjusted EBITDA
• Adjusted EBITDA of $58.5M compares to $66.6M. The corresponding margin of 5.9% compares to 6.8%.
The change is due to the combination of lower gross margin, primarily driven by mix, the impact of
deflation in certain product categories, and higher operating expense, primarily driven by increased freight
expense.
• Sequentially, the change in adjusted EBITDA and adjusted EBITDA margin was due to lower volume and
higher operating expense
24© 2018 Anixter Inc.

Financial Performance Trends
EES Operating Income and Adjusted EBITDA
Operating Income (GAAP)
• Operating income of $31.4M compares to $27.9M. Current and prior year quarters include $2.4M and
$1.6M of intangible asset amortization expense, respectively
Adjusted EBITDA
• Adjusted EBITDA increased 14.0% to $34.7M. The corresponding adjusted EBITDA margin of 6.1%
compares to 5.8%, driven by higher volume combined with the benefit of higher copper prices
• Strong performance resulted in adjusted EBITDA leverage of 1.8 times
25© 2018 Anixter Inc.

Operating Income (GAAP)
• Operating income of $16.4M compares to $16.2M. Current and prior year quarters include $3.3M and
$3.5M of expense, primarily intangible asset amortization, respectively
Adjusted EBITDA
• Adjusted EBITDA of $20.9M was flat. The corresponding adjusted EBITDA margin of 5.2% compares to
5.5%, with the change due to lower gross margin, driven by customer and product mix
Financial Performance Trends
UPS Operating Income and Adjusted EBITDA
26© 2018 Anixter Inc.

Financial Performance Trends
Working Capital and Adjusted ROTC
Working Capital
• Working capital ratio of 20.0% compares to 18.9% in 1Q17, with the increase primarily due to higher working
capital
Adjusted ROTC
• Adjusted ROTC of 18.3% compares to 22.5% in 1Q17, reflecting lower adjusted operating income
*Working Capital as a % of Sales: Defined as the net of current assets less current liabilities divided by annualized sales
**ROTC and Adjusted ROTC: Return on tangible capital defined as operating profits, excluding intangible amortization
and one-time items identified in our earnings releases, divided by average tangible capital
27© 2018 Anixter Inc.

Financial Performance Trends
Counter-Cyclical Free Cash Flow Provides
Financial Flexibility
Generate Strong Free Cash Flow Throughout the Economic Cycle
Free cash flow: Defined as net cash provided by operating activities less capital expenditures. Free cash flow is not restated for acquisitions and divestitures
28© 2018 Anixter Inc.

Leverage Metrics
Approaching Target Capital Structure
*2015 includes 12 months of Power Solutions earnings on a pro forma basis
Target range:
2.5 - 3.0x
Target range:
45 - 50%
29© 2018 Anixter Inc.

Outlook
Impact of Currency and Copper on 1Q18 Sales
$ millions 1Q18
Prior Outlook Actual
Organic sales growth 2.0 - 3.0% 1.6%
Currency* $10 - 15 $28.3
Copper** $10 - 15 $10.3
*1Q18 currency outlook estimated based on rates as of December 29, 2017
**1Q18 copper outlook estimated based on recent copper price of $3.20 vs 1Q17 average of $2.65
30© 2018 Anixter Inc.

Outlook
Market Trends by Business and Geography
North America EMEA Emerging Markets
NSS ➔
EES
UPS ➔
Market Trend 2Q18 versus 1Q18
Trend is likely to improve
➔ Trend is stable
Trend is likely to decline
31© 2018 Anixter Inc.

Outlook
Estimated Sales Impacts of Currency and Copper
*Currency outlook estimated based on rates as of March 30, 2018
**Copper outlook estimated based on recent copper price which compares to 2Q17 average of $2.58 and FY17 average
of $2.80
$ millions 2Q18 Outlook FY18 Outlook
Organic sales growth 2.0 - 3.0% 2.0 - 5.0%
Currency* $20 - 25 $45 - 50
Copper** $10 - 12 $25 - 30
32© 2018 Anixter Inc.

Outlook
Estimated Impact of Tax Cuts and Jobs Act on
2018 Non-GAAP Effective Tax Rate
Non-GAAP
2017
Estimate
2018
U.S. Federal Tax Rate 35.0% 21.0%
State Tax Expense 2.3% 3.5%
Foreign Effects, including Global Intangible Low Taxed Income (GILTI) -0.2% 3.2 - 4.0%
Non-Deductible Expenses 0.7% 0.8 - 1.0%
Effective Tax Rate (ETR) 37.8% 28.5 - 29.5%
33© 2018 Anixter Inc.