Investor Presentation with 9M’18 Financials
39
Investor Presentation with 9M’18 Financials
Transcript of Investor Presentation with 9M’18 Financials

Investor Presentation with
9M’18 Financials

1
Executive summary
Structurally Attractive Turkish Economy Underpinning a Dynamic Banking Sector
• The Turkish market presents a strong opportunity among emerging markets due to large and growing economy energized by a highly attractive
demographic profile, which is resilient to negative developments
• The CBRT delivered strong monetary policy tightening in 2018 and government’s New Economic Program for 2019-2021 assumed a tight
fiscal stance, which would help stabilize the currency and prevent further deterioration of the inflation outlook
• Economic activity is expected to lose some momentum in the upcoming period, which will help curb the external imbalances and translate into
a more stable macroeconomic background for the banking system to operate in
• In this macro backdrop, the banking sector has a promising future, with growth opportunities implied by current product and volume
penetration figures, and a profitability higher than that of emerging market peers
One of the Top Performing Banks in the Market
• QNB Finansbank is one of the strongest players in this market ranked 5th across most categories for privately owned banks
• QNB Finansbank has a very strong distribution network balanced between a branch footprint covering 99% of banking business in the market
and best in market digital offerings
• QNB Finansbank has shown strong financial performance beyond its scale even in most volatile market conditions driven by differentiation,
adaptability and right people brought together
Strong Shareholder Supports QNB Finansbank for future growth
• QNB stands out as the strongest rated shareholder among Private Turkish Banks
• QNB is the largest bank in the Middle East and Africa by all critical measures and has the highest ratings among all banks with a presence in
Turkey
• QNB’s presence across a wide geography overlaps well with Turkey’s key foreign trade partners bringing opportunities in this area
• QNB Finansbank’s launch of its new brand has been very successful, and is translating to successful expansion of its customer franchise in
potential growth areas
• Following the QNB acquisition, QNB Finansbank has added a new growth chapter in its successful history capturing its fair share in Corporate
and Commercial Banking while sustaining its success in Retail and SME Banking

2
Contents
QNB Finansbank and QNB Group at a Glance
Loan-based Balance Sheet Delivering High Quality Earnings
Solid Financial Performance
Appendix
2
3
4
5
Macro-economic Overview1

Macro-economic Overview
4
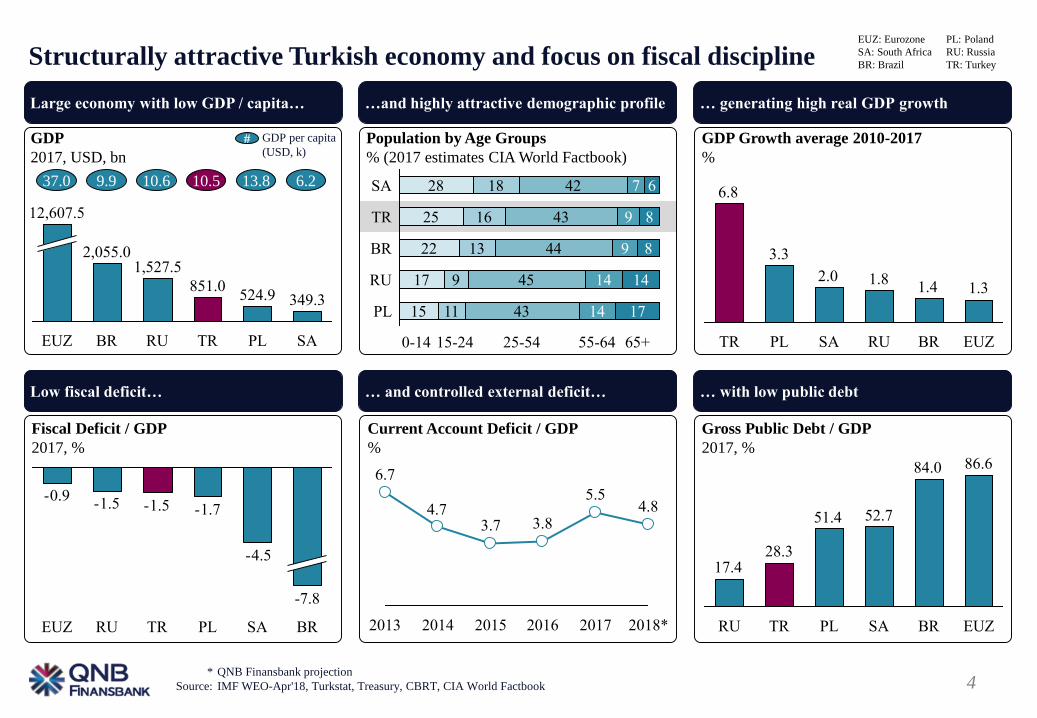
Structurally attractive Turkish economy and focus on fiscal discipline
* QNB Finansbank projection
Source: IMF WEO-Apr'18, Turkstat, Treasury, CBRT, CIA World Factbook
GDP
2017, USD, bn
# GDP per capita
(USD, k)
349.3524.9851.0
1,527.52,055.0
SAPLTRRUBREUZ
12,607.5
GDP Growth average 2010-2017
%
Population by Age Groups
% (2017 estimates CIA World Factbook)
42 7 6
0-14 15-24 25-54 55-64 65+
PL 43 14 17
RU 17 9 45 14 14
BR 22 13 44 9 8
TR 25 16 43 9 8
SA 28 18
1115
37.0 9.9 10.6 10.5 13.8 6.2
1.31.41.82.0
3.3
6.8
SA EUZRU BRPLTR
Fiscal Deficit / GDP
2017, %
Gross Public Debt / GDP
2017, %
Current Account Deficit / GDP
%
-4.5
-1.7-1.5-1.5-0.9
BR
-7.8
SAPLEUZ RU TR
4.85.5
3.83.74.7
6.7
2014 2017 2018*20152013 2016
86.684.0
52.751.4
28.317.4
EUZBRSAPLTRRU
Large economy with low GDP / capita… …and highly attractive demographic profile … generating high real GDP growth
Low fiscal deficit… … and controlled external deficit… … with low public debt
PL: Poland
RU: Russia
TR: Turkey
EUZ: Eurozone
SA: South Africa
BR: Brazil
5
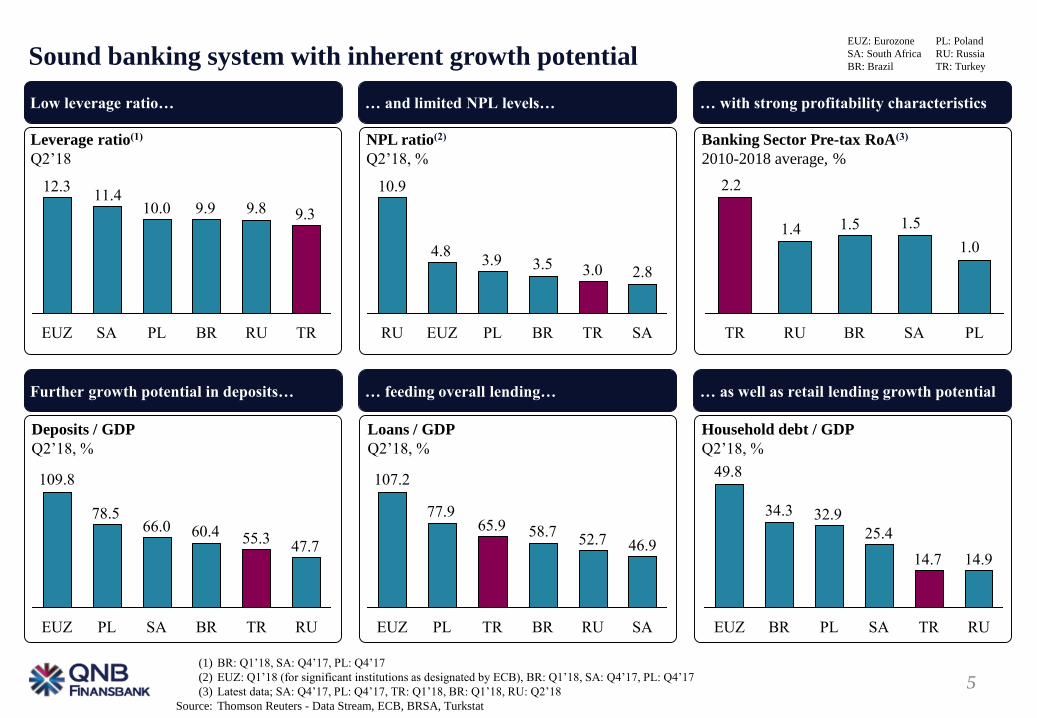
Sound banking system with inherent growth potential
(1) BR: Q1’18, SA: Q4’17, PL: Q4’17
(2) EUZ: Q1’18 (for significant institutions as designated by ECB), BR: Q1’18, SA: Q4’17, PL: Q4’17
(3) Latest data; SA: Q4’17, PL: Q4’17, TR: Q1’18, BR: Q1’18, RU: Q2’18
Source: Thomson Reuters - Data Stream, ECB, BRSA, Turkstat
Leverage ratio(1)
Q2’18
Banking Sector Pre-tax RoA(3)
2010-2018 average, %
NPL ratio(2)
Q2’18, %
Deposits / GDP
Q2’18, %
Household debt / GDP
Q2’18, %
Loans / GDP
Q2’18, %
14.914.7
25.4
32.934.3
49.8
BREUZ RUTRSAPL
1.0
1.51.51.4
2.2
PLSABRRUTR
9.39.89.910.011.4
12.3
BRPL TRRUSAEUZ
2.83.03.53.94.8
10.9
SATRBRPLEUZRU
47.755.360.466.0
78.5
109.8
RUTRBRSAPLEUZ
46.952.758.765.9
77.9
107.2
RUBR SATRPLEUZ
Low leverage ratio… … and limited NPL levels… … with strong profitability characteristics
Further growth potential in deposits… … feeding overall lending… … as well as retail lending growth potential
PL: Poland
RU: Russia
TR: Turkey
EUZ: Eurozone
SA: South Africa
BR: Brazil

6
In order to achieve price stability, CBRT materially hiked interest rates which
changed Turkish Banking Sector landscape
Central Bank rates
6
8
10
12
14
16
18
20
22
24
26
28
Mar
’18
Oct
’16
Nov’1
6
Feb
’18
May
’17
Oct
’17
Dec
’16
Aug’1
7
Feb
’17
Mar
’17
Jan’1
7
Apr’
17
Jun’1
7
Jul’
17
Sep
’17
Nov’1
7D
ec’1
7
Jun’1
8
Jan’1
8
Apr’
18
May
’18
Jul’
18
Aug’1
8S
ep’1
8Avg. funding rate
1 week repo
Late liquidity
O/N lending
O/N borrowing
Note: CBRT raised the average funding cost by 1,125bps throughout 2018. The Bank also simplified the policy framework simplification at the beginning
of June, restoring the 1-week repo rate as the main policy rate
0
10
20
30
40
50
Oct
’18
May
’18
Mar
’18
Apr’
18
Feb
’18
Jan’1
8
Jun’1
8
Jul’
18
Aug’1
8
Sep
’18
TRY against USD
Options implied TRY volatility
3
4
5
6
7
Mar
’18
Feb
’18
Jan’1
8
Apr’
18
May
’18
Jun’1
8
Jul’
18
Aug’1
8
Sep
’18
Oct
’18
Mo
od
y’s
do
wngra
de
S&
P d
ow
ngra
de
Gen
eral
ele
ctio
n
Mo
n.
po
licy
res
po
nse
Fis
cal
stim
ulu
s p
ackag
e
Mo
n.
po
licy
res
po
nse
Mo
n.p
ol.
res.
(Em
ergen
cy)
US
san
ctio
ns
on T
urk
ey
BR
SA
-CB
RT
mea
sure
s
Mo
n.
po
licy
res
po
nse
New
Eco
no
mic
Pro
gra
m
Mo
od
y’s
do
wngra
de
S&
P d
ow
ngra
de
Gen
eral
ele
ctio
n
Mo
n.
po
licy
res
po
nse
Fis
cal
stim
ulu
s p
ackag
e
Mo
n.
po
licy
res
po
nse
Mo
n.p
ol.
res.
(Em
ergen
cy)
US
san
ctio
ns
on T
urk
ey
BR
SA
-CB
RT
mea
sure
s
Mo
n.
po
licy
res
po
nse
New
Eco
no
mic
Pro
gra
m
QNB Finansbank and QNB
Group at a Glance

8
QNB Finansbank: 5th Largest Privately Owned Universal Bank(1)
% Owned by QNB Finansbank
İşbank İşbank İşbank İşbank Garanti İşbank
Garanti Garanti Garanti Garanti İşbankYapı
Kredi
Yapı
KrediAkbank
Yapı
KrediAkbank
Yapı
KrediGaranti
AkbankYapı
KrediAkbank
Yapı
KrediAkbank
Denizbank Denizbank Akbank
Denizbank Denizbank Denizbank Denizbank
TEB TEB TEB TEB TEB TEB
ING ING ING ING ING ING
HSBC HSBC HSBC HSBC HSBC HSBC
Numbers of
Branches
Customer
Deposits
Retail
Loans(2)
Commercial
Installment
LoansTotal Assets Net Loans
Bank only, 6M’18
Leasing and
Factoring
Information
Technology
Brokerage,
Fund Mgmt.
and Insurance
Co-operation
with Other
Banks
Consumer
Finance1st
2nd
3rd
4th
5th
6th
7th
8th
9th
Note: All information in the presentation is based on BRSA bank only data unless stated otherwise
(1) In terms of total assets, net loans, retail loans
(2) Including overdraft
Source: BRSA bank only data; BAT
QNB Finansbank group structure
Financial highlights
QNB Finansbank market positioning
100
9100 100
100
100
49
99 10033
9M’18
QNB Finansbank BRSA bank only financials
TRY, bn
9M’18
Total assets 180.9
Performing loans 102.0
Customer deposits 86.6
Shareholder's equity 14.0
Branches (#) 542
Active customers (mn) 5.4
Bank only employees (#) 12,079
9
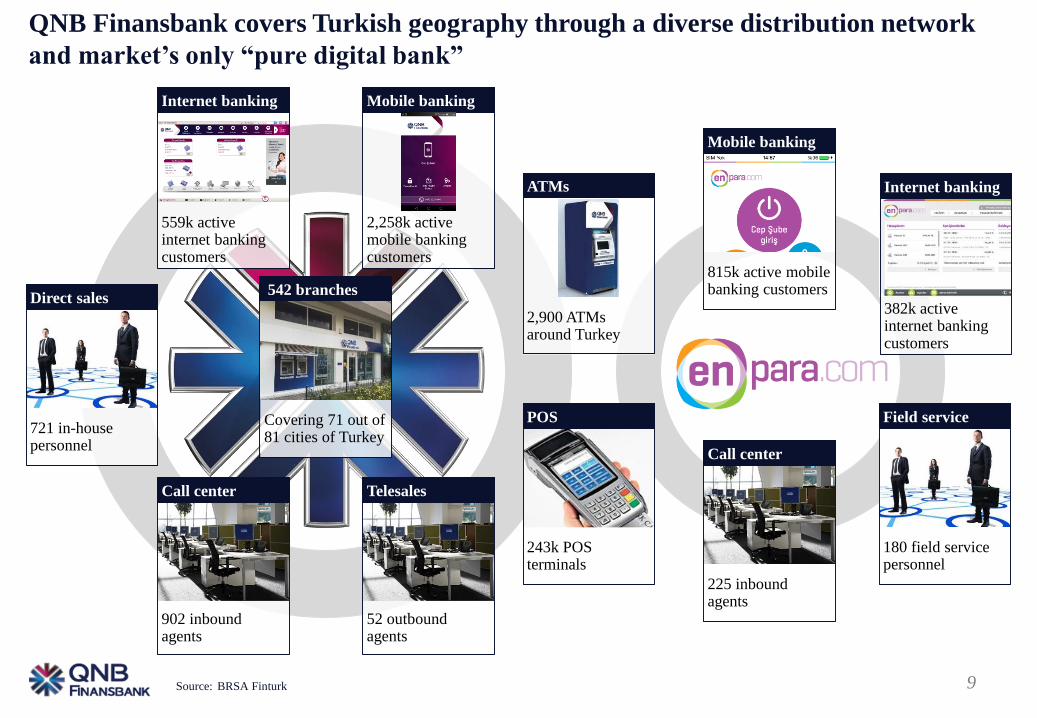
QNB Finansbank covers Turkish geography through a diverse distribution network
and market’s only “pure digital bank”
815k active mobile banking customers
Mobile banking
382k active internet banking customers
Internet banking
225 inbound agents
Call center
180 field service personnel
Field service
542 branches
2,900 ATMs around Turkey
902 inbound agents
559k active internet banking customers
721 in-house personnel
ATMs
Call center
Internet banking
Direct sales
243k POS terminals
POS
52 outbound agents
Telesales
2,258k active mobile banking customers
Mobile banking
Covering 71 out of 81 cities of Turkey
Source: BRSA Finturk
10
2.9
2.2
Next 3-
5 years
3.5-4.0
Aug’18Dec’15
9.1
8.1
8.0
7.3
5.03.7
3.12.6
20152011
14.4
6.9
10.5
7.5
4.7
1.2
4.22.7
2005 2010
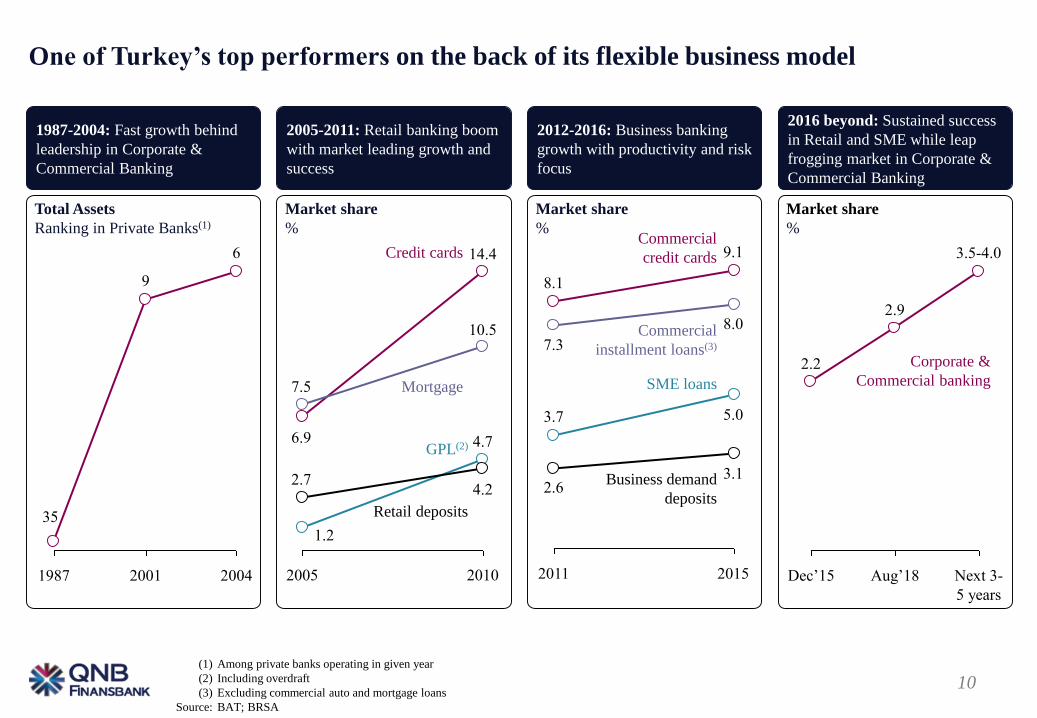
One of Turkey’s top performers on the back of its flexible business model
(1) Among private banks operating in given year
(2) Including overdraft
(3) Excluding commercial auto and mortgage loans
Source: BAT; BRSA
Total Assets
Ranking in Private Banks(1)
Market share
%
Market share
%
Market share
%
Credit cards
Mortgage
GPL(2)
Retail deposits
Commercial
credit cards
Commercial
installment loans(3)
SME loans
Business demand
deposits
Corporate &
Commercial banking
2004
6
2001
9
1987
35
1987-2004: Fast growth behind
leadership in Corporate &
Commercial Banking
2005-2011: Retail banking boom
with market leading growth and
success
2012-2016: Business banking
growth with productivity and risk
focus
2016 beyond: Sustained success
in Retail and SME while leap
frogging market in Corporate &
Commercial Banking
11
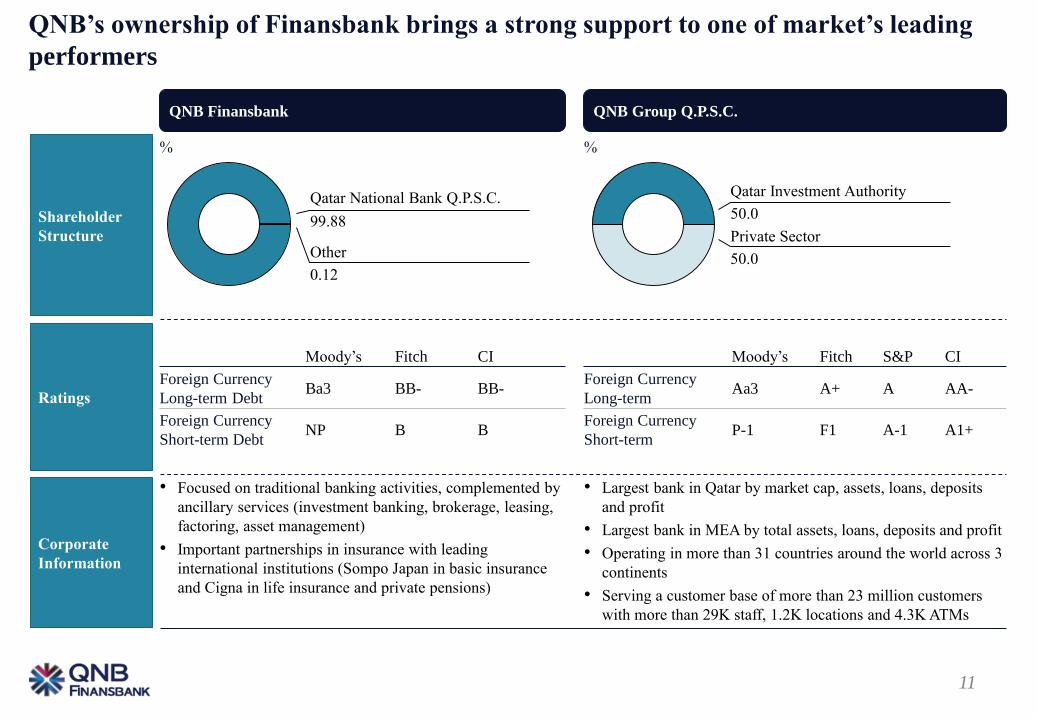
QNB’s ownership of Finansbank brings a strong support to one of market’s leading
performers
Shareholder
Structure
Ratings
Corporate
Information
Qatar National Bank Q.P.S.C.
%
99.88
Other
0.12
%
• Largest bank in Qatar by market cap, assets, loans, deposits
and profit
• Largest bank in MEA by total assets, loans, deposits and profit
• Operating in more than 31 countries around the world across 3
continents
• Serving a customer base of more than 23 million customers
with more than 29K staff, 1.2K locations and 4.3K ATMs
• Focused on traditional banking activities, complemented by
ancillary services (investment banking, brokerage, leasing,
factoring, asset management)
• Important partnerships in insurance with leading
international institutions (Sompo Japan in basic insurance
and Cigna in life insurance and private pensions)
Qatar Investment Authority
50.0
Private Sector
50.0
QNB Finansbank QNB Group Q.P.S.C.
Moody’s Fitch CI
Foreign Currency
Long-term DebtBa3 BB- BB-
Foreign Currency
Short-term DebtNP B B
Moody’s Fitch S&P CI
Foreign Currency
Long-termAa3 A+ A AA-
Foreign Currency
Short-termP-1 F1 A-1 A1+
12
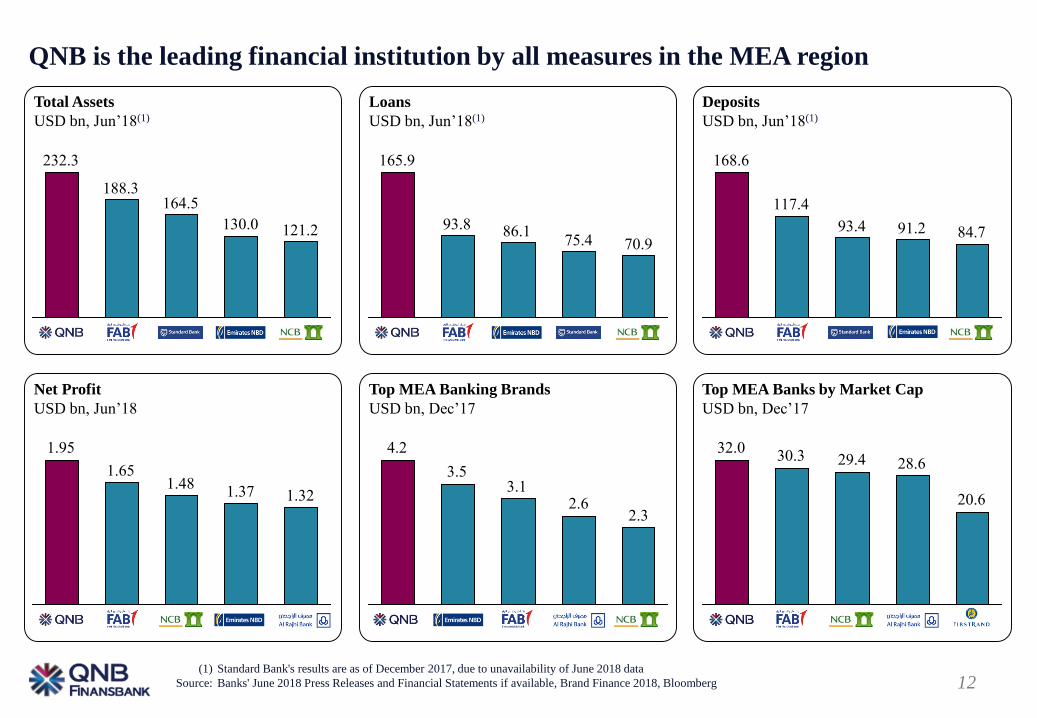
121.2130.0
164.5188.3
232.3
70.975.486.193.8
165.9
84.791.293.4
117.4
168.6
QNB is the leading financial institution by all measures in the MEA region
(1) Standard Bank's results are as of December 2017, due to unavailability of June 2018 data
Source: Banks' June 2018 Press Releases and Financial Statements if available, Brand Finance 2018, Bloomberg
1.321.371.48
1.65
1.95
2.32.6
3.13.5
4.2
20.6
29.430.332.0
28.6
Total Assets
USD bn, Jun’18(1)
Loans
USD bn, Jun’18(1)
Deposits
USD bn, Jun’18(1)
Net Profit
USD bn, Jun’18
Top MEA Banking Brands
USD bn, Dec’17
Top MEA Banks by Market Cap
USD bn, Dec’17

13
QNB ownership brings a strong geographic reach to QNB Finansbank
especially with important trade partners of Turkey
Top 40 trade
partners of Turkey
QNB presence
Vietnam
Egypt
India
China
Singapore
Indonesia
France
United Kingdom
Switzerland
UAE
Libya
Jordan
Iran(1)
Qatar
Tunisia
Yemen
Syria
Iraq
Kuwait
Lebanon
Bahrain
Oman
Palestine
South Sudan
Sudan
Algeria
Mauritania
Togo
Myanmar
Turkey
Middle East
Europe
Sub-Saharan Africa
Asia
North Africa
(1) Dormant
KSA

Financial Performance
15
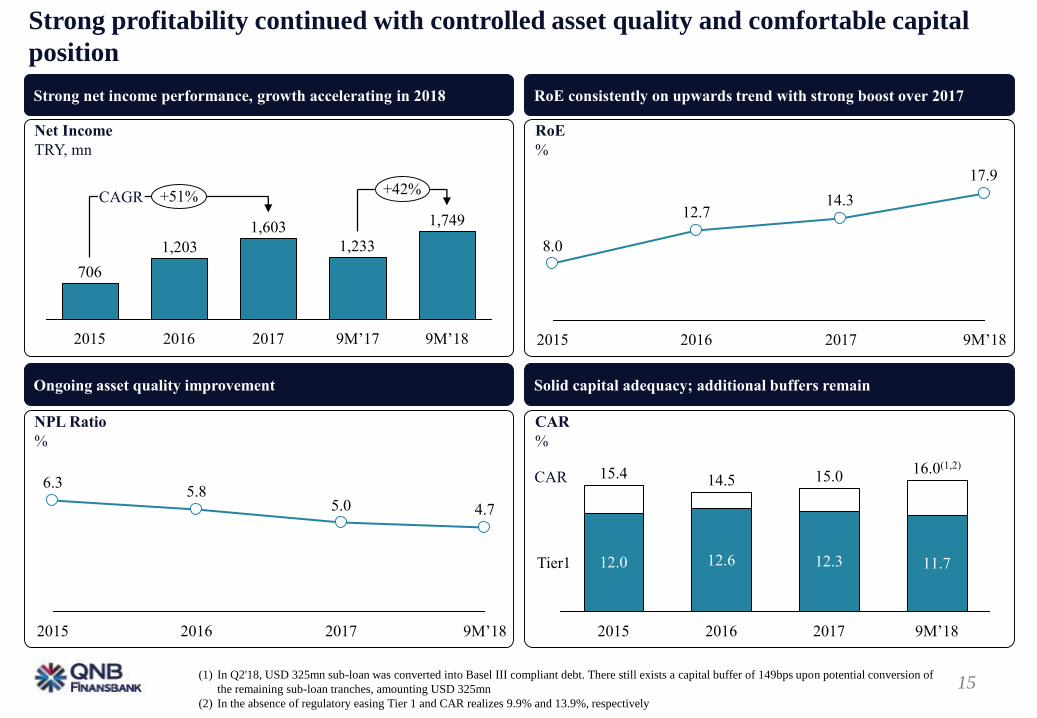
RoE consistently on upwards trend with strong boost over 2017Strong net income performance, growth accelerating in 2018
Ongoing asset quality improvement Solid capital adequacy; additional buffers remain
RoE
%
Net Income
TRY, mn
NPL Ratio
%
CAR
%
17.9
14.312.7
8.0
9M’18201720162015
1,749
1,233
1,603
1,203
706
+42%+51%
9M’189M’17201720162015
12.0 12.6 12.3 11.7
2017
15.0
2016
14.5
2015
15.4
Tier1
9M’18
16.0(1,2)
4.75.05.8
6.3
9M’18201720162015
Strong profitability continued with controlled asset quality and comfortable capital
position
CAGR
(1) In Q2'18, USD 325mn sub-loan was converted into Basel III compliant debt. There still exists a capital buffer of 149bps upon potential conversion of
the remaining sub-loan tranches, amounting USD 325mn
(2) In the absence of regulatory easing Tier 1 and CAR realizes 9.9% and 13.9%, respectively
CAR
16
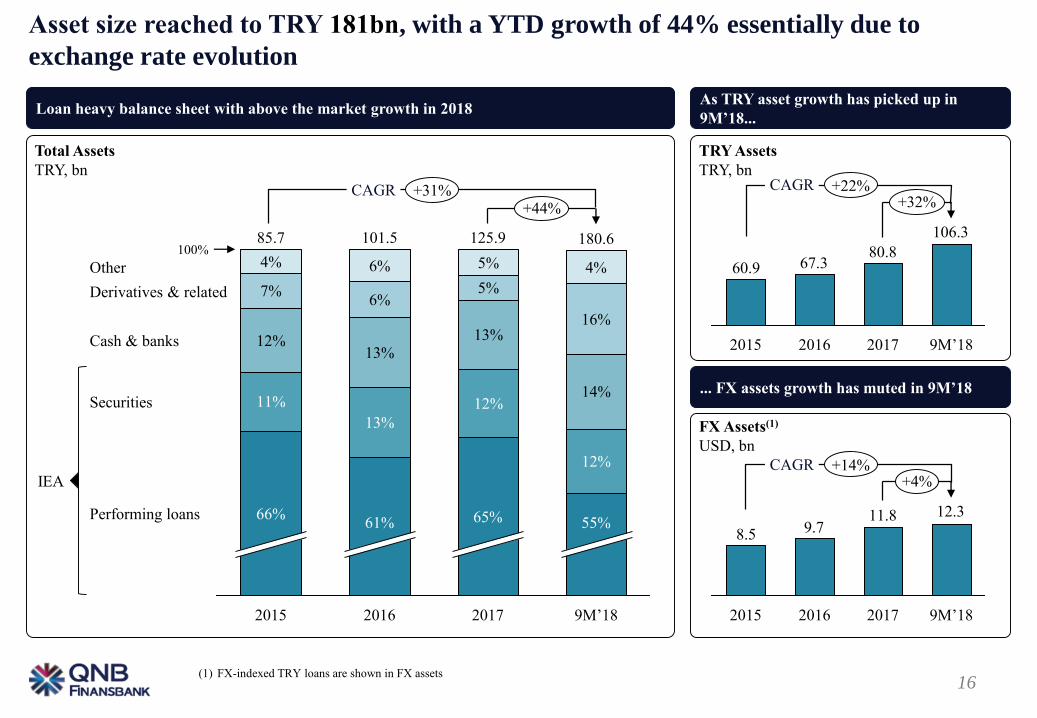
Asset size reached to TRY 181bn, with a YTD growth of 44% essentially due to
exchange rate evolution
(1) FX-indexed TRY loans are shown in FX assets
IEA
Total Assets
TRY, bn
TRY Assets
TRY, bn
FX Assets(1)
USD, bn
11%
13%
12%
12%
12%13%
13%
14%
7%6%
6%
5%
5%4%
65%
2016
101.5
16%
4%
2017
125.9
Derivatives & related
85.7
2015
Cash & banks
Securities
Performing loans
+44%
66%55%
180.6
9M’18
Other
61%
100%
106.3
80.867.360.9
201720162015
+32%
9M’18
12.311.89.78.5
+4%
9M’1820162015 2017
+14%
+22%+31%
Loan heavy balance sheet with above the market growth in 2018As TRY asset growth has picked up in
9M’18...
... FX assets growth has muted in 9M’18
CAGR CAGR
CAGR
17
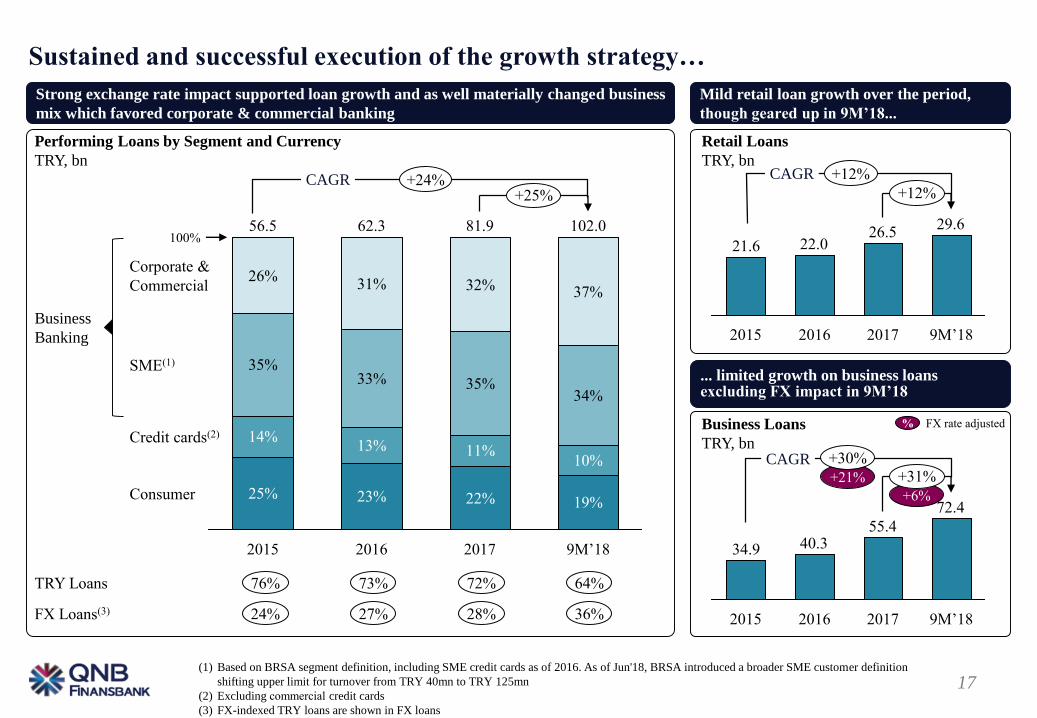
+6%
+21%
Business Loans
TRY, bnCAGR
Sustained and successful execution of the growth strategy…
(1) Based on BRSA segment definition, including SME credit cards as of 2016. As of Jun'18, BRSA introduced a broader SME customer definition
shifting upper limit for turnover from TRY 40mn to TRY 125mn
(2) Excluding commercial credit cards
(3) FX-indexed TRY loans are shown in FX loans
Business
Banking
TRY Loans
FX Loans(3) 28%
72%
36%
64%
27%
73%
Performing Loans by Segment and Currency
TRY, bn
Retail Loans
TRY, bn
29.626.5
22.021.6
+12%
9M’18201720162015
72.4
55.440.334.9
+31%
9M’18201720162015
25% 23% 22% 19%
14%13% 11%
10%
35%33% 35%
34%
26%31% 32% 37%
2016
62.3
2015
56.5
9M’18
102.0
2017
81.9100%
+25%
Consumer
Credit cards(2)
SME(1)
Corporate &
Commercial
Strong exchange rate impact supported loan growth and as well materially changed business
mix which favored corporate & commercial banking
Mild retail loan growth over the period,
though geared up in 9M’18...
... limited growth on business loans excluding FX impact in 9M’18
+24%CAGR
24%
76%
+12%CAGR
% FX rate adjusted
+30%

18
CAGRCAGR
… focused on business banking loans and selective retail banking segments
Business banking
35.128.5
20.519.9
201720162015
+23%
9M’18
Retail banking
SME Loans(1)
TRY, bn
Corporate & Commercial Loans
TRY, bn
General Purpose Loans(2)
TRY, bn
Credit Card Loans(3)
TRY, bn
Mortgage Loans
TRY, bn
14.512.2
9.19.0
9M’18
+19%
201720162015
37.3
26.919.8
15.0
20162015 9M’18
+39%
2017
10.58.77.87.7
2015 2016 2017 9M’18
+21%
4.65.65.15.0
2015 2016
-19%
9M’182017
SME loan growth lost pace, current year
growth due to wider SME client definition (1)
Growth in corporate & commercial loans
supported by FX contributionSelective historical growth in retail loans...
... mainly driven by GPLs where growth
accelerated in 2017 and 9M’18...
... above market growth continued in credit
cards…… while decline in mortgages
-3%+12%+19% CAGRCAGRCAGR
Retail Loans
TRY, bn
29.626.5
22.021.6
2017
+12%
9M’1820162015
+12%CAGR
(1) Based on BRSA segment definition, including SME credit cards as of 2016. As of Jun'18, BRSA introduced a broader SME customer definition
shifting upper limit for turnover from TRY 40mn to TRY 125mn
(2) Including overdraft
(3) Credit card outstanding from individual clients
+23% +39%
19
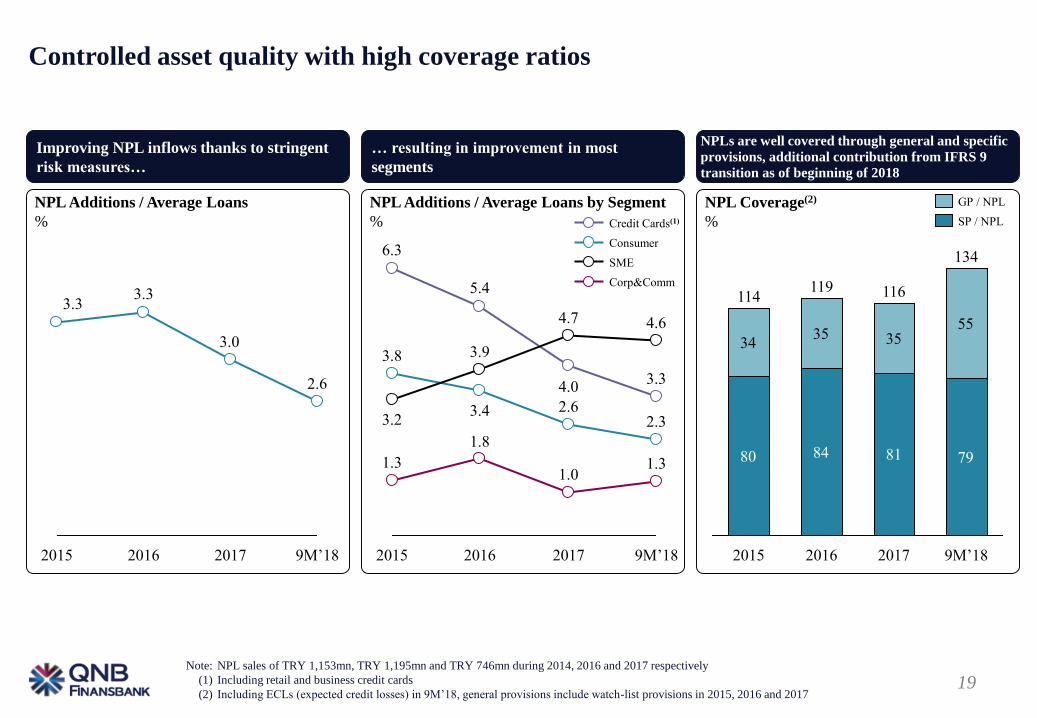
Controlled asset quality with high coverage ratios
Note: NPL sales of TRY 1,153mn, TRY 1,195mn and TRY 746mn during 2014, 2016 and 2017 respectively
(1) Including retail and business credit cards
(2) Including ECLs (expected credit losses) in 9M’18, general provisions include watch-list provisions in 2015, 2016 and 2017
NPL Additions / Average Loans
%
NPL Additions / Average Loans by Segment
%
NPL Coverage(2)
%
80 84 81 79
3435 35
55
9M’18
134
2017
116
2016
119
2015
114
3.34.0
5.4
6.3
2.32.63.4
3.8
4.64.7
3.9
3.2
1.31.0
1.8
1.3
9M’18201720162015
2.6
3.0
3.33.3
9M’18201720162015
Improving NPL inflows thanks to stringent
risk measures…
… resulting in improvement in most
segments
NPLs are well covered through general and specific
provisions, additional contribution from IFRS 9
transition as of beginning of 2018
GP / NPL
SP / NPL
Corp&Comm
Consumer
SME
Credit Cards(1)
20
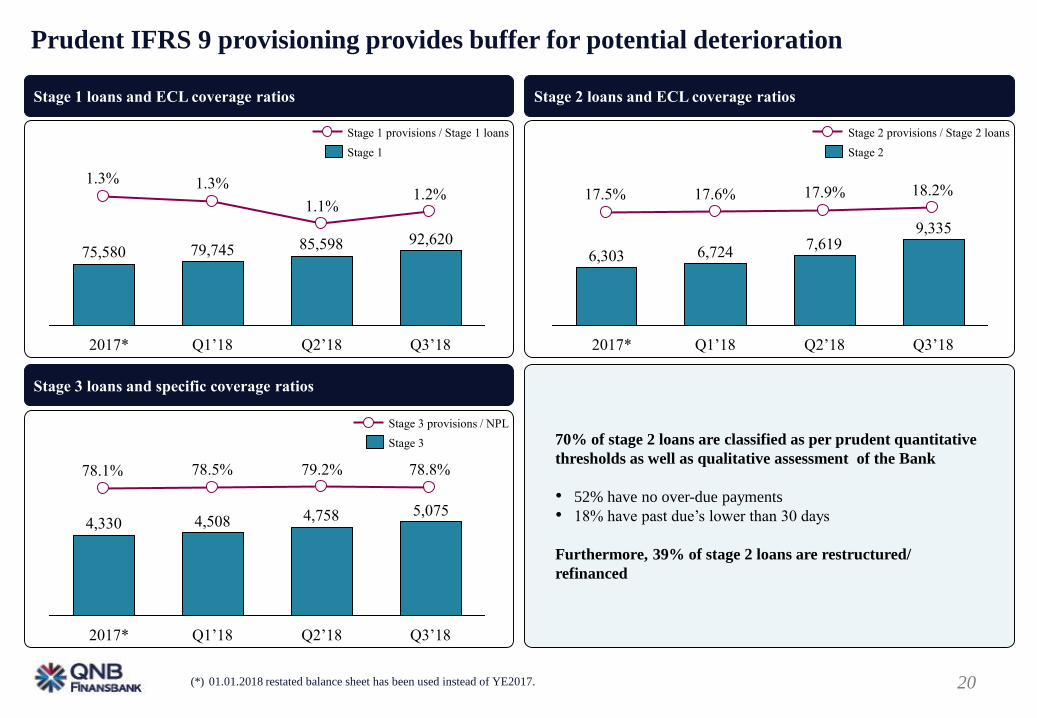
Stage 2 loans and ECL coverage ratios Stage 1 loans and ECL coverage ratios
Stage 3 loans and specific coverage ratios
92,62085,59879,74575,580
1.2%1.1%
1.3%1.3%
Q3’18Q2’18Q1’182017*
Stage 1
Stage 1 provisions / Stage 1 loans
9,3357,619
6,7246,303
18.2%17.9%17.6%17.5%
Q3’18Q2’18Q1’182017*
Stage 2
Stage 2 provisions / Stage 2 loans
5,0754,7584,5084,330
78.8%79.2%78.5%78.1%
Q3’18Q2’18Q1’182017*
Stage 3
Stage 3 provisions / NPL
Prudent IFRS 9 provisioning provides buffer for potential deterioration
70% of stage 2 loans are classified as per prudent quantitative
thresholds as well as qualitative assessment of the Bank
• 52% have no over-due payments
• 18% have past due’s lower than 30 days
Furthermore, 39% of stage 2 loans are restructured/
refinanced
(*) 01.01.2018 restated balance sheet has been used instead of YE2017.

21
Securities portfolio reached TRY 21.2bn, accounting for 12% of assets
Total Securities
TRY, bn
TRY Securities
TRY, bn
FX Securities
USD, bn
TRY Securities
FX Securities 43%
57%
47%
53%
30%
70%
42%
58%
42% 46% 46%
58% 54% 54%41%
Held to maturity
Available for sale
Trading
9M’18(1)
21.2
59%
0%
2017
15.5
0%
2016
12.9
0%
2015
9.2
0%100%
+37%
100%
-7%
Fixed
9M’18
1.6
2017
1.7
2016
1.5
2015
1.0
35% 39% 36%
56% 55% 51% 50%
30%
+27%
FRN
9M’18
CPI
Fixed
100%11.3
14%
2017
8.9
10%
2016
7.5
15%
2015
6.4
9%
+23%
+36%
+21%
Growth in securities portfolio largely driven by TRY indexed/
variable securities86% of TRY securities are indexed/variable rate
Stable FX securities portfolio during 2018, reported decline due to
recent market volatility on values of securities
CAGR
CAGR
CAGR
(1) In line with IFRS 9 business model reassessment there have been reclassification from AFS to HTM
22
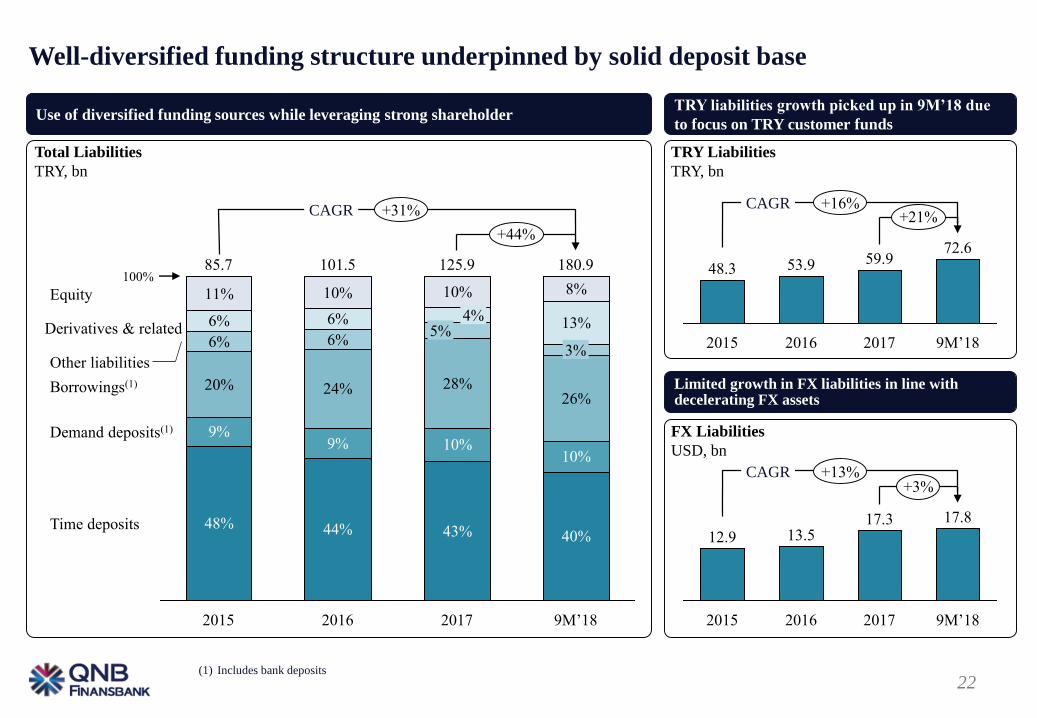
Well-diversified funding structure underpinned by solid deposit base
Total Liabilities
TRY, bn
TRY Liabilities
TRY, bn
FX Liabilities
USD, bn
+21%
9M’18
72.6
2017
59.9
2016
53.9
2015
48.3
+3%
9M’18
17.8
2017
17.3
2016
13.5
2015
12.948% 44% 43% 40%
9%9% 10%
10%
20% 24% 28%26%
6% 6%
6% 6% 13%
11% 10% 10% 8%
Derivatives & related
Time deposits
180.9100%
Borrowings(1)
9M’18
+44%
Other liabilities
Demand deposits(1)
Equity
3%
2017
125.9
5%4%
2016
101.5
2015
85.7
Use of diversified funding sources while leveraging strong shareholderTRY liabilities growth picked up in 9M’18 due
to focus on TRY customer funds
Limited growth in FX liabilities in line with decelerating FX assets
+31% +16%CAGRCAGR
(1) Includes bank deposits
CAGR +13%

23
L/D ratio improves on the back of robust deposit growth
(1) Including performing loans, bank deposits and TRY bonds, excluding funding through CBRT swap facility
FX customer deposits
USD, bn
TRY customer deposits
TRY, bn
Customer demand deposits, aop
TRY, bn
Loan-to-deposit ratio(1)
%
37.534.531.228.6
20162015
+9%
9M’182017
17.2
12.39.2
7.7
2015
+40%
9M’1820172016
8.18.1
5.96.3
9M’18201720162015
0%
111117113115
9M’18201720162015
Sustained growth in FX customer deposits with a slight switch to
TRY deposits in 9M’18Stable TRY customer deposits growth above the sector
Sustained impressive growth in demand deposits Loan-to-deposits ratio improves following robust deposit growth
+10%
+34%
+9%CAGR
CAGR
CAGR
24
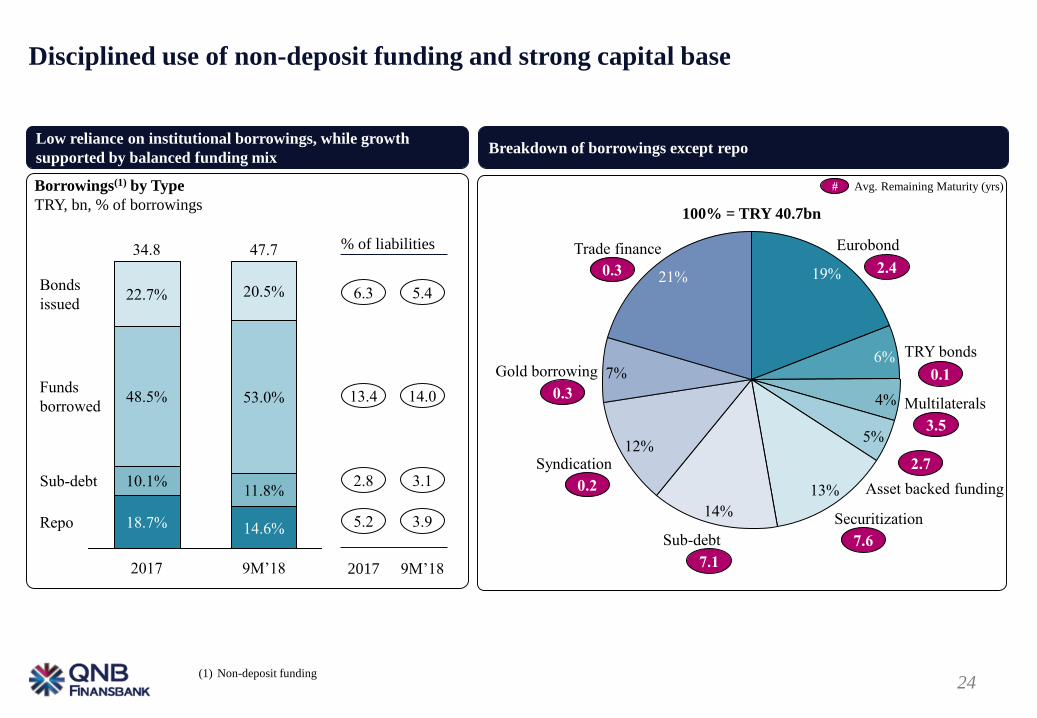
Disciplined use of non-deposit funding and strong capital base
Borrowings(1) by Type
TRY, bn, % of borrowings
% of liabilities
Repo
Sub-debt
Funds
borrowed
Bonds
issued
2017
34.8
18.7%
11.8%
53.0%
20.5%
9M’18
47.7
14.6%
10.1%
48.5%
22.7%
(1) Non-deposit funding
5.4
14.0
3.1
3.9
2017
Low reliance on institutional borrowings, while growth
supported by balanced funding mixBreakdown of borrowings except repo
9M’18
6.3
13.4
2.8
5.2
21%
Trade finance
Syndication
13%
TRY bonds6%
5%
Eurobond
Sub-debt
14%Securitization
12%
19%
Multilaterals
Gold borrowing
4%
Asset backed funding
7%
100% = TRY 40.7bn
2.4
# Avg. Remaining Maturity (yrs)
3.5
2.7
7.6
7.1
0.2
0.3
0.1
0.3
25
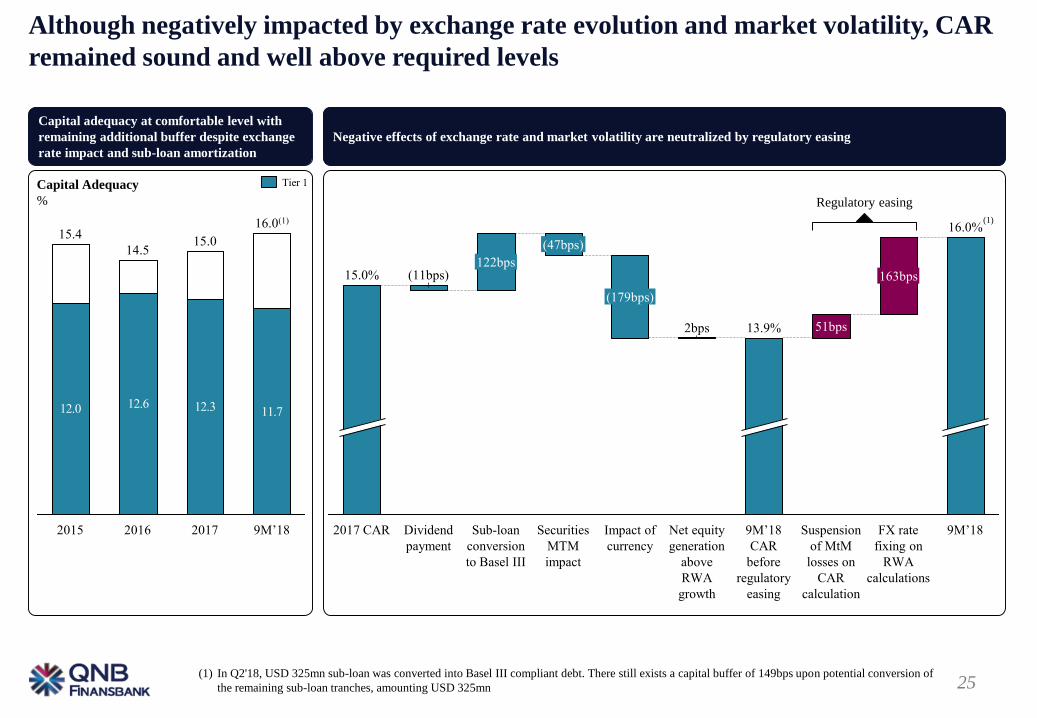
Although negatively impacted by exchange rate evolution and market volatility, CAR
remained sound and well above required levels
Capital Adequacy
%
12.0 12.6 12.3 11.7
16.0(1)
9M’18
15.4
2015
14.5
2016 2017
15.0
(1) In Q2'18, USD 325mn sub-loan was converted into Basel III compliant debt. There still exists a capital buffer of 149bps upon potential conversion of
the remaining sub-loan tranches, amounting USD 325mn
Negative effects of exchange rate and market volatility are neutralized by regulatory easing
Capital adequacy at comfortable level with
remaining additional buffer despite exchange
rate impact and sub-loan amortization
13.9%
9M’18
163bps
16.0%
FX rate
fixing on
RWA
calculations
Dividend
payment
(47bps)
15.0%
51bps
(179bps)
2bps
(11bps)122bps
2017 CAR Impact of
currency
9M’18
CAR
before
regulatory
easing
Net equity
generation
above
RWA
growth
Suspension
of MtM
losses on
CAR
calculation
Securities
MTM
impact
Sub-loan
conversion
to Basel III
Tier 1
Regulatory easing
(1)

26
A structured approach to market and liquidity risk management
• TRY interest rate sensitivity is actively managed in the international swap market
• Hedge swap book stands at TRY 16.2bn as of Q3’18
• Net change in Economic Value / Equity is constantly monitored under several scenarios
• Regulatory IRRBB ratio is at 4.6% as opposed to 20% limit; indicating a conservative interest rate position on
the banking book (as of August’18)
Focused ALM
leads to low
interest rate
sensitivity
Prudent
management of
liquidity risk
Low risk appetite
for trading risks
• Strong framework is in place to ensure sufficient short-term and long-term liquidity
• Total Regulatory Liquidity Coverage ratio is 144.9% as opposed to 90% limit, whereas FX Regulatory
Liquidity coverage ratio is 243.7% as opposed to 70% limit. Liquidity coverage ratio limits will be increased
gradually by 10% each year up to 100% and 80% in 2019 for total liquidity and FX liquidity, respectively
• High rollover ratios at recent syndications have been a crucial indicator as they have proved that international
funding markets have remained open for Turkish banks despite the prevailing macro backdrop. Regardless of
this fact, on an extreme worst-case stress scenario of full redemption of all wholesale funding and zero
collection from FX loans, QNB Finansbank is able to cover one year of FX outflow and have excess FX
liquidity equivalent to TRY 6.5bn, thanks to its foreign reserves at Central Bank and the resilience of its local
customer deposits
• Low trading risk appetite is reflected by the limit structure both on portfolio and product level
• Best-in-class measurement methodologies are in place with daily monitoring of all market risk metrics
(VaR, sensitivities, etc.) in addition to stress tests and scenario analysis
27
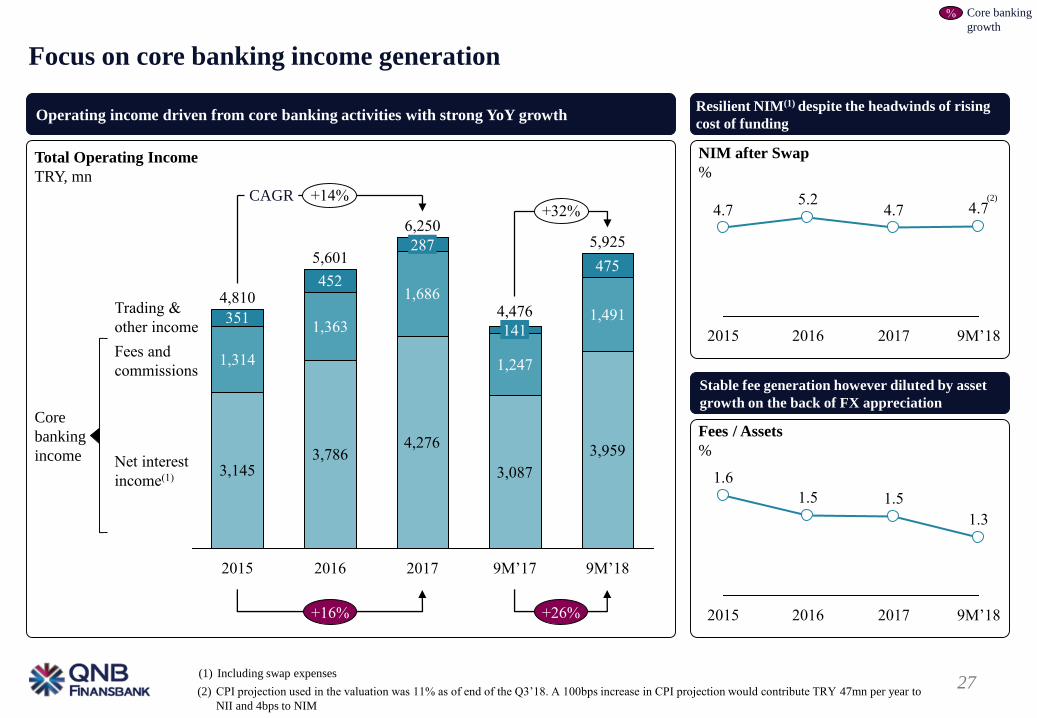
1.3
1.51.5
1.6
9M’18201720162015
3,1453,786
4,276
3,087
3,959
1,314
1,363
1,686
1,247
1,491
475452
351
2015
4,810
141
2017
6,250
287
2016
5,601
+14%+32%
Net interest
income(1)
Fees and
commissions
Trading &
other income
9M’18
5,925
9M’17
4,476
Focus on core banking income generation
(1) Including swap expenses
Core
banking
income
Total Operating Income
TRY, mn
NIM after Swap
%
Fees / Assets
%
4.74.75.2
4.7
9M’18201720162015
% Core banking
growth
Operating income driven from core banking activities with strong YoY growthResilient NIM(1) despite the headwinds of rising
cost of funding
Stable fee generation however diluted by asset
growth on the back of FX appreciation
+26%
CAGR
+16%
(2) CPI projection used in the valuation was 11% as of end of the Q3’18. A 100bps increase in CPI projection would contribute TRY 47mn per year to
NII and 4bps to NIM
(2)
28
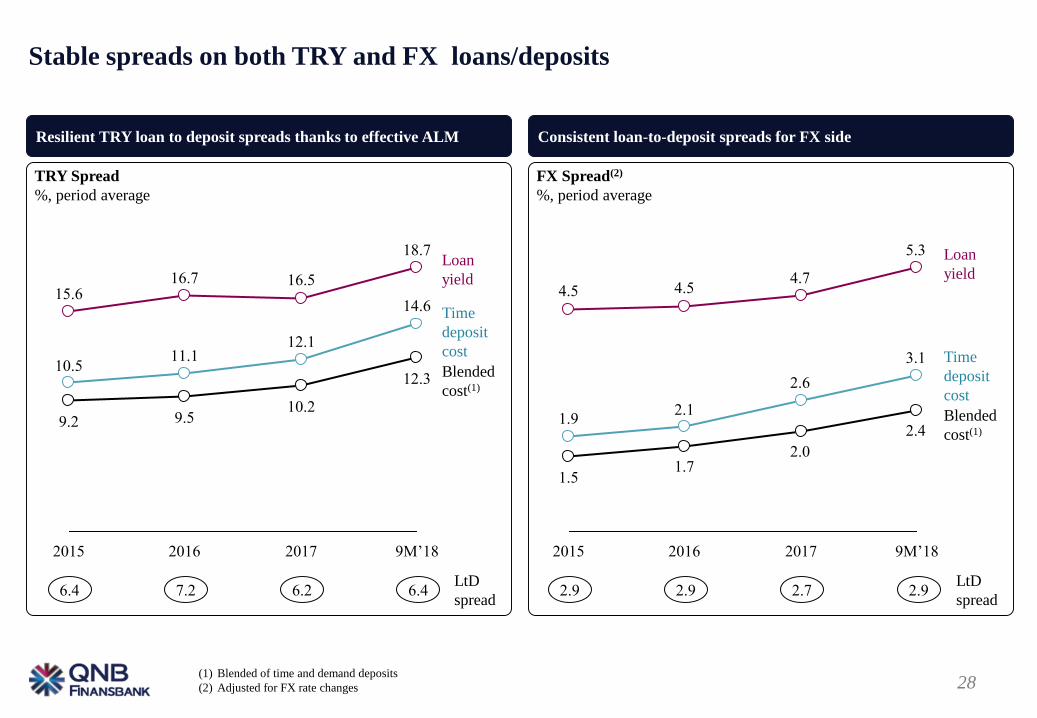
Stable spreads on both TRY and FX loans/deposits
(1) Blended of time and demand deposits
(2) Adjusted for FX rate changes
Loan
yield
Blended
cost(1)
6.2 6.46.4 7.2LtD
spread
Time
deposit
cost
TRY Spread
%, period average
FX Spread(2)
%, period average
2.92.9 2.9
18.7
16.516.715.6
14.6
12.111.1
10.512.3
10.29.59.2
2015 2016 2017 9M’18
5.3
4.74.54.5
3.1
2.6
2.11.9
2.4
2.01.7
1.5
2015 2016 2017 9M’18
Loan
yield
Blended
cost(1)
Time
deposit
cost
Resilient TRY loan to deposit spreads thanks to effective ALM Consistent loan-to-deposit spreads for FX side
2.7LtD
spread
29
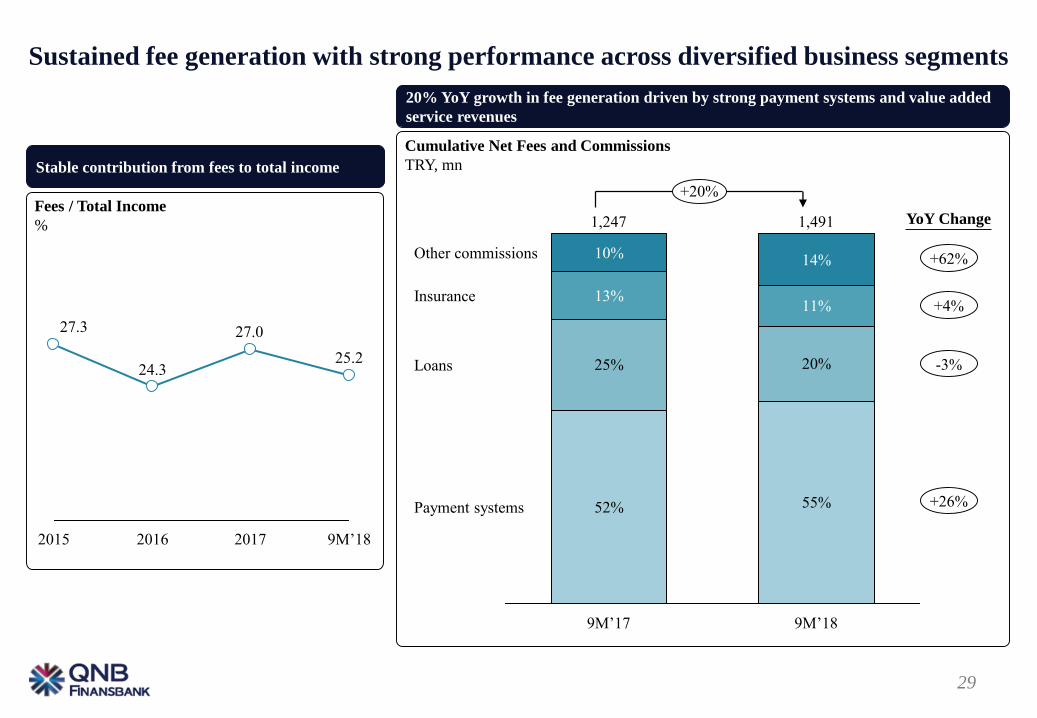
Sustained fee generation with strong performance across diversified business segments
YoY Change
Cumulative Net Fees and Commissions
TRY, mn
Fees / Total Income
%
25.2
27.0
24.3
27.3
9M’18201720162015
52% 55%
25% 20%
13%
10% 14%
11%
1,491
9M’18
Payment systems
Loans
Other commissions
1,247
9M’17
Insurance
20% YoY growth in fee generation driven by strong payment systems and value added
service revenues
Stable contribution from fees to total income
+62%
-3%
+4%
+26%
+20%

30
Change in business mix combined with measures taken in credit risk management across segments translates to better asset quality enabling to absorb negative effects from currency and macro parameters
(1) IFRS 9 standards with regard to provisions implemented starting on 01/01/2018
Total COR breakdown, 9M’18Cost of Risk(1)
%
1.81.7
2.22.2
201720162015 9M’18
Despite negative effects of currency and macro parameters CoR remained inline with
prior periodStable CoR
37bps 30bps 25bps 92bps
184bps
Currency
impact
Macro
parameters
update
Stage 1&2
provisioning
Stage 3
provisioning
Total
31
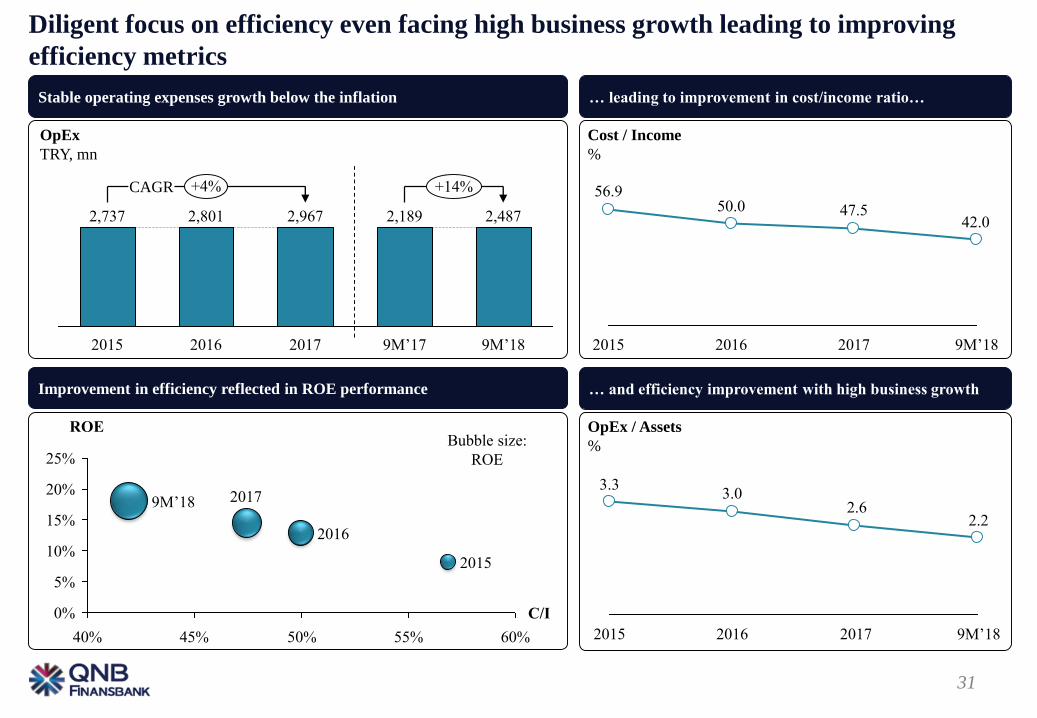
Diligent focus on efficiency even facing high business growth leading to improving
efficiency metrics
Cost / Income
%
OpEx / Assets
%
OpEx
TRY, mn
42.047.550.0
56.9
20162015 9M’182017
2.22.6
3.03.3
9M’18201720162015
2,801
9M’18
2,487
9M’17
2,1892,737
2015 2017
2,967
2016
+14%+4%
… leading to improvement in cost/income ratio…
… and efficiency improvement with high business growth
Stable operating expenses growth below the inflation
CAGR
Improvement in efficiency reflected in ROE performance
0%
5%
10%
15%
20%
25%
40% 45% 50% 55% 60%
C/I
ROE
9M’18 2017
2016
2015
Bubble size:
ROE
32
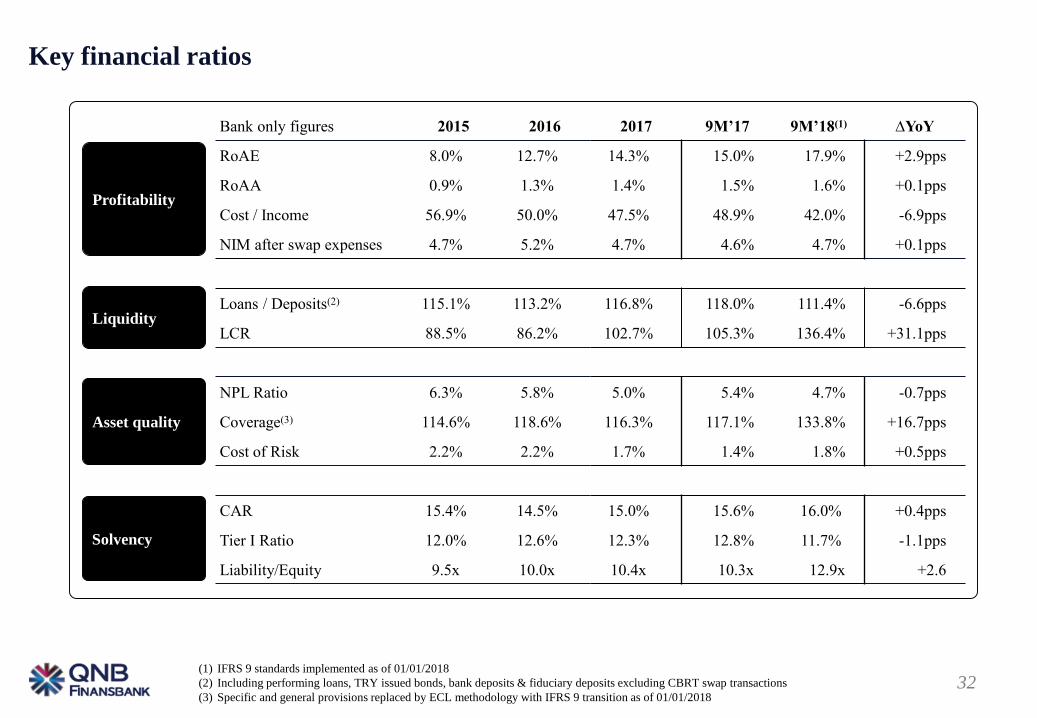
Key financial ratios
Bank only figures 2015 2016 2017 9M’17 9M’18(1) ∆YoY
RoAE 8.0% 12.7% 14.3% 15.0% 17.9% +2.9pps
RoAA 0.9% 1.3% 1.4% 1.5% 1.6% +0.1pps
Cost / Income 56.9% 50.0% 47.5% 48.9% 42.0% -6.9pps
NIM after swap expenses 4.7% 5.2% 4.7% 4.6% 4.7% +0.1pps
Loans / Deposits(2) 115.1% 113.2% 116.8% 118.0% 111.4% -6.6pps
LCR 88.5% 86.2% 102.7% 105.3% 136.4% +31.1pps
NPL Ratio 6.3% 5.8% 5.0% 5.4% 4.7% -0.7pps
Coverage(3) 114.6% 118.6% 116.3% 117.1% 133.8% +16.7pps
Cost of Risk 2.2% 2.2% 1.7% 1.4% 1.8% +0.5pps
CAR 15.4% 14.5% 15.0% 15.6% 16.0% +0.4pps
Tier I Ratio 12.0% 12.6% 12.3% 12.8% 11.7% -1.1pps
Liability/Equity 9.5x 10.0x 10.4x 10.3x 12.9x +2.6
Profitability
Liquidity
Asset quality
Solvency
(1) IFRS 9 standards implemented as of 01/01/2018
(2) Including performing loans, TRY issued bonds, bank deposits & fiduciary deposits excluding CBRT swap transactions
(3) Specific and general provisions replaced by ECL methodology with IFRS 9 transition as of 01/01/2018

33
Key strategies in 2018 and going forward
• Core banking, i.e., minimum market risk
• Prudent credit risk management
• High CAR, high liquidity at all times
• Leverage wholesale funding opportunities presented by new shareholder structure
Long Term
Sustainable
Strategy
• Maintain controlled growth in Corporate & Commercial and SME segments
• Selective growth in consumer lending with general purpose loans and renewed emphasis on credit
cards with “high card spend” – a driver of acquiring volume (an SME business)
• Profitability and downstream business focus in Corporate & Commercial segments
• Continued emphasis on building a stable deposit base through new channels, offerings to untapped
segments and customer groups (enpara.com)
• Focus on fee generation and operating expenses control as well as continuing improvement on cost
of risk front
Mid Term
Strategic
Actions

Appendix
35
Balance SheetIncome Statement
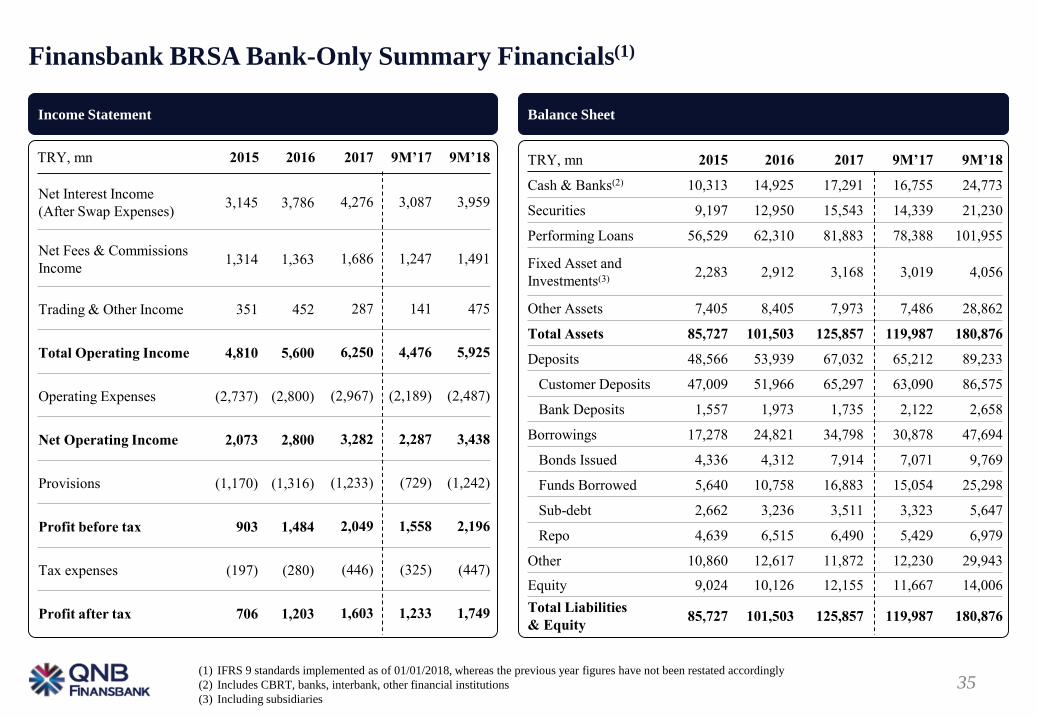
Finansbank BRSA Bank-Only Summary Financials(1)
TRY, mn 2015 2016 2017 9M’17 9M’18
Cash & Banks(2) 10,313 14,925 17,291 16,755 24,773
Securities 9,197 12,950 15,543 14,339 21,230
Performing Loans 56,529 62,310 81,883 78,388 101,955
Fixed Asset and
Investments(3)2,283 2,912 3,168 3,019 4,056
Other Assets 7,405 8,405 7,973 7,486 28,862
Total Assets 85,727 101,503 125,857 119,987 180,876
Deposits 48,566 53,939 67,032 65,212 89,233
Customer Deposits 47,009 51,966 65,297 63,090 86,575
Bank Deposits 1,557 1,973 1,735 2,122 2,658
Borrowings 17,278 24,821 34,798 30,878 47,694
Bonds Issued 4,336 4,312 7,914 7,071 9,769
Funds Borrowed 5,640 10,758 16,883 15,054 25,298
Sub-debt 2,662 3,236 3,511 3,323 5,647
Repo 4,639 6,515 6,490 5,429 6,979
Other 10,860 12,617 11,872 12,230 29,943
Equity 9,024 10,126 12,155 11,667 14,006
Total Liabilities
& Equity 85,727 101,503 125,857 119,987 180,876
(1) IFRS 9 standards implemented as of 01/01/2018, whereas the previous year figures have not been restated accordingly
(2) Includes CBRT, banks, interbank, other financial institutions
(3) Including subsidiaries
TRY, mn 2015 2016 2017 9M’17 9M’18
Net Interest Income
(After Swap Expenses)3,145 3,786 4,276 3,087 3,959
Net Fees & Commissions
Income1,314 1,363 1,686 1,247 1,491
Trading & Other Income 351 452 287 141 475
Total Operating Income 4,810 5,600 6,250 4,476 5,925
Operating Expenses (2,737) (2,800) (2,967) (2,189) (2,487)
Net Operating Income 2,073 2,800 3,282 2,287 3,438
Provisions (1,170) (1,316) (1,233) (729) (1,242)
Profit before tax 903 1,484 2,049 1,558 2,196
Tax expenses (197) (280) (446) (325) (447)
Profit after tax 706 1,203 1,603 1,233 1,749
36
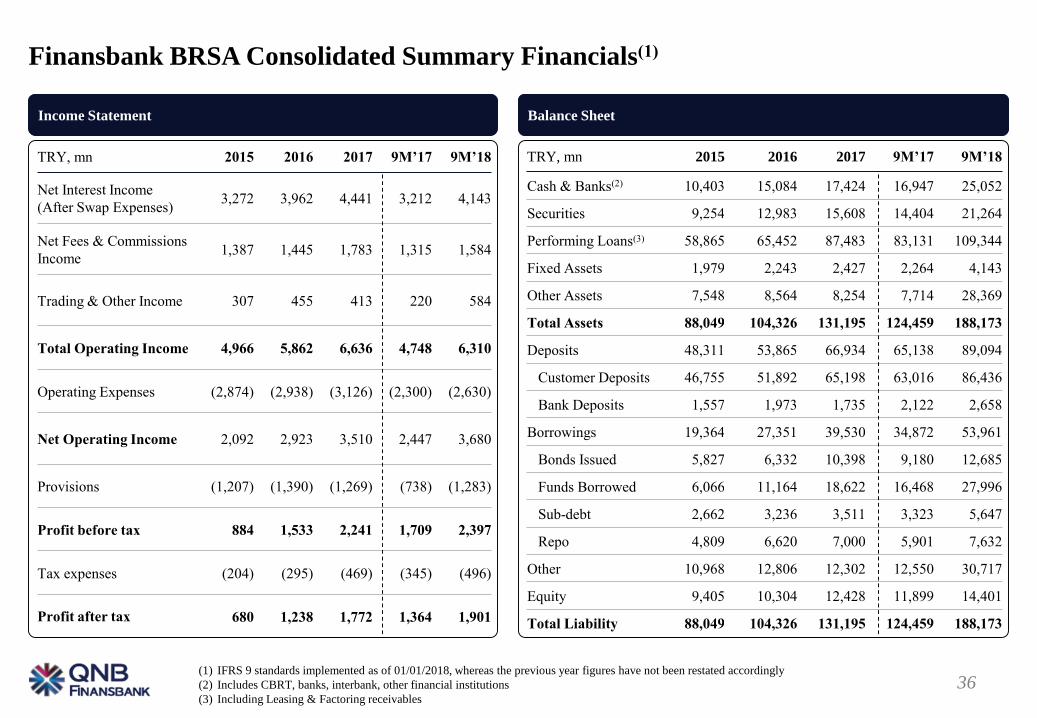
Finansbank BRSA Consolidated Summary Financials(1)
TRY, mn 2015 2016 2017 9M’17 9M’18
Net Interest Income
(After Swap Expenses)3,272 3,962 4,441 3,212 4,143
Net Fees & Commissions
Income1,387 1,445 1,783 1,315 1,584
Trading & Other Income 307 455 413 220 584
Total Operating Income 4,966 5,862 6,636 4,748 6,310
Operating Expenses (2,874) (2,938) (3,126) (2,300) (2,630)
Net Operating Income 2,092 2,923 3,510 2,447 3,680
Provisions (1,207) (1,390) (1,269) (738) (1,283)
Profit before tax 884 1,533 2,241 1,709 2,397
Tax expenses (204) (295) (469) (345) (496)
Profit after tax 680 1,238 1,772 1,364 1,901
TRY, mn 2015 2016 2017 9M’17 9M’18
Cash & Banks(2) 10,403 15,084 17,424 16,947 25,052
Securities 9,254 12,983 15,608 14,404 21,264
Performing Loans(3) 58,865 65,452 87,483 83,131 109,344
Fixed Assets 1,979 2,243 2,427 2,264 4,143
Other Assets 7,548 8,564 8,254 7,714 28,369
Total Assets 88,049 104,326 131,195 124,459 188,173
Deposits 48,311 53,865 66,934 65,138 89,094
Customer Deposits 46,755 51,892 65,198 63,016 86,436
Bank Deposits 1,557 1,973 1,735 2,122 2,658
Borrowings 19,364 27,351 39,530 34,872 53,961
Bonds Issued 5,827 6,332 10,398 9,180 12,685
Funds Borrowed 6,066 11,164 18,622 16,468 27,996
Sub-debt 2,662 3,236 3,511 3,323 5,647
Repo 4,809 6,620 7,000 5,901 7,632
Other 10,968 12,806 12,302 12,550 30,717
Equity 9,405 10,304 12,428 11,899 14,401
Total Liability 88,049 104,326 131,195 124,459 188,173
Balance SheetIncome Statement
(1) IFRS 9 standards implemented as of 01/01/2018, whereas the previous year figures have not been restated accordingly
(2) Includes CBRT, banks, interbank, other financial institutions
(3) Including Leasing & Factoring receivables
37
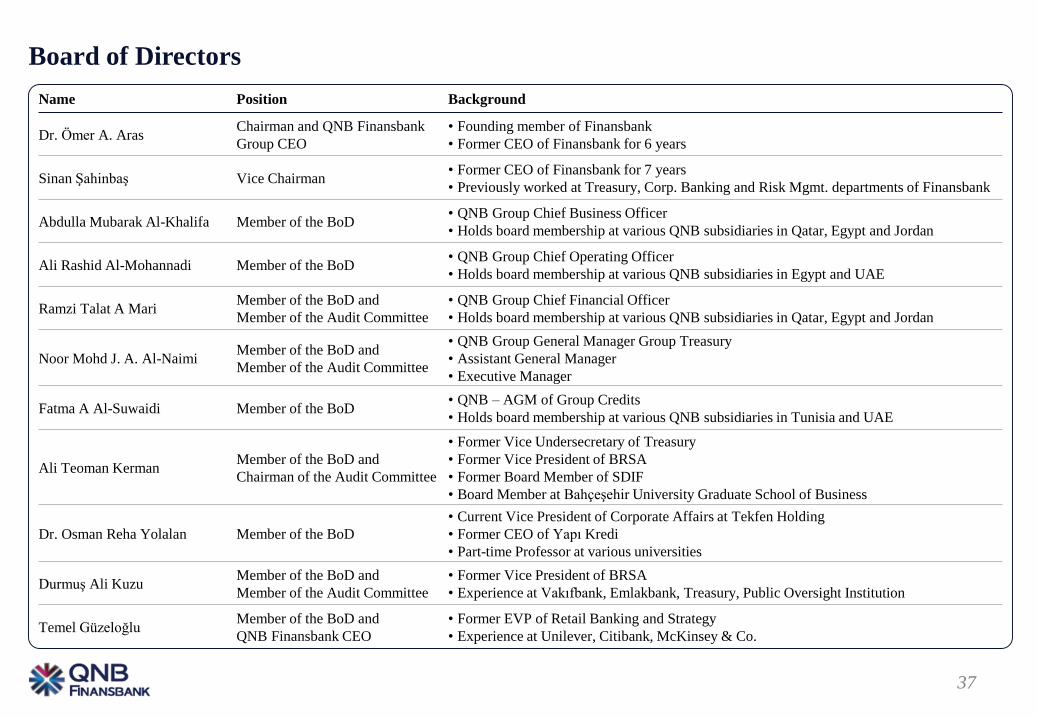
Board of Directors
Name Position Background
Dr. Ömer A. ArasChairman and QNB Finansbank
Group CEO
• Founding member of Finansbank
• Former CEO of Finansbank for 6 years
Sinan Şahinbaş Vice Chairman• Former CEO of Finansbank for 7 years
• Previously worked at Treasury, Corp. Banking and Risk Mgmt. departments of Finansbank
Abdulla Mubarak Al-Khalifa Member of the BoD• QNB Group Chief Business Officer
• Holds board membership at various QNB subsidiaries in Qatar, Egypt and Jordan
Ali Rashid Al-Mohannadi Member of the BoD• QNB Group Chief Operating Officer
• Holds board membership at various QNB subsidiaries in Egypt and UAE
Ramzi Talat A MariMember of the BoD and
Member of the Audit Committee
• QNB Group Chief Financial Officer
• Holds board membership at various QNB subsidiaries in Qatar, Egypt and Jordan
Noor Mohd J. A. Al-NaimiMember of the BoD and
Member of the Audit Committee
• QNB Group General Manager Group Treasury
• Assistant General Manager
• Executive Manager
Fatma A Al-Suwaidi Member of the BoD• QNB – AGM of Group Credits
• Holds board membership at various QNB subsidiaries in Tunisia and UAE
Ali Teoman KermanMember of the BoD and
Chairman of the Audit Committee
• Former Vice Undersecretary of Treasury
• Former Vice President of BRSA
• Former Board Member of SDIF
• Board Member at Bahçeşehir University Graduate School of Business
Dr. Osman Reha Yolalan Member of the BoD
• Current Vice President of Corporate Affairs at Tekfen Holding
• Former CEO of Yapı Kredi
• Part-time Professor at various universities
Durmuş Ali KuzuMember of the BoD and
Member of the Audit Committee
• Former Vice President of BRSA
• Experience at Vakıfbank, Emlakbank, Treasury, Public Oversight Institution
Temel GüzeloğluMember of the BoD and
QNB Finansbank CEO
• Former EVP of Retail Banking and Strategy
• Experience at Unilever, Citibank, McKinsey & Co.
38
Disclaimer
QNB Finansbank (the “Bank”) has prepared this presentation (this "Presentation") for the sole purposes of
providing information that includes forward-looking projections and statements relating to the Bank (the
“Information”). No representation or warranty is made by the Bank with respect to the accuracy or
completeness of the Information contained herein. The Information is subject to change without any notice.
Neither this Presentation nor the Information construes any investment advise or an offer to buy or sell the
Bank’s shares or other securities. This Presentation and the Information cannot be copied, disclosed or
distributed to any person other than the person to whom this Presentation is delivered or sent by the Bank. The
Bank expressly disclaims any and all liability for any statements, including any forward-looking projections
and statements, expressed, implied or contained herein, for any omission from the Information or for any other
written or oral communication transmitted or made available.