Investor Presentation - Tactile Medical
34
Investor Presentation (Nasdaq: TCMD) May 2019 Mission: To help people with chronic diseases live better and care for themselves at home
Transcript of Investor Presentation - Tactile Medical

Investor Presentation(Nasdaq: TCMD)
May 2019
Mission: To help people with chronic diseases live better and
care for themselves at home

Forward-Looking Statements Disclosure
This presentation contains forward-looking statements. Forward-looking statements are generally identifiable by the use of
words like "may," "will," "should," "could," "expect," "anticipate," "estimate," "believe," "intend,“ “outlook,” or "project" or the
negative of these words or other variations on these words or comparable terminology. All statements other than statements of
historical or current fact are, or may be deemed to be, forward-looking statements. The reader is cautioned not to put undue
reliance on these forward-looking statements, as these statements are based upon the current beliefs and expectations of
management and are subject to numerous risks and uncertainties outside of the Company’s control that can cause actual
outcomes and results to differ materially. These risks and uncertainties include, but are not limited to: the adequacy of the
Company’s liquidity to pursue its complete business objectives; the Company’s ability to obtain reimbursement from third party
payers for its products; loss or retirement of key executives; adverse economic conditions or intense competition; loss of a key
supplier; entry of new competitors and products; adverse federal, state and local government regulation; technological
obsolescence of the Company’s products; technical problems with the Company’s research and products; the Company’s
ability to expand its business through strategic acquisitions; the Company’s ability to integrate acquisitions and related
businesses; price increases for supplies and components; the effects of current and future U.S. and foreign trade policy and
tariff actions; or the inability to carry out research, development and commercialization plans. In addition, other factors that
could cause actual results to differ materially are discussed in the Company’s filings with the SEC. Investors and security
holders are urged to read these documents free of charge on the SEC's web site at http://www.sec.gov. The Company
undertakes no obligation to publicly update or revise its forward-looking statements as a result of new information, future
events or otherwise.
2
Use of Non-GAAP Financial Measures
This presentation includes the non-GAAP financial measures of Adjusted EBITDA, which differ from financial measures
calculated in accordance with U.S. generally accepted accounting principles (“GAAP”). These non-GAAP financial
measures are presented because we believe they are useful indicators of our operating performance. Management
uses these measures principally as measures of our operating performance and for planning purposes, including the
preparation of our annual operating budget and financial projections. We believe Adjusted EBITDA is useful to
investors as supplemental information because they are frequently used by analysts, investors and other interested
parties to evaluate companies in our industry. We believe these non-GAAP financial measures are useful as measures
of comparative operating performance from period to period. In addition, Adjusted EBITDA is used as a performance
metric in our compensation program. Set forth in the Appendix to this presentation, we have provided reconciliations
of these non-GAAP financial measures to the most directly comparable GAAP financial measures. Investors and other
readers are encouraged to review the related GAAP financial measures and the reconciliations of the non-GAAP
measures to their most directly comparable U.S. GAAP measures set forth in the Appendix, and investors and other
readers should consider non-GAAP measures only as supplements to, and not as substitutes for or as superior
measures to, the measures of financial performance prepared in accordance with GAAP.
3

Tactile Medical Snapshot
+ Focused on treating chronic diseases at home
• Therapeutic focus on chronic swelling conditions
+ Q1 2019 revenue of $37.6M (↑40% YoY )
+ 2018 revenue of $143.8M (↑32% YoY); gross margin of
71%; profitable
+ 2019 revenue outlook of $180.0M-$182.5M, representing
revenue growth of 25%-27% YoY
+ Cost-effective, clinically differentiated products
• Flexitouch®
Plus and Entre™ systems (for lymphedema)
• Airwear Compression Wrap (for venous ulcerations)
+ Direct-to-patient and -provider model that disintermediates
durable medical equipment dealers (DMEs)
+ Significant infrastructure that is difficult to replicate
+ $4B+ addressable U.S. market opportunity
4
FLEXITOUCH® PLUS
ENTRETM AIRWEAR
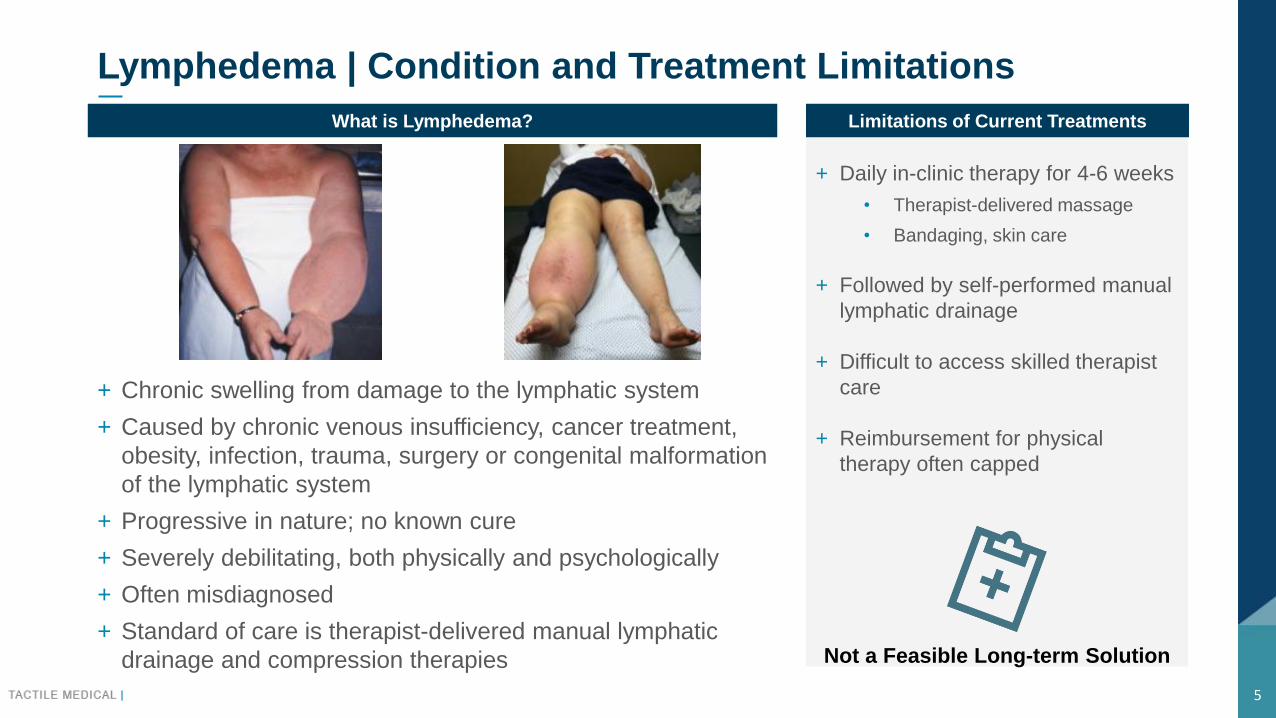
+ Daily in-clinic therapy for 4-6 weeks
• Therapist-delivered massage
• Bandaging, skin care
+ Followed by self-performed manual
lymphatic drainage
+ Difficult to access skilled therapist
care
+ Reimbursement for physical
therapy often capped
Lymphedema | Condition and Treatment Limitations
+ Chronic swelling from damage to the lymphatic system
+ Caused by chronic venous insufficiency, cancer treatment,
obesity, infection, trauma, surgery or congenital malformation
of the lymphatic system
+ Progressive in nature; no known cure
+ Severely debilitating, both physically and psychologically
+ Often misdiagnosed
+ Standard of care is therapist-delivered manual lymphatic
drainage and compression therapies
5
Not a Feasible Long-term Solution
What is Lymphedema? Limitations of Current Treatments
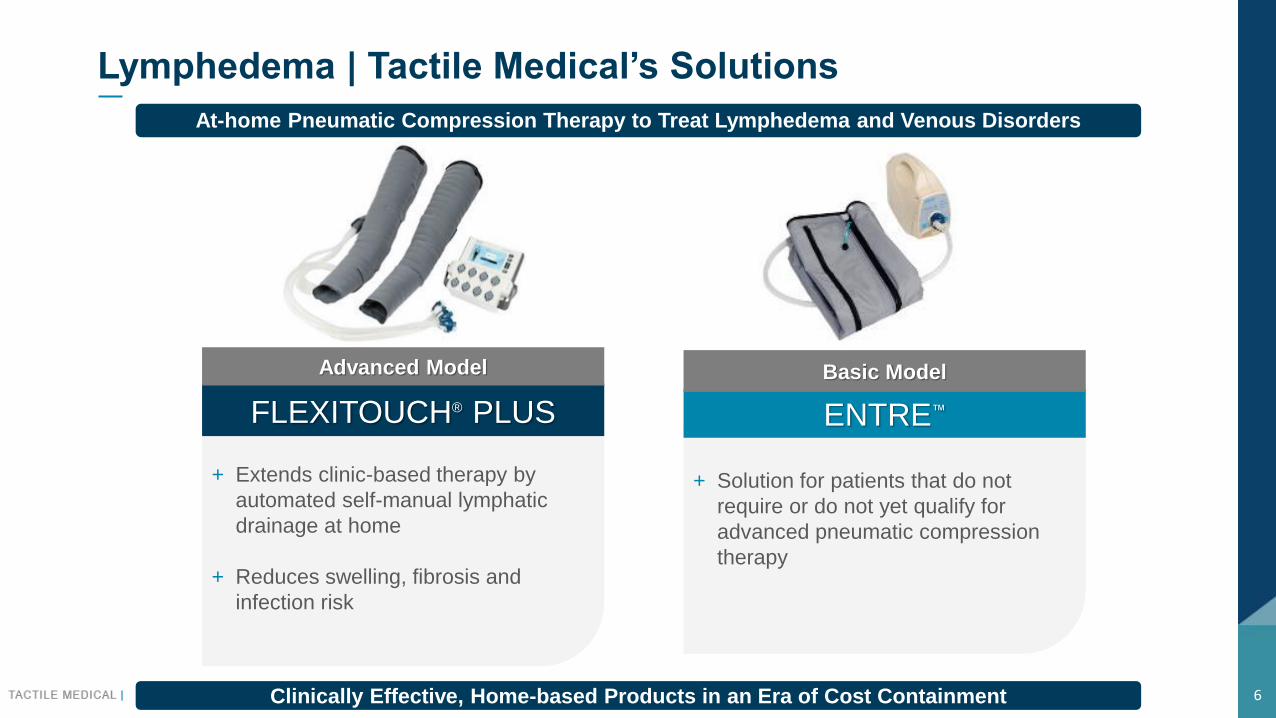
Lymphedema | Tactile Medical’s Solutions
6Clinically Effective, Home-based Products in an Era of Cost Containment
At-home Pneumatic Compression Therapy to Treat Lymphedema and Venous Disorders
FLEXITOUCH® PLUS
Advanced Model
ENTRE™
Basic Model
+ Solution for patients that do not
require or do not yet qualify for
advanced pneumatic compression
therapy
+ Extends clinic-based therapy by
automated self-manual lymphatic
drainage at home
+ Reduces swelling, fibrosis and
infection risk

Flexitouch Plus System
+ Programmable controller unit with 18 treatment settings
+ Up to 32 air chambers in the adjustable garments; treats the torso,
chest, arms, legs, head and neck
7Substantial Body of Clinical and Economic Outcome Data for Our Solutions
Overview
Clinically Proven Benefits
Mechanism + Stimulates the lymphatic system
Impact+ Reduces edema and lymphedema associated
with chronic venous insufficiency, cancer and
surgery/trauma
Benefits + Reduction of pain, improvement of skin integrity
Clinical Outcomes+ Improved clinical outcomes compared to basic
pneumatic compression devices
Patient Satisfaction + 90% rate and 95% treatment compliance

Significant, Growing Lymphedema Market Opportunity
8
$4B+
5+ million U.S.Prevalence
U.S. Patients Suffering from Lymphedema
U.S. Patients Diagnosed Annually
Addressable U.S. Market
Note: Addressable market opportunity assumes Flexitouch ASP multiplied by number of diagnosed patients in U.S. in TTM ending Dec2018. Claims data trails 6 months behind date of analysis.
Data Analysis of Claims As of:
700K
Jun2014
1.1M
Dec2018
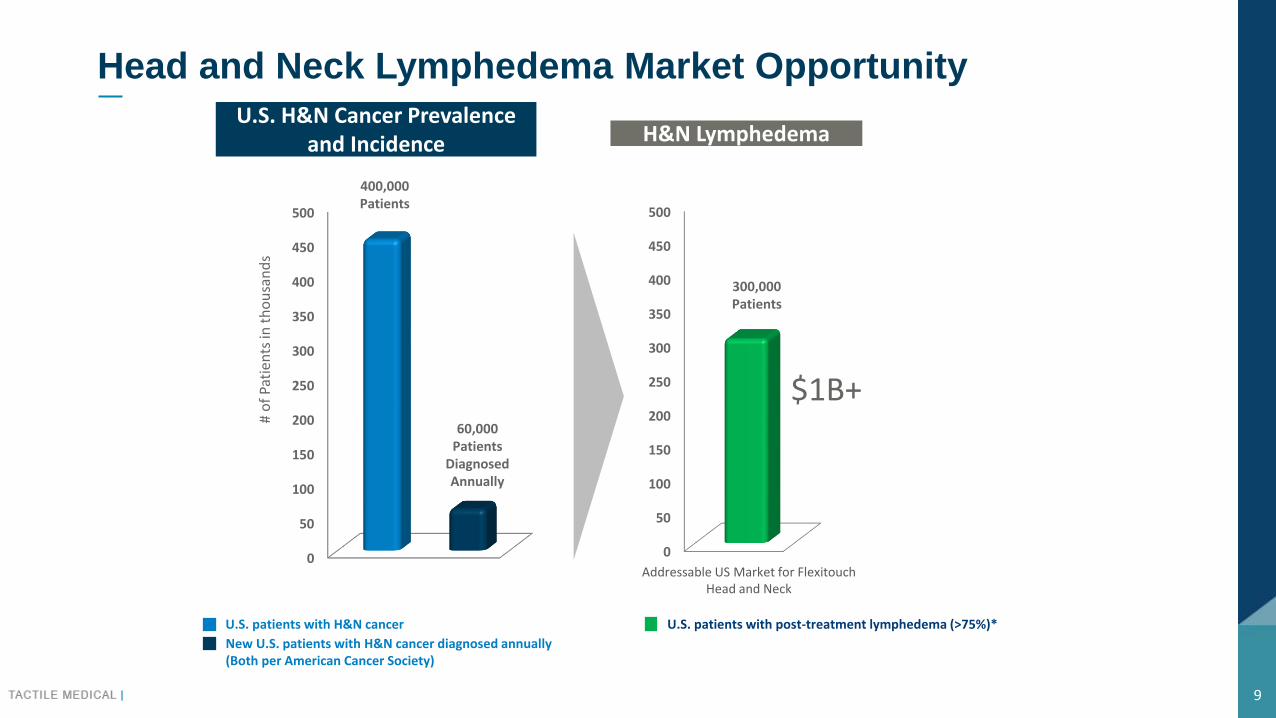
Head and Neck Lymphedema Market Opportunity
0
50
100
150
200
250
300
350
400
450
500
H&N Lymphedema
U.S. patients with post-treatment lymphedema (>75%)* U.S. patients with H&N cancer
400,000Patients
Addressable US Market for Flexitouch Head and Neck
300,000Patients
U.S. H&N Cancer Prevalence and Incidence
60,000Patients
Diagnosed Annually
# o
f Pa
tien
ts in
th
ou
san
ds
$1.4 B
0
50
100
150
200
250
300
350
400
450
500
$1B+
New U.S. patients with H&N cancer diagnosed annually (Both per American Cancer Society)
9

Venous Leg Ulcers | Condition and Treatment Limitations
+ Open wounds caused by tissue breakdown due to Chronic Venous
Insufficiency (CVI)
+ Debilitating physically and psychologically
+ 30-40% of VLUs not responsive to treatment > 6 months
+ Standard of care is compression therapy and multilayered bandages
10
What are Venous Leg Ulcers (VLUs)? Limitations of Current Treatments
+ Recurring trips to wound clinic over
months
+ Bandages are worn continuously
and reapplied weekly
+ Time-consuming and inconvenient
therapy
+ Limits daily activities
+ Inconsistent therapy due to
imprecise pressure
Costly and Burdensome Standard of Care

Airwear Compression Wrap
11
1. Alvarez O, et al. Effectiveness Of A Novel Static Pneumatic Gradient Compression Therapy Device (SPGC) For The Treatment Of Venous Leg
Ulcers (VLU) And Chronic Venous Insufficiency (CVI). Wound Care Therapies Supplement, Spring 2013
+ Adjustable air compression for patients with venous insufficiency, lymphedema and venous ulcerations
+ Designed to improve patient compliance
• Easy to apply – even at high levels of compression (40-50mmHg)
• No compression to “fight” at application (unlike stockings)
• Does not rely on patient strength to create compression (unlike most wraps)
• Calibrated for consistent application of therapeutic compression
+ Comparable performance to standard of care1
+ For all day use—discretely under clothes
Ease of Use + Comfort
Adherence to Therapy
Clinical Results
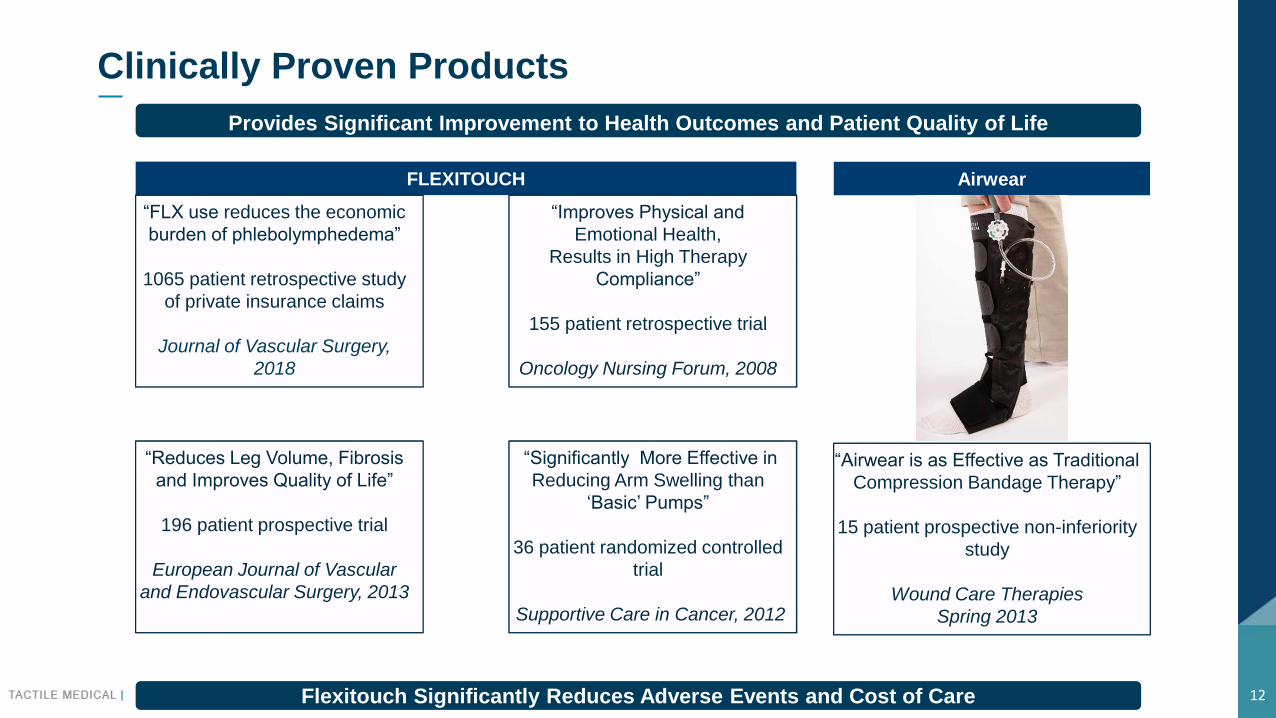
Clinically Proven Products
12Flexitouch Significantly Reduces Adverse Events and Cost of Care
Provides Significant Improvement to Health Outcomes and Patient Quality of Life
FLEXITOUCH
“Reduces Leg Volume, Fibrosis
and Improves Quality of Life”
196 patient prospective trial
European Journal of Vascular
and Endovascular Surgery, 2013
“Significantly More Effective in
Reducing Arm Swelling than
‘Basic’ Pumps”
36 patient randomized controlled
trial
Supportive Care in Cancer, 2012
“FLX use reduces the economic
burden of phlebolymphedema”
1065 patient retrospective study
of private insurance claims
Journal of Vascular Surgery,
2018
“Improves Physical and
Emotional Health,
Results in High Therapy
Compliance”
155 patient retrospective trial
Oncology Nursing Forum, 2008
Airwear
“Airwear is as Effective as Traditional
Compression Bandage Therapy”
15 patient prospective non-inferiority
study
Wound Care Therapies
Spring 2013

Groundbreaking Cost Effectiveness Study Published
13First of its Kind Evidence of Cost Benefits
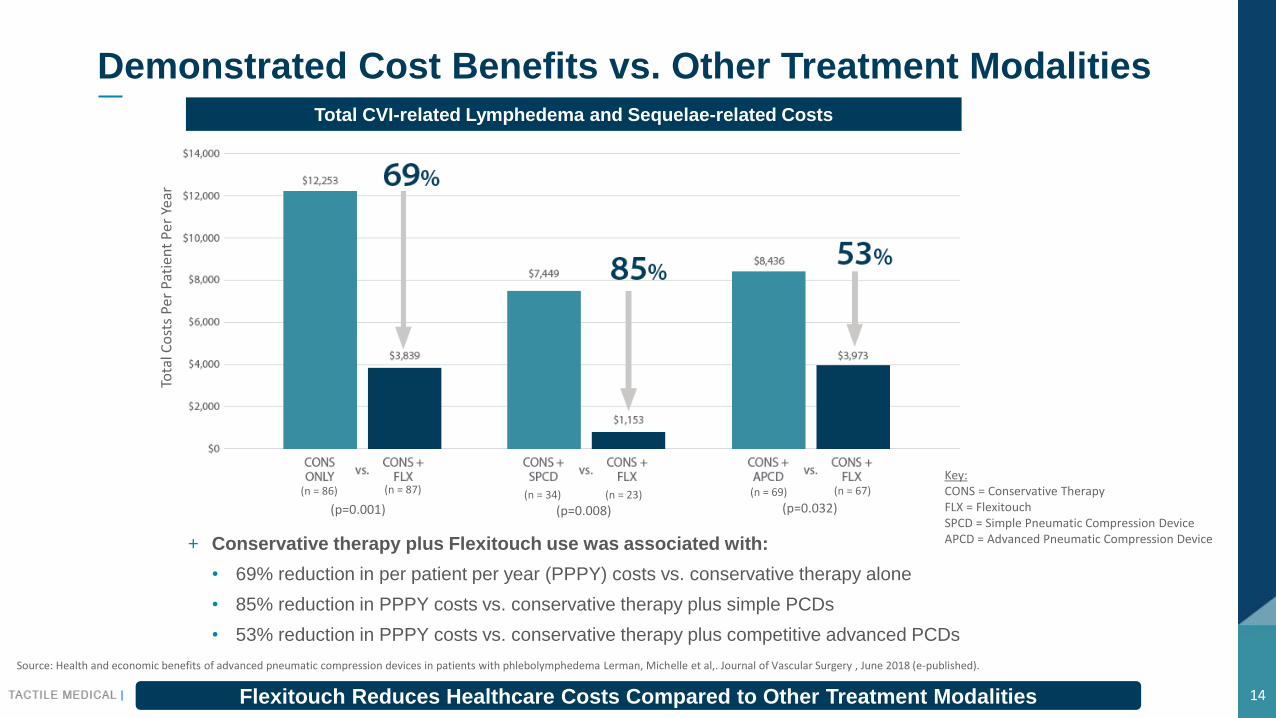
Demonstrated Cost Benefits vs. Other Treatment Modalities
14
+ Conservative therapy plus Flexitouch use was associated with:
• 69% reduction in per patient per year (PPPY) costs vs. conservative therapy alone
• 85% reduction in PPPY costs vs. conservative therapy plus simple PCDs
• 53% reduction in PPPY costs vs. conservative therapy plus competitive advanced PCDs
Total CVI-related Lymphedema and Sequelae-related Costs
Key:CONS = Conservative TherapyFLX = FlexitouchSPCD = Simple Pneumatic Compression DeviceAPCD = Advanced Pneumatic Compression Device
Source: Health and economic benefits of advanced pneumatic compression devices in patients with phlebolymphedema Lerman, Michelle et al,. Journal of Vascular Surgery , June 2018 (e-published).
(p=0.001) (p=0.008) (p=0.032)
(n = 86) (n = 87) (n = 34) (n = 23) (n = 69) (n = 67)
Tota
l Co
sts
Per
Pati
ent
Per
Year
Flexitouch Reduces Healthcare Costs Compared to Other Treatment Modalities
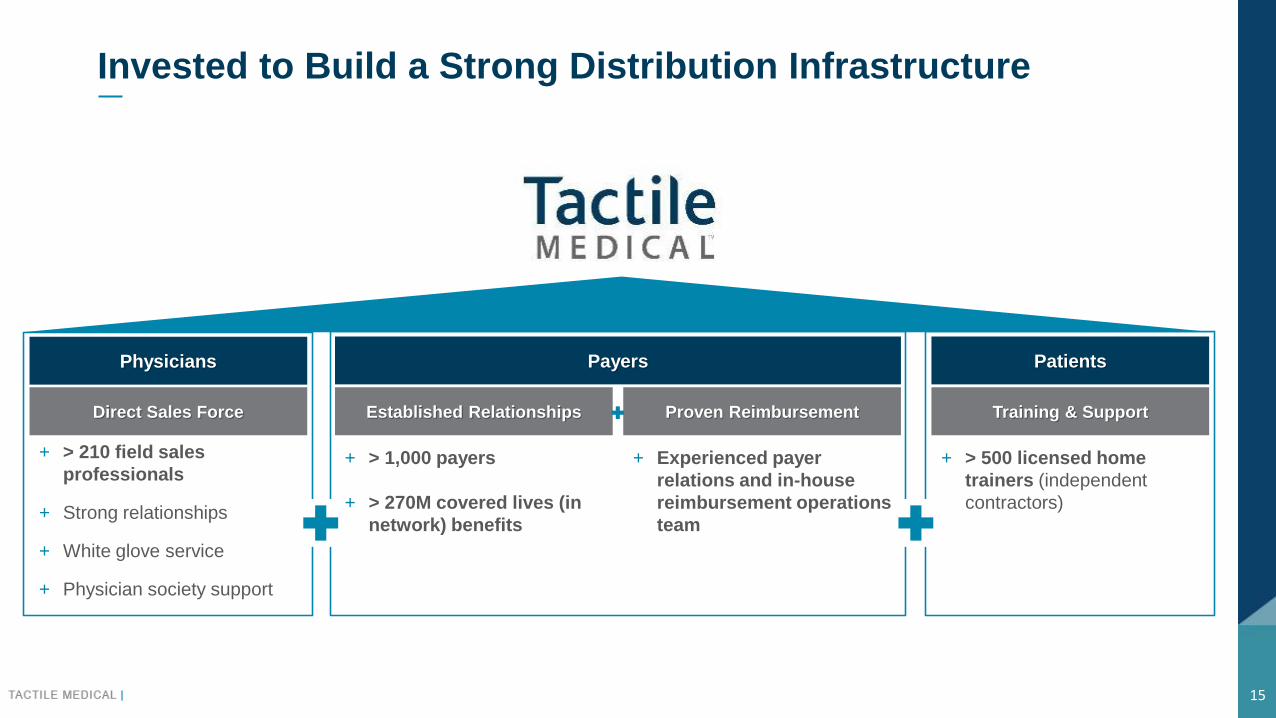
Invested to Build a Strong Distribution Infrastructure
+ > 210 field sales
professionals
+ Strong relationships
+ White glove service
+ Physician society support
15
Direct Sales Force
Physicians
+ > 500 licensed home
trainers (independent
contractors)
Training & Support
Patients
+ > 1,000 payers
+ > 270M covered lives (in
network) benefits
Established Relationships
Payers
Proven Reimbursement
+ Experienced payer
relations and in-house
reimbursement operations
team

Differentiated Distribution Model
+ Model bypasses conventional DMEs channel
• Bill and collect directly from payers and patients (co-pay)
• Appeal denials, advocate for patient
+ > 210 field sales professionals
• Control of clinical call point; message, service, workload
+ Network of > 500 independent licensed professional home
trainers
16Disruptive Model Fuels Gross Margin Profile, Provides Market Insights
Overview of Direct Sales Platform Target Call Points
+ Call points
• Lymphedema clinics
• Vascular and venous care clinics
• Wound care clinics, podiatrists
• VA hospitals
+ Deep relationships with physicians, nurses and therapists
Patient
$3
Traditional Medical Device
Delivery Channel
Patient
2
DMEs1
2
Manufacturer
1$
$$
Tactile
1
1 Durable Medical Equipment dealers (DMEs)

Operational Excellence in Reimbursement and Payer Relations
+ In-house reimbursement operations group
• Streamlined process — initial order to final bill
• Insurance verification and authorization
• Billing and collections
• Customer support services
+ Payer Relations group
• Health plan, DME and clinical backgrounds
• Payer messaging, coverage policies, contracting
• Develop relationships and coverage policies with
payers
• Manage Medicare strategy and patient claims
• Advocacy liaison
17
Strategic Expertise and Operational Proficiency High Payer Approval Rates
90%+
88%
0% 25% 50% 75% 100%
Ap
pro
va
l R
ate
(s
ince
20
07
)
Commercial Payers Medicare
85+% Approval Rate

Competitive Positioning
18Tactile Medical Is Exceptionally Well-Positioned
Others:
Devon Medical,
NormaTec
HQ
Business Presence United States United StatesUnited States &
OUSUnited States OUS
OwnershipPublic
(Nasdaq: TCMD)
Family
Owned
Israeli
Co-op
Privately
Owned
Public
(OM: ARJO B)
Direct Sales Channel - - - -Clinical & Economic
Benefits Proven - - - -Automated Self
Lymphatic Drainage - - - -Reimbursement
Expertise - - - -Note: Outside United States (OUS)
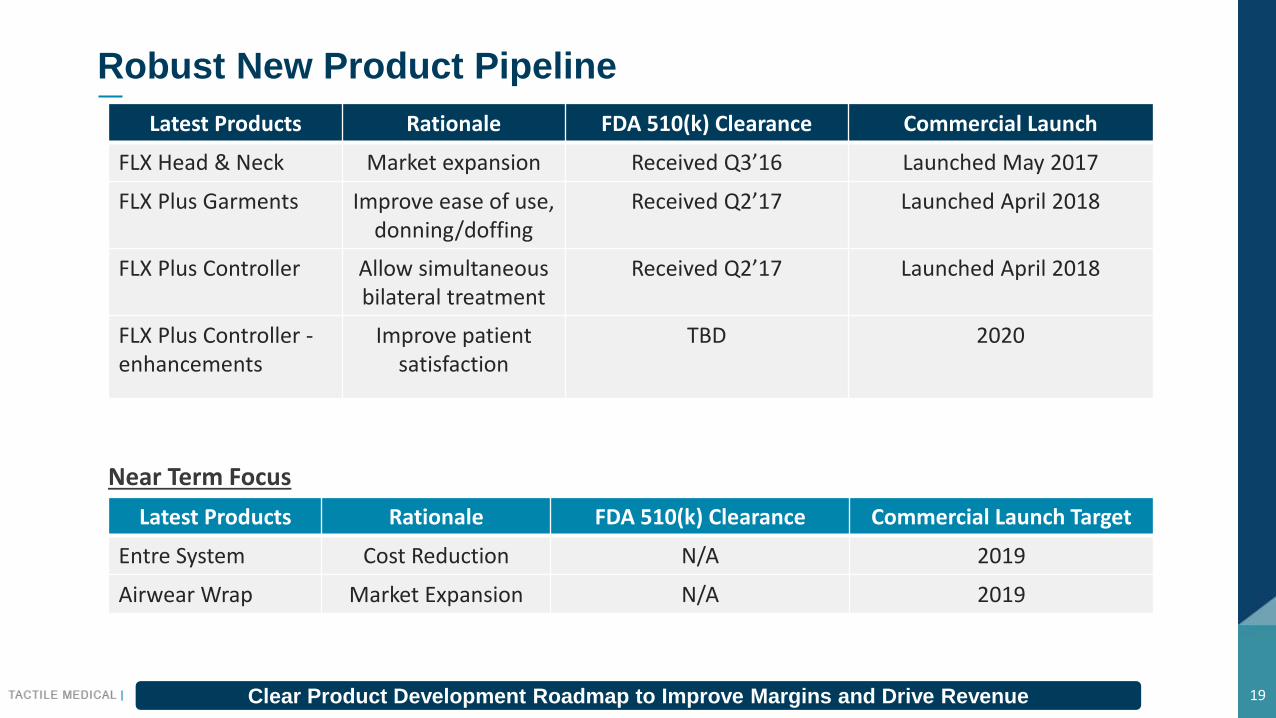
Robust New Product Pipeline
Clear Product Development Roadmap to Improve Margins and Drive Revenue 19
Latest Products Rationale FDA 510(k) Clearance Commercial Launch
FLX Head & Neck Market expansion Received Q3’16 Launched May 2017
FLX Plus Garments Improve ease of use, donning/doffing
Received Q2’17 Launched April 2018
FLX Plus Controller Allow simultaneous bilateral treatment
Received Q2’17 Launched April 2018
FLX Plus Controller -enhancements
Improve patient satisfaction
TBD 2020
Near Term Focus
Latest Products Rationale FDA 510(k) Clearance Commercial Launch Target
Entre System Cost Reduction N/A 2019
Airwear Wrap Market Expansion N/A 2019
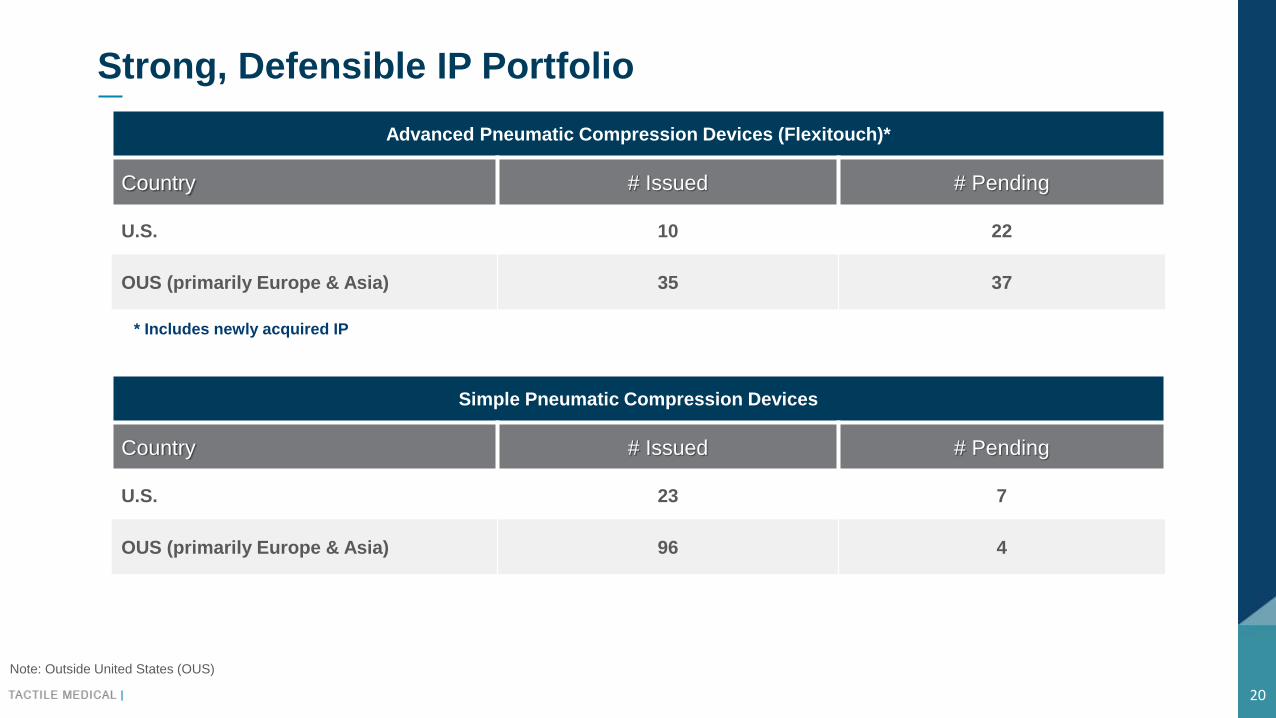
Strong, Defensible IP Portfolio
20
Simple Pneumatic Compression Devices
Country # Issued # Pending
U.S. 23 7
OUS (primarily Europe & Asia) 96 4
Note: Outside United States (OUS)
Advanced Pneumatic Compression Devices (Flexitouch)*
Country # Issued # Pending
U.S. 10 22
OUS (primarily Europe & Asia) 35 37
* Includes newly acquired IP
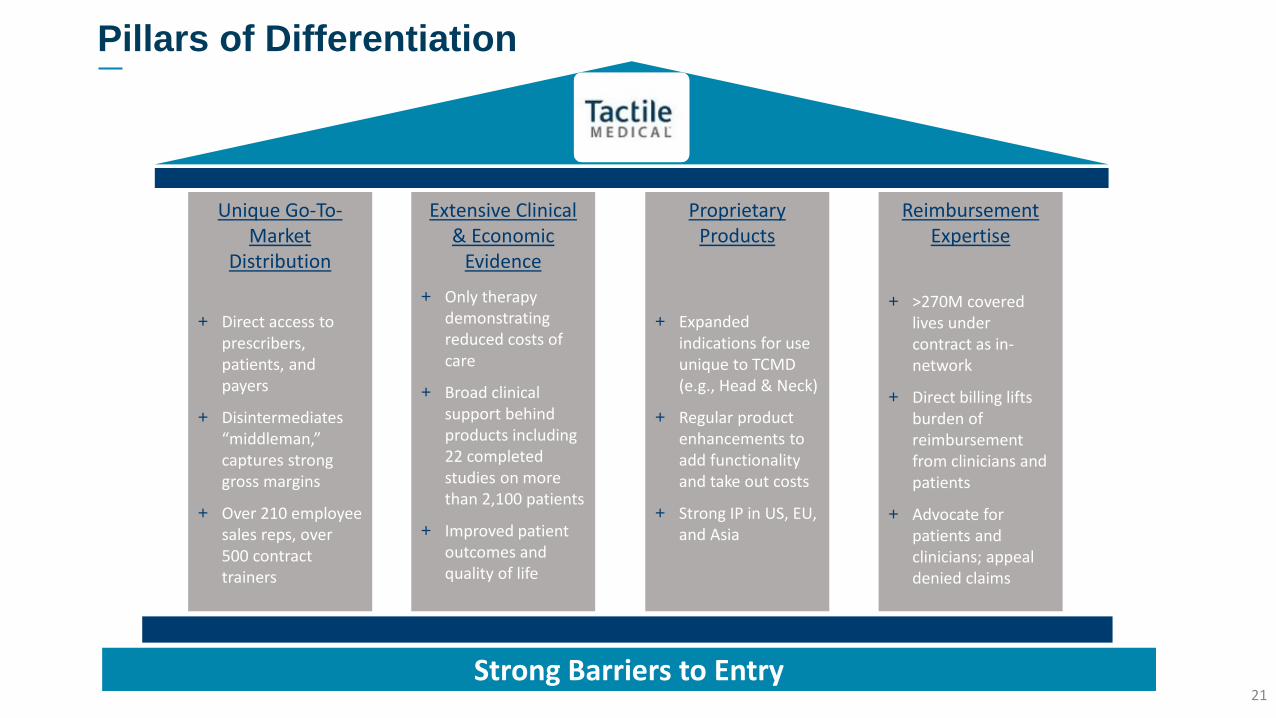
21Strong Barriers to Entry
Unique Go-To-Market
Distribution
+ Direct access to prescribers, patients, and payers
+ Disintermediates “middleman,” captures strong gross margins
+ Over 210 employee sales reps, over 500 contract trainers
Extensive Clinical & Economic
Evidence
+ Only therapy demonstrating reduced costs of care
+ Broad clinical support behind products including 22 completed studies on more than 2,100 patients
+ Improved patient outcomes and quality of life
Proprietary Products
+ Expanded indications for use unique to TCMD (e.g., Head & Neck)
+ Regular product enhancements to add functionality and take out costs
+ Strong IP in US, EU, and Asia
Reimbursement Expertise
+ >270M covered lives under contract as in-network
+ Direct billing lifts burden of reimbursement from clinicians and patients
+ Advocate for patients and clinicians; appeal denied claims
Pillars of Differentiation
21
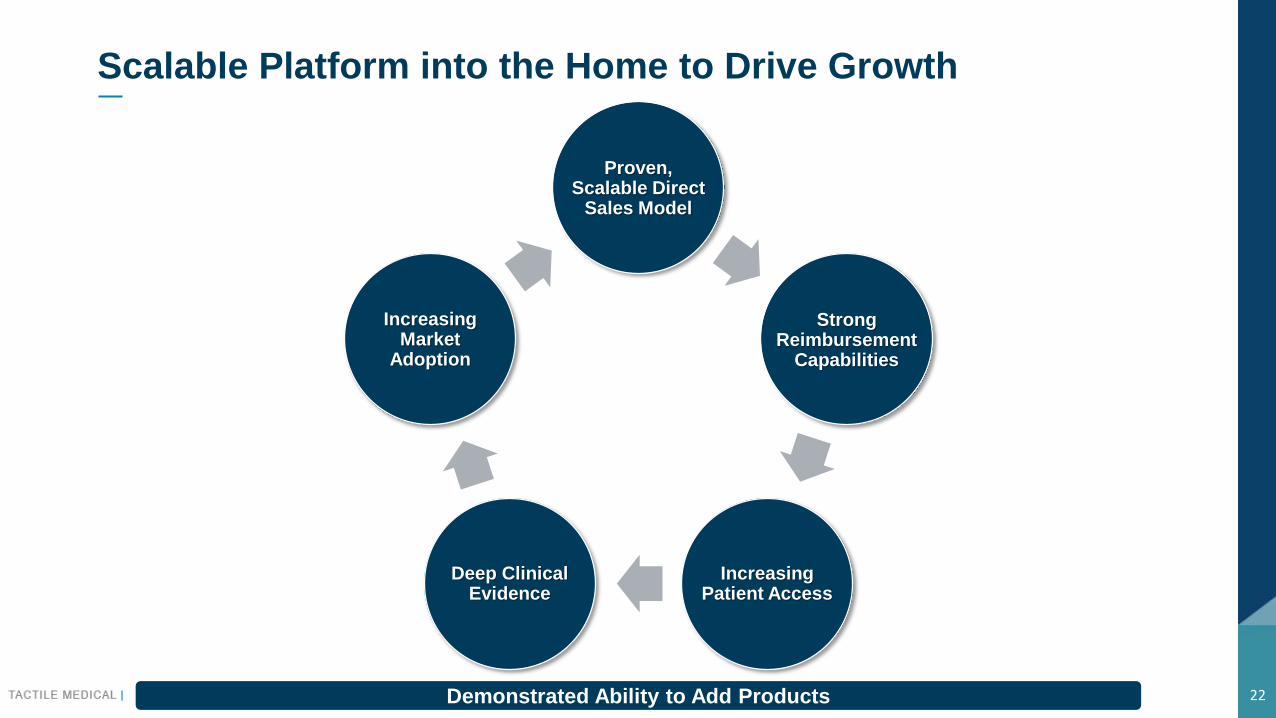
Scalable Platform into the Home to Drive Growth
22Demonstrated Ability to Add Products
Proven, Scalable Direct
Sales Model
Strong Reimbursement
Capabilities
Increasing Patient Access
Deep Clinical Evidence
Increasing Market
Adoption

Accomplished Management Team
23
JERRY MATTYS
Chief Executive Officer
BOB FOLKES
Chief Operating Officer
BRENT MOEN
Chief Financial Officer
BRYAN RISHE
Senior Vice President,
Sales
MAGGIE THOMPSON
Senior Vice President,
Reimbursement and
Payer Relations
DARIN OENNING
Vice President,
Business Development
DARREN WENNEN
Vice President,
Marketing and Clinical
Affairs
SUNDAY HOY
Vice President and
Compliance Officer
MARK ALDRIDGE
Vice President,
Operations
Vice President,
Quality and Regulatory
Affairs
BRETT DEMCHUK
JULEEN KRINGS
Chief Human
Resources Officer
Chief Information
Officer
PETER SCHAUBACH
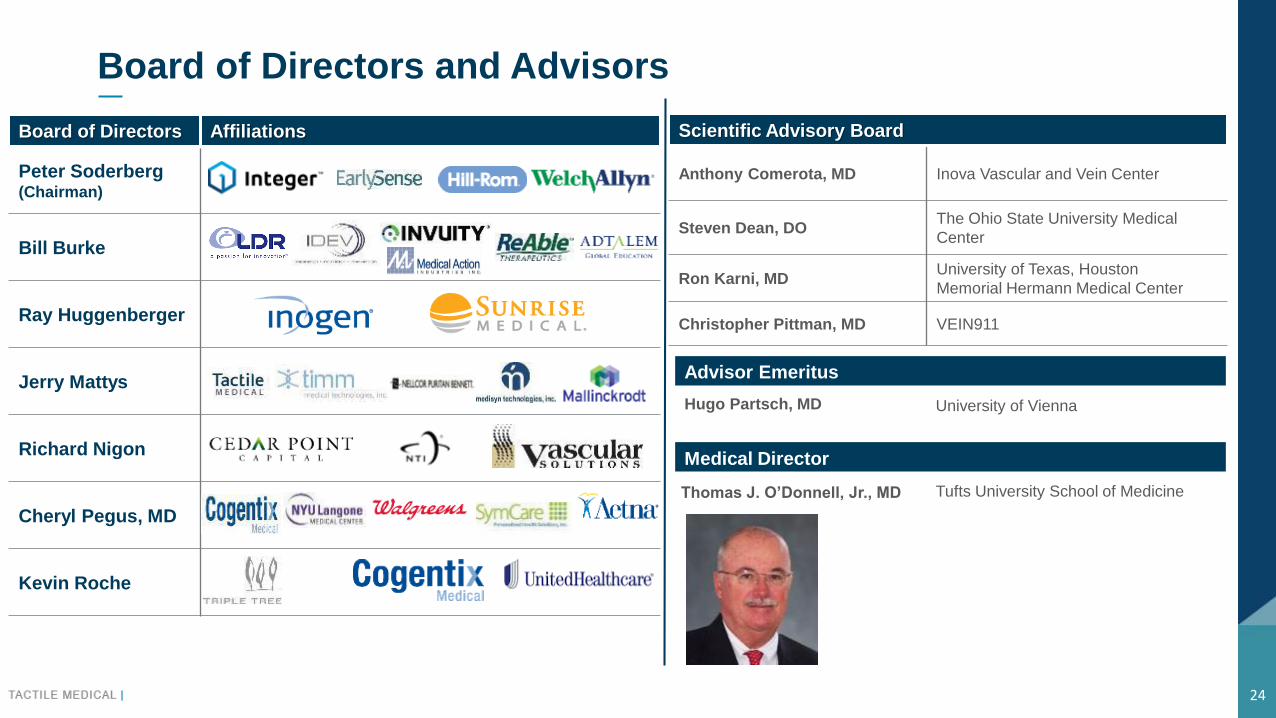
Board of Directors and Advisors
Board of Directors Affiliations
Peter Soderberg(Chairman)
Bill Burke
Ray Huggenberger
Jerry Mattys
Richard Nigon
Cheryl Pegus, MD
Kevin Roche
Thomas J. O’Donnell, Jr., MD Tufts University School of Medicine
Medical Director
Advisor Emeritus
Scientific Advisory Board
Anthony Comerota, MD Inova Vascular and Vein Center
Steven Dean, DOThe Ohio State University Medical
Center
Ron Karni, MDUniversity of Texas, Houston
Memorial Hermann Medical Center
Christopher Pittman, MD VEIN911
Hugo Partsch, MD University of Vienna
24

FINANCIAL OVERVIEW

Annual Revenues
+ Field team expansion
+ New product introductions
+ Expanding call points / VA
+ Increased number of payer
contracts
$37.2
$47.7
$62.9
$84.5
$109.3
$143.8
$0
$20
$40
$60
$80
$100
$120
$140
$160
2013 2014 2015 2016 2017 2018
Growth Drivers
51Field
Headcount 66 91 131
($M)
26
>160 >200

Quarterly Revenues
27Seasonality Driven by Copays/Deductibles
$10.1
$14.8
$16.8
$21.3
$13.7
$19.7
$22.6
$28.5
$19.9
$26.3
$28.3
$34.9
$26.8
$34.1
$36.3
$46.4
$37.6
$0
$5
$10
$15
$20
$25
$30
$35
$40
$45
$50
Q1 Q2 Q3 Q4 Q1 Q2 Q3 Q4 Q1 Q2 Q3 Q4 Q1 Q2 Q3 Q4 Q1
2015 2016 2017 2018 2019
($M)
*Adoption of ASC 842 added 10 percentage points to Q1’19 y/y total revenue growth
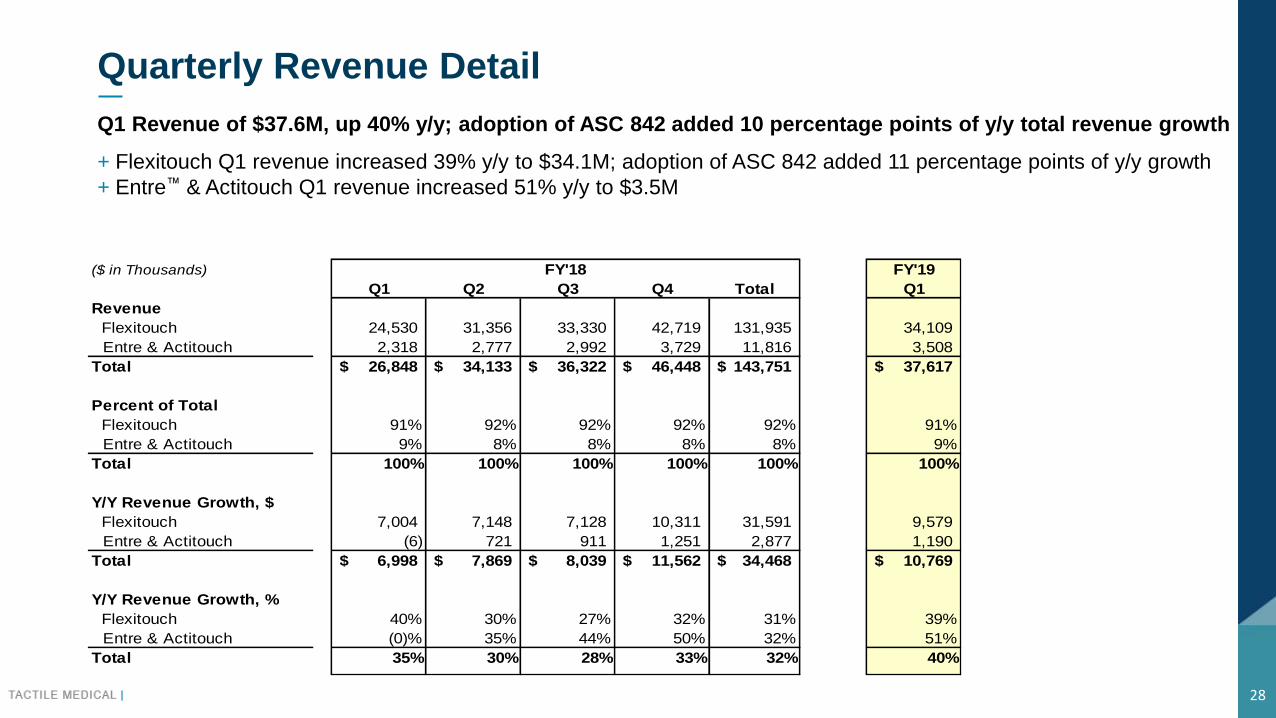
Quarterly Revenue Detail
Q1 Revenue of $37.6M, up 40% y/y; adoption of ASC 842 added 10 percentage points of y/y total revenue growth
+ Flexitouch Q1 revenue increased 39% y/y to $34.1M; adoption of ASC 842 added 11 percentage points of y/y growth
+ Entre™ & Actitouch Q1 revenue increased 51% y/y to $3.5M
28
($ in Thousands) FY'19
Q1 Q2 Q3 Q4 Total Q1
Revenue
Flexitouch 24,530 31,356 33,330 42,719 131,935 34,109
Entre & Actitouch 2,318 2,777 2,992 3,729 11,816 3,508
Total 26,848$ 34,133$ 36,322$ 46,448$ 143,751$ 37,617$
Percent of Total
Flexitouch 91% 92% 92% 92% 92% 91%
Entre & Actitouch 9% 8% 8% 8% 8% 9%
Total 100% 100% 100% 100% 100% 100%
Y/Y Revenue Growth, $
Flexitouch 7,004 7,148 7,128 10,311 31,591 9,579
Entre & Actitouch (6) 721 911 1,251 2,877 1,190
Total 6,998$ 7,869$ 8,039$ 11,562$ 34,468$ 10,769$
Y/Y Revenue Growth, %
Flexitouch 40% 30% 27% 32% 31% 39%
Entre & Actitouch (0)% 35% 44% 50% 32% 51%
Total 35% 30% 28% 33% 32% 40%
FY'18
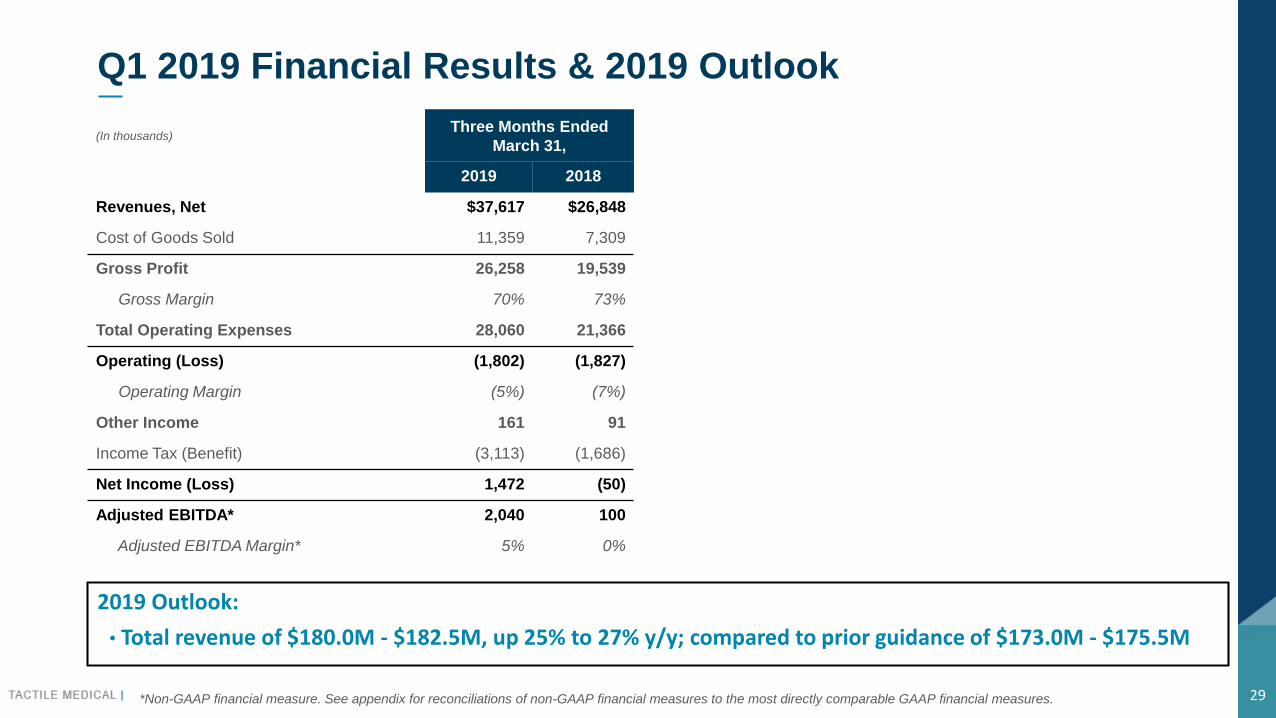
Q1 2019 Financial Results & 2019 Outlook
29*Non-GAAP financial measure. See appendix for reconciliations of non-GAAP financial measures to the most directly comparable GAAP financial measures.
(In thousands)Three Months Ended
March 31,
2019 2018
Revenues, Net $37,617 $26,848
Cost of Goods Sold 11,359 7,309
Gross Profit 26,258 19,539
Gross Margin 70% 73%
Total Operating Expenses 28,060 21,366
Operating (Loss) (1,802) (1,827)
Operating Margin (5%) (7%)
Other Income 161 91
Income Tax (Benefit) (3,113) (1,686)
Net Income (Loss) 1,472 (50)
Adjusted EBITDA* 2,040 100
Adjusted EBITDA Margin* 5% 0%
2019 Outlook:
• Total revenue of $180.0M - $182.5M, up 25% to 27% y/y; compared to prior guidance of $173.0M - $175.5M

Balance Sheet Summary
30Strong Balance Sheet
(In thousands)March 31,
2019
December 31,
2018
December 31,
2017
Cash, Cash Equivalents, Marketable Securities $44,932 $45,885 $43,912
Working Capital $68,466 $68,885 $62,353
Total Assets $113,517 $107,071 $88,447
Total Debt − − −
Retained Earnings $11,177 $9,705 $3,082
Total Stockholders’ Equity $91,999 $89,270 $72,787
• $10M (with $25M accordion) credit facility in place with Wells Fargo Bank, N.A.

Reconciliation of GAAP Net Income to Non-GAAP Adjusted EBITDA
31
(In thousands)
Net Income (Loss) $ 1,472 $ (50)
Interest income, net (98) (108)
Income tax (benefit) / expense (3,113) (1,686)
Depreciation and amortization 996 463
Stock-based compensation expense 2,783 1,481
Adjusted EBITDA $ 2,040 $ 100
Net Income (Loss) Margin 3.9% (0.2)%
Interest income, net (0.3)% (0.4)%
Income tax (benefit) / expense (8.3)% (6.3)%
Depreciation and amortization 2.6% 1.7%
Stock-based compensation expense 7.4% 5.5%
Adjusted EBITDA Margin 5.4% 0.4%
Three Months Ended March 31,
2019 2018
Three Months Ended March 31,
2019 2018

Growth Strategy
Further Penetrate U.S. Market
Expand Salesforce | Leverage Clinical Data | Target New Call Points
Improve Clinical & Economic Outcomes Data to Expand Reimbursement
Grow Clinical Support | Opinion Leader and Society Support | Expand Reimbursement Coverage
Expand Indications and Introduce New Features and Products
Expand Addressable Patient Population | Enter New Clinical Adjacencies | New Garments
Build Awareness and Disease Recognition
Educate Physicians and Therapists | Establish Practice Guidelines
Launch Internationally
Seeking CE Mark for Products | Enter Distributor Partnerships Abroad
32
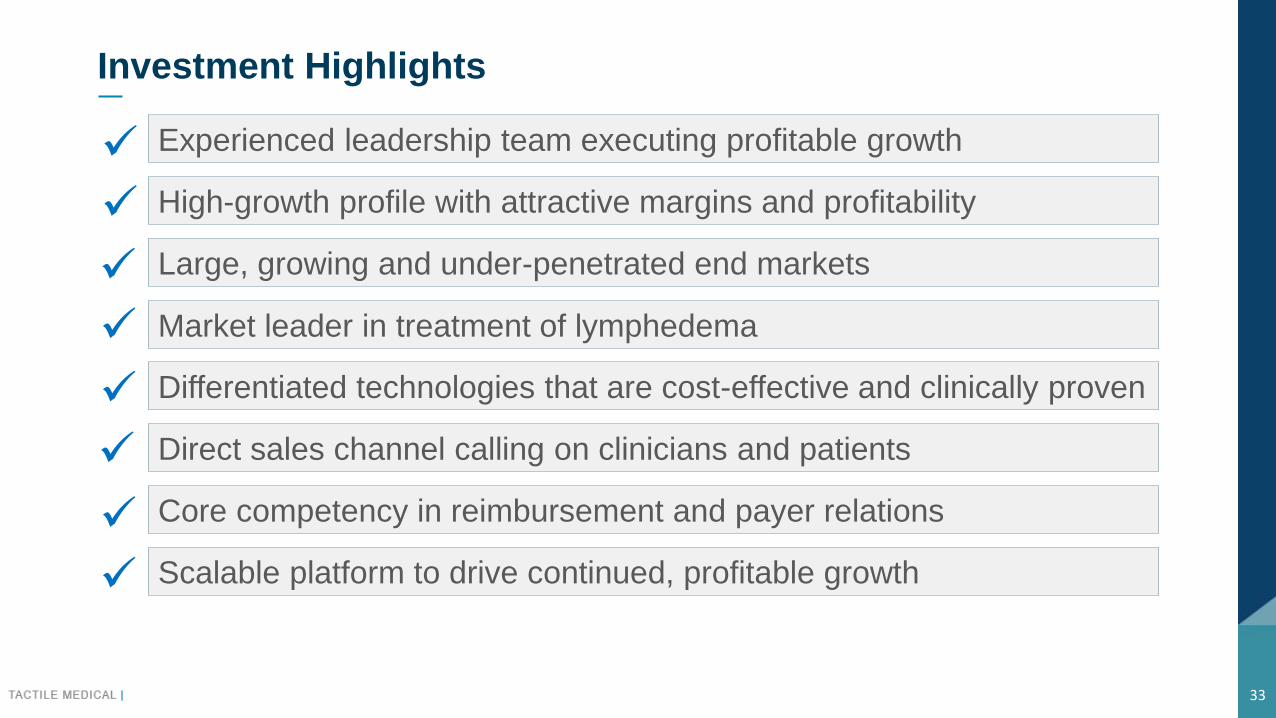
Investment Highlights
Experienced leadership team executing profitable growth
High-growth profile with attractive margins and profitability
Large, growing and under-penetrated end markets
Market leader in treatment of lymphedema
Differentiated technologies that are cost-effective and clinically proven
Direct sales channel calling on clinicians and patients
Core competency in reimbursement and payer relations
Scalable platform to drive continued, profitable growth
33

+ 1331 TYLER STREET NE, SUITE 200 MPLS, MN 55413
+ WWW.TACTILEMEDICAL.COM
+ 612.355.5100