Investor Presentation - SMFGGroup structure (Apr. 2003) Daiwa Securities SMBC Daiwa Securities Group...
51
Investor Presentation Koichi Miyata, President Sumitomo Mitsui Financial Group, Inc. February & March, 2013
Transcript of Investor Presentation - SMFGGroup structure (Apr. 2003) Daiwa Securities SMBC Daiwa Securities Group...

Investor Presentation
Koichi Miyata, PresidentSumitomo Mitsui Financial Group, Inc.
February & March, 2013

1
Today’s Agenda
1. Overview of SMFG
2. Our strengths
3. Growth strategy
4. In closing

2
Japan Research Japan Research InstituteInstitute
SMBC Friend SecuritiesSMBC Friend Securities
100%
100%
40%
(Leasing)
(System engineering andmanagement consulting)
SMSMBCBC Leasing Leasing
(Securities services)
(Consumer finance)
1. Overview of SMFGGroup structure (Apr. 2003)
Daiwa Securities SMBCDaiwa Securities SMBC Daiwa SecuritiesDaiwa SecuritiesGroup Inc.Group Inc.
60%
100%
Sumitomo Mitsui Financial Group
2,184
FY3/03
Sumitomo Mitsui Banking Corporation
423
Consolidated gross profit andvariance with SMBC non-consolidated
(JPY bn)
100%
Sumitomo Mitsui CardSumitomo Mitsui Card
19%
composition of group companies
SMFG was formed Dec. 2002
44%

3
2,5952,184
1,372
FY3/03 FY3/12 1H,FY3/13
Sumitomo Mitsui Financial Group40%
Japan Research Japan Research InstituteInstitute
SMBC Friend SecuritiesSMBC Friend Securities
SMBC Consumer SMBC Consumer FinanceFinance
34%
100%
60%
100%
100%
100%
Sumitomo Sumitomo CorporationCorporation
NTT DOCOMONTT DOCOMO
(Leasing)
(System engineering andmanagement consulting)
100%
1. Overview of SMFG Group structure (Feb. 2013)
(Securities services)
(Consumer finance)100%
Sumitomo Mitsui Banking Corporation
SMFG Card & CreditSMFG Card & Credit
Sumitomo Mitsui Sumitomo Mitsui CardCard
CedynaCedyna
66%
100%
SMBC Nikko SecuritiesSMBC Nikko Securities
SMBC Aviation SMBC Aviation CapitalCapital
60%30%
10%
Sumitomo Mitsui Sumitomo Mitsui Finance and Leasing Finance and Leasing
423 585
1,062
Consolidated gross profit andvariance with SMBC non-consolidated
(JPY bn)
19%
43%41%
composition of group companies
4
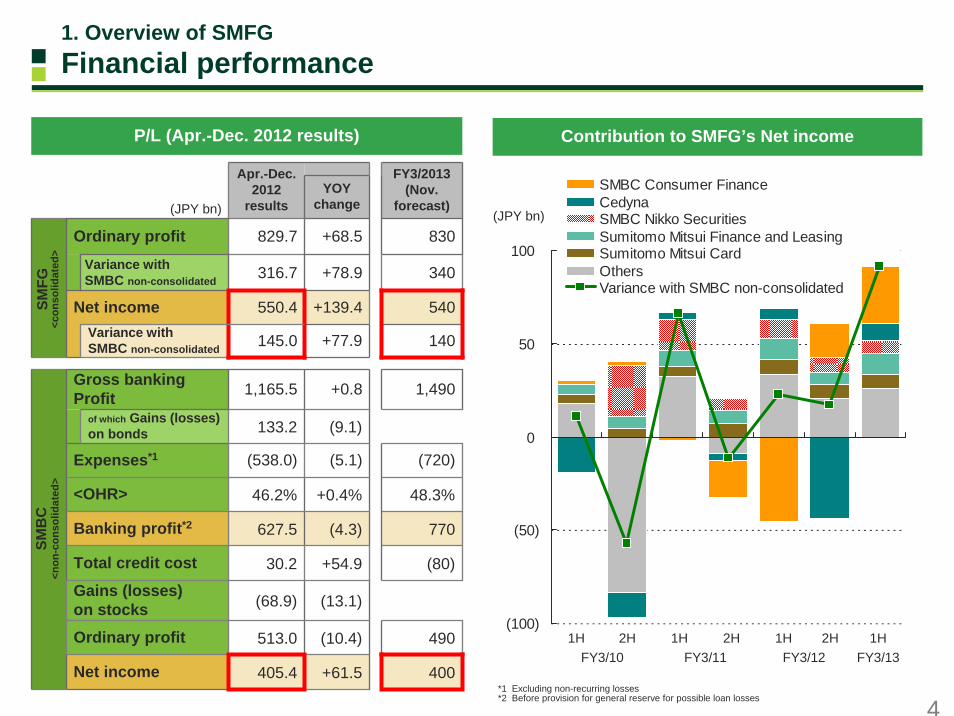
1. Overview of SMFGFinancial performance
P/L (Apr.-Dec. 2012 results)
*1 Excluding non-recurring losses *2 Before provision for general reserve for possible loan losses
(JPY bn)
Apr.-Dec. 2012
resultsYOY
change
FY3/2013(Nov.
forecast)
+68.5 830
340
540Variance withSMBC non-consolidated 140
1,490
(720)
<OHR> 46.2% +0.4% 48.3%
Ordinary profit 513.0 (10.4) 490
Net income 405.4 +61.5 400
Banking profit*2 627.5 (4.3) 770
Total credit cost 30.2 +54.9 (80)
Gains (losses)on stocks (68.9) (13.1)
+78.9
+139.4
+77.9
+0.8
of which Gains (losses) on bonds 133.2 (9.1)
Expenses*1 (538.0) (5.1)
Ordinary profit 829.7
Variance withSMBC non-consolidated 316.7
Gross banking Profit 1,165.5
Net income 550.4
145.0
SMB
C<n
on-c
onso
lidat
ed>
SMFG
<con
solid
ated
>
Contribution to SMFG’s Net income
(100)
(50)
0
50
100
SMBC Consumer FinanceCedynaSMBC Nikko SecuritiesSumitomo Mitsui Finance and LeasingSumitomo Mitsui CardOthersVariance with SMBC non-consolidated
FY3/121H2H
FY3/111H2H 2H
FY3/101H
FY3/131H
(JPY bn)

5
1. Overview of SMFGBalance sheet and Core Tier I ratio on a SMFG’s consolidated basis
B/S (as of Sep. 2012) Core Tier I ratio*1Basel III fully loaded basis*2
above 6%
8%
0%
2%
4%
6%
8%
10%
Mar. 11 Sep. 12 Mar. 14E
7%
4.5%(minimum level)
Minimum requirement in 2019(at full implementation)
2.5%(capital conservation
buffer)
*1 Pro forma. Common Equity Tier 1 ratio under Basel III *2 Regulatory adjustments are fully deducted
Loans:
JPY 61.7tn
Deposits, Negotiable certificates
of deposit (NCD):
JPY 94.2tnSecurities:
JPY 39.7tn
Other liabilities:JPY 37.9tn
Other assets:JPY 38.0tn
Total net assets:JPY 7.3tn
JGB:JPY 28.2tn
Total assets : JPY 139.4tnTotal assets : JPY 139.4tn
Total stockholders’ equity:JPY 5.2tn
Balance sheet related items
Sep.30, 2012Loan to deposit ratio 65.5%
Risk-weighted assets JPY 49.3 tn
Net assets per share JPY 3,966.30
ROE(Denominator: Total stockholders’ equity) 12.8%
Tier I ratio 13.18%
Dec. 2012: nearly 8%

6
0 10 20 30 40(Trillions of yen)
Mar. 31, 2010Mar. 31, 2011Mar. 31, 2012Sep. 30, 2012
1. Overview of SMFGCorporate, Sovereign and Bank Exposures on a SMFG’s consolidated basis
010203040(Trillions of yen)
OverseasDomestic
1-3(Very high - Satisfactory)
4-6(Likely - Currently no problem)
7 (excl. 7R)(Borrowers requiring caution)
Default (7R, 8-10)
Japanese Government, etc.
Others
JPY 74.2 trillion
PD LGD Risk weight
0.15% 30.68% 17.36%
3.49% 15.69% 41.61%
22.70% 22.15% 117.08%
100.00% 67.80% 46.44%
- - -
1.95% 33.23% 79.99%50.64%37.46%1.06%
0.03%35.22%0.00%
13.61%49.46%100.00%
116.58%28.16%12.28%
42.08%29.90%0.75%
16.75%34.92%0.07%
Risk weight
LGDPD
50.64%37.46%1.06%
0.03%35.22%0.00%
13.61%49.46%100.00%
116.58%28.16%12.28%
42.08%29.90%0.75%
16.75%34.92%0.07%
Risk weight
LGDPD
<As of Sep. 30, 2012> <As of Sep. 30, 2012>
Total(As of Sep.30, 2012)
JPY 25.2 trillion
Internal Rating(Certainty of debt repayment)

7
1.50%
1.13%
1.22%
1.0%
1.2%
1.4%
SMFG MUFG Mizuho FG
*1 Based on each company’s disclosure. *2 The figures shown in the graph are: non-consolidated figures of SMBC for SMFG, non-consolidated figures of The Bank of Tokyo-Mitsubishi UFJ for MUFG, * and sum of non-consolidated figures of Mizuho Bank and Mizuho Corporate Bank for Mizuho FG
0%
Domestic loan-to-deposit spread (1H, FY3/2013)*1,2
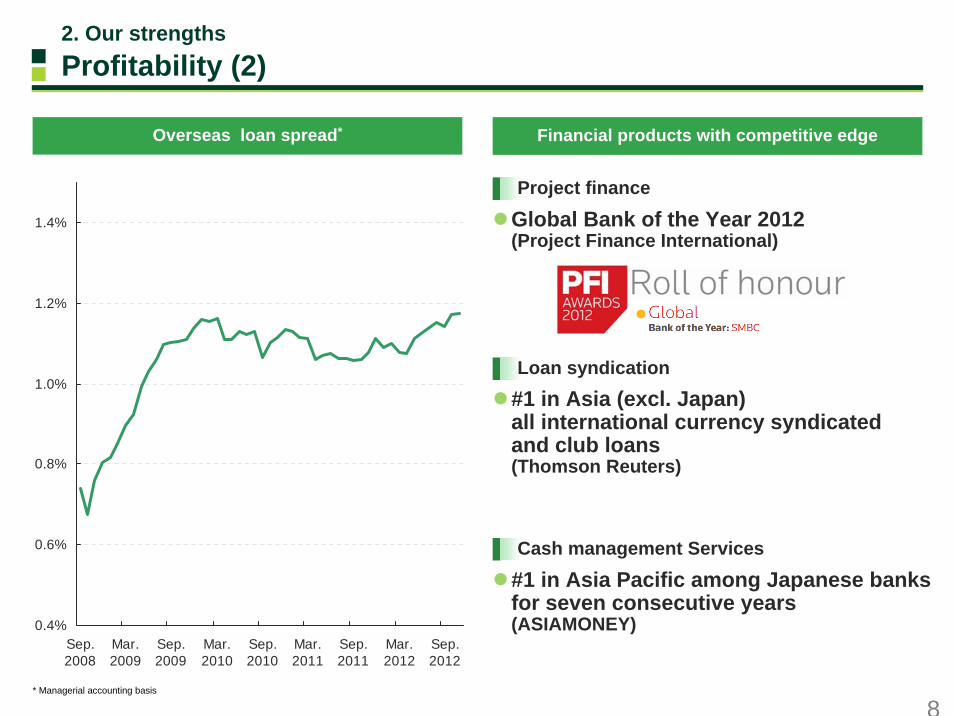
2. Our strengthsProfitability (1)
Composition of SMBC’s domestic loans(as of Sep. 2012)
*Proportion of loans to individuals & SMEs*2
MUFG: 61.1%, Mizuho FG: 59.0%
38.6%
29.0%
32.4%
71.0%
IndividualsLarge corporationsand
government etc.
SMEs
8
Financial products with competitive edge
2. Our strengthsProfitability (2)
0.4%
0.6%
0.8%
1.0%
1.2%
1.4%
Sep.2008
Mar.2009
Sep.2009
Mar.2010
Sep.2010
Mar.2011
Sep.2011
Mar.2012
Sep.2012
Overseas loan spread*
#1 in Asia Pacific among Japanese banksfor seven consecutive years(ASIAMONEY)
#1 in Asia (excl. Japan) all international currency syndicated and club loans(Thomson Reuters)
Global Bank of the Year 2012(Project Finance International)
Project finance
Loan syndication
Cash management Services
* Managerial accounting basis

9
45.546.2
47.6
30
40
50
SMBC BTMU Mizuho0
Overhead ratio*1 (1H, FY3/2013)
*1 Based on each company’s disclosure. The figures shown in the graph are: non-consolidated figures of SMBC and BTMU, and sum of Mizuho Bank and Mizuho Corporate Bank for Mizuho*2 Based on each company’s disclosure. G&A expenses (for Japanese banks, excluding non-recurring losses) divided by top-line profit (net of insurance claims).
1H, FY3/2013 results for SMFG, MUFG and Mizuho FG, and 3Q, FY12/2012 results for others 9
2. Our strengthsEfficiency
55
6163
66 6771
8082 83
52 52
0
10
20
30
40
50
60
70
80
90
SMFGMizu
ho FG
MUFGHSBC
RBS
JPM
BNP Citi DBBarc
lays
BAC
OHR on group consolidated basis*2
(%)(%)

10
27.2
17.7
19.6
15
20
25
30
SMBC BTMU Mizuho
(JPY mn)
*1 Based on each company’s disclosure. The figures shown in the graph are: non-consolidated figures of SMBC and BTMU, and sum of Mizuho Bank and Mizuho Corporate Bank for Mizuho. Before provision for general reserve for possible loan losses, excluding gains (losses) on bonds, divided by average number of employees (average number of beginning and end of the period for BTMU and Mizuho)
*2 Annualized
10
2. Our strengthsProfitability and Efficiency
Banking profit (before provisions) per employeefor 1H, FY3/2013*1, 2
1.34
0.67
0.74
0.4
0.6
0.8
1.0
1.2
1.4
1.6
SMFG MUFG Mizuho FG
Consolidated net income RORA for 1H, FY3/2013*2
0
(%)
0

11
2. Our strengthsROE of G-SIBs
13.2 12.610.39.8
7.6
(14.3)
13.1
(20)
(10)
0
10
20
06 07 08 09 10 11 1H, 12
SMFGMUFGMizuhoaverage of G-SIBs (28 banks)
(%)
FY
* Source: Bloomberg

12
3. Growth strategyOpportunities of “Abenomics”
Policies Targets
2% inflation targetStrengthen monetary easing by BOJ- Introduce open-ended asset purchasing method from 2014- Other measures to be considered; e.g. increase purchase
of risky assets, cut interest rates on bank reserves,purchase foreign bonds
Strengthen co-ordination between the government and BOJ to overcome deflationEstablish a public (MOF and BOJ) - private investment fund for purchasing foreign bonds
Formulate 10.3 trillion yen of supplementary budget of FY2012Adopt flexible economic/ fiscal policies in the next 2-3 yearsLarge scale of public investment based on national land reconstruction planMaintain target for achieving a primary balance surplus in 2020
Aim to be “trading/ industrial investment nation”through intensive reforms in the next 5 yearsDeregulate aggressively and reduce corporate tax rateExtend overseas investments, economicpartnership agreements and international natural resources strategy to capture growth of Asia
SMFG’s business opportunities
Recovery of export by easing excessive yen appreciationIncrease of domestic demand led by rise in stock prices
Support demand before monetary policy works
Boost competitiveness of Japanese corporations through pro-business measures
Pull-out of deflation/recover economy/
achieve nominal GDP growth rate of above 3%
Growth strategy
Flexible fiscal policy
Aggressive monetary policy Provide financing to support economic recovery of Japan
Promote shifts from savings to investment
Capture growth of emerging countries including Asian countries
Feasibility of rise in inflation rate by monetary easing under zero-interest rate environment- Rise in demand and CPI might be limited under the weakcorporate funding demand
- MOF might be against BOJ’s purchase of foreign bonds considering it as virtually foreign currency intervention
- US might not tolerate yen depreciation
Risks of long-term interest rate rise- Large amount of JGB purchase by BOJ might raise concern
about monetization- Market might lose confidence in Japan’s fiscal system if roadmap for fiscal soundness will not be indicated
Effectiveness of structural reform- Need to accommodate discrepancies in polices (e.g. conservative for Trans-Pacific Partnership while aggressive for globalization) and implement concrete measures
- Japanese fiscal conditions might worsen if growth strategy fails
Challenges in Abenomics
Nominal GDP growth rate forecast by JRI (as of Feb. 2013): 1.9% for FY2013 and 0.8% for FY2014
13
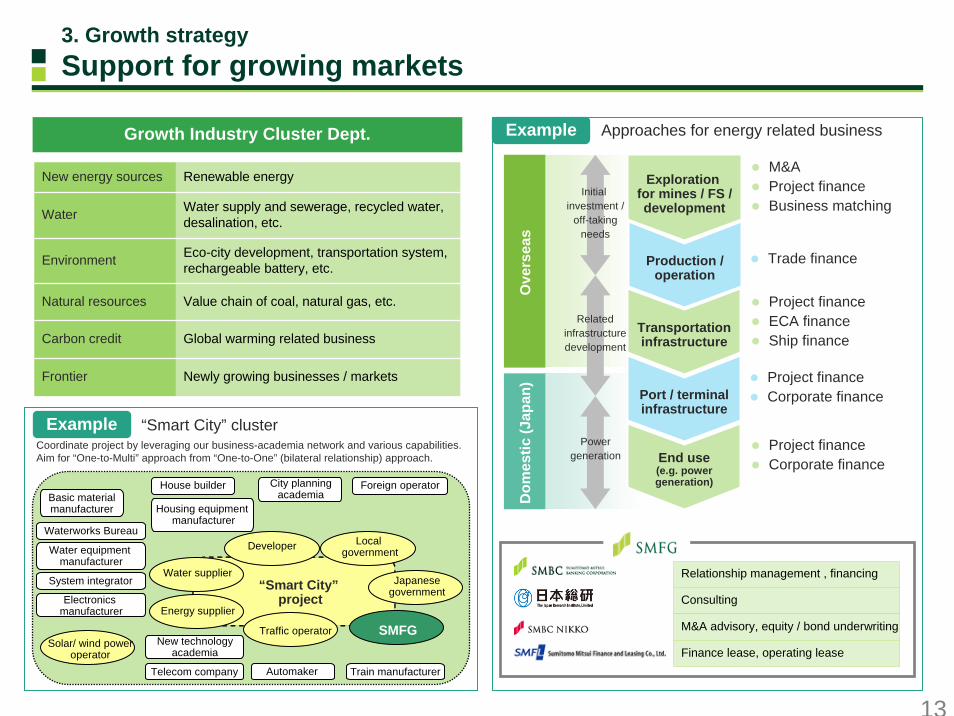
Growth Industry Cluster Dept.
New energy sources Renewable energy
Water Water supply and sewerage, recycled water, desalination, etc.
Environment Eco-city development, transportation system,rechargeable battery, etc.
Natural resources Value chain of coal, natural gas, etc.
Carbon credit Global warming related business
Frontier Newly growing businesses / markets
Relationship management , financing
Consulting
M&A advisory, equity / bond underwriting
Finance lease, operating lease
Explorationfor mines / FS /development
Production /operation
Transportationinfrastructure
Port / terminalinfrastructure
End use(e.g. powergeneration)
M&AProject financeBusiness matching
Trade finance
Project financeECA financeShip finance
Project financeCorporate finance
Project financeCorporate finance
Dom
estic
(Jap
an)
Initial investment /
off-takingneeds
Relatedinfrastructuredevelopment
Powergeneration
Ove
rsea
s
Example Approaches for energy related business
3. Growth strategySupport for growing markets
Example “Smart City” clusterCoordinate project by leveraging our business-academia network and various capabilities.Aim for “One-to-Multi” approach from “One-to-One” (bilateral relationship) approach.
“Smart City”project
Local governmentDeveloper
Water supplier
Energy supplier
Automaker
Electronics manufacturer
House builder
Traffic operator
Water equipment manufacturer
Train manufacturer
City planningacademia
Waterworks Bureau
Solar/ wind poweroperator
SMFGNew technology
academia
System integrator
Telecom company
Basic materialmanufacturer
Japanese government
Foreign operator
Housing equipmentmanufacturer
14
SMBC Consumer Finance’s net income
40.0
(92.6)
38.930.5
(208.5)
(3.3)1H 1H 2H 1H 2H 1H
(JPY bn)
FY3/05 FY3/11 FY3/12 FY3/13
Three core businesses
3. Growth strategy SMBC Consumer Finance
532.4 581.5 621.6 636.9
0100200300400500600700800900
1,000
Mar. 11 Mar. 12 Sep. 12 Dec. 12
Loan guarantee outstanding
764.2 729.6 707.2714.3
0
200
400
600
800
1,000
1,200
Mar. 11 Mar. 12 Sep. 12 Dec. 12
Unsecured loans outstanding
22.2 25.1 26.9 31.6
0
10
20
30
40
50
60
70
80
Mar. 11 Mar. 12 Sep. 12 Dec. 12
Overseas loans outstanding
(JPY bn) MobitMar.11 Sep.11 Mar.12 Sep.12Percentage ofvoting rights 22% 22% 98% 100%

15
Products and services matching stages of life(life planning, housing loans)
Asset building segment,Mass segment
(25 million customers)
Private banking/upper affluent segment
(20 thousand customers)
Asset managementsegment
(190 thousand customers)
Customized services
Remote banking
Asset management, testamentary trust, apartment loans
approx. 25 million customers
Business model by customer segment
0
500
1,000
Sep. 10 Mar. 11 Sep. 11 Mar. 12 Sep. 12
Examples of our financial consulting services
Securities intermediary business for retail customers
Client assets (JPY bn)
3. Growth strategy Financial consulting for retail customers
SMBC’s award
16
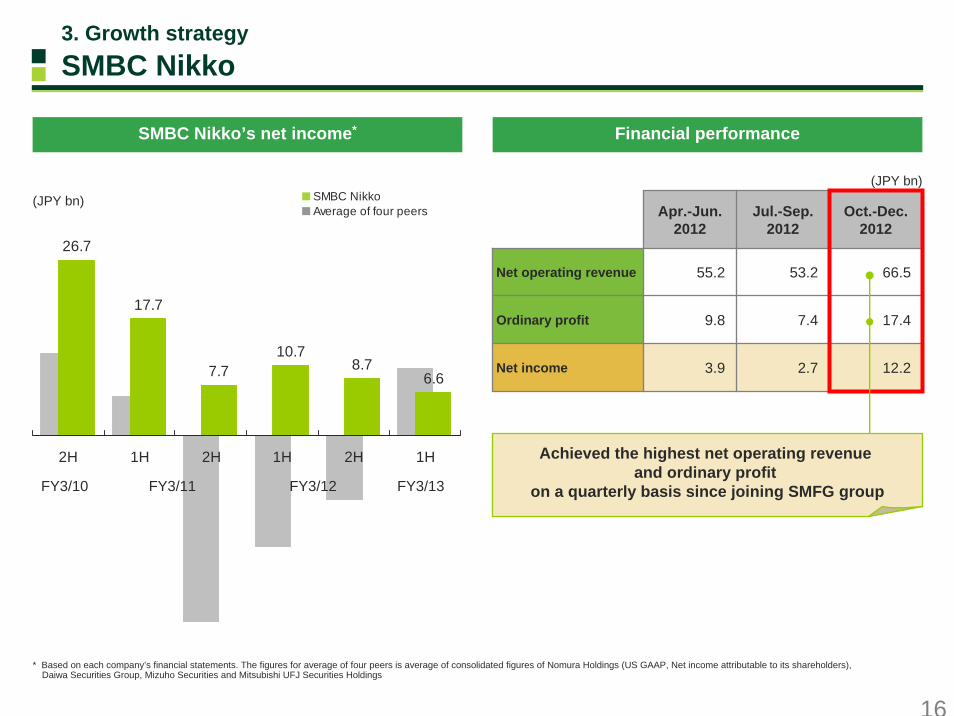
Financial performance
3. Growth strategy SMBC Nikko
(JPY bn)
Apr.-Jun.2012
Jul.-Sep.2012
Oct.-Dec.2012
Net operating revenue 55.2 53.2 66.5
Ordinary profit 9.8 7.4 17.4
Net income 3.9 2.7 12.2
* Based on each company’s financial statements. The figures for average of four peers is average of consolidated figures of Nomura Holdings (US GAAP, Net income attributable to its shareholders), Daiwa Securities Group, Mizuho Securities and Mitsubishi UFJ Securities Holdings
26.7
17.7
7.710.7
8.76.6
2H 1H 2H 1H 2H 1H
(JPY bn)
FY3/10 FY3/11 FY3/12 FY3/13
SMBC Nikko’s net income*
SMBC NikkoAverage of four peers
Achieved the highest net operating revenue and ordinary profit
on a quarterly basis since joining SMFG group

17
69.7
86.7
147.1
126.3
90.6
72.3
83.3
132.6
57.3
154.8
23%
7%
20%
30%26%
25%
31%
0
50
100
150
3/05 3/06 3/07 3/08 3/09 3/10 3/11 3/12 3/13 3/14E0%
10%
20%
30%
Overseas banking profit (before provisions:left axis)of which 1H (left axis)Overseas banking profit ratio (right axis)of which 1H (right axis)
Overseas banking profit and ratio*(before provisioning)
(JPY bn)
FY
* Managerial accounting basis. Sum of SMBC and major overseas subsidiary banks. Based on the medium-term management plan assumed exchange rate of USD1=JPY85 since FY3/12
3. Growth strategy Development of international business
1818
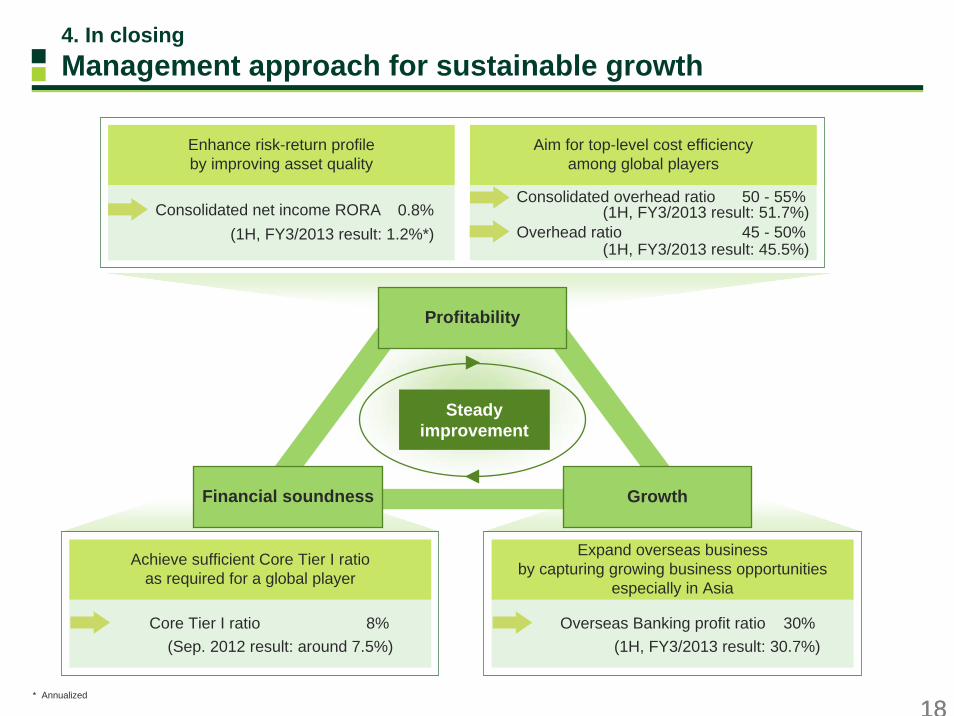
Consolidated net income RORA
Enhance risk-return profileby improving asset quality
Consolidated overhead ratio 50 - 55%
Aim for top-level cost efficiencyamong global players
Core Tier I ratio 8%
Achieve sufficient Core Tier I ratioas required for a global player
Overseas Banking profit ratio 30%
Expand overseas businessby capturing growing business opportunities
especially in Asia
Growth
Profitability
Financial soundness
Steadyimprovement
0.8%
4. In closing Management approach for sustainable growth
(1H, FY3/2013 result: 1.2%*) Overhead ratio 45 - 50%(1H, FY3/2013 result: 51.7%)
(1H, FY3/2013 result: 45.5%)
* Annualized
(Sep. 2012 result: around 7.5%) (1H, FY3/2013 result: 30.7%)

Appendix
20
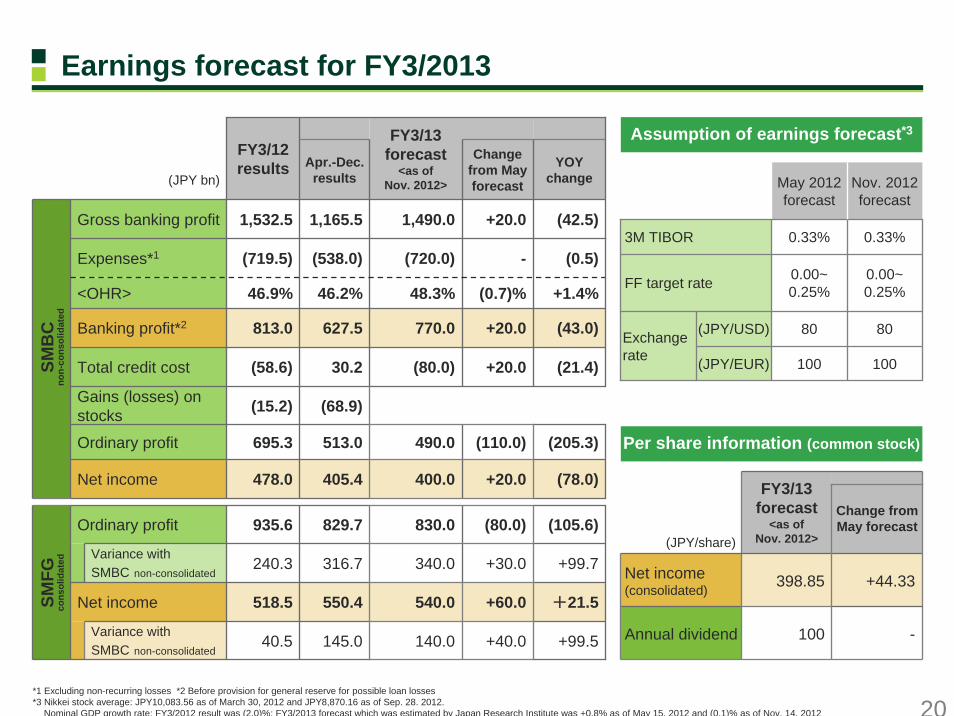
Earnings forecast for FY3/2013
(JPY bn)Apr.-Dec.
results
Change from Mayforecast
+20.0
-
(0.7)%
+20.0
+20.0
(110.0)
Net income 478.0 405.4 400.0 +20.0 (78.0)
Ordinary profit 935.6 829.7 830.0 (80.0) (105.6)
Variance withSMBC non-consolidated
240.3 316.7 340.0 +30.0 +99.7
Net income 518.5 550.4 540.0 +60.0 +21.5
Variance withSMBC non-consolidated
YOYchange
+40.0
Gross banking profit 1,532.5 1,165.5 1,490.0 (42.5)
<OHR> 46.9% 46.2% 48.3% +1.4%
Gains (losses) on stocks (15.2) (68.9)
Expenses*1 (719.5) (538.0) (720.0) (0.5)
Banking profit*2 813.0 627.5 770.0 (43.0)
Total credit cost (58.6) 30.2 (80.0) (21.4)
Ordinary profit 695.3 513.0 490.0 (205.3)
40.5 145.0 140.0 +99.5
FY3/12results
FY3/13forecast
<as ofNov. 2012>
*1 Excluding non-recurring losses *2 Before provision for general reserve for possible loan losses *3 Nikkei stock average: JPY10,083.56 as of March 30, 2012 and JPY8,870.16 as of Sep. 28. 2012.
Nominal GDP growth rate: FY3/2012 result was (2.0)%; FY3/2013 forecast which was estimated by Japan Research Institute was +0.8% as of May 15, 2012 and (0.1)% as of Nov. 14, 2012
Per share information (common stock)
Assumption of earnings forecast*3
Annual dividend
Net income(consolidated)
(JPY/share)
Change fromMay forecast
-
+44.33
100
398.85
FY3/13forecast
<as ofNov. 2012>
SMB
Cno
n-co
nsol
idat
edSM
FGco
nsol
idat
ed
100
80
0.00~0.25%
0.33%
May 2012forecast
(JPY/EUR)
(JPY/USD)
100
80
0.00~0.25%
0.33%
Nov. 2012 forecast
Exchange rate
FF target rate
3M TIBOR
21
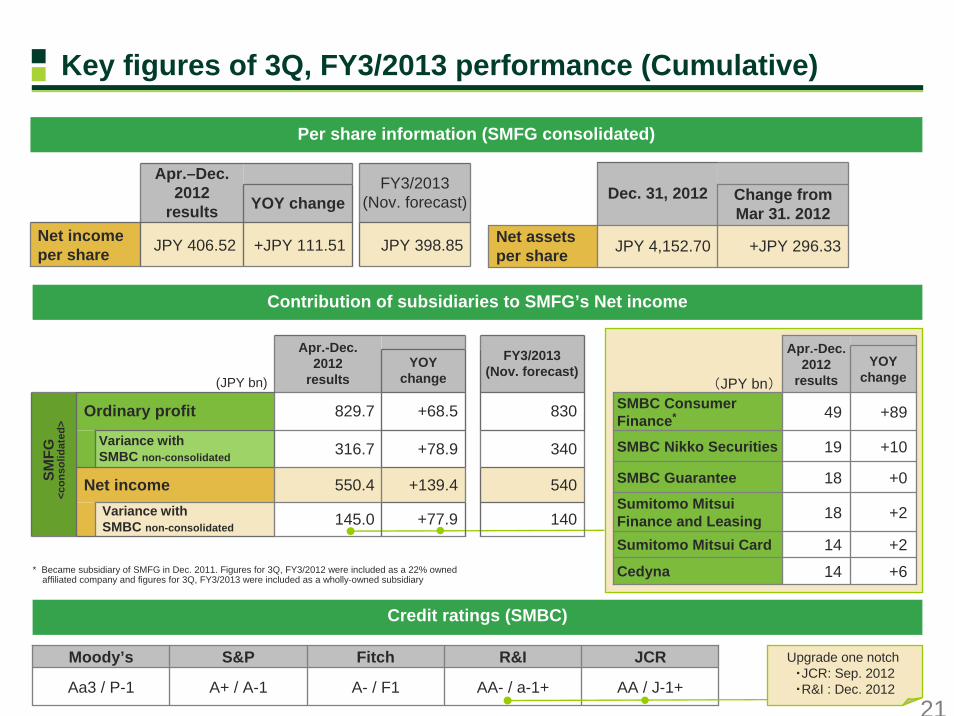
Credit ratings (SMBC)
Moody’s S&P Fitch
A+ / A-1 A- / F1Aa3 / P-1
R&I JCR
AA- / a-1+ AA / J-1+
Upgrade one notch ・JCR: Sep. 2012・R&I : Dec. 2012
Contribution of subsidiaries to SMFG’s Net income
* Became subsidiary of SMFG in Dec. 2011. Figures for 3Q, FY3/2012 were included as a 22% owned affiliated company and figures for 3Q, FY3/2013 were included as a wholly-owned subsidiary
YOY changeFY3/2013
(Nov. forecast)
Net income per share JPY 398.85
Apr.–Dec. 2012
results
+JPY 111.51JPY 406.52 +JPY 296.33JPY 4,152.70Net assets per share
Change from Mar 31. 2012
Dec. 31, 2012
Per share information (SMFG consolidated)
Variance withSMBC non-consolidated 140
540
340
830
FY3/2013(Nov. forecast)
+77.9
+139.4
+78.9
+68.5
YOYchange
Variance withSMBC non-consolidated 316.7
829.7Ordinary profit
550.4Net income
145.0
Apr.-Dec. 2012
results(JPY bn)
+1019SMBC Nikko Securities
+214Sumitomo Mitsui Card
+018SMBC Guarantee
+614Cedyna
+218Sumitomo Mitsui Finance and Leasing
+8949SMBC Consumer Finance*
(JPY bn)
Apr.-Dec. 2012
resultsYOY
change
SMFG
<con
solid
ated
>Key figures of 3Q, FY3/2013 performance (Cumulative)
22
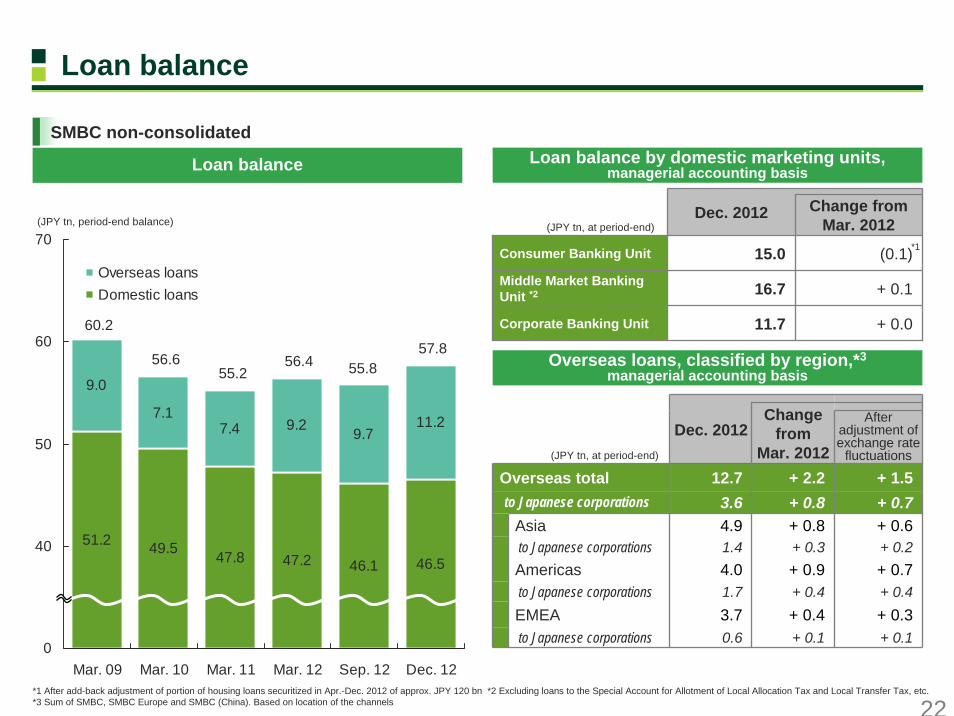
Loan balance
Dec. 2012 Change from Mar. 2012
Consumer Banking Unit 15.0 (0.1)Middle Market Banking Unit *2 16.7 + 0.1
Corporate Banking Unit 11.7 + 0.0
Loan balance Loan balance by domestic marketing units,managerial accounting basis
*1
Overseas loans, classified by region,*3managerial accounting basis
+ 0.4+ 0.41.7to Japanese corporations+ 0.3+ 0.43.7EMEA
+ 0.2+ 0.31.4to Japanese corporations+ 0.6+ 0.84.9Asia+ 0.7+ 0.83.6to Japanese corporations
+ 0.1
+ 0.7
+ 1.5
After adjustment ofexchange rate
fluctuations
+ 0.1
+ 0.9
+ 2.2
Change from
Mar. 2012
4.0Americas
0.6to Japanese corporations
12.7Overseas total
Dec. 2012
SMBC non-consolidated
(JPY tn, at period-end)
*1 After add-back adjustment of portion of housing loans securitized in Apr.-Dec. 2012 of approx. JPY 120 bn *2 Excluding loans to the Special Account for Allotment of Local Allocation Tax and Local Transfer Tax, etc. *3 Sum of SMBC, SMBC Europe and SMBC (China). Based on location of the channels
(JPY tn, at period-end)
51.2 49.5 47.8 47.2 46.1 46.5
11.2
9.0
7.17.4 9.2 9.7
30
40
50
60
70
Mar. 09 Mar. 10 Mar. 11 Mar. 12 Sep. 12 Dec. 12
Overseas loansDomestic loans
55.2 55.8
(JPY tn, period-end balance)
56.6
60.257.8
56.4
0

23
Overseas loan and deposit balance
Overseas deposit balance*1
*1 Managerial accounting basis, exchanged at respective period-end exchange rates. Sum of SMBC, SMBC Europe and SMBC (China)*2 Includes deposits from central banks
68
90818273
Mar. 10 Mar. 11 Mar. 12 Sep. 12 Dec. 12
CDs & CP : less than 3 monthsCDs & CP : 3 months or moreDeposits
91
106
136
(USD bn)
31 3950 56 57
2530
3845 47
34
34
40
42 43
Mar. 10 Mar. 11 Mar. 12 Sep. 12 Dec. 12
EMEAAmericasAsia
104
90
128
(USD bn)
Overseas loan balance*1
142 146
160170
*2

24
Loan spread*1
Domestic*2
0.4%
0.6%
0.8%
1.0%
1.2%
1.4%
Sep.2008
Mar.2009
Sep.2009
Mar.2010
Sep.2010
Mar.2011
Sep.2011
Mar.2012
Sep.2012
Large corporations (Corporate Banking Unit)
Medium-sized enterprises and SMEs (Middle Market Banking Unit)
0.4%
0.6%
0.8%
1.0%
1.2%
1.4%
Sep.2008
Mar.2009
Sep.2009
Mar.2010
Sep.2010
Mar.2011
Sep.2011
Mar.2012
Sep.2012
Overseas*3
*1 Managerial accounting basis. Average loan spread of existing loans *2 SMBC non-consolidated *3 Sum of SMBC, SMBC Europe and SMBC (China)
25
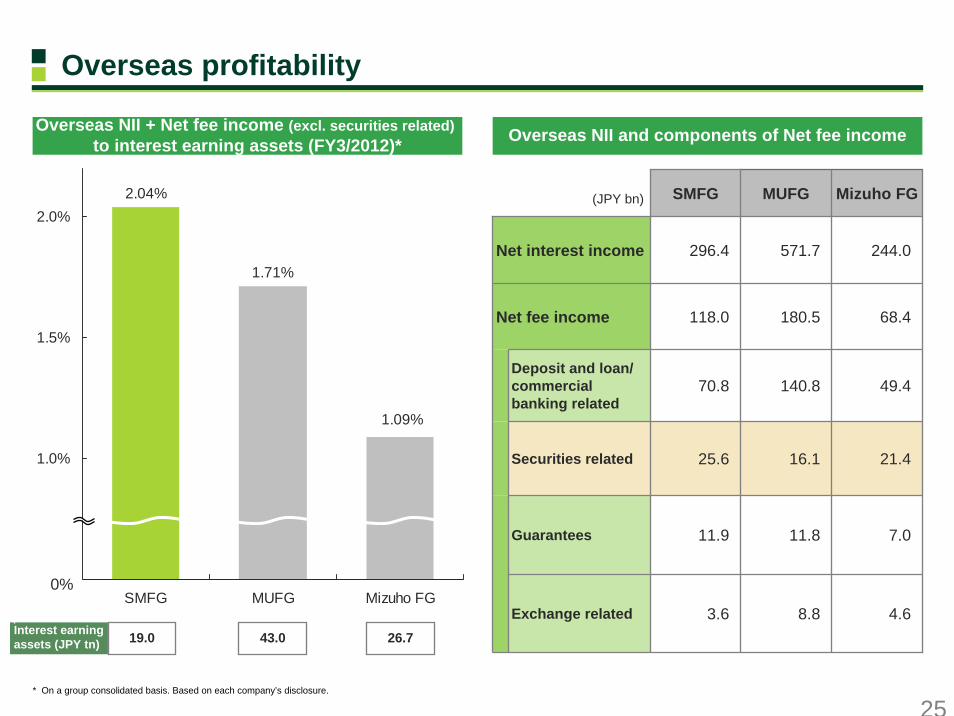
2.04%
1.09%
1.71%
0.5%
1.0%
1.5%
2.0%
SMFG MUFG Mizuho FG
* On a group consolidated basis. Based on each company’s disclosure.
Overseas NII + Net fee income (excl. securities related)to interest earning assets (FY3/2012)*
0%
Overseas profitability
19.0Interest earning assets (JPY tn) 43.0 26.7
Overseas NII and components of Net fee income
(JPY bn) SMFG MUFG Mizuho FG
296.4 571.7
180.5
Deposit and loan/ commercial banking related
140.8
Securities related 25.6 16.1 21.4
Guarantees 11.9 11.8 7.0
Exchange related 8.8
118.0
244.0
68.4
49.470.8
4.63.6
Net interest income
Net fee income
26
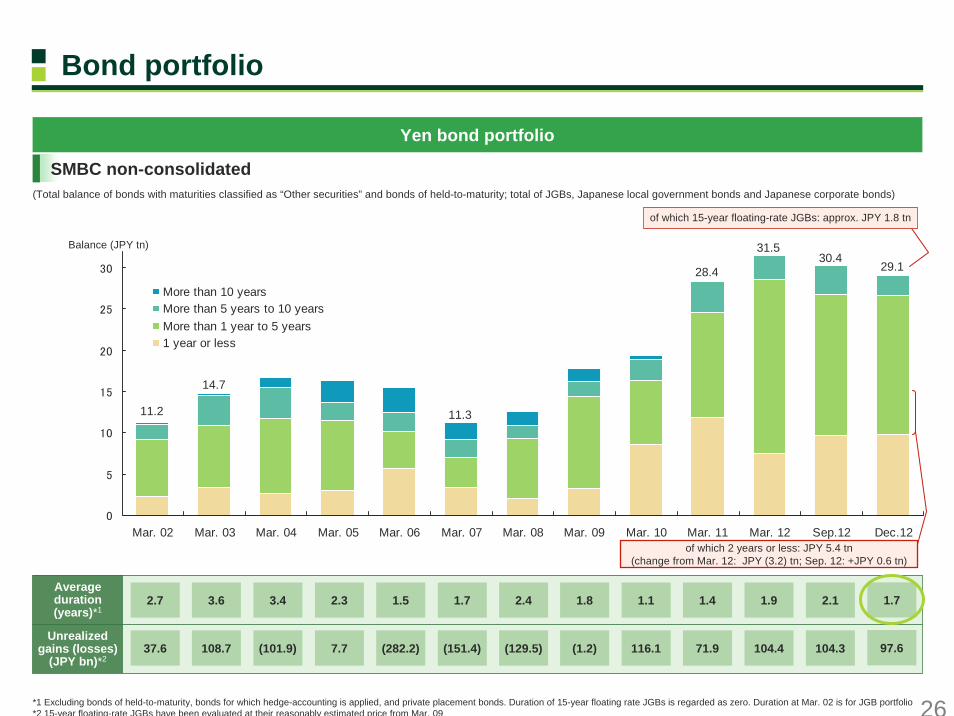
Yen bond portfolio
3.6 1.8 1.1 1.4
0
5
10
15
20
25
30
Mar. 02 Mar. 03 Mar. 04 Mar. 05 Mar. 06 Mar. 07 Mar. 08 Mar. 09 Mar. 10 Mar. 11 Mar. 12 Sep.12 Dec.12
More than 10 yearsMore than 5 years to 10 yearsMore than 1 year to 5 years1 year or less
Balance (JPY tn)
of which 15-year floating-rate JGBs: approx. JPY 1.8 tn
28.4
31.5
1.9
14.7
of which 2 years or less: JPY 5.4 tn(change from Mar. 12: JPY (3.2) tn; Sep. 12: +JPY 0.6 tn)
2.7 3.4 2.3 1.5 2.41.7
11.311.2
SMBC non-consolidated
*1 Excluding bonds of held-to-maturity, bonds for which hedge-accounting is applied, and private placement bonds. Duration of 15-year floating rate JGBs is regarded as zero. Duration at Mar. 02 is for JGB portfolio*2 15-year floating-rate JGBs have been evaluated at their reasonably estimated price from Mar. 09
Unrealizedgains (losses)
(JPY bn)*2
Average duration(years)*1
108.7 (1.2) 116.1 71.9 104.437.6 (101.9) 7.7 (282.2) (129.5)(151.4)
Bond portfolio
2.1
104.3
30.4
(Total balance of bonds with maturities classified as “Other securities” and bonds of held-to-maturity; total of JGBs, Japanese local government bonds and Japanese corporate bonds)
29.1
1.7
97.6
27
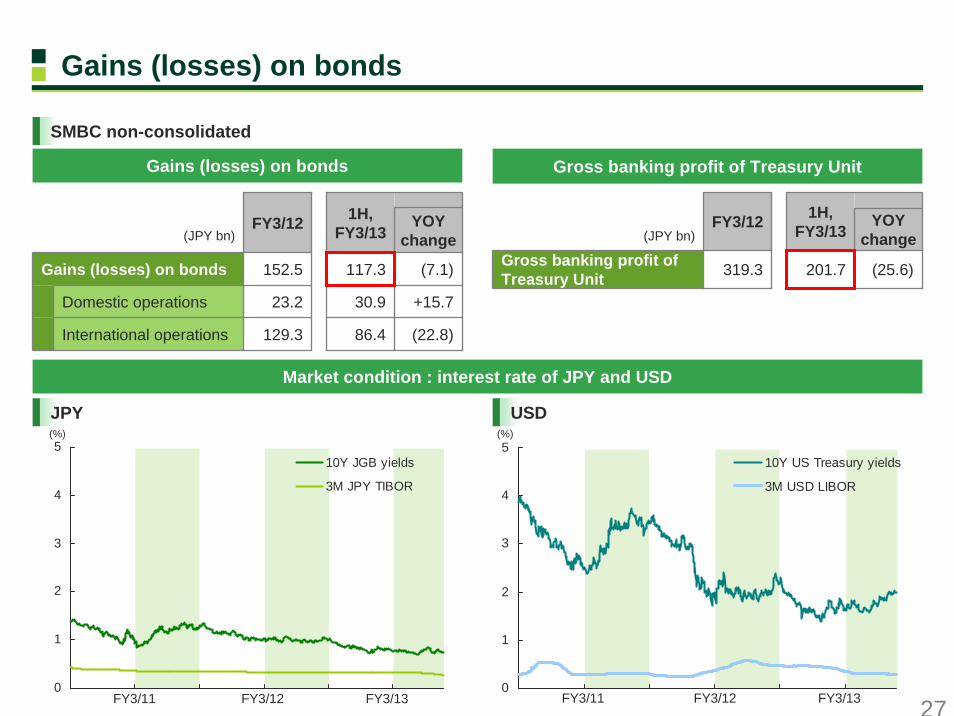
Gains (losses) on bonds
1H, FY3/13
117.3
30.9
86.4
(JPY bn)FY3/12
152.5
23.2
129.3
Domestic operations
International operations
YOYchange
Gains (losses) on bonds (7.1)
+15.7
(22.8)
1H, FY3/13
319.3
FY3/12
201.7 (25.6)
YOYchange(JPY bn)
Gross banking profit of Treasury Unit
Gross banking profit of Treasury UnitGains (losses) on bonds
SMBC non-consolidated
(%)
Market condition : interest rate of JPY and USD
(%)
JPY USD
0
1
2
3
4
5
2010/4/1 2010/10/1 2011/4/1 2011/10/1 2012/4/1 2012/10/1
10Y JGB yields
3M JPY TIBOR
0
1
2
3
4
5
2010/4/1 2010/10/1 2011/4/1 2011/10/1 2012/4/1 2012/10/1
10Y US Treasury yields
3M USD LIBOR
FY3/12FY3/11 FY3/13 FY3/12FY3/11 FY3/13

28
1H, FY3/2013 financial performance by business unit*1
Balance Spread
Corporate Banking Unit 11.5 (0.2) 0.66 (0.02)
1H,FY3/13
YOY change*2
1H,FY3/13
YOY change*2
Domestic loans 45.8 (2.3)*5 1.04 (0.01)
Consumer Banking Unit 15.2 (0.2) 1.44 (0.02)
Middle Market Banking Unit 16.3 (0.4) 1.08 (0.07)
IBU’s interest earning assets*6142.5 +23.1 1.16 +0.07
(JPY tn, %)
(2.5)181.6Non-interest income
(1.9)398.4Interest income
(9.7)+2.0+2.5
17.86.85.5
of which:Investment trustSingle premium type permanent life insuranceLevel premium insurance
(6.8)33.6Income relating to Financial consulting for retail customers
+0.4+0.6(1.5)
20.625.014.2
of which:Loan syndicationStructured finance*4
Real estate finance*4
(0.5)70.9Income related to IB business*4
+1.3(0.8)(0.1)+3.0
9.045.721.645.9
of which:Sales of derivativesMoney remittance, Electronic bankingForeign exchangeIBU’s non-interest income*3
580.0
230.674.364.1
Gross banking profit of Marketing units (4.4)
(12.8)+1.3+9.1
of which:Income on domestic loansIncome on domestic yen depositsIBU’s interest related income*3
Gross banking profit by product(JPY bn)
Average loan balance and spread by business unit
NominalYOY
change:(17.2)
YOYchange*2
*1 SMBC non-consolidated. Managerial accounting basis *2 After adjustment of interest rates and exchange rates, etc. *3 Including profit from Japanese corporations in Hong Kong Branch and Taipei Branch *4 Including interest income *5 of which JPY (1.8) tn was resulted from a decrease of loans to government *6 Sum of loans, trade bills and securities
428.7358.0786.7(39.4)
44.45.0
191.510.2
201.7276.6303.4580.0
71.036.3
107.376.619.596.195.1
106.7201.8
33.9140.9174.8
1H, FY3/13
(32.8)819.5Gross banking profit
(2.8)(5.0)Gross banking profit
(25.6)227.3Gross banking profit
(4.4)597.2Gross banking profit
+ 12.093.5Gross banking profit
(1.8)102.6Gross banking profit
(10.6)192.3Gross banking profit
(4.0)208.8Gross banking profit
YOY change*2(JPY bn)
Expenses
Expenses
Expenses
(4.3)293.5Banking profit
+ 0.89.5Treasury Unit(26.4)217.8Banking profit
+ 2.741.4Headquarters(5.5)(46.4)Banking profit
+ 3.4354.6Total
(Business Units) (36.2)464.9Banking profit
(0.1)
+ 7.5+ 4.5
(2.0)+ 0.2
(1.6)(2.4)
(8.2)(2.4)
1H, FY3/12
62.5Banking profit
83.7Banking profit
98.0Banking profit
49.3Banking profit
18.9ExpensesCorporate Banking Unit
31.0ExpensesInternational Banking Unit(IBU)
303.7ExpensesMarketing units
110.8ExpensesMiddle Market Banking Unit
143.0ExpensesConsumer Banking Unit
Adjustment of interest rates and exchange rates etc.: (12.8)
of which:
(USD bn, %)

29
5561 63 66 67 71
80 82 83
52 52
0102030405060708090
SMFGMizu
ho FG
MUFGHSBC
RBS
JPM
BNP Citi DBBarc
lays
BACExpenses
OHR on group consolidated basis *3
(%)
Expenses*1
FY3/12
(JPY bn)
Expenses
OHR
Expenses*2
OHR
1H 1H
(354.6) (719.5) (358.0) (720.0)
43.3% 46.9% 45.5% 48.3%
forecast
(677.4) (1,388.4) (709.7)
51.7%53.5%
FY3/13
51.2%
*1 Excluding non-recurring losses *2 Consolidated G&A expenses net of SMBC’s non-recurring losses*3 Based on each company’s disclosure. G&A expenses (for Japanese banks, excluding non-recurring losses) divided by top-line profit (net of insurance claims).
1H, FY3/2013 results for SMFG, MUFG and Mizuho FG, and 3Q, FY12/2012 results for others
SMB
Cno
n-co
nsol
idat
edSM
FGco
nsol
idat
ed
Fiscal 2012 30th Information Technology Awardby Japan Institute of Information Technology
Awarded for our initiatives towards strategic IT governance
IT Management Award
30
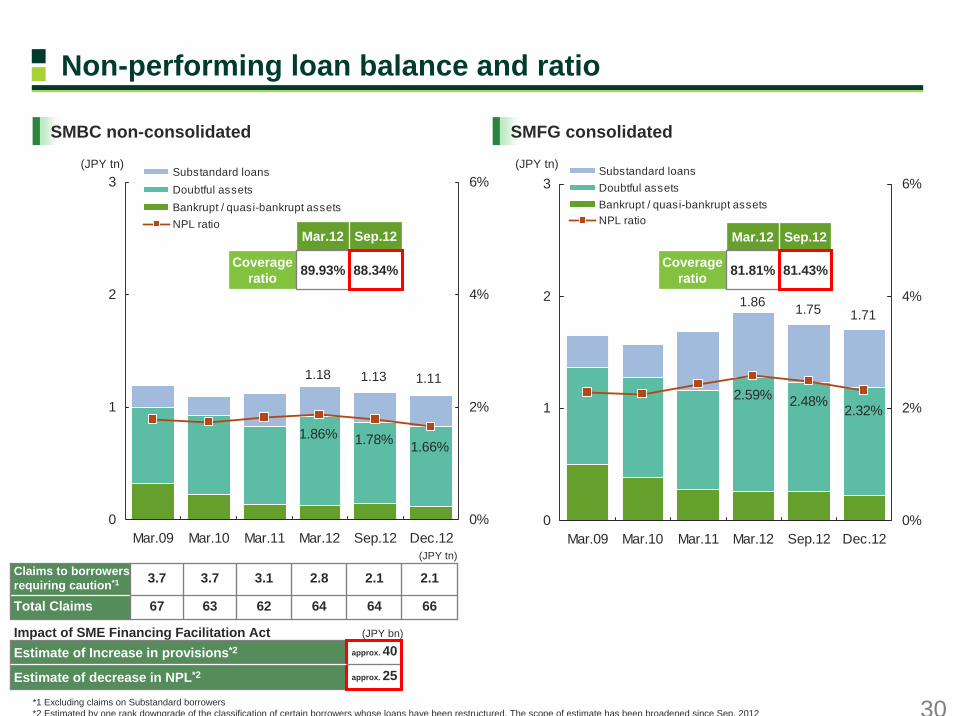
Non-performing loan balance and ratio
1.66%1.78%1.86%
0
1
2
3
Mar.09 Mar.10 Mar.11 Mar.12 Sep.12 Dec.120%
2%
4%
6%Substandard loansDoubtful assetsBankrupt / quasi-bankrupt assetsNPL ratio
(JPY tn)
1.18 1.13
*1 Excluding claims on Substandard borrowers*2 Estimated by one rank downgrade of the classification of certain borrowers whose loans have been restructured. The scope of estimate has been broadened since Sep. 2012
1.11
SMBC non-consolidated SMFG consolidated
(JPY tn)
Estimate of Increase in provisions*2 approx. 40
Estimate of decrease in NPL*2 approx. 25
Claims to borrowers requiring caution*1 3.7 3.7 3.1
63 62
Impact of SME Financing Facilitation Act (JPY bn)
67
2.8 2.1 2.1
Total Claims 64 64 66
89.93%
Mar.12
88.34%Coverage ratio
Sep.12
2.32%2.48%2.59%
0
1
2
3
Mar.09 Mar.10 Mar.11 Mar.12 Sep.12 Dec.120%
2%
4%
6%Substandard loansDoubtful assetsBankrupt / quasi-bankrupt assetsNPL ratio
(JPY tn)
1.86 1.75 1.71
81.81%
Mar.12
81.43%Coverage ratio
Sep.12

31
Credit costs
94.3
58.680.0
254.7
550.1
12bp
82bp
15bp9bp
▲ 200
0
200
400
600
800
FY3/09 3/10 3/11 3/12 3/13
送
0
40
80
120
160
Total credit cost (left axis)of which Apr.-Dec. (left axis)Total credit cost / Total claims (right axis)
(JPY bn) (bp)
SMBC non-consolidated
* Former Promise, which became subsidiary of SMFG in Dec. 2011
Forecast
767.8
473.0
217.3
121.3
106bp
31bp17bp
▲ 200
0
200
400
600
800
FY3/09 3/10 3/11 3/12 3/13
-40
0
40
80
120
160Total credit cost (left axis)of which Apr.-Dec. (left axis)Total credit cost / Total claims (right axis)
(JPY bn) (bp)
SMFG consolidated
Apr.-Dec. 2012 57.2YOY change (1.4)
+53.587.4Variance with SMBC non-consolidated
+2929SMBC Consumer Finance*
YOY Change
+35MINATO BANK(3)10Kansai Urban Banking Corporation(5)14Cedyna
Apr.-Dec. 2012(JPY bn)
Major subsidiaries
(30.2)Apr.-Dec. 2012
YOY change (54.9)

323232
Portugalapprox. USD 0.04 bn
Spainapprox. USD 2.6bn*1
To large corporationsand project finance
Italyapprox. USD 3.3 bn
To large corporationsand project finance
Irelandapprox. USD 1.5 bn*1
Aircraft leasing
(SMFG consolidated)
Gov’t bonds issued byGIIPS countries*2 approx. USD 0.9 mn
Greeceapprox. USD 0.2 bn*1
Aircraft leasing
Exposure to GIIPS countries - approx. USD 7.6 billion*1 as of December 2012
*1 Aircraft leasing by newly consolidated SMBC Aviation Capital is approx. USD 1.5 bn in total; USD 1 bn in Ireland, USD 0.3 bn in Spain and USD 0.2 bn in Greece*2 Secondary holdings of government bonds in SMBC Nikko. USD 0.9 mn in Italy and USD 0.01 mn in Greece
Exposure to GIIPS Countries

33
MizuhoFGMUFGSMFG
191.5
67.1
(15.2)
260.0
905.7
700.9
180.5
641.2
380.8389.0
305.6
521.4
(400)
(200)
0
200
400
600
800
1,000
Mar.10
Mar.11
Mar.12
Dec.12
Mar.10
Mar.11
Mar.12
Dec.12
Mar.10
Mar.11
Mar.12
Dec.12
OthersBondsStocksTotal
Equity holdings
*1 Balance of domestic stocks classified as other securities with fair value *2 Until Mar. 02, percentage to SMBC consolidated Tier I *3 Shares of SMFG related to share exchange for acquiring former Promise are excluded. Amount of un-hedged equity*4 Based on each company’s disclosure. The figures shown in the graph are: non-consolidated figures of SMBC for SMFG, sum of non-consolidated figures of The Bank of Tokyo-Mitsubishi UFJ and
Mitsubishi UFJ Trust and Banking for MUFG, and sum of non-consolidated figures of Mizuho Bank, Mizuho Corporate Bank and Mizuho Trust & Banking for Mizuho FG
Balance of equity holdings*1
1.671.821.85
5.9
1.84 1.94
25%
145%
94%
32%29% 29%
0
1
2
3
4
5
6
Apr.01
Mar.02
Mar.03
Mar.04
Mar.05
Mar.06
Mar.07
Mar.08
Mar.09
Mar.10
Mar.11
Mar.12
Dec.12
Equity holdings (acquisition cost on SMBC non-consolidated)
Percentage of equity holdings to SMFG consolidated Tier I
(JPY tn)
*2
Break-even level of Nikkei Stock Average:
Around JPY8,500
Reduce un-hedged equity to 25% of Tier I capital
Unrealized gains (losses) on other securities*4
Gains (Losses)on stocks for
Apr.-Dec. 2012:JPY (68.9) bn
Gains (Losses)on stocks for
Apr.-Dec. 2012:JPY (112.3) bn
(JPY bn)
Gains (Losses)on stocks for
Apr.-Dec. 2012:JPY (122.9) bn
*3
Amount sold or hedgedin Apr.-Dec. 2012:approx. JPY 50 bn
34
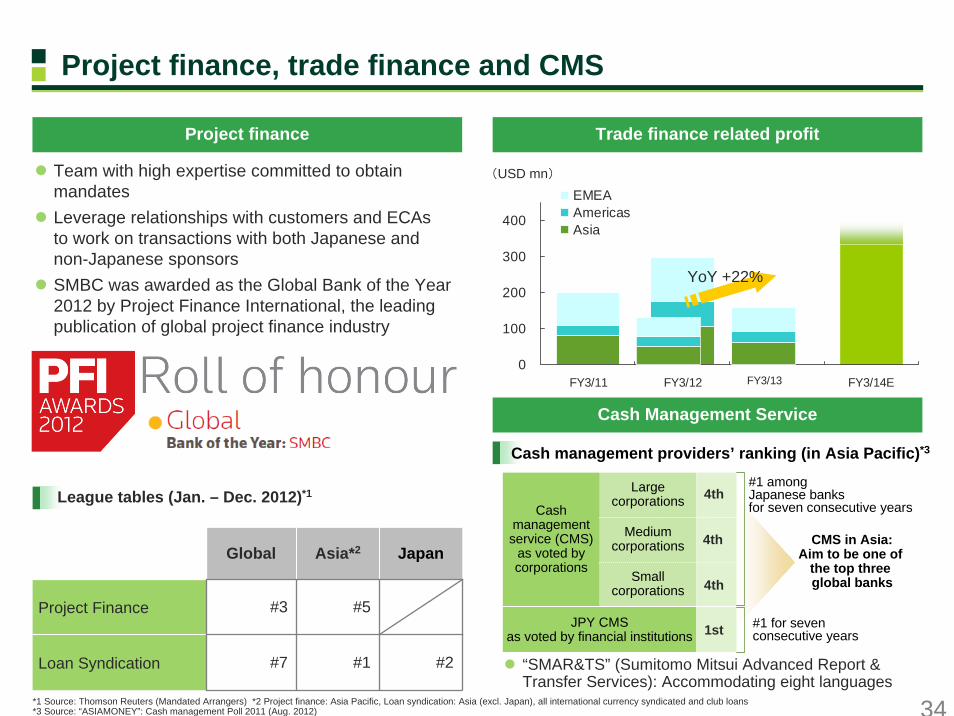
Project finance, trade finance and CMS
Cash Management Service
CMS in Asia:Aim to be one of
the top three global banks
Large corporations
Medium corporations
Cash management service (CMS)
as voted by corporations
Small corporations
JPY CMSas voted by financial institutions
Cash management providers’ ranking (in Asia Pacific)*3
#1 among Japanese banksfor seven consecutive years
#1 for sevenconsecutive years
4th
4th
1st
4th
“SMAR&TS” (Sumitomo Mitsui Advanced Report & Transfer Services): Accommodating eight languages
Project finance
Team with high expertise committed to obtain mandatesLeverage relationships with customers and ECAsto work on transactions with both Japanese and non-Japanese sponsorsSMBC was awarded as the Global Bank of the Year 2012 by Project Finance International, the leading publication of global project finance industry
Trade finance related profit
(USD mn)
0
100
200
300
400
FY3/11 FY3/12 FY3/14E
EMEAAmericasAsia
YoY +22%
FY3/13
#1
#5
Asia*2
#3Project Finance
#2#7Loan Syndication
JapanGlobal
League tables (Jan. – Dec. 2012)*1
*1 Source: Thomson Reuters (Mandated Arrangers) *2 Project finance: Asia Pacific, Loan syndication: Asia (excl. Japan), all international currency syndicated and club loans*3 Source: “ASIAMONEY”: Cash management Poll 2011 (Aug. 2012)

35* Credit ratings at time of issuance
Diversification of foreign-currency fundingIssued foreign-currency denominated senior bonds to: domestic retail investors in Dec. 2012overseas institutional investors in Jan. 2013Issued AUD denominated transferable deposits to international investors in Feb. 2013 (AUD 500mn)
Issue amount of foreign-currency denominated bonds (mn)
A$430 A$420A$200
US$2,000
US$1,500US$2,000
US$3,000
US$1,500 US$2,000
US$1,500
€750
Apr. 10 - Sep. 10
Oct. 10 - Mar. 11
Apr. 11 - Sep. 11
Oct. 11 - Mar. 12
Apr. 12 - Sep. 12
Oct. 12 - Jan. 13
Subordinated bonds to overseas investorsSenior bonds to overseas investorsSenior bonds to domestic retail investors
Foreign currency funding
Examples of USD senior bonds issuances by financial institutions
Credit ratings*Maturity Pricing
date IssuerIssue
Amount(USD mn)
Coupon(%)
Spread(bp) Moody's S&P
2013/1/8 Bank of America Corp 1,000 1.250 95.0 Ba2 A-
2012/12/11 Bank of Nova Scotia 1,000 1.375 77.0 Aa1 AA-2012/12/13 HSBC USA Inc 1,500 1.625 100.0 A2 A+2012/12/18 Wells Fargo & Co 1,250 1.500 78.0 A2 A+
2013/1/7 Westpac Banking Corp 1,000 1.600 80.0 Aa2 AA-
2013/1/7 Royal Bank of Canada 1,250 1.500 72.0 Aa3 AA-
2013/1/7 Intesa SanPaoloSpa (New York) 1,500 3.875 310.0 Baa2 BBB+
2013/1/8 Bank of America Corp 2,000 2.000 125.0 Baa2 A-
2013/1/8 Bank of America Corp 3,000 3.300 150.0 Baa2 A-
2013/1/10 Sumitomo Mitsui Banking Corp 500 3.000 117.0 Aa3 A+10
years
2013/1/14 National Australia Bank Ltd 750 3.000 117.0 Aa2 AA-
2013/1/3 Citigroup 1,750 1.250 95.0 Baa2 A-
2013/1/7 Westpac Banking Corp 1,250 0.950 60.0 Aa2 AA-
2013/1/7 Intesa SanPaoloSpa (New York) 2,000 3.125 275.0 Baa2 BBB+
2013/1/10 Sumitomo Mitsui Banking Corp 750 0.900 58.0 Aa3 A+
3years
2013/1/14 National Australia Bank Ltd 750 0.900 60.0 Aa2 AA-
2013/1/17 ABN AMRO Bank NV 1,000 1.375 100.0 A2 A
2012/12/10 BNP Paribas (New York) 750 2.375 143.0 A2 AA-
2013/1/10 Sumitomo Mitsui Banking Corp 750 1.500 77.0 Aa3 A+
5years
2013/1/17 Canadian Imperial Bank of Commerce 750 1.550 78.0 Aa2 A+

36
0
25
50
75
100
Total Asia Americas EMEA
Japanese corporations Non-Japanese corporations and others
0
25
50
75
100
China Singapore Sydney Bangkok Seoul
Japanese corporations Non-Japanese corporations and others(%)
Total By region (Dec. 2012)
Major marketing channels in Asia (Dec. 2012)
(%)
Hong Kong
* Managerial accounting basis. Sum of SMBC, SMBC Europe and SMBC (China).
Overseas loan balance classified by borrower type(Geographic classification based on booking office)*
Mar. 10 Mar. 11 Mar. 12 Sep. 12 Dec. 12
Non-Japanese corporations and others (product type lending)Japanese corporations
104
90
146
128
142
(USD bn)

37
Loan balance in Asian countries(Geographic classification based on domicile of borrowers) *
China
0200400600800
Mar.10 Mar.11 Mar.12 Sep.12
* Sum of SMBC, SMBCE and SMBC (China). Loan balances as of Mar. 31, 2012 and before are exchanged to JPY from each country’s local currency at the exchange rate of Sep. 30, 2012
Singapore
Korea
0200400600800
Mar.10 Mar.11 Mar.12 Sep.12
0200400600800
Mar.10 Mar.11 Mar.12 Sep.12
Hong Kong
0200400600800
Mar.10 Mar.11 Mar.12 Sep.12
Australia
India
0200400600800
Mar.10 Mar.11 Mar.12 Sep.12
0200400600800
Mar.10 Mar.11 Mar.12 Sep.12
Taiwan
0200400600800
Mar.10 Mar.11 Mar.12 Sep.12
Thailand
Indonesia
0200400600800
Mar.10 Mar.11 Mar.12 Sep.12
0200400600800
Mar.10 Mar.11 Mar.12 Sep.12
(JPY bn) (JPY bn) (JPY bn)
(JPY bn) (JPY bn) (JPY bn)
(JPY bn) (JPY bn) (JPY bn)
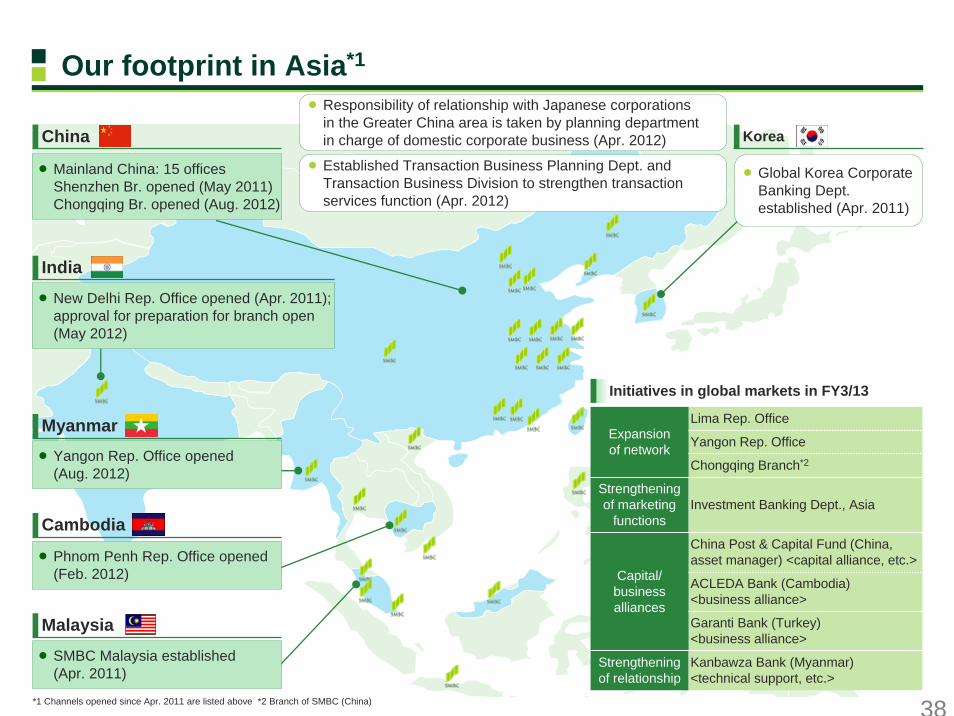
38*1 Channels opened since Apr. 2011 are listed above *2 Branch of SMBC (China)
Mainland China: 15 officesShenzhen Br. opened (May 2011)Chongqing Br. opened (Aug. 2012)
China
Global Korea Corporate Banking Dept. established (Apr. 2011)
Korea
New Delhi Rep. Office opened (Apr. 2011);approval for preparation for branch open (May 2012)
India
Yangon Rep. Office opened(Aug. 2012)
Myanmar
Phnom Penh Rep. Office opened (Feb. 2012)
Cambodia
SMBC Malaysia established (Apr. 2011)
Malaysia
Responsibility of relationship with Japanese corporations in the Greater China area is taken by planning department in charge of domestic corporate business (Apr. 2012)
Established Transaction Business Planning Dept. and Transaction Business Division to strengthen transaction services function (Apr. 2012)
Our footprint in Asia*1
Lima Rep. Office
Yangon Rep. Office
Chongqing Branch*2
China Post & Capital Fund (China, asset manager) <capital alliance, etc.>
ACLEDA Bank (Cambodia) <business alliance>
Garanti Bank (Turkey) <business alliance>
Strengthening of relationship
Kanbawza Bank (Myanmar) <technical support, etc.>
Capital/ business alliances
Expansionof network
Strengthening of marketing
functionsInvestment Banking Dept., Asia
Initiatives in global markets in FY3/13

39
Strategic Partner Relationship since Outline of alliance / cooperation
Bank of China 2000
1995
2002
2007
2007
2008
1995
2007
1974
2009
2012
2010
Renminbi business cooperation
Agricultural Bank of China Funding activities in China
China Industrial and Commercial bank of China
Kookmin Bank
First Commercial Bank
Bank of East Asia
Metrobank
Vietnam Eximbank
RHB Bank
Bank Central Asia
ACLEDA Bank
Kotak Mahindra Bank
Cambodia Usage of channel network in Cambodia, transaction services, trade finance
India Asset management business in India such as establishing infrastructure fund, securities and investment banking business. Invested in 2010
Ship finance business in China
KoreaMutual introduction of customers inside/outside Japan/Korea,Loan syndication, funding activitiesInvested in KB Financial Group, the holding company, in 2008
Taiwan Local currency funding in China and Taiwan, usage of channel network
Hong KongMutual introduction of customers in China and Hong Kong, credit card business, funding activitiesInvested in 2009 and 2012
Philippines Introduction of customers in Philippines, local currency transaction,usage of channel network. Established Japan desk in 2007
Vietnam Retail and SME banking business in VietnamInvested in 2008. Entered into technical service agreement in 2009
Malaysia Local currency funding in Malaysia, transaction services, Islamic finance
Indonesia Local currency funding in Indonesia, transaction services including CMS
Our strategic partners in Asia*
* Boldfaced banks: SMBC has equity stake
40
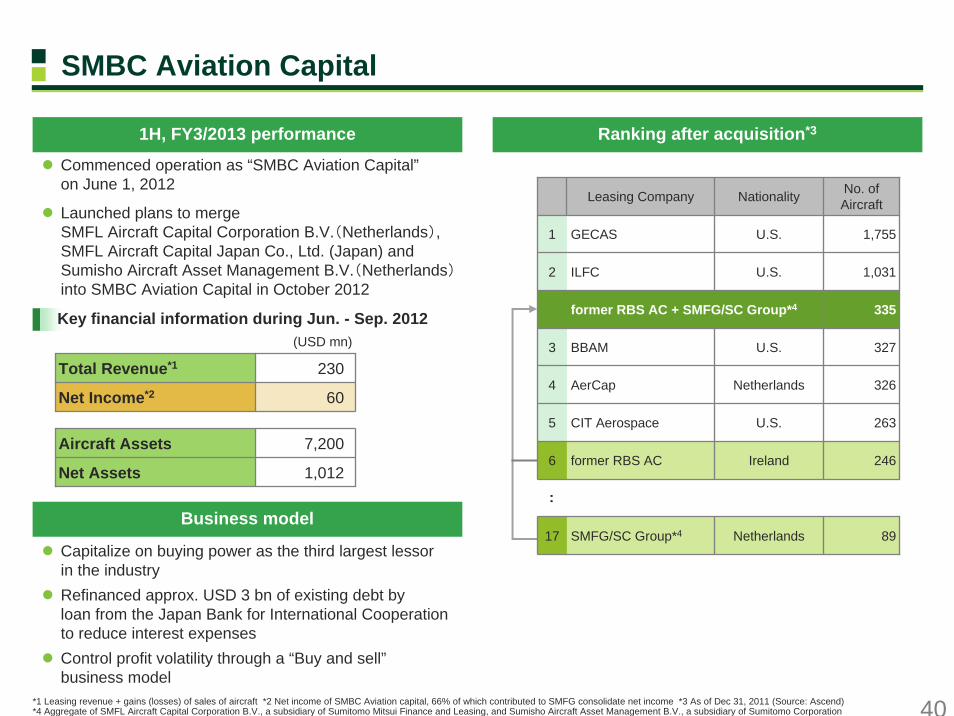
SMBC Aviation Capital
Commenced operation as “SMBC Aviation Capital”on June 1, 2012
Launched plans to merge SMFL Aircraft Capital Corporation B.V.(Netherlands), SMFL Aircraft Capital Japan Co., Ltd. (Japan) and Sumisho Aircraft Asset Management B.V.(Netherlands)into SMBC Aviation Capital in October 2012
Key financial information during Jun. - Sep. 2012
Total Revenue*1 230
Net Income*2 60
Aircraft Assets 7,200
1,012Net Assets
(USD mn)
1H, FY3/2013 performance
*1 Leasing revenue + gains (losses) of sales of aircraft *2 Net income of SMBC Aviation capital, 66% of which contributed to SMFG consolidate net income *3 As of Dec 31, 2011 (Source: Ascend) *4 Aggregate of SMFL Aircraft Capital Corporation B.V., a subsidiary of Sumitomo Mitsui Finance and Leasing, and Sumisho Aircraft Asset Management B.V., a subsidiary of Sumitomo Corporation
Ranking after acquisition*3
Capitalize on buying power as the third largest lessorin the industryRefinanced approx. USD 3 bn of existing debt by loan from the Japan Bank for International Cooperation to reduce interest expensesControl profit volatility through a “Buy and sell”business model
Business model
Leasing Company Nationality No. of Aircraft
1 GECAS U.S. 1,755
2 ILFC U.S. 1,031
former RBS AC + SMFG/SC Group*4 335
3 BBAM U.S. 327
4 AerCap Netherlands 326
5 CIT Aerospace U.S. 263
6 former RBS AC Ireland 246
17 SMFG/SC Group*4 Netherlands 89
・・

41
16,995
5,204
15,556
10,352
2012 2031
Growth
Replaced
Current stock
*1 As of Sep. 30, 2012 *2 Airbus Global Market Forecast 2012-2031
SMBC Aviation Capital
(No. of aircraft)
CAGR+3.8%
New aircraft 27,347, USD 3.7 tn equiv.
Breakdown of lessees*1 Estimate of passenger aircraft demand*2
0 1,000 2,000 3,000 4,000 5,000
Africa
CIS
Latin America
Middle East
North America
Europe
Asia-Pacific
Traffic in 2011Traffic growth between 2012 - 2031
+5.4%
CAGR between 2012 - 2031
+4.1%
+3.3%
+7.3%
+5.9%
+5.4%
+5.0%
(RPK bn)
World annualtraffic growth
+4.7%
Estimate of airline traffic by airline domicile*2
32,551
23%
10%
17%
6%
44%
EuropeAsiaAmericasMiddle East / Africa
Pacific
47%
10%
6%
13%
5% 5%6%
8%
IrelandChinaGermanyUnited StatesTurkeyAustraliaRussiaOthers
By country
By region

42
0
500
1,000
1,500
Apr.-Jun. 12 Jul.-Sep. 12 Oct.-Dec. 12
Investment banking businessFixed income business
0
1,000
2,000
3,000
Apr.-Dec. 11 Apr.-Dec. 12
(JPY bn)FY3/2012 Apr.-Dec.
2012
175.0
(141.0)
34.8
18.8
Net operating revenue 228.8
YOY change
+11.2
(5.6)SG&A expenses
+6.0Ordinary profit
+9.7
(185.1)
44.5
19.4Net income*1
SMBC Nikko’s consolidated financial performance League tables (Apr.-Dec. 2012, SMBC Nikko)
Number of referrals from SMBC to SMBC Nikko
*1 of which JPY (4.8) bn resulted from changes in the corporate income tax rate in FY3/2012 *2 Source: SMBC Nikko, based on data from Thomson Reuters. Relating only activities of Japanese corporations*3 Source: SMBC Nikko. Consisting of corporate bonds, FILP agency bonds, municipality bonds, and samurai bonds *4 Source: Thomson Reuters. Relating only activities of Japanese corporations. Excluding real estate deals
Synergies between SMBC and SMBC Nikko SMBC Nikko’s topics
18.2%#7Financial advisor(M&A, transaction volume)*4
9.8%#5JPY denominated bonds(lead manager, underwriting amount)*3
2.4%#5Financial advisor(M&A, No. of deals)*4
16.6%#2Global equity & equity-related (book runner, underwriting amount)*2
Mkt shareRank
Achieved the highest net operating revenue and ordinary profit in 3Q, FY3/2013 on a quarterly basis since joining SMFG groupCommenced Japanese stock brokerage and M&A advisory business in Singapore in Oct. 2012SMBC and SMBC Nikko released an on-line account linkage service called “Bank and Trade” in Oct. 2012Launched testamentary trust agency business in Nov. 2012"Nikko Gravity Americas Fund“, launched in Dec. 2012 with launch value of JPY 200.1 bn, was the first investment trust which exceeded launch value of JPY 200 bn since Oct. 2006
(No. of referrals)
Synergies between SMBC and SMBC Nikko

43
500
600
700
800
Mar.11 Mar.12 Apr. May Jun. Jul. Aug. Sep. Oct. Nov. Dec.
0
10
20
30
40
50
60
70
Apr.10 Jul. Oct. Jan.11 Apr. Jul. Oct. Jan.12 Apr. Jul. Oct.15
20
25
30
35
40
45Loan applications(left axis)New customers(left axis)Approval rate(right axis)
0
10
20
30
40
Jun. Sep. Dec. Mar.
FY2010FY2011FY2012
0
10
20
Jun. Sep. Dec. Mar.
FY2010FY2011FY2012
Consumer loans outstandingin SMBC Consumer Finance*2
Transaction-record disclosure requests andInterest refund claims in SMBC Consumer Finance*2
Loan applications and new customers/approval rate in SMBC Consumer Finance
*1 Implemented an additional provision for the interest refund-related allowance of JPY 240 bn in FY3/2012 to prepare sufficiently for interest refund claims*2 Non-consolidated basis
Jun. Sep. Dec. Mar.
(Thousand) (%)
SMBC Consumer Finance’s consolidated financial performance
(JPY bn) FY3/2012 Apr.-Dec. 2012
140.6
51.0
Net income*1 (169.5) 48.9 +231.1
Consumer loans outstanding 759.3 743.6
636.9
Operating income 196.1
YOY change
(7.1)
Ordinary profit*1 +230.7(155.4)
581.5Loan guarantee
(JPY bn)
Interest refund claimsTransaction-record disclosure requests
(Thousand) (Thousand)
Jun. Sep. Dec. Mar.
SMBC Consumer Finance

44*1 Local currencies converted into JPY *2 Figures before consolidation adjustments. Local currencies converted into JPY. FY3/12 was an irregular 15-months period due to a change in fiscal year-end
Loan guarantee business
314.3 346.4384.0 408.0 415.1
188.0185.9
197.4213.5 221.8
Mar. 10 Mar. 11 Mar. 12 Sep. 12 Dec. 12
Regional financial institutions, etc.SMBC
636.9
502.3532.4
581.5621.6
Overseas business
1,9751,987
1,8661,807
1,725
Mar.10 Mar.11 Mar.12 Sep.12 Dec.12
Loans outstanding (HKD mn)Overseas loans outstandingas of Dec. 12*1 (JPY bn)
Hong Kong 22.05
Thailand 5.29
Shenzhen 3.75
Shenyang 0.51
Financial performance of Promise (Hong Kong)*2
2.54.33.4Net income
4.2
7.4
FY3/11
3.0
5.7
Apr.-Dec. 2012
5.2
8.9
FY3/12(15-month period)
Ordinary Profit
Operating income
(JPY bn)
SMBC Consumer Finance
Loan guarantee outstanding (JPY bn)* Number of companies with guarantee agreements: 186
45
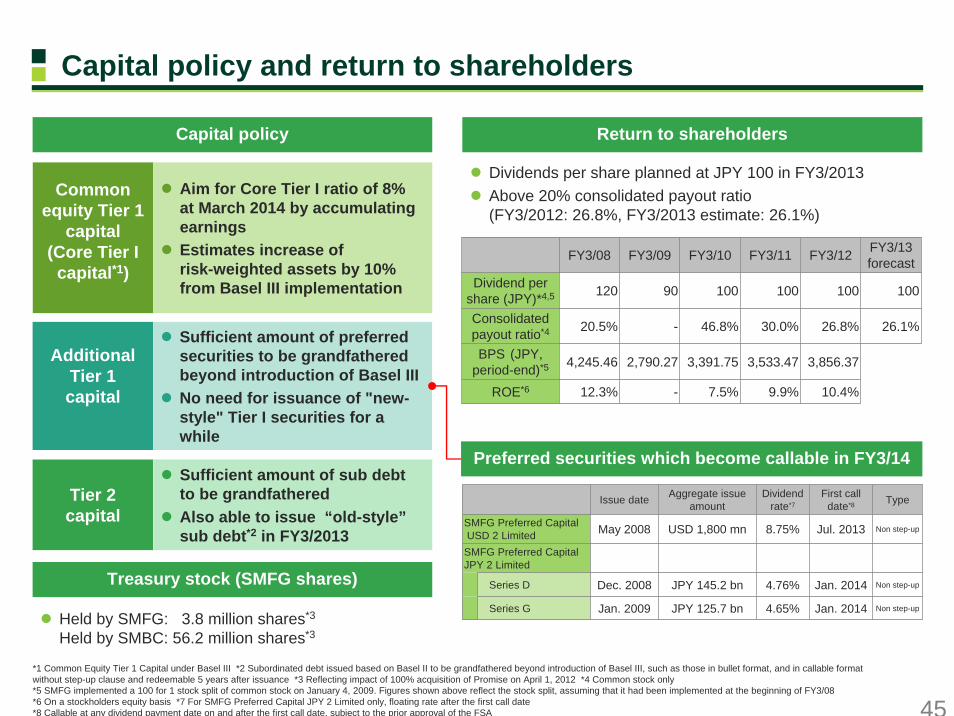
Capital policy and return to shareholders
Capital policy Return to shareholders
Treasury stock (SMFG shares)
Tier 2capital
AdditionalTier 1capital
Common equity Tier 1
capital(Core Tier I
capital*1)
Aim for Core Tier I ratio of 8% at March 2014 by accumulating earningsEstimates increase of risk-weighted assets by 10% from Basel III implementation
Sufficient amount of preferred securities to be grandfathered beyond introduction of Basel IIINo need for issuance of "new-style" Tier I securities for a while
Sufficient amount of sub debt to be grandfathered Also able to issue “old-style”sub debt*2 in FY3/2013
Dividends per share planned at JPY 100 in FY3/2013Above 20% consolidated payout ratio (FY3/2012: 26.8%, FY3/2013 estimate: 26.1%)
Held by SMFG: 03.8 million shares*3
Held by SMBC: 56.2 million shares*3
FY3/08 FY3/09 FY3/10 FY3/11 FY3/12
120
20.5%
4,245.46
100
12.3%
100
Consolidated payout ratio*4 - 46.8% 30.0% 26.8% 26.1%
BPS (JPY, period-end)*5 2,790.27 3,391.75 3,533.47 3,856.37
10.4%9.9%
Dividend pershare (JPY)*4,5 90 100 100
7.5%-
FY3/13forecast
ROE*6
Issue date Aggregate issue amount
Dividend rate*7
First call date*8
8.75% Jul. 2013
SMFG Preferred Capital JPY 2 Limited
Series D Dec. 2008 JPY 145.2 bn 4.76% Jan. 2014 Non step-up
Series G Jan. 20144.65%
SMFG Preferred CapitalUSD 2 Limited May 2008 USD 1,800 mn Non step-up
JPY 125.7 bnJan. 2009
Type
Non step-up
Preferred securities which become callable in FY3/14
*1 Common Equity Tier 1 Capital under Basel III *2 Subordinated debt issued based on Basel II to be grandfathered beyond introduction of Basel III, such as those in bullet format, and in callable format without step-up clause and redeemable 5 years after issuance *3 Reflecting impact of 100% acquisition of Promise on April 1, 2012 *4 Common stock only *5 SMFG implemented a 100 for 1 stock split of common stock on January 4, 2009. Figures shown above reflect the stock split, assuming that it had been implemented at the beginning of FY3/08*6 On a stockholders equity basis *7 For SMFG Preferred Capital JPY 2 Limited only, floating rate after the first call date *8 Callable at any dividend payment date on and after the first call date, subject to the prior approval of the FSA
46
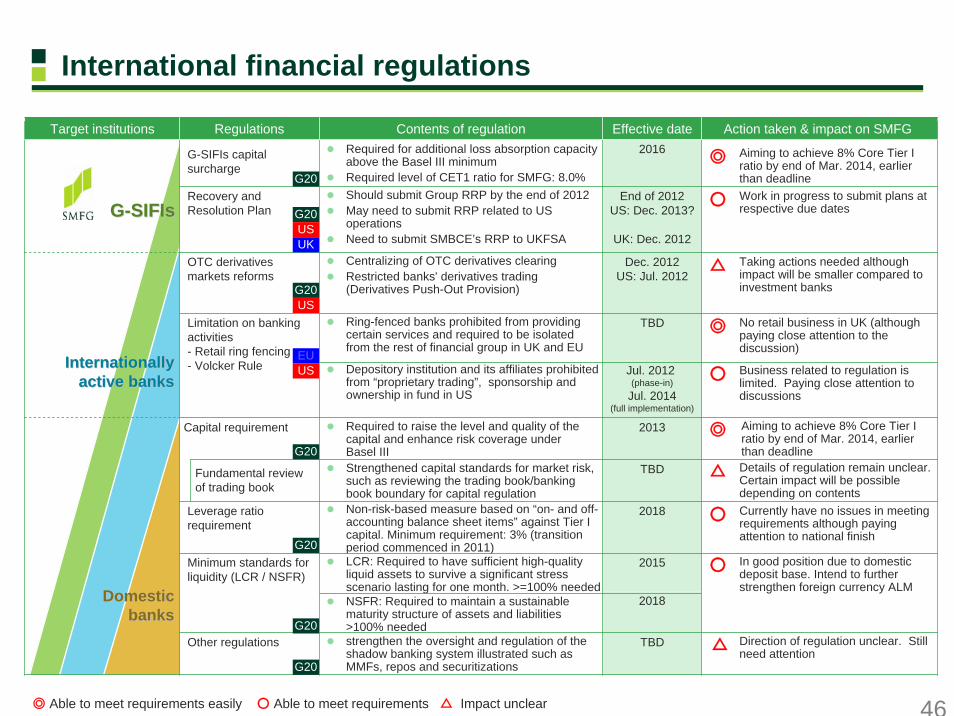
IInternationallynternationallyactive banksactive banks
DomesticDomesticbanksbanks
GG--SISIFIFIss
International financial regulations
2018NSFR: Required to maintain a sustainable maturity structure of assets and liabilities>100% needed
Details of regulation remain unclear. Certain impact will be possible depending on contents
△TBDStrengthened capital standards for market risk, such as reviewing the trading book/banking book boundary for capital regulation
Business related to regulation is limited. Paying close attention to discussions
○Jul. 2012 (phase-in)
Jul. 2014(full implementation)
Depository institution and its affiliates prohibited from “proprietary trading”, sponsorship and ownership in fund in US
Action taken & impact on SMFG Effective dateContents of regulationRegulationsTarget institutions
TBD
2015
2018
2013
TBD
Dec. 2012US: Jul. 2012
End of 2012US: Dec. 2013?
UK: Dec. 2012
2016
Direction of regulation unclear. Still need attention
strengthen the oversight and regulation of the shadow banking system illustrated such as MMFs, repos and securitizations
Other regulations
In good position due to domestic deposit base. Intend to further strengthen foreign currency ALM
○LCR: Required to have sufficient high-quality liquid assets to survive a significant stress scenario lasting for one month. >=100% needed
Minimum standards for liquidity (LCR / NSFR)
Currently have no issues in meeting requirements although paying attention to national finish
○Non-risk-based measure based on “on- and off-accounting balance sheet items” against Tier I capital. Minimum requirement: 3% (transition period commenced in 2011)
Leverage ratio requirement
No retail business in UK (although paying close attention to the discussion)
◎Ring-fenced banks prohibited from providing certain services and required to be isolated from the rest of financial group in UK and EU
Limitation on banking activities- Retail ring fencing- Volcker Rule
Taking actions needed although impact will be smaller compared to investment banks
△Centralizing of OTC derivatives clearingRestricted banks' derivatives trading(Derivatives Push-Out Provision)
OTC derivatives markets reforms
Work in progress to submit plans at respective due dates○Should submit Group RRP by the end of 2012
May need to submit RRP related to US operationsNeed to submit SMBCE’s RRP to UKFSA
Recovery and Resolution Plan
Aiming to achieve 8% Core Tier I ratio by end of Mar. 2014, earlier than deadline
◎Required to raise the level and quality of the capital and enhance risk coverage under Basel III
Capital requirement
◎Required for additional loss absorption capacity above the Basel III minimumRequired level of CET1 ratio for SMFG: 8.0%
G-SIFIs capital surcharge
G20
UKUS
G20
G20
G20US
G20
USEU
G20
G20
◎ Able to meet requirements easily ○ Able to meet requirements △ Impact unclear
Aiming to achieve 8% Core Tier I ratio by end of Mar. 2014, earlier than deadline
△
Fundamental review of trading book

47
- 20% 40% 60% 80% 100% 100% 100% 100% 100%
90% 80% 70% 60% 50% 40% 30% 20% 10% -
*1 Drafts of other rules that are to be implemented after 2014, such as rules on capital buffers and liquidity standards, will be published at a later stage*2 With an empty bucket of 3.5% to discourage further systemicness*3 Including amounts exceeding the limit for deferred tax assets, mortgage servicing rights and investment in capital instruments of unconsolidated financial institutions
Summary of regulatory capital framework
4.0% 4.5% 4.5% 4.5% 4.5% 4.5% 4.5% 4.5% 4.5%
1.5%1.5%
1.5%1.5%
1.5%1.5% 1.5% 1.5% 1.5%
2.5% 2.0%2.0%
2.0%2.0%
2.0% 2.0% 2.0% 2.0%
3.5%
2.5%2.5%2.5%1.875%0.625% 1.25%
2.5%
1.0%
3.5%
0%
2%
4%
6%
8%
10%
12%
14%
Mar. 12 Mar. 13 Mar. 14 Mar. 15 Mar. 16 Mar. 17 Mar. 18 Mar. 19 Mar. 20 Mar. 21 Mar. 22
Tier IIAdditional Tier ICapital conservation bufferMinimum common equity Tier I ratio
Phase-in of deductions*3
Grandfathering ofcapital instruments
Transition period Fully implementedBasel II
8.625%9.25%
9.875%10.5%
8.0%8.0%8.0% 8.0%
10.5% 10.5% 10.5%
Additional loss absorbency requirement for G-SIFIs
Bucket 4 (2.5%) *2
Bucket 1 (1.0%)
In March 2012, the Japanese FSA amended requirements regarding bank capital*1• Basically consistent with Basel III text• Effective from the end of March 2013 to conform with the fiscal year end of Japanese banks

48
Apr. 2001 Jul. 2007 Jan. 2013Aaa Bank of America Royal Bank of Scotland
Bank of New York Mellon UBSCitibank Wells Fargo Bank
JPMorgan Chase BankAa1 Bank of America Wells Fargo Bank Banco Santander Deutsche Bank Bank of New York Mellon
Crédit Agricole UBS Barclays Bank HSBC BankBBVA ING Bank
BNP Paribas Nordea BankCrédit Agricole Société GénéraleCredit Suisse State Street Bank & Trust
Aa2 Bank of New York Mellon ING Bank SMBC Mizuho CB/BK State Street Bank & TrustBarclays Bank JPMorgan Chase Bank BPCE(Banque Populaire) UniCredit
BBVA Royal Bank of Scotland BTMUCitibank State Street Bank & Trust
HSBC BankAa3 Banco Santander Deutsche Bank Goldman Sachs Bank Morgan Stanley Bank SMBC JPMorgan Chase Bank
BNP Paribas Société Générale BTMU Nordea BankBPCE(Banque Populaire) UniCredit HSBC Bank Wells Fargo Bank
A1 Credit Suisse Bank of China Bank of China Mizuho CB/BKCredit Suisse Standard Chartered
A2 BTMU Standard Chartered Standard Chartered Barclays Bank Goldman Sachs BankBNP Paribas ING Bank
BPCE(Banque Populaire) Société GénéraleCrédit Agricole UBSDeutsche Bank
A3 SMBC Mizuho CB/BK Bank of America Morgan Stanley BankCitibank Royal Bank of Scotland
Baa1 Bank of ChinaBaa2 Banco Santander
UniCreditBaa3 BBVA
Credit ratings of G-SIBs (Moody’s)*
* Long-term issuer ratings (if not available, long-term deposit ratings) of operating banks
49
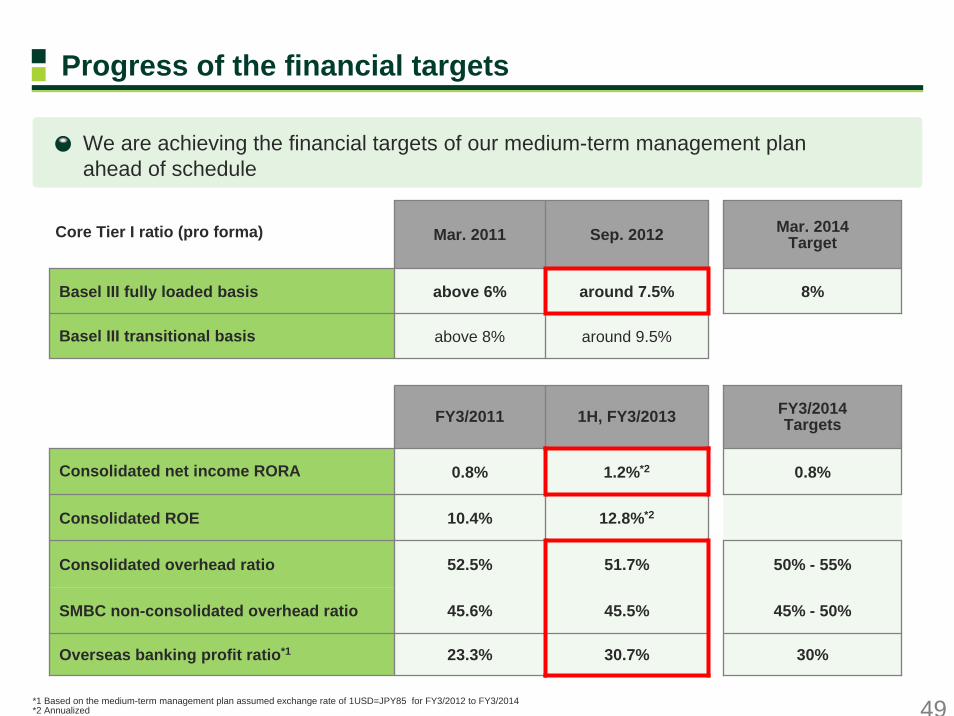
We are achieving the financial targets of our medium-term management plan ahead of schedule
Progress of the financial targets
Core Tier I ratio (pro forma) Mar. 2011 Sep. 2012 Mar. 2014Target
Basel III fully loaded basis
Basel III transitional basis above 8% around 9.5%
Consolidated ROE 10.4% 12.8%*2
FY3/2011 1H, FY3/2013 FY3/2014Targets
Consolidated net income RORA
Consolidated overhead ratio
SMBC non-consolidated overhead ratio
Overseas banking profit ratio*1
8%around 7.5%above 6%
0.8% 0.8%
52.5%
45.6%
1.2%*2
23.3%
51.7%
45.5%
30.7%
50% - 55%
45% - 50%
30%
*1 Based on the medium-term management plan assumed exchange rate of 1USD=JPY85 for FY3/2012 to FY3/2014*2 Annualized
This document contains “forward-looking statements” (as defined in the U.S. Private Securities Litigation Reform Act of 1995), regarding the intent, belief or current expectations of us and our managements with respect to our future financial condition and results of operations. In many cases but not all, these statements contain words such as “anticipate,” “believe,” “estimate,” “expect,”“intend,” “may,” “plan,” “probability,” “risk,” “project,” “should,” “seek,” “target,” “will” and similar expressions. Such forward-looking statements are not guarantees of future performance and involve risks and uncertainties, and actual results may differ from those expressed in or implied by such forward-looking statements contained or deemed to be contained herein. The risks and uncertainties which may affect future performance include: deterioration of Japanese and global economic conditions and financial markets; declines in the value of our securities portfolio; our ability to successfully implement our business strategy through our subsidiaries, affiliates and alliance partners; exposure to new risks as we expand the scope of our business; and incurrence of significant credit-related costs. Given these and other risks and uncertainties, you should not place undue reliance on forward-looking statements, which speak only as of the date of this document. We undertake no obligation to update or revise any forward-looking statements.Please refer to our most recent disclosure documents such as our annual report or registration statement on Form 20-F and other documents submitted to the U.S. Securities and Exchange Commission, as well as our earnings press releases, for a more detailed description of the risks and uncertainties that may affect our financial conditions and our operating results, and investors’ decisions.


![SUMITOMO MITSUI BANKING CORPORATION MALAYSIA ......31 MARCH 2020 FINANCIAL STATEMENTS SUMITOMO MITSUI BANKING CORPORATION MALAYSIA BERHAD [Company No. 201001042446 (926374-U)] (Incorporated](https://static.fdocuments.net/doc/165x107/60dc8190ad5aee65ae3ea9a7/sumitomo-mitsui-banking-corporation-malaysia-31-march-2020-financial-statements.jpg)