Investor Presentation SGX-REITAS Webinar/media/MIT/Investor Relations... · SGX-REITAS Webinar 9...
33
Investor Presentation SGX-REITAS Webinar 9 February 2018
Transcript of Investor Presentation SGX-REITAS Webinar/media/MIT/Investor Relations... · SGX-REITAS Webinar 9...

Investor Presentation
SGX-REITAS Webinar
9 February 2018

2
Important Notice
This presentation shall be read in conjunction with Mapletree Industrial Trust’s (“MIT”) financial results for Third Quarter
Financial Year 2017/2018 in the SGXNET announcement dated 23 January 2018.
This presentation is for information only and does not constitute an offer or solicitation of an offer to sell or invitation to
subscribe for or acquire any units in Mapletree Industrial Trust (“Units”).
The past performance of the Units and MIT is not indicative of the future performance of MIT or Mapletree Industrial Trust
Management Ltd. (the “Manager”).
The value of Units and the income from them may rise or fall. Units are not obligations of, deposits in or guaranteed by the
Manager or any of its affiliates. An investment in Units is subject to investment risks, including the possible loss of the
principal amount invested. Investors have no right to request the Manager to redeem their Units while the Units are listed. It is
intended that unitholders may only deal in their Units through trading on the Singapore Exchange Securities Trading Limited
(“SGX-ST”). Listing of the Units on the SGX-ST does not guarantee a liquid market for the Units.
This presentation may also contain forward-looking statements that involve risks and uncertainties. Actual future
performance, outcomes and results may differ materially from those expressed in forward-looking statements as a result of
risks, uncertainties and assumptions. Representative examples of these factors include general industry and economic
conditions, interest rate trends, cost of capital, occupancy rate, construction and development risks, changes in operating
expenses (including employees wages, benefits and training costs), governmental and public policy changes and the
continued availability of financing. You are cautioned not to place undue reliance on these forward-looking statements, which
are based on current view of management on future events.
Nothing in this presentation should be construed as financial, investment, business, legal or tax advice and you should
consult your own independent professional advisors.

3
Contents
1 Overview of Mapletree Industrial Trust
2 Portfolio Highlights
3 Capital Management
4 Outlook and Strategy

Flatted Factory, Kolam Ayer 1
OVERVIEW OF
MAPLETREE INDUSTRIAL TRUST

5
Overview of Mapletree Industrial Trust
Flatted Factories
37.0%
Hi-Tech Buildings
37.0%
US Data Centres2
9.8%
Business Park
Buildings 13.4%
Stack-up/ Ramp-up Buildings
10.8%
Light Industrial Buildings
1.8%
S$4.2 billion
Portfolio Value
Public & Inst
Unitholders MIPL
Manager
Property
Manager
32.8% 67.2%
MIT Portfolio
Trustee
Sponsor
Mapletree Investments Pte Ltd (“MIPL”)
Owns 32.8% of MIT
Investment
mandate
Focused on (i) industrial real estate
assets in Singapore, excluding
properties primarily used for logistics
purposes and (ii) data centres
worldwide beyond Singapore
Portfolio 99 properties valued at S$4.2 billion
17.7 million1 sq ft NLA
Manager
Mapletree Industrial Trust Management Ltd.
100% owned by the Sponsor
Property
Manager
Mapletree Facilities Services Pte. Ltd.
100% owned by the Sponsor
Trustee DBS Trustee Limited
1 Excluded the parking decks (150 Carnegie Way and 171 Carnegie Way) at 180
Peachtree. 2 Relates to MIT’s 40.0% interest of the joint venture with MIPL in a portfolio of 14
data centres in the United States of America (“US”).
Portfolio value by geography (as at 31 Dec 2017)
Singapore 90.2%
US 9.8%

6
22.3
28.3 29.0 31.6
35.2 35.8 36.9 37.5 37.7 38.9
40.2 41.1 42.2 42.6 42.8 45.4 46.0 46.7
48.2 48.9 50.3 50.4 51.5 50.6 51.1 51.8 52.9 54.0 53.5
1.52
1.93 1.98 2.05
2.16 2.22 2.26 2.29 2.32 2.37
2.43 2.47 2.51 2.51 2.51 2.60
2.67 2.65 2.73
2.79 2.82 2.81 2.85 2.83 2.83 2.88 2.92 3.00
2.88
0.00
0.40
0.80
1.20
1.60
2.00
2.40
2.80
3.20
0
10
20
30
40
50
60
70
3Q¹ 4Q 1Q 2Q 3Q 4Q 1Q 2Q 3Q 4Q 1Q 2Q 3Q 4Q 1Q 2Q 3Q 4Q 1Q 2Q 3Q 4Q 1Q 2Q 3Q 4Q 1Q 2Q 3Q
FY10/11 FY11/12 FY12/13 FY13/14 FY14/15 FY15/16 FY16/17 FY17/18
DPU (cents)
Distributable Income (S$ million)
Distributable Income (S$ million) DPU (cents)
Sustainable and Growing Returns
1 MIT was listed on 21 Oct 2010.

7
¹ Rebased MIT’s issue price of S$0.93 and opening unit prices of FTSE ST REITs Index and FTSE Straits Times Index on
21 Oct 2010 to 100. Source: Bloomberg.
² Based on MIT’s closing unit price of S$1.960 on 8 Feb 2018.
³ MIT’s distribution yield is based on DPU of S$0.728 over the issue price of S$0.93.
⁴ Sum of distributions and capital appreciation for the period over the issue price of S$0.93.
.
Healthy Returns since IPO
COMPARATIVE TRADING PERFORMANCE SINCE IPO¹
MIT’s Return on
Investment
Capital
Appreciation
Distribution
Yield
Total
Return
Listing on 21 Oct 2010 to 8 Feb 2018 110.8%² 78.2%³ 189.0%4

8
99 Properties Across 5 Property Segments
FLATTED FACTORIES
High-rise multi-tenanted industrial buildings
with basic common facilities used for light
manufacturing activities.
HI-TECH BUILDINGS
High specification industrial buildings with
higher office content for tenants in technology
and knowledge-intensive sectors, including
data centres. Usually fitted with air-
conditioned lift lobbies and common areas.
BUSINESS PARK BUILDINGS
High-rise multi-tenanted buildings in specially
designated “Business Park zones”. Serve as
regional headquarters for MNCs as well as
spaces for R&D and knowledge-intensive
enterprises.
STACK-UP/RAMP-UP
BUILDINGS
Stacked-up factory space with vehicular
access to upper floors. Multi-tenanted space
suitable for manufacturing and assembly
activities.
LIGHT INDUSTRIAL
BUILDINGS
Multi-storey developments usually
occupied by an anchor tenant for light
manufacturing activities.

9
85 Properties in Singapore
Flatted Factories
Hi-Tech Buildings
Business Park Buildings
Stack-up/Ramp-up Buildings
Light Industrial Buildings2
1 Refers to the Singapore Portfolio’s weighted average lease to expiry (“WALE”) by gross rental income (“GRI”) as at 31 Dec 2017. 2 65 Tech Park Crescent was divested on 20 Jul 2017. 3 As at 31 Dec 2017.
Total
NLA
15.4m sq ft
Occupancy
Rate3
90.1%
Weighted Average Unexpired
Lease Term of Underlying Land3
38.6 years
WALE
(By GRI)1
3.7 years

10
10
Wisconsin
N15W24250 Riverwood Drive,
Pewaukee
Michigan
19675 W Ten Mile Road , Southfield
New Jersey
2 Christie Heights, Leonia
Pennsylvania
2000 Kubach Road, Philadelphia
North Carolina
1805 Center Park Drive, Charlotte
5150 McCrimmon Parkway,
Morrisville
Tennessee
402 Franklin Road, Brentwood
Georgia
180 Peachtree, Atlanta
1001 Windward Concourse,
Alpharetta
2775 Northwoods Parkway, Atlanta
Texas
1221 Coit Road, Plano
3300 Essex Drive, Richardson
5000 Bowen, Arlington
California
7337 Trade Street, San Diego
2
9
8
7
6
5
4
3
1
14 Data Centres across 9 States in US1
Total
NLA2
2.3m sq ft
Occupancy
Rate5
97.4%
Weighted Average Unexpired
Lease Term of Underlying Land
Freehold4
WALE
(By GRI)3
6.3 years
1 Acquired through a 40:60 joint venture with MIPL. 2 Excluded the parking decks (150 Carnegie Way and 171 Carnegie Way) at 180 Peachtree. 3 Refer to the US Portfolio’s WALE by GRI as at 31 Dec 2017. 4 All properties are sited on freehold land, except for the parking deck (150 Carnegie Way) at 180 Peachtree. As at 31 Dec 2017, the parking deck has a remaining land lease
tenure of approximately 38 years, with an option to renew for an additional 40 years. 5 As at 31 Dec 2017.
Texas
North Carolina California
1
Wisconsin
2
Michigan
3
New Jersey
4
Pennsylvania
5 6 7
Tennessee
9
Georgia
8 14
10 12 13
11
13
14
11
12

11
FY10/11 FY11/12 FY12/13 FY13/14 FY14/15 FY15/16 FY16/17 FY17/18
Jul 2011 Acquired
Flatted
Factories
from JTC
S$400 million
Portfolio Growth since IPO
S$2.201
billion
FY10/11
S$2.70
billion FY11/12
S$2.88
billion FY12/13
S$3.17
billion FY13/14
S$3.42
billion
FY14/15
S$3.56
billion FY15/16
May 2014 Acquired Light
Industrial
Building at
Changi North
S$14 million
Jan 2015 Completed
BTS data
centre for
Equinix
S$108 million
Oct 2015 Announced
new AEI at
Kallang
Basin 4
S$77 million
Jul 2013 Completed
AEI at
Woodlands
Central
S$30 million
Oct 2013 Completed
BTS project for
Kulicke & Soffa
S$50 million
Jan 2014 Completed
AEI at Toa
Payoh North 1
S$40 million
1 Valuation of investment properties on 31 Mar at end of each financial year. 2 Acquired through a 40:60 joint venture with MIPL.
Mar 2017 Secured
new BTS
data centre
S$76 million
3 Acquisitions
3 Asset Enhancement
Initiatives (“AEI”)
4 Build-to-Suit (“BTS”)
Projects
Jun 2017 Completed
BTS
project for HP
S$226 million
FY16/17
S$3.75
billion FY17/18
Dec 2017 Acquired 14
data centres
in US²
US$750
million

PORTFOLIO
HIGHLIGHTS
Hi-Tech Buildings, build-to-suit project for HP Singapore Private Limited (“HP”)

13
Portfolio Overview
Singapore Portfolio US Portfolio Overall
Number of properties 85 14 99
NLA (million sq ft) 15.4 2.3 17.7
Average passing rental
rate ($ psf/mth) S$1.97 US$1.99
90.4% 90.4% 90.1% 97.4%
90.5%
Singapore US Overall
Left Bar(2QFY17/18)
Right Bar(3QFY17/18)
1 Excluded the parking decks (150
Carnegie Way and 171 Carnegie
Way) at 180 Peachtree. 2 Based on MIT’s 40.0% interest of
the joint venture with MIPL in a
portfolio of 14 data centres in US
through Mapletree Redwood Data
Centre Trust (“MRDCT”).
1 1
2
14
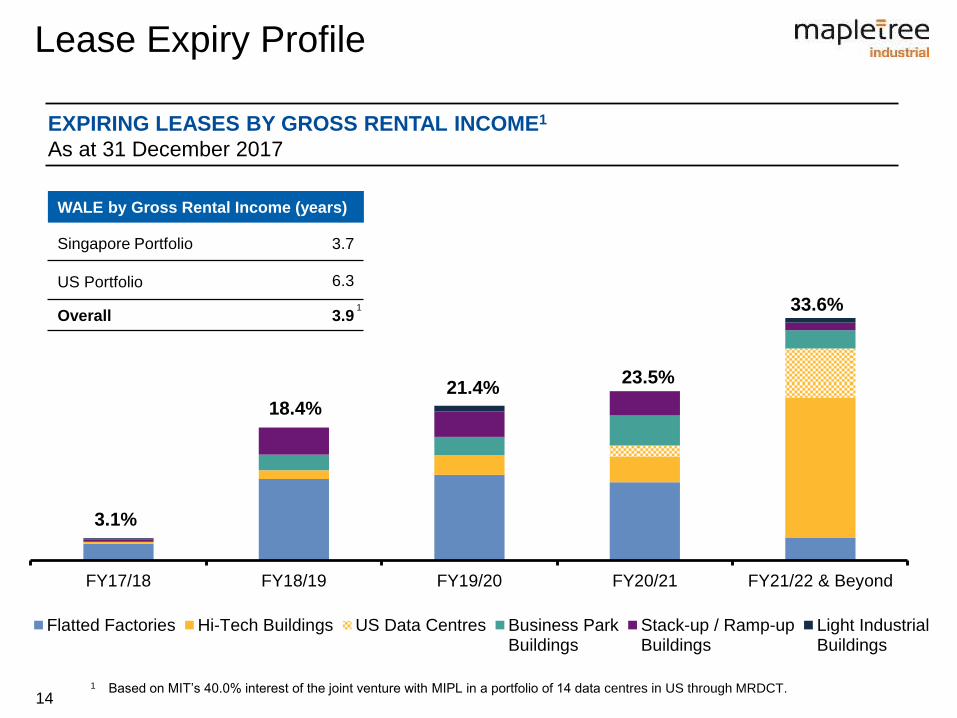
FY17/18 FY18/19 FY19/20 FY20/21 FY21/22 & Beyond
Flatted Factories Hi-Tech Buildings US Data Centres Business ParkBuildings
Stack-up / Ramp-upBuildings
Light IndustrialBuildings
18.4% 21.4%
23.5%
33.6%
Lease Expiry Profile
EXPIRING LEASES BY GROSS RENTAL INCOME1
As at 31 December 2017
3.1%
WALE by Gross Rental Income (years)
Singapore Portfolio 3.7
US Portfolio 6.3
Overall 3.9
1 Based on MIT’s 40.0% interest of the joint venture with MIPL in a portfolio of 14 data centres in US through MRDCT.
1

15
9.9%
3.4% 2.9% 2.8%
1.3% 1.3% 1.2% 1.2% 1.1% 0.9%
Large and Diversified Tenant Base
TOP 10 TENANTS BY GROSS RENTAL INCOME1
As at 31 December 2017
Over 2,000 tenants
Largest tenant contributes about 9.9% of Overall Portfolio’s Gross Rental Income
Top 10 tenants forms 26.0% of Overall Portfolio’s Gross Rental Income
1 Based on MIT’s 40.0% interest of the joint venture with MIPL in a portfolio of 14 data centres in US through MRDCT.

16
Tenant Diversification Across Trade Sectors
By Gross Rental Income
As at 31 Dec 2017
No single trade sector accounted >23% of Overall Portfolio’s Gross Rental Income1
1 Based on MIT’s 40.0% interest of the joint venture with MIPL in a portfolio of 14 data centres in US through MRDCT.

17
Portfolio Stability from Long Leases
REMAINING YEARS TO EXPIRY ON UNDERLYING LAND LEASES1 (BY LAND AREA)
As at 31 December 2017
1 Excludes the options to renew and based on MIT’s 40.0% interest of the joint venture with MIPL in a portfolio of 14 data centres in US through MRDCT. 2 Excludes freehold land.
4.5%
21.5%
7.4%
0.7%
41.5%
24.4%
0 to 20 years >20 to 30 years >30 to 40 years >40 to 50 years More than 50years
Freehold
WALE of Underlying Leasehold Land = 38.6 years2
24.4% of Portfolio (By Land Area) is on Freehold Land

18
92.3% 93.2% 94.3% 94.5% 95.1% 95.0% 94.9% 95.0% 95.2% 95.4% 95.5%
93.9% 92.5%
91.3% 90.7% 91.5% 90.8% 90.2%
93.5% 93.8% 94.7% 94.6% 93.0% 92.5% 92.1%
93.1% 92.6% 90.4% 90.1%
$1.45 $1.49
$1.52 $1.54 $1.53
$1.55 $1.56 $1.59 $1.61
$1.68 $1.71 $1.70
$1.73 $1.75 $1.77 $1.82 $1.83 $1.84
$1.86 $1.88 $1.89 $1.90 $1.92 $1.92 $1.93 $1.94 $1.95 $1.94 $1.97
$0.50
$1.00
$1.50
$2.00
$2.50
0%
10%
20%
30%
40%
50%
60%
70%
80%
90%
100%
3Q 4Q 1Q 2Q 3Q 4Q 1Q 2Q 3Q 4Q 1Q 2Q 3Q 4Q 1Q 2Q 3Q 4Q 1Q 2Q 3Q 4Q 1Q 2Q 3Q 4Q 1Q 2Q 3Q
FY10/11 FY11/12 FY12/13 FY13/14 FY14/15 FY15/16 FY16/17 FY17/18
Occupancy (LHS) Rental Rate (RHS)
Singapore Portfolio Performance
Occupancy Gross Rental Rate
S$ psf/mth

19
Segmental Occupancy Levels (Singapore)
90.5% 87.5% 89.4%
92.9% 96.0%
90.4% 88.7%
95.4%
76.6%
92.7% 97.1%
90.1%
Flatted Factories Hi-Tech Buildings Business ParkBuildings
Stack-Up/Ramp-UpBuildings
Light IndustrialBuildings
SingaporePortfolio
Left Bar(2QFY17/18)
Right Bar(3QFY17/18)

20
Rental Revisions (Singapore)
Gross Rental Rate (S$ psf/mth)1, 2
For period 3QFY17/18
1 Gross Rental Rate figures exclude short term leases; except Passing Rent figures which include all leases. 2 Excluded rental rate for the sole new lease at Stack-Up/Ramp-Up Buildings and information on the sole new lease at Light Industrial
Buildings for confidentiality.
Renewal
Leases
117 Leases
(311,528 sq ft)
20 Leases
(65,716 sq ft)
13 Leases
(50,980 sq ft)
10 Leases
(198,004 sq ft)
New Leases 48 Leases
(97,984 sq ft)
14 Leases
(42,303 sq ft)
3 Leases
(23,003 sq ft)
1 Lease
(52,539 sq ft)
$1.88
$2.25
$3.61
$1.21
$1.85 $2.24
$3.64
$1.19
$1.76
$2.54
$3.74
Flatted Factories Hi-Tech Buildings Business Park Buildings Stack-Up/Ramp-UpBuildings
Before Renewal
After Renewal
New Leases
Passing Rent

21
Tenant Retention (Singapore)
LONG STAYING TENANTS RETENTION RATE FOR 3QFY17/18
Up to 1 yr 8.3%
>1 to 2 yrs 8.8%
> 2 to 3 yrs 8.7%
>3 to 4 yrs 7.1%
>4 to 5 yrs 8.8%
>5 to 10 yrs 34.0%
>10 yrs 24.3%
4 yrs or less
32.9% More than 4 yrs 67.1%
Based on NLA. As at 31 Dec 2017
By number of tenants.
67.1% of the tenants have leased the properties for more than 4 years
Tenant retention rate of 73.3% in 3QFY17/18
72.5%
89.4%
78.8%
69.8%
100.0%
73.3%
FlattedFactories
Hi-TechBuildings
BusinessPark
Buildings
Stack-Up /Ramp-UpBuildings
LightIndustrialBuildings
SingaporePortfolio

22
Development of 14-storey Hi-Tech Building (at existing car park) and
improvement works at existing buildings
Located at Kallang iPark, an upcoming industrial hub for high value and
knowledge-based businesses
Good leasing enquiries pre-completion
Final inspection works in progress
AEI – 30A Kallang Place and Kallang Basin 4 Cluster
Estimated Cost
S$77 million
Additional GFA
336,000 sq ft
Completion
1Q2018 Final inspection works in progress

23
Development of a six-storey BTS data centre
100% committed by an established data centre operator
Initial lease term of >10 years with staggered rental escalations and renewal options
Situated on land area of about 96,800 sq ft
Site allocated by JTC with zoning for Business 2 use and land tenure of 30 years
Located in a specialised industrial park for data centres with ready-built
infrastructure
Completed construction of fourth storey structure slab and commenced installation
of external facade
BTS Project – New Data Centre
Estimated Cost
S$76 million
GFA
242,000 sq ft
Completion
2H2018 Artist’s impression of the BTS data centre in the West Region of Singapore

24
Leading real estate development, investment and
capital management company
Owns and manages S$39.5 billion¹ of office,
retail, logistics, industrial, residential, corporate
lodging / serviced apartment, and student
housing properties
Manages 4 Singapore-listed real estate
investment trusts and 6 private equity real estate
funds with assets in Asia Pacific, UK and US
Assets across 12 economies globally, with offices
in Asia Pacific, UK and US¹
BENEFITS TO MIT REPUTABLE SPONSOR
Committed Sponsor with Aligned Interest
1. Leverage on Sponsor’s network
Leverage on Mapletree’s financial
strength, market reach and network
2. Alignment of Sponsor’s interest with
Unitholders
Mapletree’s stake of 32.8% demonstrates
support in MIT
3. In-house development capabilities
Able to support growth of MIT by
providing development capabilities
4. Right of first refusal to MIT
Sponsor has granted right of first refusal
to MIT over future sale or acquisition of
(i) industrial or business park properties in
Singapore² and (ii) 60% interest in the
portfolio of 14 data centres in US
Sponsor won the government tender for a
126,700 sq ft industrial site located next
to Tai Seng MRT Station (18 Tai Seng)
¹ As at 31 Mar 2017.
² Excluding Mapletree Business City.

CAPITAL
MANAGEMENT
Business Park Buildings, The Strategy and The Synergy

26
3QFY17/18
Weighted average all-in funding
cost 2.9%
Interest coverage ratio 7.2 times
Strong Balance Sheet
31 Dec 2017
Total assets S$4,289.1 million
Total debt S$1,449.1 million
Aggregate leverage ratio 33.8%
Weighted average tenor of debt 3.0 years
Fixed as a % of total debt 60.7%
Weighted average hedge tenor 3.2 years
Strong balance sheet to pursue
growth opportunities
‘BBB+’ rating with Stable
Outlook by Fitch Ratings
100% of loans unsecured with
minimal covenants
No hedges are due to expire in
4QFY17/18

27
157.9
60.0
339.4
176.5
100.0
210.3 125.0
45.0
175.0
60.0
FY17/18 FY18/19 FY19/20 FY20/21 FY21/22 FY22/23 FY23/24 FY24/25 FY25/26
Bank Borrowings MTN
10.9%
12.8%
23.4%
12.2%
17.6%
6.9%
12.1%
4.1%
* Amounts in S$ million
DEBT MATURITY PROFILE
As at 31 December 2017
Well Diversified Debt Maturity Profile
Weighted Average Tenor of Debt = 3.0 years

OUTLOOK AND
STRATEGY
Stack-up/Ramp-up Buildings, Woodlands Spectrum

29
Total stock for factory space: 37.8 million sq m
Potential net new supply of 1.3 million sq m in 2018, of which
• Multi-user factory space accounts for 0.4 million sq m
• Business park space accounts for 0.086 million sq m
• Moderation in quantum of industrial land released through Industrial Government Land Sales
Programme since 2013
Median rents for industrial real estate for 4Q2017
• Multi-user Factory Space: S$1.80 psf/mth (0.6% q-o-q)
• Business Park Space: S$4.09 psf/mth (3.5% q-o-q)
Singapore Industrial Property Market
Source: URA/JTC Realis, 25 Jan 2018
DEMAND AND SUPPLY FOR MULTI-USER FACTORIES DEMAND AND SUPPLY FOR BUSINESS PARKS

30
Singapore
Singapore economy grew by 3.1% y-o-y in the quarter ended 31 Dec 2017, easing from
5.4% growth in preceding quarter¹
Geopolitical risks and policy uncertainty could negatively affect improvement in business
environment. Continued supply of competing industrial space is expected to exert
pressure on both occupancy and rental rates.
The Manager will continue to focus on tenant retention to maintain a stable portfolio
occupancy
US
Economic expansion in US is projected to continue in 2018, with continued support from
private consumption and investment2
According to 451 Research, the supply for US multi-tenant data centres (in net operational
square feet) will grow by 9.0% while the demand will grow by 10.1% in 20183. This will
underpin the stability of revenue contribution from the US portfolio.
Outlook
1 Ministry of Trade and Industry (Advance Estimates), 2 Jan 2018 2 OECD (2017), “General assessment of the macroeconomic situation”, in OECD Economic Outlook, Volume 2017 Issue 2 3 Source: 451 Research, LLC, Dec 2017.

31
Continued Focus on Hi-Tech Buildings
Redevelopment
Completed MIT’s first redevelopment
project of a Flatted Factory Cluster into a
purpose-built facility for HP
100% committed by HP for lease term of
10.5 + 5 + 5 years1 with annual rental
escalations
Estimated Cost: S$226 million2
GFA: 824,500 sq ft
Completion
Phase One: TOP on 21 Oct 2016
Phase Two: TOP on 22 Jun 2017
Completion of a 11-storey Hi-Tech Building (Phase One) and
a 8-storey Hi-Tech Building (Phase Two)
Acquisition
Completed first overseas acquisition of 14
data centres in US via a 40:60 joint venture
with MIPL on 20 Dec 2017
Primarily core-and-shell data centres on
triple net leases with annual rental
escalations
Purchase Consideration: US$750 million
NLA: 2.3 million sq ft
Completion: 20 Dec 2017
40:60 joint venture with the Sponsor to acquire 14 data centres in US
1 Rents are on a gross basis. MIT is responsible for property tax and property operating expenses. 2 Includes book value of S$56 million (as at 31 Mar 2014) prior to commencement of redevelopment.

32
Proactive Asset
Management
Prudent Capital Management
Value-creating
Investment Management
Delivering Sustainable Returns
IMPROVE competitiveness
of properties
Implement proactive
marketing and leasing
initiatives
Deliver quality service
and customised solutions
Improve cost
effectiveness to mitigate
rising operating costs
Unlock value through AEI
OPTIMISE capital structure to
provide financial flexibility
Maintain a strong balance sheet
Diversify sources of funding
Employ appropriate interest rate
management strategies
SECURE investments to
deliver growth and
diversification
Pursue DPU-accretive
acquisitions and
development projects
Secure BTS projects with
pre-commitments from
high-quality tenants
Consider opportunistic
divestments
End of Presentation
For enquiries, please contact Ms Melissa Tan, Vice President, Investor Relations,
DID: (65) 6377 6113, Email: [email protected]